predicted and flight data for an 18 mm piston launcher · predicted and flight data for an 18 mm...
TRANSCRIPT

PREDICTED AND FLIGHT DATA FOR AN 18 MM PISTON LAUNCHER
Research and Development Report
Prepared for: NARCON-2017 Herndon, Virginia February 24-26, 2017
Submitted by: Chris Flanigan NAR 17540 L1 C Division

ABSTRACT
This project had two objectives: 1) measure accelerations during piston phase of flight;
and 2) compare flight results to analysis predictions. The project successfully achieved
both objectives. The following activities were performed:
Reviewed prior R&D reports related to piston launchers
Performed new static testing of Estes C6 motors to provide high resolution
thrust-vs-time curves
Implemented the Piston Launcher Performance Program (originally developed by
Geoff Landis) as an Excel spreadsheet
Developed a test vehicle that included an altimeter/accelerometer to measure the
axial accelerations during flight
Performed flight testing for two mass configurations of the test vehicle launched
using an 18 mm diameter piston launcher
Used the PLPP spreadsheet to calculate responses for the test flight configurations
Compared flight data to the analysis results
The analysis results were very sensitive to the representation of the thrust-time curve
during the piston phase of flight. Using high resolution data from new static testing,
the analysis results for vehicle accelerations and velocities had very good agreement to
flight data. This showed that the piston launcher theory was accurate for size of piston
launcher, motor, and model examined in this project. Future studies could examine
other models and piston sizes.
Prepared by:
________________________
Christopher C. Flanigan
NAR 17540 L1

i
TABLE OF CONTENTS
1 INTRODUCTION ................................................................................................. 1
2 OBJECTIVES AND APPROACH ............................................................................... 2 2.1 Objectives ................................................................................................. 2 2.2 Technical Approach .................................................................................... 2
3 REVIEW OF PRIOR R&D REPORTS ......................................................................... 3
4 THEORY OF PISTON LAUNCHER OPERATION .......................................................... 5 4.1 Piston Launcher Overview ........................................................................... 5 4.2 Theory ...................................................................................................... 6 4.3 Asumptions ............................................................................................... 9
5 ROCKET MOTOR PROPERTIES ............................................................................. 10 5.1 NAR S&T Data .......................................................................................... 10 5.2 New Static Testing .................................................................................... 12
6 DEFINITION OF FLIGHT EXPERIMENT ................................................................... 15 6.1 Flight Instrumentation ............................................................................... 15 6.2 Flight Test Vehicle ..................................................................................... 16 6.3 Piston Launcher ........................................................................................ 16
7 FLIGHT DATA ................................................................................................... 19 7.1 Without Piston Launcher ............................................................................. 19 7.2 Piston Launched ........................................................................................ 20 7.3 Piston Launched, With Payload .................................................................... 23 7.4 Post-Flight Inspection ................................................................................ 26
8 CORRELATION OF ANALYSIS AND FLIGHT DATA .................................................... 28 8.1 Analysis Methodology ................................................................................ 28 8.2 Baseline Model – Initial Correlation .............................................................. 28 8.3 Baseline Model – Final Correlation ............................................................... 30 8.4 Model With Payload ................................................................................... 32 8.5 Augmented Thrust-Time Curve .................................................................... 34
9 SUMMARY AND RECOMMENDATIONS ................................................................... 35
10 EQUIPMENT, FACILITIES, AND BUDGET ................................................................ 36 10.1 Equipment ............................................................................................... 36 10.2 Facilities .................................................................................................. 36 10.3 Project Budget .......................................................................................... 36
REFERENCES .......................................................................................................... 37 Appendix A – Flight Data Appendix B – Static Test Data

ii
NOMENCLATURE
Adiabatic gas constant Ap Cross-section area of the piston tube F Force Fg Force caused by gravity Fm Force (thrust) from the rocket motor Fp Force caused by pressure inside the piston tube g Acceleration due to gravity k1 Rate of exhaust gas production (moles/N-sec) L Length M Mass Mr Mass of the rocket Mp Mass of the piston tube P Pressure Patm Atmospheric pressure at the launch altitude Pp Pressure inside the piston tube rp Radius of piston tube R Universal gas constant T Temperature Texhaust Temperature of the motor exhaust gas V Volume x Displacement x Velocity x Acceleration
ACRONYMS
FHPL Floating head piston launcher NAR National Association of Rocketry PLPP Piston Launcher Performance Program
UNITS
G Acceleration in gravities K Kelvin m Meters N Newtons

1
1 INTRODUCTION
Piston launchers are often used to improve the performance of competition models. A
piston launcher captures the motor’s exhaust gas inside a moving piston tube to
increase vertical force during the piston’s travel. Several design features control the
piston’s effectiveness including piston length, piston diameter, motor properties, and
mass of the rocket.
Theoretical models describing the thermodynamic and physical operation of piston
launchers have been published as early as 1972. However, the theoretical models have
many assumptions that have not been thoroughly correlated to flight data.
Several prior R&D reports have published test and flight data (discussed further in
Section 3 of this report). Historically, it has been difficult to obtain accurate and
extensive flight data for piston launchers due many factors including 1) the time and
effort required; 2) accuracy limitations of available instrumentation and measurement
methods (photography, optical tracking, altimeters, etc.); 3) numerical ill-conditioning
of data processing (calculating velocities and accelerations from displacements); and
4) the effects of other flight variables (vehicle drag, wind, etc.).
This project attempted to directly compare analysis predictions and flight data of a
piston launcher during the piston phase of flight. Using modern electronics, the
vehicle’s acceleration during the piston phase of flight can be measured and compared
to predictions. If the theoretical models of the piston operation can be calibrated and
validated, then the theoretical models can be used with greater confidence to predict
piston performance for a wide range of motors and vehicle designs.
This report describes the analysis approach, instrumentation methodology, flight
measurements, and comparison of analysis and flight results.

2
2 OBJECTIVES AND APPROACH
2.1 OBJECTIVES
The objectives of this project were to 1) measure accelerations during piston
phase of flight; and 2) compare flight results to analysis predictions. The
comparison can be used to calibrate and validate the theoretical model. If the
theoretical model can be validated, this will allow theory to be used to accurately
predict performance for a wide range of motors and vehicle designs.
2.2 TECHNICAL APPROACH
The technical approach for this project was as follows:
Review theory and flight data from prior R&D reports
Perform static testing of motors to obtain higher resolution thrust-time data for the piston phase of flight
Perform flight tests for selected configurations
Calculate analysis predictions for the flight configurations
Compare predictions and flight results
These steps are described in the following sections.

3
3 REVIEW OF PRIOR R&D REPORTS
Many R&D reports have been published describing piston launcher theory and flight
results. Selected major reports are summarized below. See the R&D report archive on
the NAR web site1 for additional reports.
“An Investigation of the Dynamics of the Closed-Breech Launcher,” The Barber Team (T-151), NARAM-14 R&D report, 1972. Performed testing and analysis of closed breech launchers (large diameter launchers where the rocket fits inside the tube). Derived equations of motion for a pressurization launcher. Test data showed that large diameter pressure-assisted launchers did not provide additional performance when using 1/2A6 motors.
“Optimization of Zero-Volume Piston Launcher,” R.Thoelen, T.Bauer, & P.Porzio, MITCON, 1973. Results indicated that short piston lengths (7-10”) were best.
“Investigation of the Physics of the Zero Volume Piston Launcher,” Geoffrey Landis, NARAM-17 R&D report, 1975. More detailed derivation of the theory for piston launchers. Included a FORTRAN computer program for calculating piston performance. Performed lab testing using strobe photography to measure piston displacement versus time.
“Floating Head Piston Launcher,” Charles Weiss & Jeff Vincent, NARAM-28 R&D report, 1986. Introduced the floating head piston launcher (FHPL) concept.
“Optimum Length for a Floating Head Piston Launcher,” Charles Weiss & Jeff Vincent, NARAM-30 R&D report, 1988. Results indicated that the optimum length for a FHPL was 7-9”. Longer pistons did not provide additional performance.
“Piston Pressure and Massive Models,” Robert & Peter Alway, NARAM-47 R&D report, 2005. Results indicated that long pistons were better for “massive” models such as egglofters.
“Piston Effect on Thrust Curves,” Patrick Peterson/Neutron Fusion Team, NARAM-55 R&D report, 2013. Measured “piston-augmented thrust” by video of pistons moving in clear plastic tubes. Results indicated that long piston tubes are generally better. Optimum piston length may exceed 1.5 meters.
1 http://www.nar.org/members/rd-reports-in-chronological-order

4
As noted above, some of the above R&D reports indicated that short piston tubes were
best, while more recent reports found that long tubes were best. Additional work is
needed to resolve this issue.

5
4 THEORY OF PISTON LAUNCHER OPERATION
Piston launcher operation is briefly summarized in Section 4.1. The thermodynamic and
mechanical theory for piston launcher operation is provided in Section 4.2. Important
assumptions are listed in Section 4.3.
4.1 PISTON LAUNCHER OVERVIEW
A typical floating head piston launcher is shown in Figure 4.1-1. The main
components include:
Support rod
Piston head
Piston tube including aft ring
Rocket vehicle including motor
Figure 4.1-1. A piston launcher assembly includes a support tube, a moving piston tube with aft ring, a piston head, and the rocket vehicle (including motor).
Rocket Vehicle
Piston Tube
Aft Ring
Piston Head
Support Tube

6
The piston operation begins at an initial position with the rocket attached2 to the top of
the piston tube. The piston’s initial volume3 is filled with air at ambient temperature
and pressure. After ignition, the motor produces exhaust gas which increases the
pressure and temperature of the gas inside the piston. When the upwards pressure
force from the piston exceeds the downwards gravity force on the rocket vehicle/piston
tube assembly, the vehicle/tube assembly begins to move upwards. The vertical
motion increases the piston volume, thereby affecting the internal pressure and
temperature. The coupled interaction between the exhaust gas and piston/vehicle
motion continues until the aft end of the piston reaches the piston head. At this point,
the rocket vehicle detaches4 from the piston tube and continues with the post-piston
(unassisted) phase of flight.
4.2 THEORY
This section presents the description of piston launcher theory as presented by
Landis [3].
Piston launchers act in accordance with several well-known laws of physics.
Primary among these is Newton’s second law of motion:
(1)
2 The rocket is typically connected to the piston tube by a friction fit. The friction fit must be tight enough to keep the piston tube attached to the rocket during the piston phase of flight. However, the friction fit must not be too tight so that the piston tube can be released/ejected immediately at the end of the piston phase of flight. Other methods for attachment have been used including mechanical arms or pins. The effects of rocket/tube release from the piston tube are not addressed in this report. 3 Some prior R&D reports have implied that zero initial volume provides maximum piston performance. Other reports have implied that an initial zero volume produces oscillation in the piston motion that may degrade performance. An optimum value of the initial volume has not been conclusively demonstrated. 4 For a classic “fixed head” piston launcher, the piston head attached to the support rod. For this design, the piston tube must come to an abrupt halt at the end of the piston travel. The rocket hopefully disconnects from the piston tube due to momentum and without excessive loss of energy (velocity). For a floating head piston launcher (FHPL), the piston head “floats” on the top of the support rod. At the end of the piston travel, the piston tube picks up the floating head, and both the piston tube and piston head depart from the support tube. Pressure increases rapidly in the piston tube until the piston tube and piston head are ejected from the rocket. Other release mechanisms have been used including mechanical arms and pull pins. As noted previously, the effects of rocket/tube release are not addressed in this report.

7
There are several forces acting on the rocket/piston tube assembly including
gravity, thrust, internal pressure in the piston, aerodynamic drag, and friction.
Gravity force depends on the mass of the rocket vehicle (including motor) and
piston tube assembly:
g (2)
where “g” is the acceleration due to gravity (9.80665 m/sec2 at sea level).
The thrust produced by the motor depends on propellant properties and grain
design. Static testing is performed by NAR Standards & Testing (S&T) to measure
thrust versus time and related properties. For a piston launcher, the motor’s
thrust may be reduced slightly due to internal pressure in the piston.
The pressure force applied by the piston to the rocket is proportional to the piston
diameter and the pressure inside the piston tube:
(3)
where Patm = pressure of one atmosphere at sea level (101,325 N/m2). The gas
pressure inside the piston tube is assumed to follow the Ideal Gas Law:
(4)
where
P = the pressure of the gas
V = the volume of the gas
n = the amount of substance of gas (in moles)
R = the ideal, or universal, gas constant, equal to the product of the Boltzmann constant and the Avogadro constant
T = the absolute temperature of the gas
T depends on the temperature of the motor’s exhaust gas, which is nominally
1,500°K [10]. Several things affect temperature. First, when the exhaust gas
mixes with the cooler gas already in the launcher, it will be cooled. The amount
by which it is cooled is governed by the relative specific heats involved. A good
approximation to the cooling due to mixing is:

8
∆ ∆⁄ (5)
The total temperature is the molewise average of the previous temperature in the
piston and the temperature of the exhaust gas input.
n is a function of time determined by the motor thrust and impulse. For a motor
of constant specific impulse, the rate of gas input is proportional to the thrust of
the motor:
(6)
where Fm(t) is the motor’s thrust as a function of time. Integrating the above
equation:
(7)
Note that the integral term in the above equation represents the impulse of the
motor.
During the early part of the piston operation when pressure force is less than the
gravity force on the rocket/tube assembly, the rocket /tube acceleration is set to
zero so that the rocket/tube assembly remains at its initial location.
The volume in piston will produce a “gas spring” effect. The vibration frequency
of the gas spring system can be calculated as5:
12
where
f0 = frequency (Hz)
γ = adiabatic gas constant
Patm = atmospheric pressure [N/m2]
Ap = cross-sectional area of air column [m2]
L = length of air column [m]
M = mass supported on the air spring [kg]
5 www.diracdelta.co.uk/science/source/a/i/air spring/source.html

9
The air spring frequency can provide insight into oscillations (if any) calculated
during the piston phase of flight.
4.3 ASUMPTIONS
The theory for piston launcher operation presented in Section 4.2 includes many
assumptions:
Ideal gas law (neglect two-phase flow effects)
Use published values for exhaust temperature and rate of gas generation
Instantaneous mixing of motor exhaust and the volume of gas in the piston
Negligible thermal loss to the piston tube
Negligible reduction of motor thrust by the piston internal pressure
Friction is neglected
Gas leakage is neglected
Assume that the air volume between piston tube and support tube is vented
Discussion of methods to represent friction and leakage are included in [3], [8],
and [9].

10
5 ROCKET MOTOR PROPERTIES
This project focused on the Estes C6 motor. This motor was selected due to the size of
the measuring altimeter/accelerometer and the carrier vehicle.
5.1 NAR S&T DATA
Rocket motor thrust-vs-time curves and related data were initially obtained from
the NAR Standards and Testing data on the NAR web site6. This data includes
digitized thrust-vs-time points for a typical motor from the batch of motors tested.
Other data includes propellant mass and total impulse. The thrust versus time
curve for an Estes C6 motor is shown in Figure 5.1-1.
Figure 5.1-1. Thrust versus time for the Estes C6 motor from NAR S&T.
Early results from the piston analysis program indicated that the predicted
behavior of the piston was very sensitive to the digitization of the thrust-time
curve and total impulse. To provide smoother definition of the thrust and impulse
6 http://www.nar.org/standards-and-testing-committee/nar-certified-motors/
0
2.5
5
7.5
10
12.5
15
0 0.5 1 1.5 2
Thrust (N)
Time (seconds)
NAR S&T Data

11
versus time, the initial portion of the thrust-time curve was fit with a 3rd order
polynomial curve. The raw data and curve fit results are shown in Figure 5.1-2.
Figure 5.1-2. Curve fit of the initial portion of the Estes C6 thrust-time data.
Using the curve fit data, motor thrust during the initial portion of the thrust-time
curve (up to 0.14 seconds) can be calculated as:
20.558 308.29 417.77
Total impulse during the initial portion of the thrust-time curve can be calculated
by integrating the above equation:
10.279 102.76 104.44
It should be noted that the NAR S&T data is representative for the motors that
were tested. The published thrust-vs-time data represents one motor (or an
average motor) from the set of tested motors. Some variation is expected
between motors within a batch. Larger variations may occur between batches of
motor. Finally, commercially produced black powder may vary over the years due
to chemicals available. Recently produced motors may have some differences
y = 417.77x3 + 308.29x2 + 20.558x + 6E‐13
0
1
2
3
4
5
6
7
8
9
10
0 0.02 0.04 0.06 0.08 0.1 0.12 0.14
Thrust (N)
Time (seconds)
NAR S&T Data
Poly. (NAR S&T Data)

12
compared to the motors tested by NAR S&T (in 1995 for the Estes C6 motor).
New static test data is described in the following section.
5.2 NEW STATIC TESTING
New static testing of Estes C6 motors was performed for this project. A simple
test stand was developed using a Vernier Lab Pro data acquisition system7 and a
Dual-Range Force Sensor (0-10 N or 0-50 N)8. Data was acquired at a sampling
rate of 1,000 samples/second to provide high resolution of the thrust-time curve.
Figure 5.2-1. New static testing was performed for Estes C6 motors.
Three Estes C6-3 motors were tested (motor code A041316). Tests #1 and #2
were performed using the 0-50 N range selected of the force sensor. This allowed
the entire thrust-time curve (peak thrust ~14 N) to be measured. Test #3 was
performed using the 0-10 N setting of the force sensor to provide higher
resolution for low thrust values.
The thrust-time curves from the three static tests (along with NAR S&T data) are
shown in Figure 5.2-2 (and Appendix B). The new thrust-time curves were very
7 http://www.vernier.com/products/interfaces/labpro/ 8 http://www.vernier.com/products/sensors/force-sensors/dfs-bta/

13
repeatable. Note that the peak thrust data from test #3 was clipped at ~12 N
due to using the higher sensitivity (0-10 N) setting of the force sensor.
Figure 5.2-2. The thrust-time curves from the three new tests were repeatable.
The initial portions of the thrust-time curves are shown in Figure 5.2-3. The
ramp-up information was very repeatable. As shown in Figure 5.2-4, a 5th order
polynomial can accurately represent the initial portion of the thrust-time curve (up
to 0.20 seconds):
5.2388 168.89 2373.1 5303.5 36759
Total impulse during the initial portion of the thrust-time curve can be calculated
by integrating the above equation:
2.6194 56.297 593.28 1060.7 6126.5
These values were used for predicting/analyzing flight responses (see Section 8).
‐1
0
1
2
3
4
5
6
7
8
9
10
11
12
13
14
15
0 0.25 0.5 0.75 1 1.25 1.5 1.75 2 2.25 2.5
Thrust
(N)
Time (seconds)
NAR S&T
C6 Test #1
C6 Test #2
C6 Test #3

14
Figure 5.2-3. The initial portion of the Estes C6 thrust-time curves was repeatable.
Figure 5.2-4. A 5th order polynomial curve was fit to the initial portion of the C6 thrust-time curve.
‐1
0
1
2
3
4
5
6
7
8
9
10
11
0 0.025 0.05 0.075 0.1 0.125 0.15 0.175 0.2 0.225 0.25
Thrust
(N)
Time (seconds)
NAR S&T
C6 Test #1
C6 Test #2
C6 Test #3
y = ‐36759x5 + 5303.5x4 + 2373.1x3 ‐ 168.89x2 + 5.2388x ‐ 0.0005
0
1
2
3
4
5
6
7
8
9
10
0 0.025 0.05 0.075 0.1 0.125 0.15 0.175 0.2
Thrust (N)
Time (seconds)
C6 Test #3 Digitized
Poly. (C6 Test #3 Digitized)
15
6 DEFINITION OF FLIGHT EXPERIMENT
The flight experiment included the following items:
Flight instrumentation (altimeter/accelerometer)
Flight test vehicle
Piston launcher
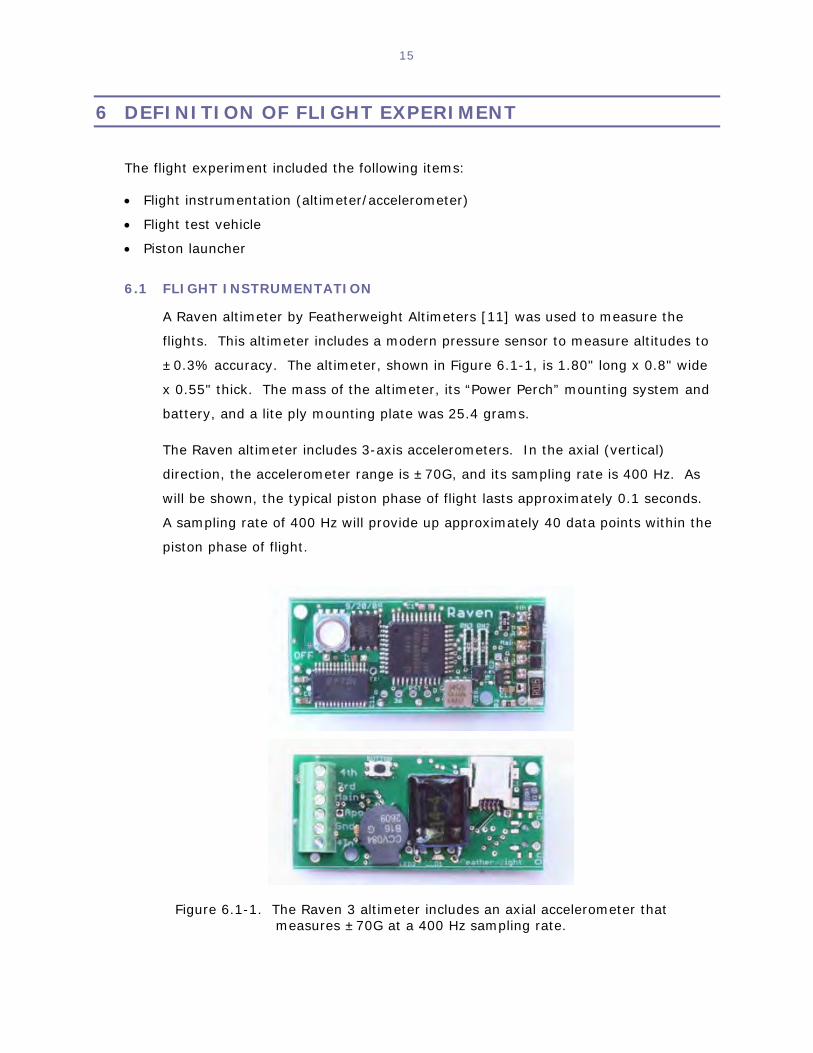
6.1 FLIGHT INSTRUMENTATION
A Raven altimeter by Featherweight Altimeters [11] was used to measure the
flights. This altimeter includes a modern pressure sensor to measure altitudes to
±0.3% accuracy. The altimeter, shown in Figure 6.1-1, is 1.80" long x 0.8" wide
x 0.55" thick. The mass of the altimeter, its “Power Perch” mounting system and
battery, and a lite ply mounting plate was 25.4 grams.
The Raven altimeter includes 3-axis accelerometers. In the axial (vertical)
direction, the accelerometer range is ±70G, and its sampling rate is 400 Hz. As
will be shown, the typical piston phase of flight lasts approximately 0.1 seconds.
A sampling rate of 400 Hz will provide up approximately 40 data points within the
piston phase of flight.
Figure 6.1-1. The Raven 3 altimeter includes an axial accelerometer that measures ±70G at a 400 Hz sampling rate.

16
6.2 FLIGHT TEST VEHICLE
The design of the flight test vehicle is shown in Figure 6.2-1. The model used a
BT-60 body tube to accommodate size of the Raven altimeter. The model
included separate bays for the altimeter and an optional payload. The vehicle was
built with lite ply fins attached using through-the-wall mounting to be light yet
rugged for many flights. The mass of the model (w/o motor, altimeter, or
optional payload) was 80.8 grams (2.85 ounces). The mass including the
altimeter was 106.2 grams (3.75 ounces).
Figure 6.2-1. The flight test vehicle included separate bays for the
altimeter and the optional payload.
6.3 PISTON LAUNCHER
The piston support tube was a 36” aluminum tube with a 0.5” outside diameter.
The same support tube was used for all flights.
The piston tubes (34” long) were T-20 paper body tubes by Totally Tubular,
purchased from www.eRockets.biz. The piston tube had a single paper centering
ring (18 mm engine block) at the aft end. Two 1/4” diameter holes were punched
in the tube forward of the aft centering ring to allow venting of gas between the
support tube and the piston tube.
A floating head was used at the top of the piston tube. The piston head was
printed from plastic using an Objet 30 polyjet 3D printer9. The outer diameter of
the piston head was sized to provide an easy slip fit within the T-20 tube.
A new piston tube and a new piston head was used for each flight. This
eliminated potential issues with accumulated gunk/debris.
9 http://www.stratasys.com/3d-printers/design-series/objet30

17
The piston component lengths (36” support tube, 2” tall base, 34” piston tube)
were such that the aft end of the rocket motor rested on the floating head prior to
ignition. This resulted in a very small initial volume.
Piston launches were performed “naked” without support guides around the rocket
vehicle. Winds were low on all test flights (< 4 MPH). A typical flight setup is
shown in Figure 6.3-1.
Figure 6.3-1. The piston test model was attached to the piston launcher
without lateral supports.

18
On all piston launched flights, the piston tube cleared the piston support rod. The
piston tube landed nearby the piston support rod after flight. A typical post-flight
arrangement is shown in Figure 6.3-2.
Figure 6.3-2. The piston cleared the piston support rod on all flights.

19
7 FLIGHT DATA
Three sets of flights were performed:
Baseline model, without a piston launcher
Baseline model, 34” T-20 piston launcher
Model with payload, 34” T-20 piston launcher
The flights are described in the following sections.
7.1 WITHOUT PISTON LAUNCHER
Two flights were made without a piston launcher. The baseline vehicle (no
additional payload) was used. C6-3 motors were used (motor code A061915).
Axial accelerations from the two flights are compared to the predicted
(OpenRocket, using NAR S&T motor data) axial acceleration in Figure 7.1-1. The
flight data has generally good agreement to analysis predictions. The flight
“steady state” acceleration was slightly lower than predicted, and the motor burn
time was somewhat longer than the NAR S&T data. This is consistent with the
results from the new static testing of current C6-3 motors.
Figure 7.1-1. The axial acceleration from the flights without piston
agreed well with the predictions from OpenRocket.
‐2.5
0
2.5
5
7.5
10
12.5
0 0.5 1 1.5 2 2.5
Acceleration (G)
Time (seconds)
Predicted
C6 ‐ Flt 1
C6 ‐ Flt 2

20
7.2 PISTON LAUNCHED
Three flights were made using the baseline vehicle (no additional payload) and a
piston launcher. C6-3 motors were used (motor code A061915).
Axial accelerations from the three flights are shown in Figures 7.2-1 through
7.2-3. The accelerations during the piston phase of flight were significantly higher
than without a piston. Peak acceleration during the piston phase of flight
exceeded 30 G’s.
All three flights showed a noticeable “blip” (as high as 15 G’s) before the main
ramp-up of acceleration. This may have been caused by the igniter heat/gas or
by gas dynamics of a piston launcher with very small initial volume.
Figure 7.2-1. Baseline model with piston - Flight #1.
‐5
0
5
10
15
20
25
30
35
0.0 0.5 1.0 1.5 2.0 2.5
Acceleration (G's)
Time (seconds)
Baseline Model ‐ Flight #1

21
Figure 7.2-2. Baseline model with piston - Flight #2.
Figure 7.2-3. Baseline model with piston - Flight #3.
The axial accelerations from the three flights are overlaid in Figure 7.2-4. The
results from the three flights were repeatable. This may have been helped by
using a new piston tube and piston head for each flight (no accumulated buildup
of residue or gunk).
‐5
0
5
10
15
20
25
30
35
0.0 0.5 1.0 1.5 2.0 2.5
Acceleration (G's)
Time (seconds)
Baseline Model ‐ Flight #2
‐5
0
5
10
15
20
25
30
35
0.0 0.5 1.0 1.5 2.0 2.5
Acceleration (G's)
Time (seconds)
Baseline Model ‐ Flight #3

22
Figure 7.2-4. Baseline model with piston - Flights #1-3 overlaid.
Figure 7.2-5 shows the piston phase of flight. As noted earlier, the piston
performance was repeatable. Somewhat surprisingly, there was no significant
acceleration “blip” when the piston tube (with floating head) was ejected from the
model following separation from the piston support rod.
Figure 7.2-5. Baseline model with piston – overlay of Flights #1-3.
‐5
0
5
10
15
20
25
30
35
0.0 0.5 1.0 1.5 2.0 2.5
Acceleration (G's)
Time (seconds)
Baseline Model ‐ Flight #3
‐5
0
5
10
15
20
25
30
35
0.05 0.10 0.15 0.20 0.25 0.30 0.35 0.40 0.45
Acceleration (G's)
Time (seconds)
Baseline Model ‐ Flights #1‐3
Flight 1
Flight 2
Flight 3

23
Velocities were calculated by numerically integrating the accelerations. As shown
in Figure 7.2-6, the velocity at the end of the piston operation was ~19-20 m/sec.
Figure 7.2.6. The velocity at the end of the piston tube travel was 19-20 m/sec.
7.3 PISTON LAUNCHED, WITH PAYLOAD
A NAR-standard payload (28 grams) and mounting materials (33.0 grams total)
were placed into the payload bay of the model. Two flights were made using the
vehicle (with payload) and a piston launcher. C6-3 motors were used (motor
code A061915).
Axial accelerations from the two flights are shown in Figures 7.3-1 and 7.3-2.
Peak acceleration during the piston phase of flight exceeded 25 G’s. This was only
slightly lower than the accelerations for the baseline model (without payload).
The axial accelerations from the two flights are overlaid in Figure 7.3-3. The
results were repeatable. A detailed view of the piston phase of flight is shown in
Figure 7.3-4.
‐5
0
5
10
15
20
25
30
0 0.05 0.1 0.15 0.2 0.25
Velocity (m/s)
Time (seconds)
C6 ‐ Flt 1
C6 ‐ Flt 2
C6 ‐ Flt 3

24
Figure 7.3-1. Model with 1 ounce payload - Flight #1.
Figure 7.3-2. Model with 1 ounce payload - Flight #2.
‐5
0
5
10
15
20
25
30
35
0.0 0.5 1.0 1.5 2.0 2.5
Acceleration (G's)
Time (seconds)
Model With Payload ‐ Flight #1
‐5
0
5
10
15
20
25
30
35
0.0 0.5 1.0 1.5 2.0 2.5
Acceleration (G's)
Time (seconds)
Model With Payload ‐ Flight #2

25
Figure 7.3-3. Model with 1 ounce payload – overlay of flights #1-2.
Figure 7.3-4. Model with 1 ounce payload – overlay of flights #1-2.
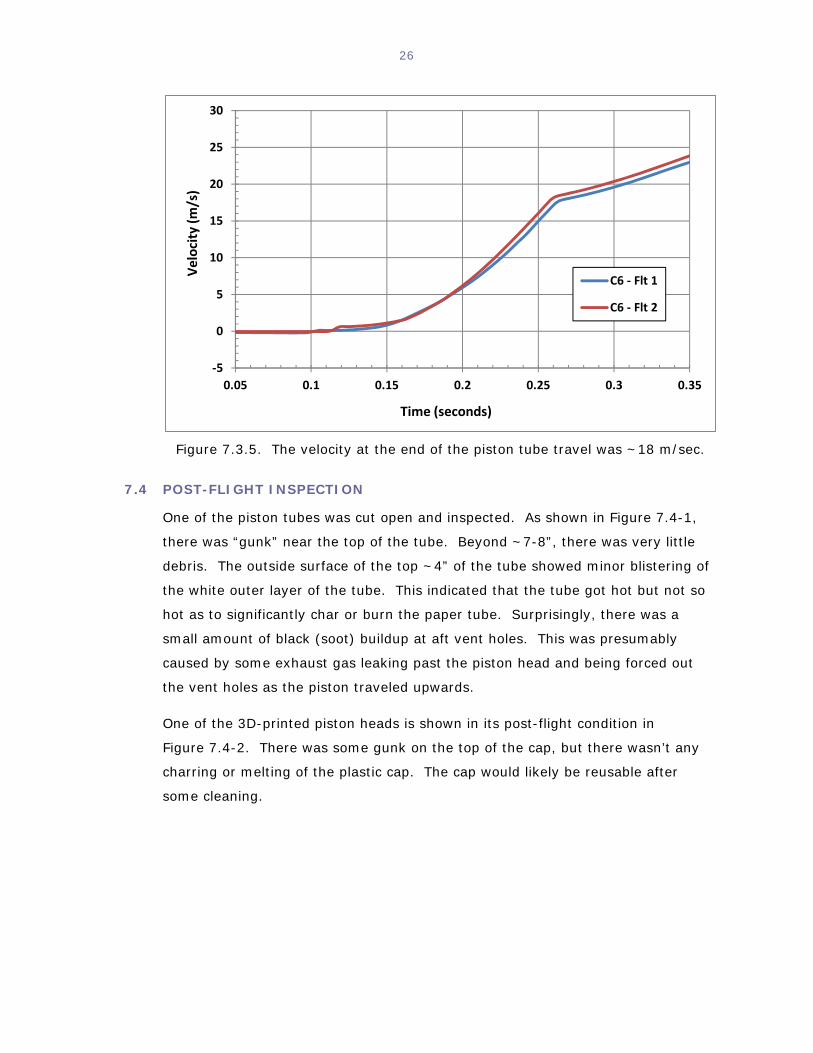
Velocities were calculated by numerically integrating the accelerations. As shown
in Figure 7.3-5, the velocity at the end of the piston operation was ~18 m/sec.
‐5
0
5
10
15
20
25
30
35
0.00 0.50 1.00 1.50 2.00 2.50
Acceleration (G's)
Time (seconds)
Model With Payload ‐ Flights #1‐2
Flight 1
Flight 2
‐5
0
5
10
15
20
25
30
35
0.05 0.1 0.15 0.2 0.25 0.3 0.35 0.4 0.45
Acceleration (G)
Time (seconds)
C6 ‐ Flt 1
C6 ‐ Flt 2
26
Figure 7.3.5. The velocity at the end of the piston tube travel was ~18 m/sec.
7.4 POST-FLIGHT INSPECTION
One of the piston tubes was cut open and inspected. As shown in Figure 7.4-1,
there was “gunk” near the top of the tube. Beyond ~7-8”, there was very little
debris. The outside surface of the top ~4” of the tube showed minor blistering of
the white outer layer of the tube. This indicated that the tube got hot but not so
hot as to significantly char or burn the paper tube. Surprisingly, there was a
small amount of black (soot) buildup at aft vent holes. This was presumably
caused by some exhaust gas leaking past the piston head and being forced out
the vent holes as the piston traveled upwards.
One of the 3D-printed piston heads is shown in its post-flight condition in
Figure 7.4-2. There was some gunk on the top of the cap, but there wasn’t any
charring or melting of the plastic cap. The cap would likely be reusable after
some cleaning.
‐5
0
5
10
15
20
25
30
0.05 0.1 0.15 0.2 0.25 0.3 0.35
Velocity (m/s)
Time (seconds)
C6 ‐ Flt 1
C6 ‐ Flt 2

27
Figure 7.4-1. Only the top ~8” of the piston tube had noticeable launch effects.
Figure 7.4-2. The piston floating head cap did not show any significant
charring or melting.

28
8 CORRELATION OF ANALYSIS AND FLIGHT DATA
8.1 ANALYSIS METHODOLOGY
The piston launcher performance was calculated using an updated version of the
“Piston Launcher Performance Program” (PLPP) developed by Geoff Landis [3].
The program was implemented as an Excel spreadsheet to allow for rapid changes
of model variables and to provide immediate graphs of results. As noted in
Section 4.3, effects of friction and heat loss were assumed to be negligible and
were not included. The numerical algorithm for solving the differential equations
of motion was upgraded to use Huen’s method10 (also known as the Improved
Euler method). The integration time step was set to a small value (0.0001
seconds) to provide a numerically stable solution.
8.2 BASELINE MODEL – INITIAL CORRELATION
The first correlation analysis used a table lookup function to calculate the motor
thrust and total impulse as a function of time. The table lookup function
performed a piecewise linear interpolation using the data points in the NAR S&T
thrust-time curve (shown previously in Figure 5.2-1). This is the typical process
used in most altitude simulation programs.
The initial correlation of the piston launch acceleration was not very good. As
shown in Figure 8.2-1, the predicted acceleration was much higher than the flight
data. The analysis results also had very large spikes that did not occur in the
flight data. It was observed that the abrupt changes in the predicted acceleration
coincided with the data points in the NAR S&T thrust-time curve. This implied
that a piecewise linear lookup function was too coarse to accurately represent the
motor behavior during the piston phase of flight.
The next step in the correlation process used a polynomial curve to calculate the
motor thrust and total impulse as a function of time. A polynomial curve provided
a smooth, continuous thrust-time (and impulse-time) definition and avoided the
abrupt changes of a piecewise linear method.
10 https://en.wikipedia.org/wiki/Heun%27s_method

29
Figure 8.2-1. Using a piecewise linear lookup of thrust and impulse provided
analysis results that did not match flight data.
As shown in Figure 8.2-2, results using the polynomial curve approach were better
but still did not provide a satisfactory match to flight data. The initial peak to
23 G’s was higher than flight. After the initial peak, the slope of the acceleration
curve was similar to flight, but, the total piston time was much shorter than flight.
Figure 8.2-2. Using a polynomial curve fit of motor thrust and impulse eliminated
the abrupt changes caused by using a piecewise linear lookup.
‐10
0
10
20
30
40
50
60
70
80
0.05 0.10 0.15 0.20 0.25 0.30 0.35 0.40 0.45
Acceleration (G's)
Time (seconds)
PLP5 ‐ Piecewise Linear ‐ S&T Data
Flight 1
Flight 2
Flight 3
Analysis
‐5
0
5
10
15
20
25
30
35
40
0.05 0.10 0.15 0.20 0.25 0.30 0.35 0.40 0.45
Acceleration (G's)
Time (seconds)
PLP5 ‐ Curve Fit ‐ S&T Data
Flight 1
Flight 2
Flight 3
Analysis

30
The results in Figure 8.2-2 implied that a more refined definition of the motor’s
low thrust characteristics was needed. For most applications, the low level thrust
behavior isn’t of much interest. However, piston launchers capture the motor
exhaust gas immediately after ignition. Therefore, the low level thrust behavior is
very important for piston launcher performance.
The next correlation step used a curve fit to the motor data from the first static
test performed by the author (labeled “C6 Test #1” in Figure 5.2-3). As shown in
Figure 8.2-3, the agreement between analysis and flight improved. The peak
acceleration improved, and the piston launcher action time (from ignition to piston
release) was close. However, the analysis results showed a large dip after the
initial peak, and this did not occur in the flight data. This implied that even more
refined data was needed to represent the initial performance of the motor.
Figure 8.2-3. Curve fit 1st static test
8.3 BASELINE MODEL – FINAL CORRELATION
As described in the previous section, analysis showed that the predicted results
were very sensitive to the motor characteristics (thrust and total impulse versus
time) following ignition. To provide best results, the motor data from the high
resolution static testing (described previously in Section 5.2 and Figure 5.2-4) was
used in the analysis.
‐5
0
5
10
15
20
25
30
35
40
0.05 0.10 0.15 0.20 0.25 0.30 0.35 0.40 0.45
Acceleration (G's)
Time (seconds)
PLP5 ‐ Curve Fit ‐ CF Static Test #1
Flight 1
Flight 2
Flight 3
Analysis

31
The analysis predictions of accelerations of the baseline model (without payload)
are shown in Figure 8.3-1. The analysis accelerations agreed very well with the
flight data.
The analysis predictions of velocities of the baseline model (without payload) are
shown in Figure 8.3-2. The analysis velocities agreed very well with velocities
calculated from the flight accelerations.
Figure 8.3-1. The predicted accelerations for the baseline model (without
payload) agree very well with flight results.
‐5
0
5
10
15
20
25
30
35
0.05 0.10 0.15 0.20 0.25 0.30 0.35 0.40 0.45
Acceleration (G's)
Time (seconds)
Baseline Model ‐ Flights #1‐3
Flight 1
Flight 2
Flight 3
Analysis

32
Figure 8.3-2. The predicted velocities for the baseline model (without payload)
agree very well with flight results.
8.4 MODEL WITH PAYLOAD
The analysis predictions of accelerations of the model with payload are shown in
Figure 8.4-1. The analysis results agree well with the flight data. The analysis
results may be somewhat higher than the flight data, particularly towards the end
of the piston travel. This might indicate that friction forces or gas leakage were
more significant for the heavier model. The analysis predictions of velocities of
the model with payload are shown in Figure 8.4-2. The analysis velocities agree
well with flight velocities.
‐5
0
5
10
15
20
25
30
35
0.05 0.10 0.15 0.20 0.25 0.30 0.35 0.40 0.45
Velocity (m/s)
Time (seconds)
Baseline Model ‐ Flights #1‐3
Flight 1
Flight 2
Flight 3
Analysis

33
Figure 8.4-1. The predicted accelerations for the model with payload
agree well with flight results.
Figure 8.4-2. The predicted velocities for the model with payload
agree very well with flight results.
‐5
0
5
10
15
20
25
30
35
0.05 0.10 0.15 0.20 0.25 0.30 0.35 0.40 0.45
Acceleration (G's)
Time (seconds)
Model With Payload ‐ Flights #1‐2
Flight 1
Flight 2
Analysis
‐5
0
5
10
15
20
25
30
35
0.05 0.10 0.15 0.20 0.25 0.30 0.35 0.40 0.45
Velocity (m/s)
Time (seconds)
Model With Payload ‐ Flights #1‐2
Flight 1
Flight 2
Analysis

34
8.5 AUGMENTED THRUST-TIME CURVE
The piston pressure applies an additional force to the rocket. The total force
(pressure force plus motor thrust) versus time curves for the baseline model and
model with payload are shown in Figure 8.5-1. Note that the total force varied
with the mass of the rocket.
The piston pressure force added a significant amount of total impulse:
Nominal thrust-time curve (motor only): 8.01 N-sec
Baseline model: 11.20 N-sec (40% increase)
Model with payload: 11.75 N-sec (46.6% increase)
Figure 8.5-1. The piston launcher adds a significant amount of total impulse.
0
10
20
30
40
50
60
0 0.1 0.2 0.3 0.4 0.5 0.6 0.7 0.8 0.9 1
Force (N)
Time (seconds)
Model With Payload
Baseline Model
Thrust Only

35
9 SUMMARY AND RECOMMENDATIONS
The objectives of this project were to measure accelerations during piston phase of
flight and to compare flight results to analysis predictions. The project successfully
achieved both objectives. The project focused on the Estes C6 motor and an 18 mm
diameter piston. An altimeter/accelerometer was used to measure axial accelerations
during flight. Analysis results were calculated using an updated version of the Piston
Launcher Performance Program originally developed by Geoff Landis. New static testing
was performed to provide high resolution data for the Estes C6 motor.
Flight data and analysis results were compared. Both accelerations and velocities
agreed well when using high resolution thrust-time data. This indicated that the piston
program theory was accurate for this class of piston launcher, motor, and model.
There are many related topics that could be that could be explored in future studies:
Additional motors (13 mm motors, 24 mm motors)
Additional piston tube diameters (13 mm, 24 mm) and length
Additional model sizes (lighter, heavier)
Effect of piston initial volume
36
10 EQUIPMENT, FACILITIES, AND BUDGET
10.1 EQUIPMENT
The following equipment was used in this project:
Craft tools (X-Acto knife, razor saws, epoxy, etc.) for construction of the test flight model
Raven altimeter to record acceleration and altitude
10.2 FACILITIES
An Objet 30 3D printer was used to print the piston heads. Access to the printer
was provided by Quartus Engineering Incorporated (www.quartus.com).
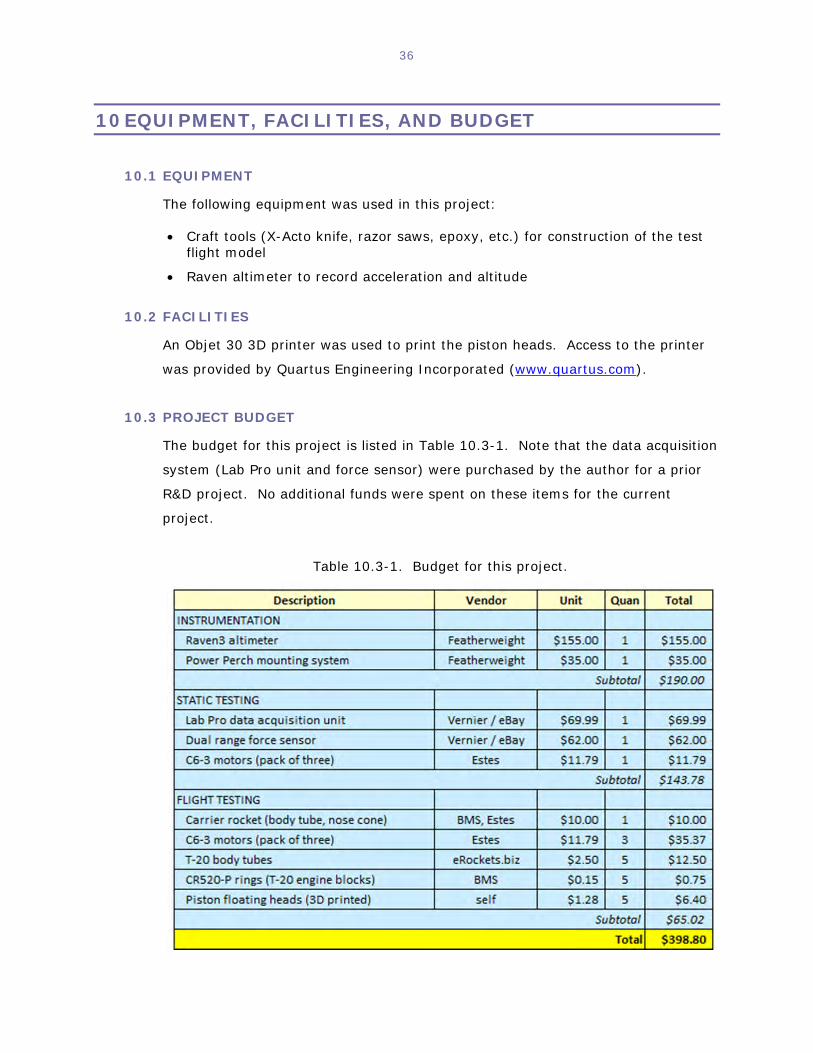
10.3 PROJECT BUDGET
The budget for this project is listed in Table 10.3-1. Note that the data acquisition
system (Lab Pro unit and force sensor) were purchased by the author for a prior
R&D project. No additional funds were spent on these items for the current
project.
Table 10.3-1. Budget for this project.

37
REFERENCES
1. The Barber Team (T-151), “An Investigation of the Dynamics of the Closed-Breech
Launcher”, NARAM-14 R&D report, 1972.
2. R.Thoelen, T.Bauer, & P.Porzio, “Optimization of Zero-Volume Piston Launcher”,
MITCON, 1973.
3. Landis, Geoffrey, “Investigation of the Physics of the Zero Volume Piston Launcher”,
NARAM-17 R&D report, 1975.
4. Charles Weiss & Jeff Vincent, “Floating Head Piston Launcher”, NARAM-28 R&D
report, 1986.
5. Charles Weiss & Jeff Vincent, “Optimum Length for a Floating Head Piston
Launcher”, NARAM-30 R&D report, 1988.
6. Robert & Peter Always, “Piston Pressure and Massive Models”, NARAM-47 R&D
report, 2005.
7. Patrick Peterson/Neutron Fusion Team, “Piston Effect on Thrust Curves”,
NARAM-55 R&D report, 2013.
8. Johnsgard, Scott K., Jr, "A Theoretical Analysis of the Operation of Zero Volume and
Floating Head Piston Launchers", NARAM-42 R&D report, 2000.
9. Ryan, Jeffrey, “Summary of a Mathematical Model of Zero Volume and Floating Head
Piston Launchers”, NARAM-58 R&D report, 2016.
10. Barber, Trip, “Internal Ballistics of Estes C6 Motor”, NARAM-13 R&D report, 1971.
11. Adamson, Adrian, “Raven Users Guide: Updated for the Raven3 Altimeter,”
Featherweight Altimeters LLC.
http://www.featherweightaltimeters.com/uploads/Raven_Users_Manual_2014May20.pdf

1
Appendix A
Flight Data

1
Baseline model, without payload, not piston launched - #1

2
Baseline model, without payload, not piston launched - #2

3
Baseline model (without payload), piston launched - #1
4
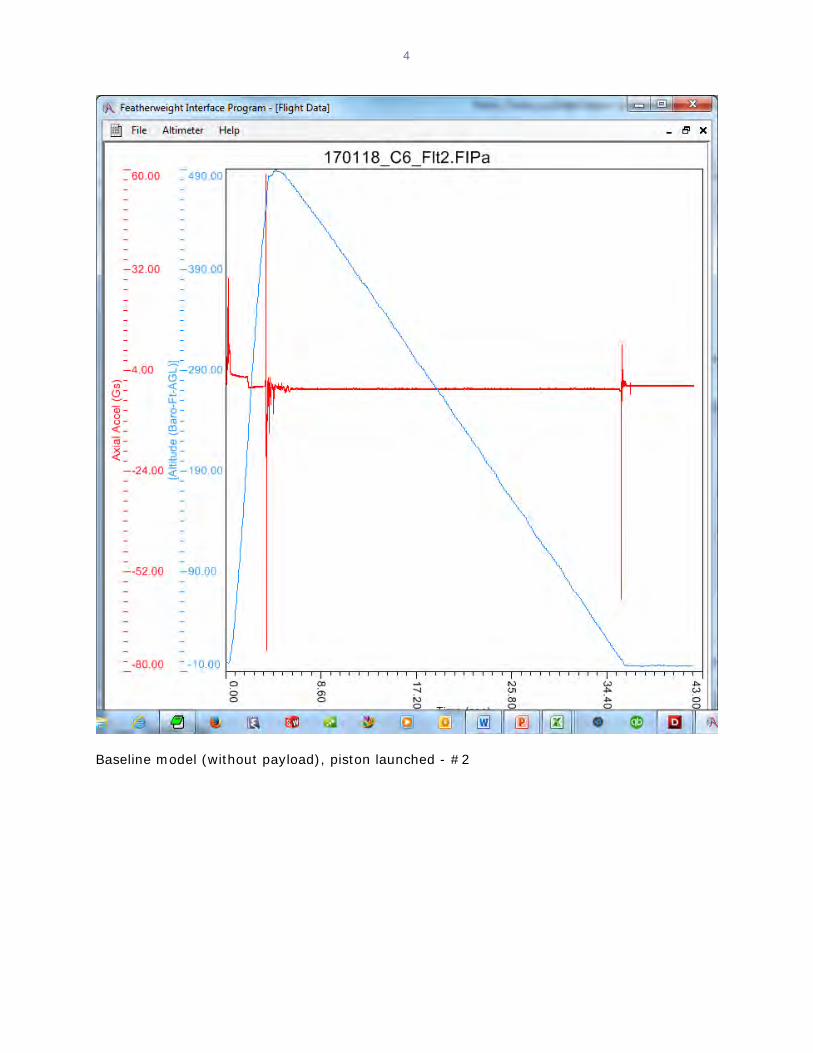
Baseline model (without payload), piston launched - #2

5
Baseline model (without payload), piston launched - #3

6
Model with payload, piston launched - #1

7
Model with payload, piston launched - #2

1
Appendix B
Static Test Data

1
Figure B-1. “C6 Static Test #1”.
‐1
0
1
2
3
4
5
6
7
8
9
10
11
12
13
14
15
0 0.25 0.5 0.75 1 1.25 1.5 1.75 2 2.25 2.5
Thrust
(N)
Time (seconds)
C6 Test #1

2
Figure B-2. “C6 Static Test #2”.
‐1
0
1
2
3
4
5
6
7
8
9
10
11
12
13
14
15
0 0.25 0.5 0.75 1 1.25 1.5 1.75 2 2.25 2.5
Thrust
(N)
Time (seconds)
C6 Test #2
3
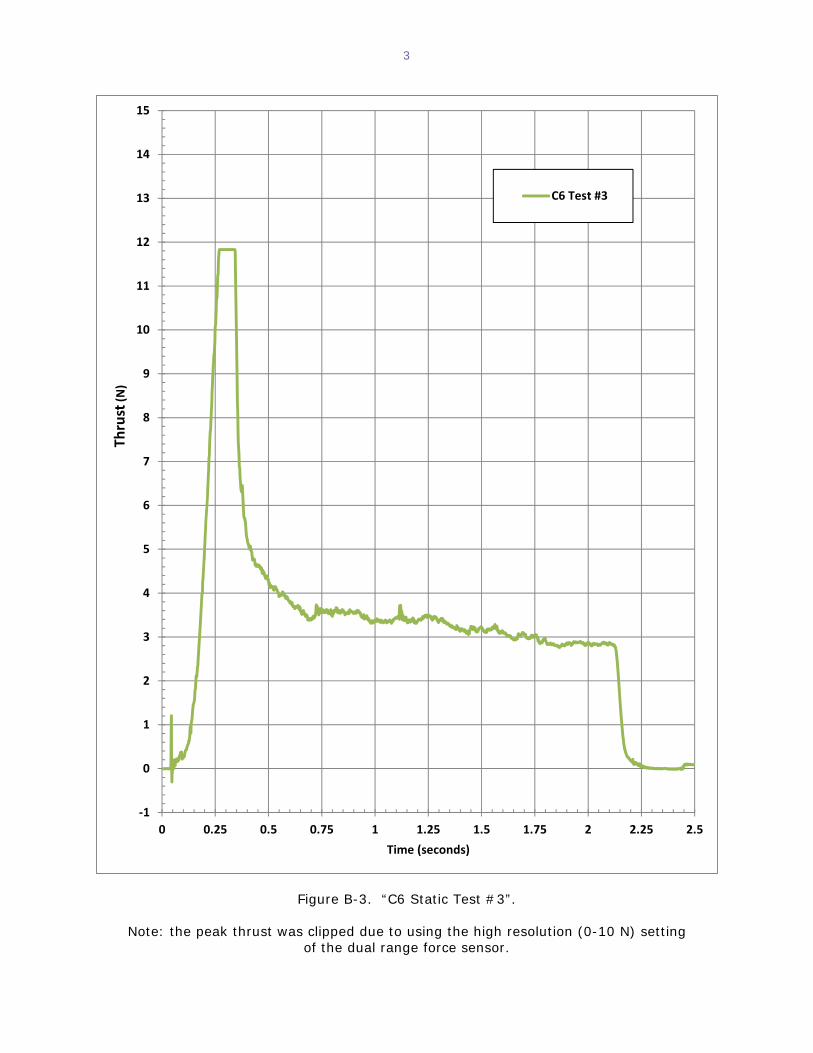
Figure B-3. “C6 Static Test #3”.
Note: the peak thrust was clipped due to using the high resolution (0-10 N) setting of the dual range force sensor.
‐1
0
1
2
3
4
5
6
7
8
9
10
11
12
13
14
15
0 0.25 0.5 0.75 1 1.25 1.5 1.75 2 2.25 2.5
Thrust
(N)
Time (seconds)
C6 Test #3

4
Figure B-4. C6 static tests and NAR S&T data.
‐1
0
1
2
3
4
5
6
7
8
9
10
11
12
13
14
15
0 0.25 0.5 0.75 1 1.25 1.5 1.75 2 2.25 2.5
Thrust
(N)
Time (seconds)
NAR S&T
C6 Test #1
C6 Test #2
C6 Test #3

5
Figure B-5. C6 static tests and NAR S&T data.
‐1
0
1
2
3
4
5
6
7
8
9
10
0 0.025 0.05 0.075 0.1 0.125 0.15 0.175 0.2 0.225 0.25
Thrust
(N)
Time (seconds)
NAR S&T
C6 Test #1
C6 Test #2
C6 Test #3