predict the short-term outcomes of patients with covid-19
TRANSCRIPT

Page 1/14
Development and Validation of a predictive model based on Radiomics topredict the short-term outcomes of patients with COVID-19Juanjuan Xu
Wuhan Union HospitalMei Zhou
Wuhan Union HospitalZhilei Lv
Wuhan Union HospitalZhihui Wang
Wuhan Union HospitalTingting Liao
Wuhan Union HospitalYanliing Ma
Wuhan Union HospitalGuorong Hu
Wuhan Union HospitalSufei Wang
Wuhan Union HospitalJin Gu
Wuhan Union HospitalZhengrong Yin
Wuhan Union HospitalYang Jin ( [email protected] )
Wuhan Union Hospital https://orcid.org/0000-0003-2409-7073
Research
Keywords: COVID-19, chest CT, radiomics, short-term outcomes, nomogram.
Posted Date: September 15th, 2020
DOI: https://doi.org/10.21203/rs.3.rs-74208/v1
License: This work is licensed under a Creative Commons Attribution 4.0 International License. Read Full License

Page 2/14
AbstractBackground: Coronavirus disease-2019 (COVID-19) is sweeping the globe and the situation is precarious. Aim of our study is to develop and validate aradiomics-based model to predict the short-term prognosis of COVID-19 patients and to improve hospital survival.
Methods: In our multi-center study, a �rst batch of 148 patients in the training set was used to build prognosis prediction model, and a second batch of 264patients was assigned as validation set to verify the predictive performance. Patients were divided into two groups (good/poor prognosis) according to theoutcome evaluation both on the 14th day after admission. Data were collected at admission involving demographic and epidemiological features, symptoms,laboratory results and CT images. The latter contained direct CT �ndings and radiomic features. Radiomic scores (Rad-scores) were calculated for eachpatient by a linear combination of the extracted features with their respective coe�cients. Univariable and multivariable Logistic regression analysis wereconducted in sequence to select variables for building a nomogram prediction model, which was applied for prognostic evaluation.
Results: We reported that the nomogram scoring system, including age, central/peripheral lesion location in CT �ndings, C-reactive protein (CRP) and Rad-score, could effectively predict the short-term outcomes of COVID-19 patients with a sensitivity of 81.25% and speci�city of 87.27%. The predictiveperformance of this model was also validated in the independent validation dataset yielding a sensitivity of 88.76%, speci�city of 72.97% (AUC: 0.882).
Conclusions: This radiomics-based model could predict the short-term prognosis of COVID-19 patients and to improve hospital survival.
BackgroundIn December, 2019, a novel coronavirus pneumonia (COVID-19) broke out in Wuhan, Hubei province, China, and is causing concern both domestically andinternationally [1,2] which is designated as a pandemic by the WHO, Causing mass infections and deaths worldwide. Compared to SARS-CoV and Middle Eastrespiratory syndrome coronavirus (MERS-CoV), the 2019-nCoV poses a much higher pandemic risk [3,4]. The epidemic is enormously destructive, and the virusis very different from its two previous counterparts, for the reason that it has a long incubation period and is highly contagious [5]. As a consequence, the �ghtagainst the current COVID-19 epidemic is much more resource-intensive in terms of manpower and materials [6]. Compared to other viral pneumonia, theCOVID-19 may have higher morbidity and mortality, and nearly 20% of con�rmed cases are severely ill [7], having dyspnea(55%), impaired functions oforgans(33%), ARDS(17%), acute respiratory injury (8%), acute renal injury(3%), septic shock (4%), ventilator-associated pneumonia (1%) [8,9]. The rapid globalspread, mounting fatalities, unknown animal reservoirs, and person-to-person transmission potential of the infection pose a much greater threat to humanhealth than SARS and MERS.
Apparently, a simple but accurate method is urgently needed for predicting the short-term outcomes of patients with COVID-19 to allow early intervention.However, so far, predictive models of computed tomography for COVID-19 patients who progressed to severe conditions were rarely reported. What’s more, inseveral countries, the epicenter of the epidemic, medical resources, including medicines, respiratory support equipment, medical consumables, and medicalprotective equipment are currently in serious shortage [10]. Therefore, it is of great urgency to establish an effective prognostic prediction strategy to minimizethe likelihood of the condition developing to serious illness and reduce mortality, thereby easing the pressure on medical resources in this area. Nomogramsare extensively used for event prediction in clinical practice, since they can reduce complicated statistical prediction models to a single number of theprobability, which substantially simpli�es the prediction process [11,12].
In this study, we constructed a predictive of computed tomography early warning model, and translated it into a form of nomogram scoring system, it could beconductive to early judgment or assessment of short-term outcomes of patients with COVID-19, which may help allow early intervention and minimizing thelikelihood of its development to serious illness, easing pressure on medical resources and personnel.
MethodsPatients and inclusion criteria
Firstly, we retrospectively reviewed the �rst batch of patients that were admitted to the isolation wards of Wuhan Union Hospital and West Union Hospital fromJan 16, 2020 to Jan 31, 2020 during the outbreak. A total of 148 patients were ultimately included in this study as a retrospective training dataset. Then 264patients that were admitted to isolation wards of Wuhan Union Hospital, West Union Hospital and Wuhan central Hospital from Feb 1 to Feb 24, 2020 werelater included as an independent validation cohort. All patients were laboratory-con�rmed to be positive for 2019-nCoV nuclear acid. Since our goal is to builda model that can implement early warning functions, the time point of outcome evaluation was then designed to be the fourteenth day after admission. Thecriteria for poor and good outcomes were as follows: Patients who met those three criteria on the fourteenth day were deemed as having good prognosis: (1)Symptoms and manifestation of chest CT improved; (2) No respiratory support was required; (3) Two RNA tests, over 24 hours apart, yielded negative resultsfor 2019-ncov. Patients were taken as having poor prognosis if they satis�ed one of the following criteria on the fourteenth day: (1) Condition or manifestationof chest CT deteriorated; (2) Respiratory support needs to be sustained (high �ow nasal cannula, ventilation support); (3) Patient deceased. This study wasregistered on the Clinical Trials website (No.ChiCTR2000029770). The protocol used in this project was reviewed and approved by the institutional reviewboards of Medical Ethics Committee of Union Hospital (NO.0036) and the informed consent was waived by the Ethics committee for this special emergency.Data collection
Data were collected at patient admission. The demographic and epidemiological data included age, gender, occupation, smoking history, history of travel tothe Huanan seafood wholesale market and exposure history. Symptoms were recorded at admission, including fever, cough, sputum, fatigue, myalgia,hemoptysis, dyspnea, stomachache, diarrhea, conjunctivitis, headache and chest tightness. Laboratory results were collected from medical records, includingcounts of Leucocytes, neutrophils and lymphocytes, C-reactive protein (CRP), erythrocyte sedimentation rate (ESR), procalcitonin (PCT) and serum

Page 3/14
biochemistry (including renal and hepatic function). CT �ndings included computer-aided objective radiomic features and direct �ndings to be interpreted bydoctors (lung involvement ratio, uni-/bilateral pneumonia, central/peripheral lesion location, ground-glass opacity, patchy exudation, consolidation, white lung,pleural effusion). The extraction of radiomic features and de�nition of direct interpreted CT �ndings were detailed in the ensuing section.Pathogen identi�cation
The virus of COVID-19 was tested by real-time RT-PCR through using speci�c primers and probes. RNA was extracted from patients’ samples includingnasopharyngeal swabs or sputum. Patients were de�ned as infected with COVID-19 when the RT-PCR results were positive for two targets (open reading frame1a or 1b, nucleocapsid protein) [13].Evaluation of hematologic indicators
Basic laboratory tests included blood routine test, CRP, PCT and serum biochemical tests (including renal and liver function). To characterize the effect of2019-nCoV on patient immune system, the frequency of immune cells, including CD3+ T lymphocytes, CD8+ T lymphocytes, CD4+ T lymphocytes, Blymphocytes and natural killer (NK) cells, were examined. Immunity-associated factors, including Interleukin-2 (IL-2), IL-4, IL-6, IL-10, interferon γ (IFN-γ), tumornecrosis factor α (TNF-α), serum immunoglobulins and complement 3, 4 (C3, C4) were also detected.CT data acquisition
The CT scans were performed at admission by using a number of multislice detector CT scanners, 1212LightSpeed VCT (General Electric Medical Systems,USA), Somatom Sensation (Siemens Heathcare), Somatom De�nition (Siemens Heathcare), and Somatom De�nition AS+ (Siemens Heathcare). Standarddepartmental protocols were used with volumetric datasets acquired with or without contrast as indicated clinically14. All images were reconstructed into axialimages at a 1.5/2-mm slice thickness at 1.5/2-mm intervals using lung and soft tissue algorithms.Direct interpreted �ndings of chest CT
Direct CT �ndings were performed by two experienced thoracic radiologists blinded to the clinical data. The disagreement was resolved by comparing notesand reaching a consensus. Direct interpreted features included the lesion-occupying ratio of the whole lung �eld (lung involvement ratio), lesion distribution(uni-/bilateral pneumonia, central/peripheral lesion location), lesion density (consolidation, patchy exudation, ground-glass opacity), pleural effusion andlymph node enlargement. The peripheral lesion location was de�ned as predominant distribution of lesions in the subpleural position, and the otherwise wasde�ned as central location. Lymph node enlargement was de�ned as that the maximum short diameter of lymph node exceeded 1 cm [14].Extraction of radiomic features
Radiomic features were extracted by mathematical calculations on image-based data matrices according to the formulas for each feature. Two basicelements of feature extraction are matrices and formulas (formulas were detailed in [https://pyradiomics.readthedocs.io/en/latest/features]). We extracted sixaspects of the features, including shape, histogram and four high-order matrices transformed from the pixel matrix, namely, the gray level co-occurrencematrix (GLCM), gray level run length matrix (GLRLM), gray level size zone matrix (GLSZM) and gray level dependence matrix (GLDM). Each radiomic featurewas calculated on the corresponding matrix according to each speci�c formula. Shape and histogram features were based on a pixel matrix. The last fourcategories were calculated from the four corresponding high-order matrices. Features of these six categories matrices are listed in e-Table 1. A total of 4327features were extracted under four pixel size parameters.Radiomic signature building
In the training cohort, we adopted the least absolute shrinkage and selection operator (LASSO) method for feature selection to identify the relevant features.Radiomic scores (Rad-scores) were calculated for each patient by a linear combination of the extracted features with their respective coe�cients for theprediction model [15].Nomogram
The nomogram was used to visually score the patients’ various parameters, and then to compute the probability of the event based on the patients’ totalscore. To construct a highly accurate prediction model, we combined variables �ltered through aforementioned two models to build nomograms [11]. TheReceiver Operating Characteristic Curve (ROC) was generated by using a validation set dataset to validate the distinguishing power of the nomogram. And thecalibration curve by plotting the observed probability against the predicted probability of poor outcomes was used to evaluate the calibration of thenomogram [16].
Statistical analysisCategorical variables were presented as frequency rates and percentages, and continuous variables were expressed as mean (standard deviation [SD]) if theywere normally distributed or median (interquartile range [IQR]) if they were not. Proportions for categorical variables were compared using the χ2 test orFisher’s exact test. Means for continuous variables were compared using independent group t test when the data were normally distributed. Otherwise, theWilcoxon rank-sum test was used. Some indicators were converted to binary variables according to the optimal cutoff values by employing receiver operatingcharacteristic (ROC) analyses. Variables with P < 0.05 were regarded as potential risk factors and were included in multivariable Logistic regression analysisusing the stepwise selection procedure with default setting. ROC curves were drawn to evaluate the distinguishing power of the constructed models and thedifference between AUCs was compared using Delong’s test. All statistical analyses were performed using SAS software package (version 9.4).
ResultsDescription of the population in training cohort

Page 4/14
A total of 148 patients in the �rst cohort (Wuhan Union Hospital and West Union Hospital from Jan 16 to Jan 31, 2020) and 264 patients in the secondvalidation cohort (Wuhan Union Hospital, West Union Hospital and Wuhan Central Hospital from Feb 1 to Feb 24, 2020) were included in this study. The�owchart of study design showed in Fig. 1.
In the training set of 148 patients, 77 patients showed conspicuous improvement and the other 71 patients were deemed as having poor outcomes.Univariable analyses were used to preliminarily compare the differences between patients with good prognosis and those with poor outcomes, and wescreened out 24 indicators out of 63 variables analyzed that were associated with patients’ outcomes (Table 1).

Page 5/14
Table 1Univariable analysis of the association between variables and patients’ outcomes in the training set
Variables All patients Pooroutcome
Goodoutcome
χ2 P value
Demographics and epidemiological features
Age(year) < 65, n(%) 118(79.73) 50(70.42) 68(88.31) 7.3145# 0.0068
≥ 65, n(%) 30(20.27) 21(29.58) 9(11.69)
Gender female, n(%) 81(54.73) 36(50.70) 45(58.44) 0.8926 0.3448
male, n(%) 67(45.27) 35(49.30) 32(41.56)
Occupation professional and technicalpersonnel, n (%)
28(22.22) 9(15.52) 19(27.94) Fisher's 0.0649b
retired personnel, n(%) 20 (15.87) 13 (22.41) 7 (10.29)
doctor, n (%) 2 (1.59) 0 (0.00) 2 (2.94)
student, n (%) 1(0.79) 1(1.72) 0(0.00)
other, n (%) 75(22.22) 35(60.34) 40(58.82)
Smoke no, n (%) 98(70.50) 47 (68.12) 51(72.86) 0.3756 0.5400
yes, n(%) 41(29.50) 22(31.88) 19(27.14)
Severe chronic diseases without, n(%) 129(87.16) 61(85.92) 68(88.31) 0.1895 0.6633
with, n(%) 19(12.84) 10(14.08) 9(11.69)
History of travel to Huanan seafoodwholesale market
no, n(%) 141(97.92) 66(97.06) 75(98.68) Fisher's 0.6023b
yes, n(%) 3(2.08) 2(2.94) 1(1.32)
History of exposure to suspected patient no, n(%) 138(94.52) 66(94.29) 72(94.74) Fisher's 1.0000b
yes, n(%) 8(5.48) 4(5.71) 4(5.26)
Familial cluster no, n(%) 142(97.26) 67(97.10) 75(97.40) Fisher's 1.0000b
yes, n(%) 4(2.74) 2(2.90) 2(2.60)
Patients’ symptoms at admission
Days from symptom onset to admission ≤ 6, n(%) 58(39.19) 19(26.76) 39(50.65) 8.8456 0.0029
> 6, n(%) 90(60.81) 52(73.24) 38(49.35)
Fever no, n(%) 35(23.65) 15(21.13) 20(25.97) 0.4807 0.4881
yes, n(%) 113(76.35) 56(78.87) 57(74.03)
Sore throats no, n(%) 90(60.81) 47(66.20) 43(55.84) 1.6614 0.1974
yes, n(%) 58(39.19) 24(33.80) 34(44.16)
Fatigue no, n(%) 62(43.06) 31(43.66) 31(42.47) 0.021 0.8848
yes, n(%) 82(56.94) 40(56.34) 42(57.53)
Myalgia no, n(%) 88(59.46) 44(61.97) 44(57.14) 0.3573 0.5500
yes, n(%) 60(40.54) 27(38.03) 33(42.86)
Cough no, n(%) 42(30.66) 20(32.26) 22(29.33) 0.1366 0.7117
yes, n(%) 95(69.34) 42(67.74) 53(70.67)
Expectoration no, n(%) 77(56.20) 35(56.45) 42(56.00) 0.0028 0.9577
yes, n(%) 60(43.80) 27(43.55) 33(44.00)
Hemoptysis no, n(%) 131(94.93) 58(92.06) 73(97.33) Fisher's 0.2458b
yes, n(%) 7(5.07) 5(7.94) 2(2.67)
N: patients included in this study. Missing: patients missing this item. SD: standard deviation. #: t value; *: Z value

Page 6/14
Variables All patients Pooroutcome
Goodoutcome
χ2 P value
Shortness of breath no, n(%) 94(68.61) 41(66.13) 53(70.67) 0.3245 0.5689
yes, n(%) 43(31.39) 21(33.87) 22(29.33)
Stomachache no, n(%) 128(94.12) 58(95.08) 70(93.33) Fisher's 0.7305b
yes, n(%) 8(5.88) 3(4.92) 5(6.67)
Diarrhoea no, n(%) 122(90.37) 53(88.33) 69(92.00) 0.515 0.4730
yes, n(%) 13(9.63) 7(11.67) 6(8.00)
Conjunctivitis no, n(%) 132(98.51) 59(98.33) 73(98.65) Fisher's 1.0000b
yes, n(%) 2(1.49) 1(1.67) 1(1.35)
Headache no, n(%) 97(72.39) 41(69.49) 56(74.67) 0.4425 0.5059
yes, n(%) 37(27.61) 18(30.51) 19(25.33)
Chest tightness no, n(%) 88(63.77) 41(65.08) 47(62.67) 0.0863 0.7690
yes, n(%) 50(36.23) 22(34.92) 28(37.33)
CT radiomics and direct CT �ndings
Rad-score Mean(SD) 0.01(0.32) 0.14(0.19) -0.11(0.36) -4.8165# < 0.0001
Lung involvement ratio < 30%, n(%) 85(57.43) 23(32.39) 62(80.52) 34.9941 < 0.0001
≥ 30%, n(%) 63(42.57) 48(67.61) 15(19.48)
Uni-/bilateral pneumonia single, n(%) 37(25.00) 8(11.27) 29(37.66) 13.7253 0.0002
double, n(%) 111(75.00) 63(88.73) 48(62.34)
Central/Peripheral lesion location either central or peripheralloacation, n(%)
89(60.14) 19(26.76) 70(90.91) 63.4077 < 0.0001
both central and peripheralloacation, n(%)
59(39.86) 52(73.24) 7(9.09)
Consolidation no, n(%) 47(31.76) 7(9.86) 40(51.95) 30.1944 < 0.0001
yes, n(%) 101(68.24) 64(90.14) 37(48.05)
Patchy exudation no, n(%) 34(22.97) 11(15.49) 23(29.87) 4.3149 0.0378
yes, n(%) 114(77.03) 60(84.51) 54(70.13)
Ground-glass opacity no, n(%) 13(8.90) 2(2.90) 11(14.29) Fisher's 0.0193
yes, n(%) 133(91.10) 67(97.10) 66(85.71)
Pleural effusion no, n(%) 92(62.16) 31(43.66) 61(79.22) 19.8577 < 0.0001
yes, n(%) 56(37.84) 40(56.34) 16(20.78)
Lymph node
enlargement
no, n(%) 115(77.70) 41(57.75) 74(96.10) 31.3688 < 0.0001
yes, n(%) 33(22.30) 30(42.25) 3(3.90)
Immune cells and relevant indicators
Leucocytes (× 109/L) < 8, n(%) 122(88.41) 52(82.54) 70(93.33) 3.9266 0.0475
≥ 8, n(%) 16(11.59) 11(17.46) 5(6.67)
Neutrophils (× 109/L) < 2.7, n(%) 68(49.28) 21(33.33) 47(62.67) 11.7868 0.0006
≥ 2.7, n(%) 70(50.72) 42(66.67) 28(37.33)
Lymphocytes (× 109/L) < 0.9, n(%) 58(42.03) 36(57.14) 22(29.33) 10.8680 0.0010
≥ 0.9, n(%) 80(57.97) 27(42.86) 53(70.67)
N: patients included in this study. Missing: patients missing this item. SD: standard deviation. #: t value; *: Z value

Page 7/14
Variables All patients Pooroutcome
Goodoutcome
χ2 P value
Eosinophils(× 109/L) < 0.003, n(%) 57(41.30) 36(57.14) 21(28.00) 11.9946 0.0005
≥ 0.003, n(%) 81(58.70) 27(42.86) 54(72.00)
Erythrocyte
sedimentation
rate (ESR) (mm/h)
< 23, n(%) 38(39.18) 9(20.00) 29(55.77) 12.9530 0.0003
≥ 23, n(%) 59(60.82) 36(80.00) 23(44.23)
C-Reactive Protein (CRP) (mg/L) < 20, n(%) 75(58.59) 20(33.90) 55(79.71) 27.5125 < 0.0001
≥ 20, n(%) 53(41.41) 39(66.10) 14(20.29)
Procalcitonin (PCT)(ng/ml) < 0.22, n(%) 90(76.92) 37(66.07) 53(86.89) 7.1253 0.0076
≥ 0.22, n(%) 27(23.08) 19(33.93) 8(13.11)
CD3 + lymphocytes (%) Mean(SD) 71.81(9.59) 69.27(9.84) 73.19(8.78) 1.4821# 0.1449
N(Missing) 50(98) 26(45) 24(53)
CD4 + lymphocytes (%) Mean(SD) 40.21(8.90) 40.11(9.23) 39.09(6.93) -0.4415# 0.6609
N(Missing) 50(98) 26(45) 24(53)
CD8 + lymphocytes (%) Mean(SD) 26.55(9.81) 24.54(10.60) 28.45(7.36) 1.5027# 0.1395
N(Missing) 50(98) 26(45) 24(53)
B lymphocytes (%) Mean(SD) 11.63(5.37) 12.70(6.73) 10.76(3.70) -1.2572# 0.2164
N(Missing) 49(99) 25(46) 24(53)
NK cells (%) Mean(SD) 13.14(7.85) 15.04(7.62) 12.20(7.86) -1.2813# 0.2064
N(Missing) 49(99) 25(46) 24(53)
CD4+/CD8 + ratio Mean(SD) 1.98(1.85) 2.19(1.94) 1.50(0.66) -1.7196# 0.0955
N(Missing) 50(98) 26(45) 24(53)
IL-2 (pg/L) Mean(SD) 2.63(0.47) 2.71(0.57) 2.55(0.35) -1.0421# 0.3064
N(Missing) 37(111) 18(53) 19(58)
IL-4 (pg/L) Mean(SD) 1.97(0.41) 2.01(0.34) 1.93(0.47) -0.5614# 0.5781
N(Missing) 37(111) 18(53) 19(58)
IL-6 (pg/L) Mean(SD) 16.26(29·85) 27.77(40.01) 5.35(3.32) -2.3699 0.0297
N(Missing) 37(111) 18(53) 19(58)
IL-10 (pg/L) Mean(SD) 4.64(2·31) 5.83(2·64) 3.51(1.16) -3.4370# 0.0022
N(Missing) 37(111) 18(53) 19(58)
TNF-α (pg/ml) Mean(SD) 2.33(1.39) 2.11(0.34) 2.54(1.91) 0.9866# 0.3361
N(Missing) 37(111) 18(53) 19(58)
IFN-γ (pg/ml) Mean(SD) 2.69(1.49) 3.22(1.90) 2.19(0.72) -2.1561# 0.0425
N(Missing) 37(111) 18(53) 19(58)
IGE (IU/ml) Median(IQR) 47.93(84.47) 98.84(11.44) 36.45(70.82) 1.6202* 0.1052
N(Missing) 19(129) 5(66) 14(63)
IGG(g/L) Median(IQR) 11.20(3.00) 11.20(2.20) 11.20(3.46) 0.9725* 0.3308
N(Missing) 19(129) 5(66) 14(63)
IGA(g/L) Median(IQR) 1.77(0.93) 2.01(1.02) 1.66(1.30) 1.1578* 0.2470
N(Missing) 19(129) 5(66) 14(63)
N: patients included in this study. Missing: patients missing this item. SD: standard deviation. #: t value; *: Z value
Page 8/14
Variables All patients Pooroutcome
Goodoutcome
χ2 P value
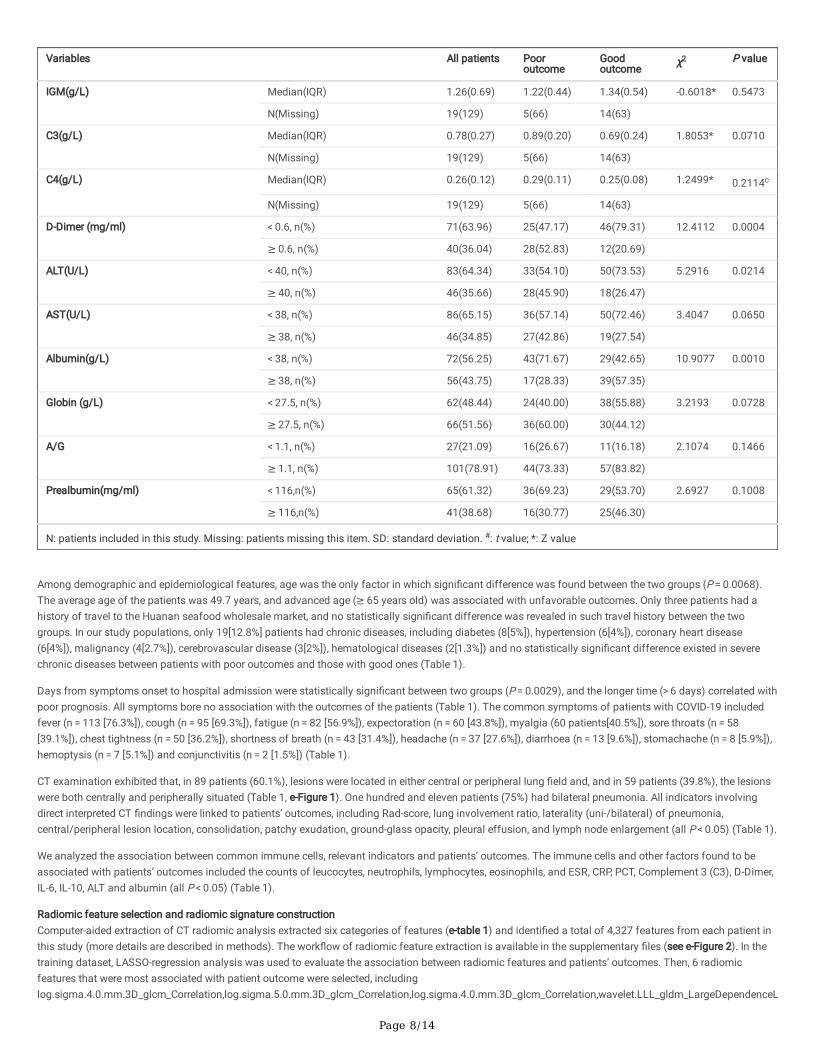
IGM(g/L) Median(IQR) 1.26(0.69) 1.22(0.44) 1.34(0.54) -0.6018* 0.5473
N(Missing) 19(129) 5(66) 14(63)
C3(g/L) Median(IQR) 0.78(0.27) 0.89(0.20) 0.69(0.24) 1.8053* 0.0710
N(Missing) 19(129) 5(66) 14(63)
C4(g/L) Median(IQR) 0.26(0.12) 0.29(0.11) 0.25(0.08) 1.2499* 0.2114c
N(Missing) 19(129) 5(66) 14(63)
D-Dimer (mg/ml) < 0.6, n(%) 71(63.96) 25(47.17) 46(79.31) 12.4112 0.0004
≥ 0.6, n(%) 40(36.04) 28(52.83) 12(20.69)
ALT(U/L) < 40, n(%) 83(64.34) 33(54.10) 50(73.53) 5.2916 0.0214
≥ 40, n(%) 46(35.66) 28(45.90) 18(26.47)
AST(U/L) < 38, n(%) 86(65.15) 36(57.14) 50(72.46) 3.4047 0.0650
≥ 38, n(%) 46(34.85) 27(42.86) 19(27.54)
Albumin(g/L) < 38, n(%) 72(56.25) 43(71.67) 29(42.65) 10.9077 0.0010
≥ 38, n(%) 56(43.75) 17(28.33) 39(57.35)
Globin (g/L) < 27.5, n(%) 62(48.44) 24(40.00) 38(55.88) 3.2193 0.0728
≥ 27.5, n(%) 66(51.56) 36(60.00) 30(44.12)
A/G < 1.1, n(%) 27(21.09) 16(26.67) 11(16.18) 2.1074 0.1466
≥ 1.1, n(%) 101(78.91) 44(73.33) 57(83.82)
Prealbumin(mg/ml) < 116,n(%) 65(61.32) 36(69.23) 29(53.70) 2.6927 0.1008
≥ 116,n(%) 41(38.68) 16(30.77) 25(46.30)
N: patients included in this study. Missing: patients missing this item. SD: standard deviation. #: t value; *: Z value
Among demographic and epidemiological features, age was the only factor in which signi�cant difference was found between the two groups (P = 0.0068).The average age of the patients was 49.7 years, and advanced age (≥ 65 years old) was associated with unfavorable outcomes. Only three patients had ahistory of travel to the Huanan seafood wholesale market, and no statistically signi�cant difference was revealed in such travel history between the twogroups. In our study populations, only 19[12.8%] patients had chronic diseases, including diabetes (8[5%]), hypertension (6[4%]), coronary heart disease(6[4%]), malignancy (4[2.7%]), cerebrovascular disease (3[2%]), hematological diseases (2[1.3%]) and no statistically signi�cant difference existed in severechronic diseases between patients with poor outcomes and those with good ones (Table 1).
Days from symptoms onset to hospital admission were statistically signi�cant between two groups (P = 0.0029), and the longer time (> 6 days) correlated withpoor prognosis. All symptoms bore no association with the outcomes of the patients (Table 1). The common symptoms of patients with COVID-19 includedfever (n = 113 [76.3%]), cough (n = 95 [69.3%]), fatigue (n = 82 [56.9%]), expectoration (n = 60 [43.8%]), myalgia (60 patients[40.5%]), sore throats (n = 58[39.1%]), chest tightness (n = 50 [36.2%]), shortness of breath (n = 43 [31.4%]), headache (n = 37 [27.6%]), diarrhoea (n = 13 [9.6%]), stomachache (n = 8 [5.9%]),hemoptysis (n = 7 [5.1%]) and conjunctivitis (n = 2 [1.5%]) (Table 1).
CT examination exhibited that, in 89 patients (60.1%), lesions were located in either central or peripheral lung �eld and, and in 59 patients (39.8%), the lesionswere both centrally and peripherally situated (Table 1, e-Figure 1). One hundred and eleven patients (75%) had bilateral pneumonia. All indicators involvingdirect interpreted CT �ndings were linked to patients’ outcomes, including Rad-score, lung involvement ratio, laterality (uni-/bilateral) of pneumonia,central/peripheral lesion location, consolidation, patchy exudation, ground-glass opacity, pleural effusion, and lymph node enlargement (all P < 0.05) (Table 1).
We analyzed the association between common immune cells, relevant indicators and patients’ outcomes. The immune cells and other factors found to beassociated with patients’ outcomes included the counts of leucocytes, neutrophils, lymphocytes, eosinophils, and ESR, CRP, PCT, Complement 3 (C3), D-Dimer,IL-6, IL-10, ALT and albumin (all P < 0.05) (Table 1).
Radiomic feature selection and radiomic signature constructionComputer-aided extraction of CT radiomic analysis extracted six categories of features (e-table 1) and identi�ed a total of 4,327 features from each patient inthis study (more details are described in methods). The work�ow of radiomic feature extraction is available in the supplementary �les (see e-Figure 2). In thetraining dataset, LASSO-regression analysis was used to evaluate the association between radiomic features and patients’ outcomes. Then, 6 radiomicfeatures that were most associated with patient outcome were selected, includinglog.sigma.4.0.mm.3D_glcm_Correlation,log.sigma.5.0.mm.3D_glcm_Correlation,log.sigma.4.0.mm.3D_glcm_Correlation,wavelet.LLL_gldm_LargeDependenceL

Page 9/14
The coe�cients of them were 0.959222048, 0.968288021, 0.949917087, 0.005205795, 1027.865081 and 570.4715897 respectively (Fig. 2a, b). The Rad-score was de�ned as linear combination of the extracted features with their respective coe�cients. ROC analyses showed that the AUC of Rad-score fordifferentiating patients’ outcome were 0.76, 0.69 and 0.71 in the training dataset, testing dataset and the entire patient cohort, respectively (Fig. 2c, d, e).
Selection of clinical parameters and CT �ndings associated with patients’ short-term outcomesWe then included indicators with P values less than 0.05 in the univariable analysis and conducted multivariable regression analyses to assess the separatecontribution of each single parameter to the prediction of patients’ outcomes. The result showed that CRP was an independent outcome predictor in themodel. Among all directly interpreted CT features included for multivariable analysis, lesion location (in both central and peripheral �eld) was the only CTfeature that possessed independent predictive value (OR: 16.22, 95% CI: 5.72–46.01, P < 0.0001) (Table 2). Also, Rad-score in radiomics was shown to be anindependent predictor (OR: 27.66, 95% CI: 3.35-228.13, P = 0.002) (Table 2).
Table 2Multivariable analyses of the association between indicators and patients’ short-term outcomes and score of indicators in nomogram in the
training setVariables Group β coe�cient OR (95%CI) P value Nomogram
Score
Age(year) < 65 reference reference 0.00
≥ 65 0.294 1.34 (0.32, 5.62) 0.6875 7.81
Central/Peripheral lesion location Either central or peripheral lesion location reference reference 0.00
Both central and peripheral lesion location 2.84 17.17(5.58,52.79) < 0.0001 75.53
CRP(ng/ml) < 20 reference reference 0.00
≥ 20 1.16 3.18 (1.06, 9.59) 0.0397 30.75
Rad-score 1.88 6.57(1.33,32.37) 0.02 50*
*: For each unit increment of Rad-score, the score increases by 50 points.
Construction of nomogram scoring system for short-term outcome prediction
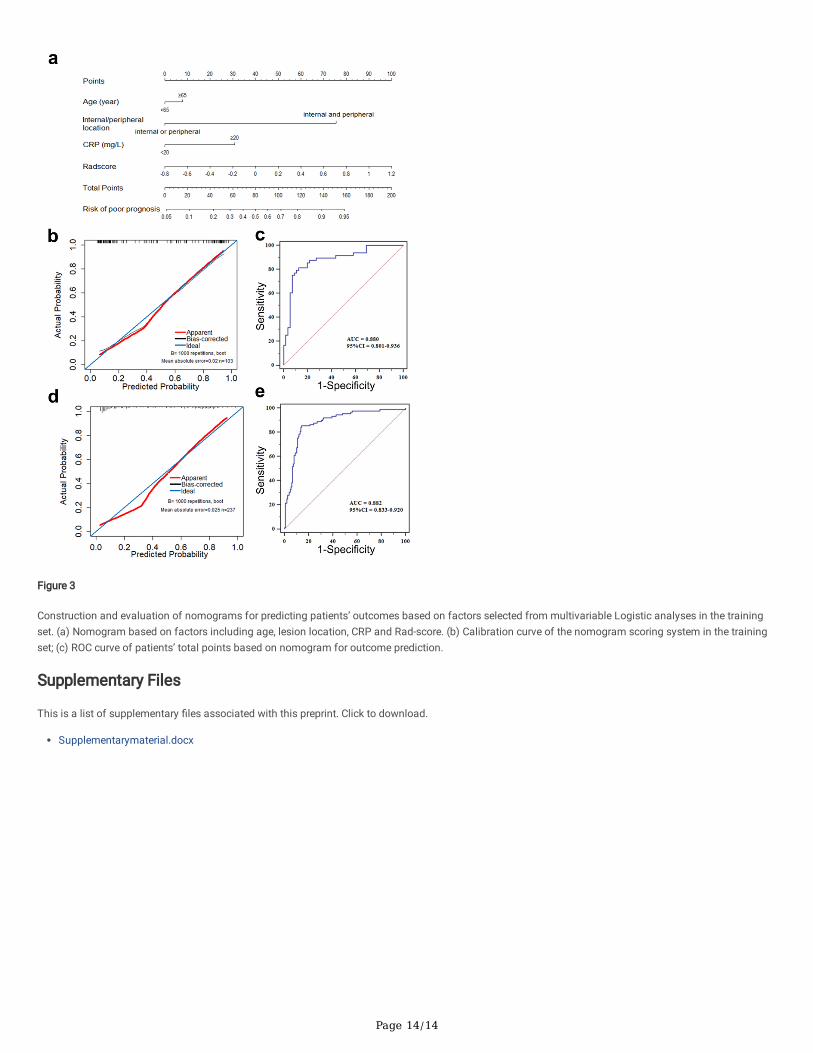
In order to facilitate clinical application, we employed nomogram scoring systems to directly indicate the probability of poor prognosis in patients with COVID-19 based on the total score calculated. We developed nomogram scoring system on the basis of multivariable Logistic regression analyses for predicting theshort-term outcomes of COVID-19 patients in the training set. The relevant parameters in the multivariable analysis were used to construct nomogram. Age isarti�cially incorporated into the model. Accordingly, four indicators (age, CRP, Rad-score, lesion location) were selected to construct the nomogram (Fig. 3a)and the scores of variables were displayed (Table 2). The ROC analysis yielded an AUC value of 0.880 (Fig. 3b), and the sensitivity and speci�city at theoptimal cut-off score of 77.50 were 81.25% and 87.27%, respectively.
Predictive performance of the nomogram scoring system in the independent validation setTo validate the predictive performance of the constructed nomogram scoring system, 264 patients were enrolled from Feb 1 to Feb 24, 2020 in three hospitals,and we found that the nomogram scoring system in the validation set exhibited comparable differentiating power to the training set, as re�ected by an AUC of0.882 [95% CI: 0.833–0.920], and a sensitivity of 88.76%, and a speci�city of 72.97% (Fig. 3e). Then we employed the calibration curve that plotted theobserved probability against the predicted probability of poor outcomes to evaluate the calibration of the nomogram. The ideal calibration curve is thediagonal line which means that observed probability overlapped with the predicted probability of patient’s short-term outcomes. In our independent validationdataset, the scoring system showed good calibration which was close to the diagonal line (Fig. 3d). All of the above further con�rmed the feasibility andaccuracy of this model.
DiscussionIn this study, we identi�ed 24 indicators that were related to patients’ outcomes, including age, lesion location (central/peripheral), Rad-score, ground-glassopacity, counts of neutrophils, lymphocytes, CRP, IL-6, IL-10, IFN-γ, D-Dimer, among others.
As for demographic and epidemiological indicators, age was the sole statistically signi�cant contributor, but the chronic underlying disease was not though ithad been generally believed to be a prognostic factor [17]. The possible reason is that the number of people with chronic underlying diseases included in oursubjects of training set was small, being only 19. All clinical symptoms except days from symptoms onset to hospital admission exhibited no association withthe outcomes of the patients, which is also consistent with other studies [18]. Notably, all features of interpreted CT �ndings were linked to patients’ outcomes,including Rad-score, lung involvement ratio, laterality (uni-/bilateral) of pneumonia etc., which further illustrated the signi�cance of CT imaging in theprognostic evaluation of COVID-19. In fact, according to the multivariable analysis, we found that the CT interpretation of lesion location (central/peripheraldistribution) and Rad-score is the independent predictive factor compared to the other CT features (ground-glass opacity, patchy exudation, consolidation etc.),however, the latter were most focused in evaluating the outcomes of patients with COVID-19 in other research [19].

Page 10/14
Recently, construction of mathematical models based on multiple markers has been increasingly applied in the �eld of medicine. This approach combines aseries of relevant parameters to generate a more accurate predictive model [20–22]. In this study, we constructed a predictive early warning model by using themost signi�cant indicators based on the β-coe�cient generated by multivariable Logistic regression analysis. Moreover, this model was in a form ofnomogram scoring system, which makes it much more convenient for clinicians to use. This study integrated a total of 63 indicators, including not only thecommon indicators, but also the radiological characteristics of chest CT and immunological indicators used in other studies, such as IL-6, IL-10, C3, C4 [8].
To date, several studies have reported that patients with COVID-19 have decreased lymphocyte counts and increased serum in�ammatory cytokine levels [18].In�ammatory storm, which can overwhelmingly cause single or multiple organ failure, is believed to be an important cause of death in COVID-19 patients insevere or critical conditions9. Similarly, we also found that lymphocyte counts and IL-6 and IL-10 levels were correlated with patient’ outcomes in our cohort.However, for hospitals at all levels, the detection of IL-6 or IL-10 is not suitable for large-scale disease prevention or screening in an epidemic, because only fewpeople will be tested for the two cytokines. Similarly, only about 25% (37 out of 148) of patients in our training set received this test. For these reasons, apartfrom the basic indicator (age), we included the Rad-score plus the other two indicators (CT features and CRP) to build prognostic evaluation models forpatients with COVID-19. The difference between the Radiomics and direct CT features lies in that it entails complicated calculation on CT images, and haspotential power to facilitate better clinical decision making. As we know it, direct CT �ndings are easier to judge, while the radiomic features have betteradvantage for the nature than the extent of the lesion. So they could complement each other. The sensitivity and speci�city of the model which combinedradiomic and direct CT features were 81.25% and 87.27% (cut-off score: 77.50) respectively. Consistently, the results of the independent validation set alsocon�rmed the validity and accuracy of this model (AUC: 0.882; sensitivity: 88.76%; speci�city: 72.97%).
In conclusion, the nomograms we developed based on four relevant variables, was easy to use and conductive to early judgment or assessment of short-termoutcomes of patients with COVID-19. Since, clinically, the risk factors included in the prediction model are readily available. The nomogram can be used byphysicians and medical settings effectively. Hopefully, its application may help to start intervention early and minimizing the likelihood of its development toserious illness, and ultimately, reducing mortality and easing pressure on medical resources.
AbbreviationsCOVID-19: Coronavirus disease-2019
Rad-scores: Radiomic scores
CRP: C-reactive protein
MERS-CoV: Middle East respiratory syndrome coronavirus
ESR: erythrocyte sedimentation rate
PCT: procalcitonin
NK cells: natural killer cells
IL-2: Interleukin-2
IFN-γ: interferon γ
TNF-α: tumor necrosis factor α
C3, C4: Complement 3, 4
GLCM: gray level co-occurrence matrix
GLRLM: gray level run length matrix
GLSZM: gray level size zone matrix
GLDM: gray level dependence matrix
LASSO: least absolute shrinkage and selection operator
ROC: Receiver Operating Characteristic Curve
DeclarationsEthics approval and consent to participate
The protocol used in this project was reviewed and approved by the institutional review boards of Medical Ethics Committee of Union Hospital (NO.0036) andthe informed consent was waived by the Ethics committee for this special emergency.
Availability of data and material
Page 11/14
Anonymized clinical and laboratory test data are available on request, subject to an internal review by YJ, JX, MZ, ZL, ZW, and TL to ensure that theparticipants’ anonymity and con�dentiality are protected, with completion of a data-sharing agreement, and in accordance with the Wuhan Union hospital’sinstitutional review boards and institutional guidelines. Material requests, that is marketing campaign information or economics data requests, will beconsidered based on a proposal review, and completion of a material transfer agreement and/or a data use agreement. Please submit requests for participant-related clinical and other data to YJ ([email protected]).
Funding
This paper was supported in part by the National natural science special foundation of China (82041018, 81800094), the Fundamental Research Funds forthe Central Universities, HUST: 2020kfyXGYJ011.
Competing interests
The authors declare no competing interests.
Authors' contributions
YJ and YZ designed the study, JX, ZL, LM, GH, HL, GM and QM collected the epidemiological and clinical data. ZL, ZW, MZ, lD, SW, WX, ZY, WG and TLsummarized and analysed all data. JG and CL interpreted the CT feature. JX, MZ, ZL, ZW, and TL drafted the manuscript. YJ and YZ revised the �nalmanuscript.
Acknowledgements
We thank all of the medical staff who fought on the front line and all the patients for their relevant valuable data.
References[1] Wang C, Horby PW, Hayden FG, Gao GF. A novel coronavirus outbreak of global health concern. The Lancet 2020.
[2] Phelan AL, Katz R, Gostin LO. The Novel Coronavirus Originating in Wuhan, China: Challenges for Global Health Governance. Jama 2020.
[3] Wu JT, Leung K, Leung GM. Nowcasting and forecasting the potential domestic and international spread of the 2019-nCoV outbreak originating inWuhan, China: a modelling study. Lancet (London, England) 2020.
[4] Guarner J. Three Emerging Coronaviruses in Two Decades. American journal of clinical pathology 2020.
[5] Mahase E. China coronavirus: mild but infectious cases may make it hard to control outbreak, report warns. Bmj 2020; 368: m325.
[6] Wang F-S, Zhang C. What to do next to control the 2019-nCoV epidemic? The Lancet 2020; 395(10222): 391-3.
[7] Burki TK. Coronavirus in China. The Lancet Respiratory Medicine 2020.
[8] Huang C, Wang Y, Li X, et al. Clinical features of patients infected with 2019 novel coronavirus in Wuhan, China. The Lancet 2020.
[9] Nanshan Chen MZ, Xuan Dong, Jieming Qu, Fengyun Gong, Yang Han, Yang Qiu, Jingli Wang, Ying Liu, Yuan Wei, Jia’an Xia, Ting Yu,, Xinxin Zhang LZ.Epidemiological and clinical characteristics of 99 cases of 2019 novel coronavirus pneumonia in Wuhan, China: a descriptive study. The Lancet January 29,2020.
[10] Wang X, Zhang X, He J. Challenges to the system of reserve medical supplies for public health emergencies: re�ections on the outbreak of the severeacute respiratory syndrome coronavirus 2 (SARS-CoV-2) epidemic in China. BioScience Trends 2020.
[11] Tang X-R, Li Y-Q, Liang S-B, et al. Development and validation of a gene expression-based signature to predict distant metastasis in locoregionallyadvanced nasopharyngeal carcinoma: a retrospective, multicentre, cohort study. The Lancet Oncology 2018; 19(3): 382-93.
[12] Lamberink HJ, Otte WM, Geerts AT, et al. Individualised prediction model of seizure recurrence and long-term outcomes after withdrawal of antiepilepticdrugs in seizure-free patients: a systematic review and individual participant data meta-analysis. The Lancet Neurology 2017; 16(7): 523-31.
[13] Zhu N, Zhang D, Wang W, et al. A Novel Coronavirus from Patients with Pneumonia in China, 2019. The New England journal of medicine 2020.
[14] Shi H, Han X, Zheng C. Evolution of CT Manifestations in a Patient Recovered from 2019 Novel Coronavirus (2019-nCoV) Pneumonia in Wuhan, China.Radiology 2020: 200269.
[15] Sun R, Limkin EJ, Vakalopoulou M, et al. A radiomics approach to assess tumour-in�ltrating CD8 cells and response to anti-PD-1 or anti-PD-L1immunotherapy: an imaging biomarker, retrospective multicohort study. The Lancet Oncology 2018; 19(9): 1180-91.
[16] Wei J-H, Feng Z-H, Cao Y, et al. Predictive value of single-nucleotide polymorphism signature for recurrence in localised renal cell carcinoma: aretrospective analysis and multicentre validation study. The Lancet Oncology 2019; 20(4): 591-600.
Page 12/14
[17] Team TNCPERE. The Novel Coronavirus Pneumonia Emergency Response Epidemiology Team. The epidemiological characteristics of an outbreak of2019 novel coronavirus diseases (COVID-19) in China. Chinese Journal of Epidemiology 2020; .
[18] Wang D, Hu B, Hu C, et al. Clinical Characteristics of 138 Hospitalized Patients With 2019 Novel Coronavirus-Infected Pneumonia in Wuhan, China. Jama2020.
[19] Jeffrey P. Kanne M. Chest CT Findings in 2019 Novel Coronavirus (2019-nCoV) Infections from Wuhan, China Key Points for the Radiologist Radiology.
[20] Wang L, Dong T, Xin B, et al. Integrative nomogram of CT imaging, clinical, and hematological features for survival prediction of patients with locallyadvanced non-small cell lung cancer. European radiology 2019; 29(6): 2958-67.
[21] Lambin P, Leijenaar RTH, Deist TM, et al. Radiomics: the bridge between medical imaging and personalized medicine. Nat Rev Clin Oncol 2017; 14(12):749-62.
[22] Guo L, Wei D, Zhang X, et al. Clinical Features Predicting Mortality Risk in Patients With Viral Pneumonia: The MuLBSTA Score. Frontiers in microbiology2019; 10: 2752.
Figures
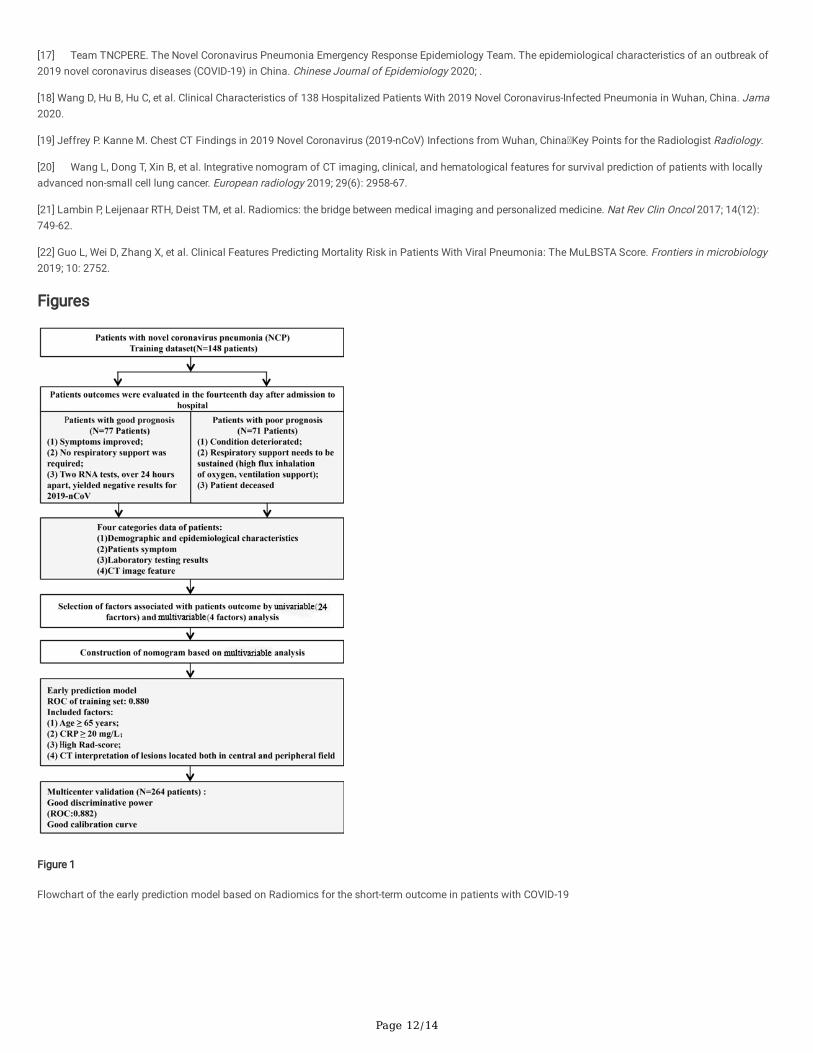
Figure 1
Flowchart of the early prediction model based on Radiomics for the short-term outcome in patients with COVID-19

Page 13/14
Figure 2
Radiomic features selection and radiomic signature building. (a, b) LASSO-regression analysis selected 6 prognostic features with non-zero coe�cient. (c)ROC curve of constructed radiomic signature based on linear combination of the extracted features with their respective coe�cients for distinguishingpatients’ outcomes in the training dataset. (d) ROC curve of constructed radiomic signature in the testing dataset. (e) ROC curve of constructed radiomicsignature in all patients.
Page 14/14
Figure 3
Construction and evaluation of nomograms for predicting patients’ outcomes based on factors selected from multivariable Logistic analyses in the trainingset. (a) Nomogram based on factors including age, lesion location, CRP and Rad-score. (b) Calibration curve of the nomogram scoring system in the trainingset; (c) ROC curve of patients’ total points based on nomogram for outcome prediction.
Supplementary Files
This is a list of supplementary �les associated with this preprint. Click to download.
Supplementarymaterial.docx