predatory versus productive government: the case of u.s
TRANSCRIPT
UC BerkeleyCUDARE Working Papers
TitlePredatory versus productive government: the case of U.S. agricultural policies
Permalinkhttps://escholarship.org/uc/item/21913950
AuthorRausser, Gordon C.
Publication Date1991-06-01
eScholarship.org Powered by the California Digital LibraryUniversity of California
, . CubAPe'
DEPARTMENT OF AGRICULTURAL AND RESOURCE ECONOMIC§j DIVISION OF AGRICULTIJRE AND NATURAL RESOURCES ~ITY OF CALIFORNIA AT BERKELEY ....
WORKING PAPER NO. 613 -PREDATORY VERSUS PRODUCTIVE GOVERNMENT:
TIlE CASE OF U.S. AGRICULTURAL POLICIES
by
Gordon C. Hausser
California Agricultural Experiment Station Giannini Foundation of Agricultural Economics
June, 1991
~/3
PREDATORY VERSUS PRODUCTIVE GOVERNMENT:
THE CASE OF U. S. AGRICULTURAL POLICIESt
Agricultural policy is a complex web of interventions covering output markets, input
markets, trade, public good investments, renewable and exhaustible natural resources,
regulation of externalities, education, and the marketing and distribution of food products. At
the level of the Federal government, these interventions have resulted in enormous
budgetary costs; 1 huge surpluses of farm products; major disputes with other countries;
distorted international markets; and benefits to special interests that are often highly
concentrated. The same programs, however, have been part of an agricultural sector whose
productivity over much of the last century has been spectacular.
Do these massive governmental interventions correct for market imperfections, lower
transaction costs, effectively regulate externalities, and enhance productivity? Or are these
programs the result of manipulation by powerful commodity or agricultural interest groups
actively engaged in rent seeking or directly unproductive activities (Buchanan and Tullock
1962; Krueger 1974; Bhagwati 1982)? In this latter perspective, agricultural interest groups
are presumed to behave much like the proverbial 800-pound gorilla-they walk where they
want; they stand where they want; they sit where they want; and they take what they want.
Even a superficial analysis of the wide cadre of agricultural policies demonstrates that
struggles and conflicts naturally emerge between public and special interests. A conceptual
formulation that attempts to explain or, for that matter, prescribe public policy emphasizing
only one of these interests is doomed to fail. Frameworks that neglect political forces and the
role of special interest groups will have little explanatory power. Similarly, models that
presume the government has no autonomy or any interest in the size of the economic pie will
also face serious limitations as explanatory, predictive, or prescriptive frameworks.
In the design and implementation of governmental policy, public and special interests
are inseparable. The two sets of interest emerge hand in hand when governments engage in
, ,
redistributional or efficiency enhancement activities. In some instances, the public interest
dominates special interests while, in other cases, redistributive transfers to politically
powerful interest groups overwhelm the public interest. In still other cases, limited
information and lack of transparency result in policy combinations that are designed to
confuse those who bear the burden of the redistributive policies.
To resolve conflicts that arise among various interest groups, the U.S. government has
often designed programs that appear incoherent, e.g., conservation (which requires the
retirement of vulnerable acreage) and price supports based on historical acreage (a transfer
mechanism that penalizes premature land retirement and creates incentives for
overutilization of vulnerable acreage). These apparent incoherences, however, are the direct
result of institutional arrangements that generate sufficient support for governmental action.
For U.S. agriculture, public and special interests have led to both the enhancement of
allocative efficiency through "productive policies" and the transfer of wealth and income to
special interests through "predatory policies." From an integrated political-economic
perspective, these two activities can be examined in terms of PESTs (predatory, or special
interest) and PERTs (productive, or public interest) policies. PEST policies, or political
economic-seeking transfers are meant to redistribute wealth from one social group to another
and are not explicitly concerned with efficiency. In contrast, PERTs, or political-economic
resource transactions, are intended to reduce transaction costs in the private sector by
correcting market failures or providing public goods; at least in design, they are neutral with
respect to distributional effects (Rausser 1982).
In this essay, we will argue that public policy in agriculture has been both "productive"
and "predatory." In fact, a historical review of public policy in agriculture reveals not only
tension between the PERT and PEST roles of the public sector but also some coordination
between these two types of activities. As different interest groups access, influence, and
pressure the political process, the government trades off PESTs and PERTs in its attempts to
acquire balance and secure political power. The rational process generates a portfolio of
-2-
~ r "t
productive (PERT) and predatory (PEST) policies. In such a world, the challenge for
economists is to design and advocate policies that are both economically productive and
politically sustainable.
History of Agricultural Policies
Over much of the last century and a half, the agricultural sector has been one of the most
innovative and productive sectors of the U.S. economy. A significant portion of this growth
can be traced to the provision of public goods and governmental investments in infrastructure.
State and Federal support of land-grant universities has had a positive influence on the level
and quality of human capital. Transportation system investments, water resource
developments, and land reclamation activities have all made significant contributions to
economic growth. Pavelis (1985) has estimated that the Federal government, " ... through
direct construction or indirect cost sharing, has created up to 1975 about 45 percent of the
value of all irrigation, drainage, and soil and water conservation facilities in the United
States. "
Federal programs for increasing growth in the agricultural sector actually began in the
second half of the 19th century. The period from 1850 through the early 1900s witnessed the
emergence of a number of important institutions aimed at lowering transaction costs in the
private sector, e.g., the Morrill Act of 1862 (Federal land grants to each state to establish
free public higher education through the Land Grant College system), the creation of the
U.S. Department of Agriculture in 1862 (an executive-cabinet-Ievel agency, focusing on
research, regulation, and information generation), the Hatch Act of 1887 (a system of
Agricultural Experiment Stations created by providing annual grants to each state for
agricultural research), and the Smith-Lever Act of 1914 (the Cooperative Extension Service
system of county agents). This early Federal government policy can largely be characterized
as long-run institutional development. Here, the Federal government was supplying quasi
public goods whose associated benefits and costs were widely dispersed.
-3-
The Cooperative Extension system of county agents, the American Farm Bureau (a
generic, private, voluntary farm organization), and the U. S. Department of Agriculture
(USDA) joined forces in promoting economic growth within the agricultural sector. The
grassroots organization represented by the county agent extension system proved to be an
effective mechanism for communicating new agricultural technologies and knowledge directly
to farmers in a systematic fashion. This organization also became the conduit for
communicating back to the USDA and the land-grant universities signals on farmers'
problems requiring research. As the future unfolded, however, this organization also became
an institution which helped sustain redistributive transfer policies.
A major resource promoting agricultural productivity has been the knowledge generated
by public sector investments in research. This knowledge generation has repeatedly been
shown to have significant influence on agricultural growth. Even so, the striking feature of
agricultural research policies has been the overwhelming evidence of underinvestment. As
Ruttan (1982) has shown, the rates of return to public good investments in agricultural
research justify much higher levels of public research support.
Following the emphasis on public research, education, and extension support,
legislation arose that focused on limited information and the undesirable levels of rural
infrastructure. This legislation covered rural delivery of mail, soil conservation, agricultural
credit, rural electrification, rural road building, and many other investments in the physical
infrastructure of agriculture. These growth-promoting policies generated benefits that were
not available to all citizens or even to all farms. There is little doubt that some laws were
administered to create selective benefits for specific groups. Accordingly, most of this
legislation led to the implementation of efficiency-improving policies whose costs were
widely shared but whose benefits were concentrated. Around the tum of the century, other
legislation regulating different aspects of agriculture had the purpose of lowering transaction
costs, e.g., fertilizer and seed standards, weights, animal health, and food safety.
-4-
, ,
Over the years, health and food safety has steadily increased in importance, especially
environmental pesticide policy. The origins of environmental pesticide policy can be traced to
the Federal Insecticide Act of 1910, initially developed to protect farmers from fraudulent
claims of insecticide salesmen (Bosso 1987). The argument can be made that this legislation
was introduced to lower the transaction costs resulting from imperfect information. From
these origins, 70 or so years later the agricultural regulatory portfolio of the
U.S. Environmental Protection Agency (EPA) can be traced. Today, this environmental and
health hazard regulatory portfolio includes surface water pollution; groundwater pollution; air
pollution; worker exposure to agricultural chemical inputs; endangered species (exposure to
the harmful effects of pesticides applied to the fields and crops in their habitat); and dietary
risk (pesticide residues may remain in agricultural products that reach the consumer).
Although the initial legislation was justified on economic efficiency grounds, the policy
that it spawned reflected political influence and power. Pesticide environmental policy of the
1950s and 1960s was firmly controlled by an agricultural chemical coalition comprised of the
chemical industry, the USDA, and the U.S. congressional committees (Bosso 1987; Mitchell
1979; Macintyre 1987). In the political science literature, this coalition is referred to as the
"Iron Triangle." As Wilson notes, however, most of these so-called coalitions "appear to be
made of metal far more malleable than iron" (Wilson 1980, pp. 391). As public awareness
began to increase, this coalition was challenged first by the Pesticide Control Amendment of
1954 that required any registered pesticide to have a tolerance level set by the U.S. Food and
Drug Administration (FDA) for acceptable residues. A far more important event, however,
was the passage in 1958 of the "Delaney Amendment" which states simply that no (food)
additive shall be deemed safe if it is found to induce cancer when "ingested by man or
animal." As expected, this Amendment was vigorously opposed by agricultural chemical
interests but without success; the Delaney Amendment passed easily.
Until the publication of Carson's (1962) Silent Spring, most people knew the benefits of
pesticides but very few had any knowledge of the possible environmental and health risks of
-5-
pesticide use (Perkins 1982). With the event of the thalidomide scare of 1962, the Carson
message was the beneficiary of increased credibility. Slowly, a new breed of environmental
activists emerged which turned to the court system to enforce the pesticide control laws that
had been enacted. In 1969, the Environmental Defense Fund won a case against the use of
DDT in the state of Wisconsin. As Bosso (1987) reported, this first state-level ban of DDT
"sent shock waves throughout the community, the chemical industry, and government at all
levels."
Shortly after the Nixon Administration's announcement in 1969 of its intent to phase out
all nonessential uses of DDT within two years, the weakened agricultural chemical coalition
of the 1960s was shattered. It lost its influence with the emergence in the early 1970s of an
environmental interest group armed with a number of significant events, anecdotal evidence,
and a responsive court system.. These interest groups have expanded their portfolio to
include the external effects of agriculture production on the nation's waters and wildlife
habitats in addition to the quality of food supply. The environmental interest groups have
helped usher in modern pesticide policies whose foundation includes the National
Environmental Policy Act of 1969, the Clean Air Act of 1970, and the establishment of the
U.S. Environmental Protection Agency (EPA) within the Executive Branch in 1970. In terms
of the political economy, a new coalition has emerged which consists of the environmental
interest group organizations, EPA, and members and committees of Congress without
agricultural ties.
Another instance of public policy originally justified on economic efficiency and equity
grounds is the case of western resource development. Initially, this development was viewed
as promoting economic growth by turning "wastelands" into valuable agricultural soils.
Because of the potential concentration of transfers resulting from these policies, the original
Federal Reclamation Act of 1902 limited the size of those farms which could receive low-cost
irrigation infrastructure and water to small-holder residents (160 acres per family member, or
a maximum of 480 acres per household). The intent of the original legislation was to ensure
-6-
that water projects benefited smaller farms rather than powerful land interests such as
railroads, oil companies, or land speculators. These water resource projects were designed
to be self-financed and project beneficiaries were expected to repay construction costs over a
lO-year period (Englebert and Scheuring 1982; Holmes 1979; Worster 1985).
As the future unfolded, political influence was exercised to alter the original provisions
of the 1902 legislation. As a result of one farm crisis following another over the period from
1915 through 1930, the self-fmancing features were eliminated and reclamation construction
funds were appropriated from the U.S. Treasury. Moreover, during the 1930s, through a
series of congressional enactments, the scope of reclamation policy was expanded to include
activities such as fish and wildlife habitat development, flood control, navigation, and
hydroelectric power generation and distribution. By the 1940s, the original intent of the 1902
legislation, to promote small-scale farmer settlement of the arid West, was all but forgotten.
The acreage limitation and residency provisions of the original legislation were never
enforced. Once the court system was called upon to examine this lack of enforcement, the
acreage limits were legislatively increased to 960 acres.2
The ambiguous public-interest versus self-interest legacy of Federal water policy can
also be seen in other agricultural programs. By the 1920s and 1930s, farmers became one of
the most well-organized economic interest groups, connected and represented by a national
system of county agents, the American Farm Bureau, and the USDA. The agricultural
depression of the 1920s, which foreshadowed the Great Depression, provided the stimulus
for this network to be more cohesive and effective in enhancing farm productivity and in
redistributing benefits to farmers. Farm interests during this period were able to legislatively
avoid a number of governmental interventions with exemptions from antitrust, labor, and tax
legislation. The Capper-Volstead Act of 1922 specifically exempted agricultural cooperatives
from some features of the Sherman antitrust legislation, allowing farmers to join together to
purchase inputs, to market their products, and even to agree on the amount of joint
production. For much of this century, farmers were exempt from minimum wage legislation.
-7-
Further, after World War II, farmers were the major beneficiaries of the Bracero Program
(temporary employment of Mexican aliens). In the case of special provisions in U.S. tax
codes for agriculture, we find cash accounting and a many tax shelter incentives for
investment in specific commodities.
Representative examples of legislation originally justified as productivity-enhancing
ways of correcting market failures but that ended up with strong elements of rent seeking
include policies regarding farm credit and soil conservation. Farm credit legislation set up a
system of farmer-owned cooperative banks, organized into 12 regional districts guaranteed
by the Federal government and composed of Federal land banks (long-term debt) and
production credit associations (short-term debt), and a bank for cooperatives. This
legislation was justified in some circles by market failures which led to less than an optimal
amount of credit being offered to the agricultural sector. It was argued, quite correctly, that
the government created a market failure through banking laws that prohibited the emergence
of national banks; state banks simply could not easily diversify the regional components of
agricultural lending risk. Adverse selection is also believed to exist in rural credit markets
due to heterogeneous endowments of farmers' abilities which are unknown to bankers or
investors. These and other alleged market failure arguments were used to justify the public
interest desirability of government sponsorship of the Farm Credit System.
Since the Farm Credit System lending was also restricted to the agricultural sector,
these institutions did not adequately address the problem of diversification. As the years
unfolded, it became clear that these institutions had an inherent conflict of interest. The
stockholders were also the borrowers. Stock equity in these institutions could not be freely
traded; in fact, it could be redeemed only by paying off loans. Furthermore, since dividends
were not paid, the most effective means for transferring any residual was by charging below
market rates of interest. Once interest rates rose dramatically in the early 1980s, the Farm
Credit System faced many of the same problems that plagued the U.S. savings and loan
industry, especially on their longer debt portfolio. Accordingly, farm credit interest rates rose
-8-
above market rates. More efficient farmers slowly exited the system, terminating their
stockholder interest as they paid off their loans. Farmers who could not secure credit from
other sources remained in the system.
In large part due to these structural problems, the Farm Credit System suffered losses
of over $2 billion per year in 1985 and 1986. Even as the losses mounted, however, lobbyists
spent millions of dollars arguing for system subsidies; and the Federal government bailed out
the farm credit system in 1988. Whether the Farm Credit System had originally aimed at a
market failure or not, it had developed its own political momentum for taxpayer transfers to
the farm sector and the institutions crated by the original 1914 legislation.
A striking example of masking special interests by references to the public interest
emerged with the passage of the Soil Conservation and Domestic Allotment Act of 1936. The
dust bowl of the 1930s, dramatized by John Steinbeck's The Grapes of Wrath, left the general
public with the perception that soil conservation was a serious social problem. The 1936
legislation marked the beginning of a long history of policies aimed both at commodity supply
management and soil conservation. Specifically, the Act enabled farmers to receive soil
conservation payments for reducing "soil-depleting" crops which, unsurprisingly, were also
surplus crops. The focus on conservation emanated from concern about preserving and
sustaining agricultural lands for future generations; "soil mining" and erosion; and "soil runoff'
externalities were viewed as contrary to the public interest.3
The Agricultural Act of 1956 continued the linking of commodity supply management
with soil conservation policy. The program which arose from this Act was divided into two
parts: a conservation reserve and an acreage reserve. The objective of the acreage reserve
was to reduce the amount of land planted to the so-called program crops: wheat, cotton, corn,
tobacco, peanuts, and rice. All farmers were eligible to participate in the conservation
reserve, which allowed conversions of whole farms from cropland to soil-conserving uses.
This program eventually enrolled nearly 30 million acres in the 1960s, moving marginal
cropland into permanent pasture, timber, or recreational uses under contracts for a maximum
-9-
of 10 years. It served the objectives of encouraging long-tenn adjustment of land and labor to
nonfann uses, soil conservation, and, to some degree, output management. However, almost
all of the land in this conservation reserve returned to production during the 1973-1975 boom.
In 1985, conditions were once again ripe for combining conservation and supply
management. Fann production was generating enonnous surpluses, and the environmental
lobby was increasingly more effective. As a result, under the 1985 Food Security Act, the
conservation reserve program reduced acreage bases of corn, wheat, and cotton by
1.1 percent, 2.5 percent, and 8.2 percent, respectively, from 1985/86 to 1987/88 (Tweeten
1989). As of 1990, approximately 34 million acres have been enrolled in the 1985
conservation reserve program
A number of important lessons have emerged from the evolution of commodity and soil
conservation policies since the 1930s. First, potential opposition can be generated for supply
control policies when they are masked by conservation policies that protect future
generations and promote environmental quality (e.g., the Soil Conservation and Domestic
Allotment Act of 1936, the Agricultural Act of 1956, and the Food Security Act of 1985).
These joint schemes achieve the greatest political success during times of depressed
markets. In rapidly expanding markets, public compensation for the implementation of
conservation practices does not generate sufficient political support. Furthennore, the
combining of commodity and resource policies is far more difficult if institutional investments
are not undertaken to establish an implementing organization, viz., the soil conservation
districts and/or the county agricultural adjustment committees (which, in 1981, were relabeled
the agricultural stabilization and conservation committees). These institutional
arrangements provide an effective organization through which local fanners and the Federal
government can join forces to implement soil conservation practices.
-10-
Redistribution to the Agricultural Sector
To this point, the discussion has emphasized policies that, even if they were sometimes
manipulated for purposes of redistributing income to the farm sector, were justified to some
degree by market imperfections. However, there are a variety of other agricultural programs
which primarily serve to redistribute income to the farm sector. The long history of these
redistributive agricultural policies began in explosive fashion with the passage of the
Agricultural Adjustment Acts of 1933, which has been revised. Mter a clarification of the
U.S. constitution by the Supreme Court, the initial legislation was restructured to admit
voluntary farmer participation and has continued to be revised every four years or so.
These redistributive programs implemented "coupled" or, equivalently, nonneutral
transfer schemes which linked government support directly to the amount produced. Since
these programs were tied to specific commodities, they led to farm political interest groups
becoming more specialized. As a result, the generic farmer organizations began to lose
influence. Direct economic benefits or losses were created by these programs for particular
groups which, in turn, generated significant incentives for active political involvement in
setting specific levels of commodity policy instruments. In effect, these groups became the
primary vehicle for political expression of farmer interests (Lowi 1965). Similarly, beginning
in the 1930s and through the postwar years, the USDA was transformed from an organization
that focused largely on research and education to a more conventional government agency,
managing programs which provide direct economic benefits to specific interests.
Initially, the major policy instruments for redistributing income to the farm sector were
price supports and public storage. Price supports were implemented through nonresource
government loans to farmers, and collateralized by the commodity within the specified period
of the loan. If market price fell below the loan rate (price support), the government took
ownership of the collateral; if not, the farmer could be expected to payoff the government loan
and redeem the commodity. Of course, these two instruments (price support and public
storage) were naturally tied: since price supports were generally set well above market
-11-
equilibrium prices, storage of the surplus was a necessary by-product.4 Price support
incentives combined with large increases in farm productivity-resulting, in part, from the
public investment in research--quite naturally led to huge surpluses.
With the commodity redistributive policies come, of course, deadweight losses and
contractions in economic growth. The range for these losses have been estimated for many
commodities on numerous occasions. Neglecting the waste generated from rent-seeking
behavior, an indication of the range of these deadweight loss estimates for selected
commodities is reported in Table 1 for a representative year over the period, 1985-1988. The
stylized facts emerging from such analyses (not only for the United States but other countries
as well) can be briefly summarized as follows: the redistribution of income to agriculture is
greater the richer or the more industrialized the country; the higher the cost of production; the
fewer the number of farmers, ab.solutely and relative to the total population; the more price
inelastic the supply or demand function; the lower the portion of total consumer budget spent
on food; and the "smaller" the exporting country or the "larger" the importing country
(Rausser and de Gorter 1989). In general, the accumulated evidence is that the commodity
specific policies instituted in the United States and other developed countries have created
significant distortions.
There are many margins for adjusting behavior both within production of a commodity as
well as across commodities, the effects of which seem to continually surprise both
policymakers and interest groups. In fact, U.S. agriculture policy has shown again and again
that no mix of policy instruments has been able to cover all the side effects. Since the 1930s,
this phenomenon has resulted in a piecemeal proliferation of policy instruments that address
the side effects of excess production. On the supply side, this proliferation includes the land
controls and land conservation mentioned earlier, along with production quotas, and other
tools; on the demand side it includes export subsidies and enhancements, concessional
foreign sales and food grants, and food stamps. Unfortunately, each additional policy
-12-
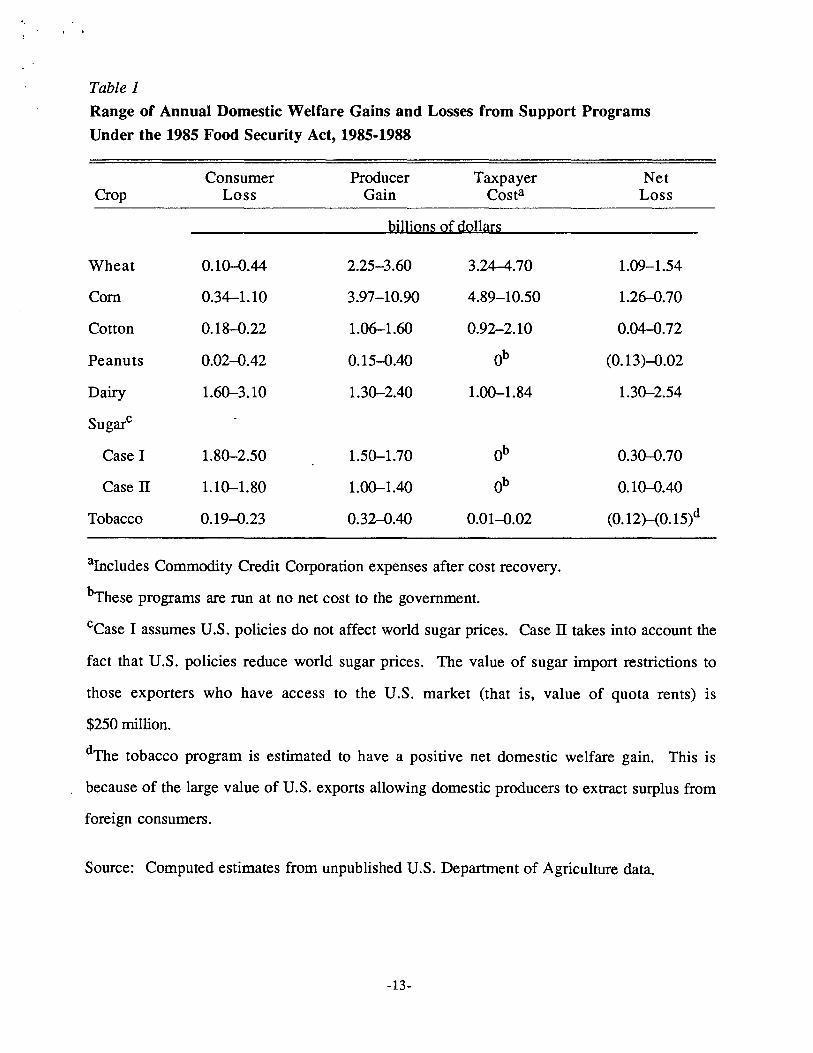
Table 1
Range of Annual Domestic Welfare Gains and Losses from Support Programs
Under the 1985 Food Security Act, 1985-1988
Consumer Producer Taxpayer Crop Loss Gain Costa
billions of dollars
Wheat 0.10-0.44 2.25-3.60 3.24-4.70
Com 0.34-1.10 3.97-10.90 4.89-10.50
Cotton 0.18-0.22 1.06-1.60 0.92-2.10
Peanuts 0.02-0.42 0.15-0.40 Ob
Dairy 1.60--3.10 1.30-2.40 1.00-1.84
SugarC
Case I 1.80-2.50 1.50-1.70 Ob
Case II 1.10-1.80 1.00-1.40 Ob
Tobacco 0.19-0.23 0.32-0.40 0.01-0.02
aIncludes Commodity Credit Corporation expenses after cost recovery.
bThese programs are run at no net cost to the government.
Net Loss
1.09-1.54
1.26-0.70
0.04-0.72
(0.13)-0.02
1.30-2.54
0.30-0.70
0.10-0.40
(0. 12)-(0. 15)d
cCase I assumes U.S. policies do not affect world sugar prices. Case II takes into account the
fact that U.S. policies reduce world sugar prices. The value of sugar import restrictions to
those exporters who have access to the U.S. market (that is, value of quota rents) is
$250 million.
dThe tobacco program is estimated to have a positive net domestic welfare gain. This is
because of the large value of U.S. exports allowing domestic producers to extract surplus from
foreign consumers.
Source: Computed estimates from unpublished U.S. Department of Agriculture data.
-13-
instrument brought unanticipated side effects that required still additional mechanisms for
containing the expanding capacity for commodity production.
Sometimes the side effects seem so obvious that policymakers can only have missed
them through sheer myopia. For example, the initial voluntary acreage reduction programs
focused on compliance requirements for a particular commodity, neglecting the fact that
farmers might substitute and grow other crops. In addition, it was sometimes possible for the
party that had demanded the original crop to substitute and use the new crop the farmer was
growing (Brandow 1977), as in the case where farmers might substitute between corn,
soybeans, oats, and sorghum. Of course, if too many restrictions on substitution are placed
on farmers, they will choose not to participate.
To understand how farmers can respond to coupled voluntary programs, it is important
to understand the mechanics of the income transfers. For some years, the major vehicle for
these transfers has been "deficiency payments." The government sets a target price for a
number of commodities. Target prices are set well above market prices which, of course,
encourages high program participation. The deficiency payment rate is computed as the
difference between the target price (set by law) and the higher of the price support or the
average market price received over the first five months of the marketing year. The payment
base is determined by the land base and "program yield" (based on the individual's or
counties' past yields) adjusted for any acreage production programs.s
Each farmer participating in the program has a payment base, detennined by the land
base (essentially how much land they have dedicated to the crop in the past) and "program
yield" (based on the individual's or counties' past yields). To receive the deficiency
payments, participating farmers must either allocate land to a crop in the program or to
conservation uses dictated by USDA. Moreover, until 1990, the enabling legislation has
generally required farmers to forego present and future program benefits if they harvest crops
other than the program crop for which they have a "land base." This feature was intended to
prevent a farmer from collecting Federal subsidies for not growing one crop, while growing
-14-
· .
another. It also has the effect of coupling income transfers to the planting and harvesting of
program crops.
Thus, the amount of deficiency payments to farmers is influenced by four potentially
different channels: target prices, price supports, the land resource base, and productivity.
Each of these four components provides incentives for augmenting output on the utilized land
base. Over the years, more flexibility has slowly been introduced and the amount transferred
has become increasingly less dependent on the actions, current and past, of farmers. For
example, until the 1986 market year, the expected program yield was determined as a moving
average of a farmer's past yields. One provision of legislation in 1985, however, was to
assign unalterable program yields. Thus, a farmer could no longer strategically influence this
variable.
The degree of coupling caused by price supports was also dramatically reduced with the
1985 legislation. The Secretary of Agriculture was given discretion in the case of feedgrains
and wheat to lower the price support up to 20 percent below the basic loan rate. For
soybeans, the loan rate can be lowered no more than 5 percent. For cotton and rice, the
effective loan rate is set at world market prices. As a result, cotton and rice farmers
participating in government programs could first pledge their output as collateral for a loan at
the basic rate and, at maturity, repay the loan at the prevailing world market price if it is
lower than the basic rate.
In the case of land base, current actions can still influence how a farmer's base is
computed. A producer of a program crop has an assigned "base" acreage of that crop, which
is derived from a 5-year moving average of plantings of that crop on the farm. As a result, it
is often optimal for a producer not to participate in a program for a time and to increase his
computed land base, in anticipation of higher future subsidies. Available evidence reveals
that producers with a low land base generally choose not to participate in the program,
whereas those with a high land base choose to participate.6
-15-
· .
The trend toward lowering entry barriers to production of program crops and the degree
of coupling at the margin was continued in the 1990 farm legislation. In comparison to
previous legislation, the flexibility provisions allow market signals to playa more significant
role in guiding production decisions. These provisions permit 15 percent of the land base (!lQ1
eligible for payments) to be planted to any program, any oil seed, any industrial or
experimental, or any other non program crop, except for fruits and vegetables.7 In addition to
the 15 percent "normal flex" provision, farmers are also allowed the option of an additional
10 percent flexibility. Subsidy payments are also lost on these acres as well as the
15 percent "normal" flex acres; but for both the "normal flex" and "optional flex" acres, the
land base is protected. Prior to 1990, the allocation of land to any nonprogram or other
program crops would have reduced by an equivalent amount that acreage that would enter the
5-year moving average process for determining land base.
That portion of the actual land base that is idled can be decided by each producer, and
each producer will rationally idle the least-productive land that he controls (whether as an
owner or a renter). This factor (plus the existence of nonparticipants) means that a program
which seeks to reduce acreage by a given amount normally reduces output by a substantially
smaller percentage. This phenomenon has been referred to in the literature as "slippage."
Different estimates of the amount of slippage range from 30 percent to as high as 60 percent
(Norton 1986; Tweeten 1989; Love and Foster 1990; Ericksen 1986).
Given the possibilities for manipulating output patterns, it should be clear that
predicting government agricultural spending is highly uncertain. Since the target price is set
by the legislation, the major sources of uncertainty are the support price, the land base, and
the participation rate. Prior to 1986, the level of productivity used in the computation of
deficiency payments was also uncertain over the planning horizon following each revision in
the basic Agricultural Adjustment Acts of the 1930s. Because of the uncertainties, it is not
surprising that the OMB and the USDA frequently generate point forecasts for government
expenditures which are widely off the mark. What is perhaps more startling, however, is
-16-
that, compared to other budgetary predictions, agricultural expenditures are forecast with
very high errors and have been systematically downward biased over the last few decades.
To be sure, there are incentives for underestimating the expected treasury costs in those
areas where the exposure is highly variable and the transfer recipients are distinctly more
powerful and better informed than those who share the burden for the transfers (i.e.,
taxpayers, consumers).
In an attempt to control government spending, as well as to address goals of
distributional equity, deficiency payments are limited to $50,000 per farm while loan deficiency
payments (based on the difference between the basic loan rate and the Secretary of
Agriculture's announced loan rate) were limited to $200,000 for the 1987 crop. Over the
years, however, many loopholes have allowed these payment limitations to be exceeded.
The loose definition of a "person" has fostered overlapping partnerships and other methods of
farm ownership that qualify for multiple payment limits. Accordingly, the number of "farmers"
in program-eligible commodities has increased over the last decade, while the number of
farmers producing commodities ineligible for subsidies has declined.
Despite these attempted limitations, the distribution of program benefits continues to be
viewed by many as inequitable. For the 1988 crop year, farms with sales above $100,000
received 57.6 percent of the direct government payments. As shown in Table 2, the
cumulative distribution of government payments reveals concentration among the largest
farming operations, with the average payment to all farmers having annual sales exceeding
$500,000 per year at approximately $40,000. Since many large farms do not produce
commodities eligible for government programs (approximately 25 percent of all farmland in the
United States is eligible for government crop programs), participating farms receive
considerably more than this figure. In fact, eligible farms in 1988 with sales above $500,000
received almost $900,000 as an average payment.
Unfortunately, many of the inputs used in agricultural production are joint, producing
valuable as well as undesirable outputs (Rausser 1974; Rausser and Lapan 1979).
-17-
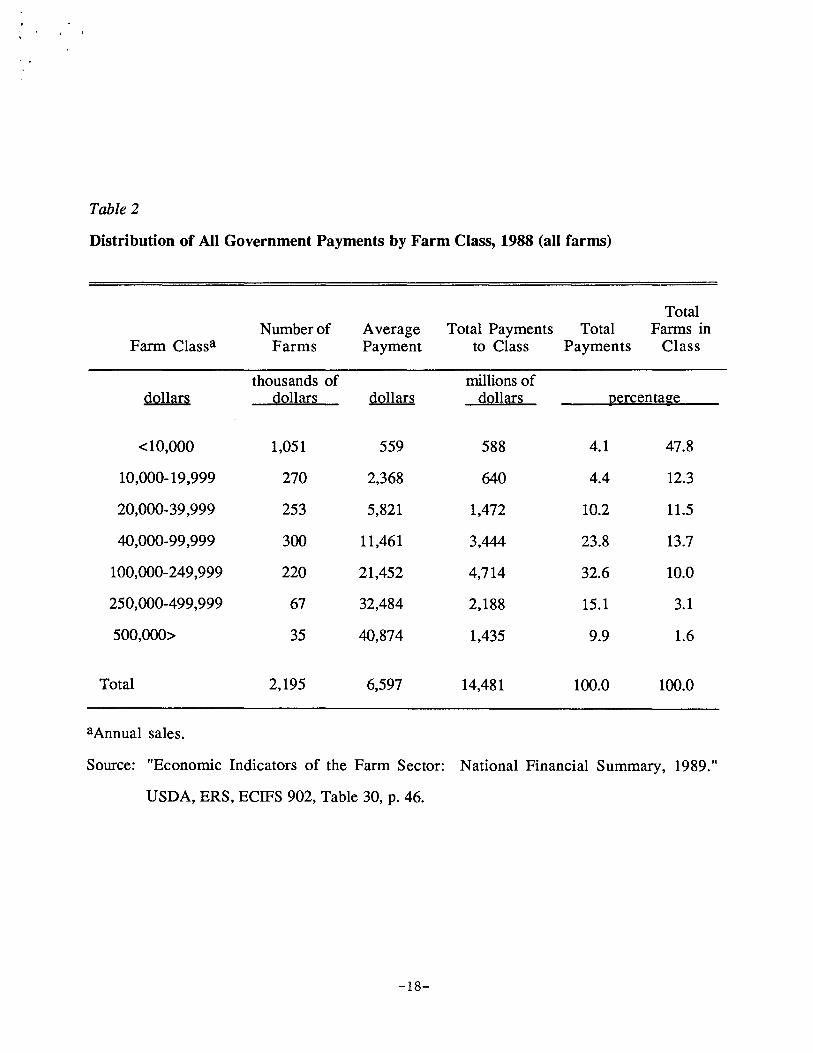
Table 2
Distribution of All Government Payments by Farm Class, 1988 (all farms)
Total Number of Average Total Payments Total Farms in
Farm Classa Farms Payment to Class Payments Class
thousands of millions of dollars dollars dollars dollarS percentage
<10,000 1,051 559 588 4.1 47.8
10,000-19,999 270 2,368 640 4.4 12.3
20,000-39,999 253 5,821 1,472 10.2 11.5
40,000-99,999 300 11,461 3,444 23.8 13.7
100,000-249,999 220 21,452 4,714 32.6 10.0
250,000-499,999 67 32,484 2,188 15.1 3.1
500,000> 35 40,874 1,435 9.9 1.6
Total 2,195 6,597 14,481 100.0 100.0
aAnnual sales.
Source: "Economic Indicators of the Farm Sector: National Financial Summary, 1989."
USDA, ERS, ECIFS 902, Table 30, p. 46.
-18-
, '
Encouraging agricultural production through coupled transfer schemes while requiring some
land be idled leads to excessive utilization of basic inputs. Residuals of excessive fertilizer
and pesticide applications combine with excess water and are transported into various water
sources. Toxic salts accumulate in agricultural land. Burning crop residues may result in air
pollution. These examples serve to illustrate the joint input feature of land, water, pesticides,
etc., leading to multiple products-some subset of which results in the degradation of
environmental resources.
Essentially, the land that is allocated to production of program crops is combined with
more pesticides and fertilizers than would otherwise be the case. Since farmers can receive
subsidies only on that land that is part of the farmer's program crop base, a disincentive is
created for rotating crops. Because crop rotation is a nonchemical technique for pest control,
the coupled transfer programs aggravate pesticide pollution by encouraging the substitution of
chemical for nonchemical pest control. While the empiricl)i.-wvidence on these effects is often
local, national estimates have been made for soil erosion rates from different types of farms.
For example, Reichelderfer (1985) has estimated an erosion rate of 9.2 tons per acre per year
as the average for nonparticipating (in government programs) farms while for all farms that do
participate and are recipients of nonneutral transfers, the average erosion rate is 14.7 tons
per acre per year. This difference between participating and nonparticipating farms is highly
significant. 8
Given the relationship between coupled transfers and the determined land base, acreage
that is suitable for the program crops becomes more valuable. These subsidized land values
encourage farmers to allocate available land to program commodity production. In some
instances, this has included land that is steeply sloped and thus highly erodible, as well as
wetlands that provide important wildlife habitat. Hence, coupled transfers based on land use
have created incentives for farmers to use land in ways that often increase adverse
environmental impacts. These concerns helped motivate the conservation reserve program of
the 1985 legislation and the planning flexibility provisions of the 1990 farm legislation. These
-19-
, '
most recent farm bills have established a trend toward reducing the linkages between
agricultural subsidies and farmers' production and land-use decisions. This has also reduced
the potential adverse environmental spillovers, and has slowly begun to reduce the entry
barriers that exist in the production of various commodities.
Other Side Effects
Since the United States is a large country on the world market for some commodities, its
price supports and accumulation of stocks can conceivably result in short-run favorable
consequences for all exporters of the commodity in question. Specifically, if the internal price
supports are so high as to effectively eliminate the export market as a relevant alternative to
U.S. production, all the benefits accrue to other exporting countries in the short run. Over
much of the post-World War II period, the United States has behaved as a residual supplier
on world markets of many major commodities, especially the food grains, cotton, and the feed
grains.
To the extent that various policies, e.g., protection against import competition (such as
quotas in the United States and variable levies in Europe), price support programs, coupled
subsidy transfers, and quotas of domestic marketing all induce greater production, however,
world prices will be depressed. This is particularly evident when the U.S. government sells
unwanted stocks on world market at less than the domestic price (through the Export
Enhancement Program), makes concessional sales, or simply donates the food as aid
(through PL480). These potential effects have been examined in a number of empirical
analyses (Tyers and Anderson 1986; Roningen and Dixit 1989; Zietz and Valdez 1986). For
example, Roningen and Dixit estimate that eliminating U.S. agricultural policies would
increase world dairy product prices by 23.5 percent, sugar by 22.8 percent, coarse grain by
11.6 percent, wheat by 10.6 percent, rice by 2.9 percent, ruminant meats by 3.8 percent, and
nonruminant meats by 3 percent. This would lead to corresponding costs for consumers and
benefits for producers in the rest of the world.
-20-
One justification often expressed in support of price floors and public storage programs
in the United States and in other industrialized countries is that they stabilize what would
otherwise be an unacceptable domestic volatility in basic commodity prices, at least over the
very short run. Ironically, these same policies amplify rather than dampen commodity price
fluctuations on international markets. On glaring example of this phenomenon is the world
sugar market. The European Community (EC) and the United States have both accepted
increasing market distortions and have not adjusted their policies to changing economic
conditions. These policies have been estimated to have increased price instability in the
residual world market for sugar by approximately 25 percent (World Bank 1986 World
Development Report, 1986). Moreover, because the United States has been dominant in the
world sugar trade, the imposition of import quotas has lowered world sugar prices. Not
surprisingly, EC and U.S. sugar policies have also placed significant burdens of adjustment on
many developing countries. The World Bank's 1986 World Development Report has
estimated that sugar policies of industrialized countries cost developing countries about
$7.4 billion in lost export revenues during 1983 and reduced their real incomes by about
$2.1 billion. In the case of world wheat prices, Schiff (1985) has estimated that the variability
could be reduced by 48 percent if all countries were to end their subsidization of wheat. Tyers
and Anderson (1986), using a model simulating policy reform in more than a half dozen
commodity markets, have calculated that liberalization of agriCUltural policies of industrialized
countries would substantially reduce the international price variability of major temperate
zone commodities: wheat by 33 percent, coarse grains by 10 percent, rice by 19 percent;
sugar by 15 percent, and dairy products by 56 percent.
The inflexible settings of price supports and target prices in the early 1980s followed the
favorable economic decade of the 1970s. The coupled transfer policies augmented the degree
of overexpansion within the U.S. agricultural sector, making the sector especially vulnerable
to the unanticipated interest rate, exchange rate, and growth rate scenarios of the early 1980s
(Rausser et al 1986). Associated with these unintended side effects of inflexible transfer
-21-
schemes is the "mining of the soil" that many farmers engaged in during the 1980s in order to
survive financial stress (Foster and Rausser 1991). Similar mining of the soil occurred to
generate the production history that would serve to enhance a farmer's position with respect
to future coupled transfers.
Partially because of the nature of the coupled transfers, one production record after
another was broken during normal weather years of the 1980s. In 1983, commodity-specific
certificates were offered in lieu of cash transfers and became a means for releasing public
stocks held in the farmer-owned reserve. This farmer-owned reserve (established by the
1977 legislation) was designed as a means of keeping public stocks off private markets until
prices rose sufficiently that farmers would be motivated to sell their stocks or still higher
prices where the government would force their release. In 1986, generic commodity
certificates were introduced in place of commodity specific certificates up to the level of
available stocks.
Accounting for PESTs and PERTs
One measure of the degree of government intervention across commodity groups can be
represented as a "producer subsidy equivalent" (PSE), the ratio of the total value of all public
sector assistance to total farmer receipts. As shown in Table 3, the degree of government
intervention is most dramatic for products where demand is inelastic, e.g., sugar, milk, rice,
and wheat. Feed grains have an intermediate level of support while sectors with more elastic
demands, such as soybeans and red meats, have the lowest level of support.9
The decomposition of the public sector assistance into productive (PERT) and predatory
(PEST) forms of government policy is also reported in Table 3. The productive category
includes all expenditures by the public sector that are expected to lower transaction costs and
enhance the rate of economic growth, e.g., public-good expenditures, information and
marketing services, grades and standards inspections, crop insurance, public research,
extension, etc. For the PEST category, all redistributive transfers from other segments of the
-22-
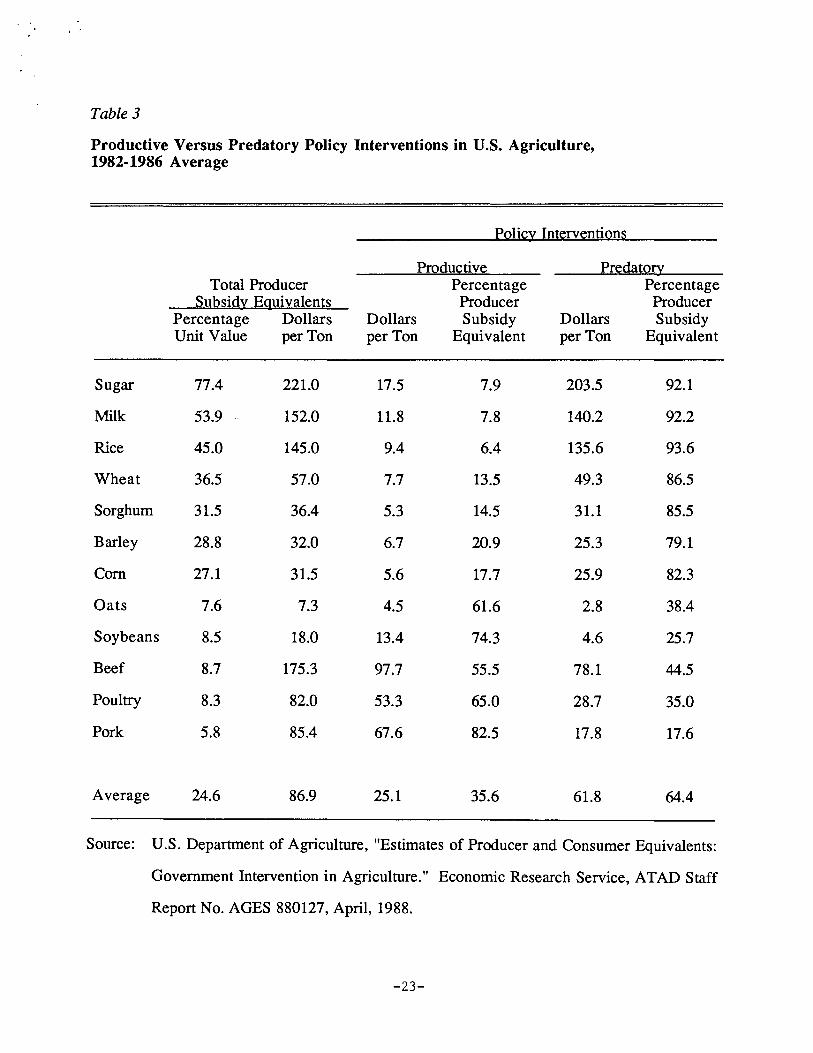
Table 3
Productive Versus Predatory Policy Interventions in U.S. Agriculture, 1982·1986 Average
Policy Interventions
Produ~tiv~ Pr~dalory Total Producer Percentage Percentage
Sllb~idy Eguiv/!lents Producer Producer Percentage Dollars Dollars Subsidy Dollars Subsidy Unit Value per Ton per Ton Equivalent per Ton Equivalent
Sugar 77.4 221.0 17.5 7.9 203.5 92.1
Milk 53.9 152.0 11.8 7.8 140.2 92.2
Rice 45.0 145.0 9.4 6.4 135.6 93.6
Wheat 36.5 57.0 7.7 13.5 49.3 86.5
Sorghum 31.5 36.4 5.3 14.5 31.1 85.5
Barley 28.8 32.0 6.7 20.9 25.3 79.1
Com 27.1 31.5 5.6 17.7 25.9 82.3
Oats 7.6 7.3 4.5 61.6 2.8 38.4
Soybeans 8.5 18.0 13.4 74.3 4.6 25.7
Beef 8.7 175.3 97.7 55.5 78.1 44.5
Poultry 8.3 82.0 53.3 65.0 28.7 35.0
Pork 5.8 85.4 67.6 82.5 17.8 17.6
Average 24.6 86.9 25.1 35.6 61.8 64.4
Source: U.S. Department of Agriculture, "Estimates of Producer and Consumer Equivalents:
Government Intervention in Agriculture." Economic Research Service, ATAD Staff
Report No. AGES 880127, April, 1988.
-23-
economy to agricultural producers, e.g., deficiency payments, price supports, storage
subsidies, subsidized credit, etc., are incorporated.
Note that the products with inelastic demands (sugar, milk, and rice) receive a lower
proportion of their public support in the form of productive policies, while the products with
elastic demand (soybeans and meats) receive a higher proportion of their support in the form
of productive policies. The data is consistent with the view that coupled predatory policies
are higher in sectors whose demand is inelastic and whose supply is very responsive to
policies and lower in sectors with highly elastic demand and low supply elasticities. For
some products that do not appear in Table 3, e.g., specialty perennial crops whose demand is
highly elastic, but whose productivity and supply response is low, coupled predatory policies
do not generally exist. Instead, for these speciality crops, producer organizations tax their
members to finance the provision of local public goods (de Gorter, Nielson, and Rausser
1992).
For the case of public good investments and predatory coupled transfers, it has been
shown that, if a productivity-enhancing policy harms producers because of highly inelastic
demand and responsive supply, but producers have more political clout than other interest
groups, the amount of public-good investment will be inadequate (de Gorter, Nielson, and
Rausser 1992). However, the political obstruction to public-good investments can be
countered with coupled subsidies, thus leading to less underinvestment in public goods than
would otherwise be the case. In a political economic context, a world of predatory subsidies
may lead to greater investment in productive policies than a world without such subsidies. In
effect, since productive policies may harm members of special iIlterest groups, compensation
through predatory subsidies may offer a means of making the pursuit of the public interest
politically viable (Rausser and Foster 1991). Treated as a separable activity, predatory
subsidies appear as inefficient, rent-seeking-based policies. However, when combined with
productive policies, especially in a world of heterogeneous producers, coupled predatory
subsidies can result in misalignment of incentives among members of formerly political
-24-
powerful interest groups and thus less opposition to the to the implementation of a public
good policy (Foster and Rausser 1992).
Models that consider different configurations of supply-and-demand parameters,
productivity, and the relative political power of producer groups can find that productive
policies are either over- or undersupplied. The interesting issue is whether transfers that
may seem only predatory at first glance may actually be politically necessary if society is to
more closely approach the optimal configuration of productive policies. To be sure, PEST
policies can be aimed at offsetting the redistributive consequences of productivity-enhancing
policies.
Political influence also operates through the public sector by frequently slowing down
the redistribution of income generated by changing market conditions. Accordingly, markets
with highly inelastic demand-and-supply conditions as well as rapidly changing technologies
are those markets which generate rapidly fluctuating incomes and thus a demand for public
sector "stabilization." In a world of limited knowledge of how economic systems operate,
producer-interest groups have successfully argued that "price stabilization" programs are in
the public interest. In this instance, interests who share the burden of financing such
programs are led to believe that such policies are PERTs. The attributes of such policies are
used to mask what ever predatory phenomena may be taking place. The use of PERT-like
public policies to mask predatory transfers is a frequently observed policy mix in agricultural
sectors throughout the world, e.g., conservation and commodity subsidies, food security and
self-sufficiency, instability and subsidized public storage, and so on.
The Search for Politically Robust Reform
The challenge for economists in agricultural policy, as in other areas, is to identify policy
reforms that make economic sense and are politically robust. In the past, the best the
economic literature has been able to offer in the design of democratic decision-making
frameworks is to separate the processes for each of the two types of policies: PERTs and
-25-
· '
PESTs. Long ago, Wicksell (1896) recognized the distinction between these types of
policies and argued for organizing government so that the provision of the two types of
policies would be decided by separate and qualitatively different processes. Mueller (1989),
in his recent survey of the literature, outlines the conceptual and practical advantages of
considering the two types of policies separately.
However, whatever the issues of analytical convenience, it is now being recognized that
political and economic forces must be jointly considered in matters of both design and
implementation of public policies (Rausser 1982). Much recent investigation has been
devoted to theoretical and empirical models of public sector decision making in an attempt to
accomplish this task. Readers interested in these issues from a general perspective might
begin with Becker (1983, 1985); Peltzman (1976); and Zusman (1976). Those interested in
applications to agricultural policy in particular might begin with Gardner (1987), Rausser and
de Gorter (1989), Foster and Rausser (1992), and de Gorter, Nielson, and Rausser (1992).
The purpose of the latter models is to explore ways in which PERT and PEST policies are
simultaneously determined.
One especially interesting result of this work has been to emphasize that, just as the
many margins for adjustment can make it difficult to enact programs which limit the
redistributional effects of farm policy, they can also weaken the coalitions for rent-seeking
policies. In a dynamic setting, the unintended side effects of policy often result in a
proliferation of policy instruments, each attempting to control a different margin of action.
This proliferation process may appear to be piecemeal and haphazard, but it often turns out
that the process is welfare improving. To the extent that a piecemeal policy may reduce the
distortionary effects of an existing policy, the second policy in combination with the fIrst may
obviously result in greater effIciencies. Moreover, disagreements over unintended side
effects become initial conditions for the next round of legislation structuring U. S. government
intervention in agriculture, making coalitions more malleable.
-26-
Economists have only begun to scratch the surface of the problem of developing
operational frameworks for blending productive and rent-seeking policies. In general, work in
this area must recognize that these two types of policies go hand in hand; frequently,
predatory policies are offered as compensation to those that are harmed as a result of the
implementation of productive policies. Just as frequently, productive, or what may only
appear to be PERT policies are structured to mask the redistributive mechanisms put in place
by PEST policies.
Operational prescription must recognize not only the economics of various policies, but
also how the distribution of political power will affect the sequence of policy steps.
Differences in the distribution of political power will often be critical in reforming policies to be
more productive and less predatory (Rausser and Zusman, 1992). There will be situations
where the political timing may be especially ripe, perhaps because of an economic crisis
caused by outside factors, to change the institutional structure of agricultural programs. This
was certainly true in the mid-1980s when macroeconomic and international phenomena
helped spawn a crisis in the U.S. agricultural sector. In the midst of this crisis, political
entrepreneurship emerged which led to some governmental autonomy in the design of the
1985 Food Security Act as well as the subsequent 1990 Farm Act. The lowering of economic
barriers and the enhanced planning flexibility introduced by these two pieces of legislation
cannot be explained by the Stigler, Pelzman, or Becker formulations of governmental
intervention and regulation.
Opportunities for restructuring the tradeoff between the public and special interests
policies have often appeared greatest during times of economic crises. However, the
sustainability of the restructured tradeoffs and the new mix of productive and predatory
policies has been shown time and time again to depend critically upon changes in the
underlying institutional configuration. One excellent example of institutional changes that
may alter the level and distribution of political power in the case of U.S. agricultural policy
may arise from the current GATT negotiations. In the Uruguay Round of the GATT
-27-
negotiations, it was accepted early by all parties that distortionary trade policies in
agriculture exist to rationalize internal country policies; thus, both sets of policies should be
included in the negotiations. Accordingly, a number of proposals have been tabled in Geneva
for reducing internal country coupled PEST policies and substituting PERT policies (Rausser
1992). In the case of the U.S. government, this substitution process has been proposed to
occur over a 10-year adjustment period. This means, of course, that the interest-group
configuration after the completion of the GATT negotiations could be dramatically different
than the political landscape that has existed over much of the prior 50 or so years. The
coalition of interest groups that are likely to determine whether a GATT agricultural code is
accepted or rejected will not be dominated by the same interests that have prevailed in past
debates over farm legislation. If the GATT agreement is accepted by the U.S. Congress, the
executive branch will, no doubt, lean on the external code to mandate reforms of the current
domestic agricultural policy.
-28-
• <
..
Footnotes
tGordon C. Rausser is the Robert Gordon Sproul Distinguished Professor, Department of
Agricultural and Resource Economics, University of California at Berkeley.
The author is especially thankful to Harry de Gorter, William E. Foster, Carl Shapiro, Joe
Stiglitz, and Timothy Taylor for a number of useful comments and suggestions.
IBetween 1981 and 1985, the federal government spent about $60 billion on farm-price and
income-support programs. In 1986 alone, the actual cost of Commodity Credit Corporation
activities to support the agricultural sector was $25.9 billion. Other programs also support
agriCUltural production in rural America. In 1986, the outlays for these programs amounted to
approximately $14 billion, of which the largest single item was the Farmer Home
Administration outlay at $7.3 billion. Again in fiscal year 1986, the value of commodities
exported under PL480 (both Titles I and II) amounted to $1.4 billion, $2.5 billion of export
guarantees were provided, and the export enhancement program that subsidizes
U.S. agricultural sales abroad cost the U.S. government nearly $0.75 billion. In the domestic
market, food assistance programs cost $18.6 billion in fiscal year 1986; the bulk of this
expenditure supported the Food Stamp Program and the Women, Infants and Children
Feeding Program. Finally, as a result of special legislation in December, 1987, the
U.S. government assumed a contingent liability for the Farm Credit System (composed of the
Federal Loan Bank, the Production Credit Association, and the Bank for Cooperatives) of
$4 billion. In 1989, the outlays of the Commodity Credit Corporation fell to $10.6 billion.
2The major implementing agency for the western water resource development has been the
Federal Bureau of Reclamation. The water supplied by this Bureau at heavily subsidized
rates to agriculture explains why the irrigation of just two California crops, alfalfa and cotton,
takes as much water as is annually allocated to to the State's entire population of 30 million.
-29-
· '
3The U.S. Department of Agriculture has estimated that some 2 to 3 billion tons of soil are
lost to erosion in the United States each year. Contrary to many popular press reports, this
level of erosion is not ruining American farmland. This is simply because topsoil is a
renewable resource; it can be replaced by organic matter from crop residues. As a result, the
rate of net loss of topsoil in the United States is, in fact, very small. The pollution effects of
soil erosion are a different matter; these impacts arise as offsite effects of wind and water
erosion. Wind erosion contributes to particulate air pollution and has been estimated to cost
$4 billion or more in annual damages in the Western United States, while erosion caused by
water runoff has been a major contributor to water pollution resulting in damages estimated
to range from $5 billion to $18 billion annually (Economic Report of the President, 1990).
4This was implemented through a non-resource loan program where the loan rate became,
in effect, the price support.
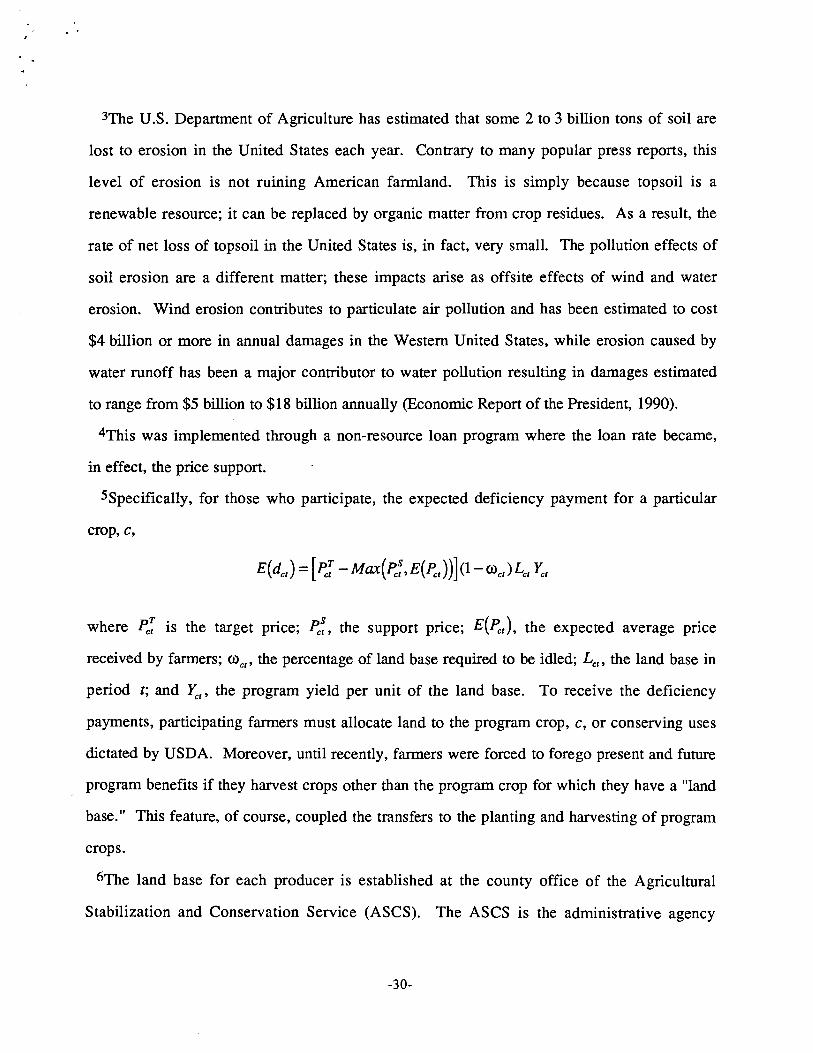
5Specifically, for those who participate, the expected deficiency payment for a particular
crop, c,
where ~; is the target price; ~~, the support price; E(~t), the expected average price
received by farmers; Olet' the percentage of land base required to be idled; Let' the land base in
period t; and ¥;;t' the program yield per unit of the land base. To receive the deficiency
payments, participating farmers must allocate land to the program crop, c, or conserving uses
dictated by USDA. Moreover, until recently, farmers were forced to forego present and future
program benefits if they harvest crops other than the program crop for which they have a "land
base." This feature, of course, coupled the transfers to the planting and harvesting of program
crops.
6The land base for each producer is established at the county office of the Agricultural
Stabilization and Conservation Service (ASCS). The ASCS is the administrative agency
-30-
· .
within the U.S. Department of Agriculture that has responsibility for implementation of the
deficiency payments. It has an office in each state and 3,000 county offices nationwide. In
addition to several thousand employees, a local committee of three persons (usually
producers) handles local appeals of decisions and other administrative matters. County
offices assign each local producer a program yield as well as a land base.
7The latter barrier to entry is a reflection of the political influence of California fruit and
vegetable growers.
8Due to the complex measurement problem that arises in the monitoring and estimating
environmental bads, Pigorian taxes based on marginal damages are impractical (Rausser and
Howitt, 1975). As a result, both measurement or information policies must be put in place
with environmental standards, taxes, or control policies (Hochman and Zilberman 1979,
Rausser and Lapan 1979).
9For a survey of own-price elasticity estimates, see de Gorter, Nielson, and Rausser
(1992). At the farm level, the most demand-inelastic commodities are sugar, milk, and rice;
those commodities with intermediate degrees of demand-price inelasticity are wheat,
sorghum, barley, corn, and oats; and finally, those that have the least degree of inelasticity
and, in some instances, elastic demand functions have been estimated, include soybeans,
beef, poultry, and pork.
-31-
References
Becker, G. S. "A Theory of Competition Among Pressure Groups for Political Influence,"
Quarterly Journal of Economics, 1983,58, pp. 371-400.
Becker, G. S. "Public Policies, Pressure Groups, and Dead Weight Costs." Journal of Public
Economics, 1985,28, pp. 329-47.
Bhagwati, J. "Directly Unproductive, Profit-Seeking (DUP) Activities." Journal of Political
Economy, October 1982,90, pp. 998-1002.
Bosso, C. J. Pesticides and Politics: The Life Cycle of a Public Issue. Pittsburgh:
University of Pittsburgh Press, 1987.
Brandow, G. E. "Part ill, Policy for Commercial Agriculture 1945-71." In L. R. Martin, ed.,
A Survey of Agricultural Economics Literature, Vol. 1. Minneapolis: University of
Minnesota Press, 1977.
Buchanan, J. M., and G. Tullock. The Calculus of Consent. Ann Arbor: University of
Michigan Press, 1962.
Carson, R. Silent Spring. New York: Fawcett Publications, Inc., 1962.
Council of Economic Advisors. Economic Repon of the President, 1990. Washington, D.C.:
U.S. Government Printing Office, pp. 198-207.
de Gorter, H., D. Nielson, and G. Rausser. "Productive and Predatory Public Policies:
Research Expenditures and Producer Subsidies in Agriculture." American Journal of
Agricultural Economics, forthcoming, 1992.
Englebert, E. A., and A. F. Scheuring, eds. Competition for California Water: Alternative
Resolutions. Berkeley: University of California Press, 1982.
Ericksen, M. H. "The Use of Land Reserves to Control Agricultural Production." Publication
ERS-635. Washington, D. c.: USDA, E.R.S., September 1986.
Foster, W. E., and G. C. Rausser. "Price-Distorting Compensation Serving the Public
Interest." Public Choice, forthcoming.
-32-
Foster, W. E., and G. C. Rausser. "Fanner Behavior Under Risk of Failure." American
Journal of Agricultural Economics, 1991, 73, pp. 276-288.
Gardner, B. L. "Causes of U. S. Fann Commodity Programs." Journal of Political Economy
1987, 95, pp. 290-310.
Hochman, E., and D. Zilberman. "Examination of Environmental Policies Using Production
and Pollution Microparameter Distributions." Econometrica, 1978,4, pp. 739-60.
Holmes, B. H. "History of Federal Water Resources Programs and Policies, 1961-70."
Misc. Publication No. 1379, Washington, D.C.: U.S. Department of Agriculture, 1979.
Krueger, A. D. "The Political Economy of the Rent-Seeking Society." American Economic
Review, 1974, 64, pp. 291-303.
Love, A., and W. Foster. "Commodity Program Slippage Rates for Com and Wheat."
Western Journal of Agricultural Economics, December 1990, 15, pp. 272-87.
Lowi, T. J. "How Fanners Get What They Want." In Lowi, T. J., ed., Legislative Politics
USA. New York: Little, Brown, Inc., 1965, pp. 132-39.
Macintyre, A. A. "Why Pesticides Received Extensive Use in America: A Political Economy
of Agricultural Pest Management to 1970." Natural R~sources Journal, Summer 1987,
27, pp. 533-78.
Mitchell, R. C. "National Environmental Lobbies and the Apparent lllogic of Collective
Action." In Russell, C. S., ed., Collective Decision Making: Applications From Public
Choice Theory. Baltimore: Johns Hopkins University Press, 1979, pp. 87-121.
Mueller, D. C. Public Choice II. New York: Cambridge University Press, 1989.
Norton, N. W. "The Effect of Acreage Reduction Programs on the Production of Com, Wheat,
and Cotton: A Profit Function Approach." Presented at the American Economics
Association annual meetings in Reno, Nevada, July 1986.
Pavelis, G. A. "Natural Resource Capital Formation in American Agriculture: Irrigation,
Drainage, and Conservation, 1955-1980." Washington: U.S. Department of
Agriculture, ERS, 1985.
-33-
, .
• Peltzman, S. "Toward a General Theory of Regulation." Journal of Law and Economics,
1976, 211, 211-40.
Perkins, J. Insects, Experts, and the Insecticide Crisis. New York: Plenum Press, 1982.
Rausser, G. C. "Technological Change, Production, and Investment in Natural Resource
Industries." American Economic Review, 1974, 64, pp. 1049-59.
Rausser, G. C. "Political Economic Markets: PESTs and PERTs in Food and Agriculture."
American Journal of Agricultural Economics, December, 1982,64, pp. 821-33.
Rausser, G. C. (ed.) The GAIT Negotiations: The Political Economy of Policy Reform.
Berlin,Heidelberg, and New York: Springer-Verlag, forthcoming, 1992.
Rausser, G. C. and H. de Gorter. "Endogenizing Policy in Models of Agricultural Markets."
In Alan Maunder and Alberto Valdes, eds., Agriculture and Governments in an
Interdependent World. Oxford: Oxford University Press, 1989, pp. 259-74.
Rausser, G. C. and W. E. Foster. "The Evolution and Coordination of U. S. Commodity and
Resource Policies." In Commodity and Resource Policies in Agricultural Systems,
edited by R. E. Just and N. Bockstael. Berlin, Heidelberg, New York: Springer-
Verlag, pp. 17-45, 1991.
Rausser, G. C. and R. Howitt. "Stochastic Control of Environmental Externalities." Annals
of Econ and Social Measurement, 1975,4, pp. 227-92.
Rausser, G. C. and H. Lapan. "Natural Resources, Goods, Bads, and Alternative
Institutional Frameworks." Resources and Energy, 1979,2, pp. 293-324.
Rausser, G. C., J. A. Chalfant, H. A. Love, and K. G. Stamoulis. "Macroeconomic Linkages,
Taxes, and Subsidies in the U.S. Agricultural Sector." American Journal of
Agricultural Economics, 1986,68, pp. 399-412.
Rausser, G. C., and P. Zusman. "Public Policy: Explanation and Constitutional Prescription."
American Journal of Agricultural Economics, forthcoming.
Reichelderfer, K. "Do U.S.D.A. Farm Programs Contribute to Soil Erosion?" Washington,
D. C.: U.S. Department of Agriculture, Ag. Econ Report No. 532, 1985.
-34-
Roningen, V. 0., and P. M. Dixit. "Economic Implications of Agricultural Policy Refonn in
Industrial Market Economics." U.S. Department of Agriculture Staff Report,
AGES 89-36, Washington, D. c., 1989.
Ruttan, V. W. Agricultural Research Policy. Minneapolis: University of Minnesota Press,
1982.
Schiff, M. "An Econometric Analysis of the World Wheat Market and Assimilation of
Alternative Policies, 1960-80." Staff Report AGES-850827, U.S. Department of
Agriculture, ERS, International Economics Division, 1985.
Tweeten, L. "Adjustments in Agriculture and Its Infrastructure in the 1990s." In Positioning
Agriculture for the 1990s: A Decade of Change. Washington: National Planning
Commission, 1989.
Tyers, R., and K. Anderson .. "Distortions in World Food Markets: A Quantitative
Assessment." Paper prepared for the World Bank, World Development Report 1986.
Washington, D. C., 1986.
Wicksell, K. "A New Principle of Just Taxation," Finanztheoretische Untersuchungen, Jena,
1896. Reprinted in Musgrave and Peacock, eds., Classics in the Theory of Public
Finance, New York: St. Martin's Press, 1967.
Wilson, J. A. (ed.) The Politics of Regulation New York: Basic Books, 1980.
The World Bank. World Development Report 1986. New York: Oxford University Press,
1986.
Worster, D. Rivers of Empire: Water, Aridity, and the Growth of the American West. New
York: Pantheon Press, 1985.
Zietz, J., and A. Valdez. "The Costs of Protectionism to Developing Countries." World Bank
Staff Working Papers No. 769, Washington, D. C.: The World Bank, 1986.
Zusman, P. "The Incorporation and Measurement of Social Power in Economic Models,"
International Economic Review, 1976, 17, pp. 447-62.
-35-