precision surveying monitoring of shoring and...
TRANSCRIPT
1
PRECISION SURVEYING MONITORING OF SHORING AND
STRUCTURES
Colin J. Hope1, Marcelo Chuaqui
2
ABSTRACT: This paper provides a synopsis of the state of practice of manual total
station movement monitoring. Different variables such as instrument used, accuracy
under varying and challenging conditions, sources of error, establishment of accurate
baseline readings, set-up and control of survey networks, and reporting, distribution
and archiving of data are examined. A specific project located in downtown Toronto
provides an example of practical and technical aspects of precision survey
monitoring. The excavation for the project was seven-stories deep and occupied an
old, open parking lot next to several sensitive and/or significant buildings. Sixty-five
targets placed on surrounding structures were monitored with a total station
theodilite. Inclinometers, crack-gauges and preconstruction condition surveys of
abutting structures were also part of the monitoring for the excavation portion of the
project.
INTRODUCTION
Surveyors involved in the monitoring field have most likely learned the benefits of
monitoring structures and shoring during their career. However, due to the many
variables that encroach on the physical world, surveyors must be extremely cautious
with the management of errors and must have an understanding of which variables
can affect readings. In field applications, precision surveying monitoring is used to
protect lives, provide cost savings, verify design assumptions and reduce risks. In
theory, these are simple and easy benefits to realise. In practice, these benefits may be
difficult to measure and record due to site conditions, access problems, ignorance,
and budgetary constraints.
1 Survey Manager, L.S., Monir Precision Monitoring Inc., 2359 Royal Windsor Drive, Unit 25,
Mississauga, ON, Canada, L5J 4S9, [email protected] 2 General Manager, M.Sc., Monir Precision Monitoring Inc., 2359 Royal Windsor Drive, Unit 25,
Mississauga, ON, Canada, L5J 4S9
2
VARIABLES AFFECTING PRECISION SURVEYING MONITORING
Instrument Selection
While there are many Total Stations on the market, many are not sufficiently precise
for most monitoring applications. A precision instrument is generally one with
published specifications of +/-1mm per 100 metres or less in the Electronic Distance
Measurement (EDM) and 1 second or less in the angular measurement. Instruments
with this level of precision all contain dual-axis compensators, which compensate for
3 to 6 minutes of movement. Manufacturers of these instruments include Leica,
Sokkia, Topcon and Trimble. In practice, it has been found that high precision
instruments with the finest accuracy do not add value to the monitoring data. Highly
sensitive instruments tend to be too sensitive when used on typical construction
projects, since the environmental conditions are not generally controlled. Vibrations,
temperature changes, movement in reference points, and unstable ground conditions
cause degradation in the observations. Whilst these are usually small errors, it is hard
to determine with confidence that the results obtained are better than +/-1mm to 2mm
under the above mentioned conditions.
Accuracy
In theory, any surveyor can attempt a precision surveying project. However, due to
the nature of the work, the practice is much more difficult than would be expected.
While the principles involved in surveying are the same for all surveyors, one
experienced in precision monitoring will understand that the standard of care is much
higher than the standard required for typical survey work.
By using optimal geometry for the position of reference points, it is possible to
obtain an accuracy of less than 1mm over the X, Y, and Z position of the instrument.
By conducting an accurate and precise re-section to known co-ordinates, the
instrument will fix its position and record all the data. Precision surveyors working in
the field can obtain an accuracy of less than 2mm by using at least four reference
points. By using reference points attached to buildings and structures outside the zone
of influence, errors can be minimized. The more reference points that are used, the
more accurate the outcome.
Surveyors traditionally work within an error bar of +/-5mm, using points in the
ground close to the site. By placing precision surveying reference points far from the
construction and then completing a traverse to the site, co-ordinates can be obtained
without interference from the zone of influence.
Background Movements
Everything moves, all the time. By keeping this in mind, it is possible to filter out
the background movements on a project. Thermal loading, settlement, frost invasion,
strong winds, weather fluctuations and heat shimmer can all cause background
movements.
3
Thermal loading, even in a Toronto winter, carries a great deal of energy. As
buildings and structures expand and contract due to the transfer of energy, the
reference and monitoring points move with them. Energy from the sun can shift a
tripod and/or instrument, as will shadows from clouds moving across the instrument
whilst taking observations. To help address this problem, the instrument should be
placed in either full sun or full shade. The instrument must be allowed to acclimatise
on the tripod before taking observations. The effects of thermal loading can be
reduced by taking observations early or late in the day.
As water is pumped from the excavation, settlement of points may occur. If control
points are seen to be moving, re-surveying the affected point(s) using stable control
points away from the zone of influence is necessary.
Frost invasion of control points can be a problem in cold climates. By placing
control points above the ground, on structures and buildings, it is possible to
minimize this problem. While points on the ground will heave and subside with a
frost and thaw cycle, points on buildings and structures are more stable and adverse
effects are minimal. It is also possible to install deep datum points extending well
below the frost line.
Strong winds and other weather fluctuations can cause observation errors.
Attempting to take observations under inclement weather conditions causes stress for
the observer and can cause degradation in the accuracy and precision of the readings.
One gust of wind can blow the instrument out of alignment, so it is important to keep
the tripod firmly anchored. If the wind is causing errors, it is advisable to take
observations at another time. If this is not an option, then considerable time, patience
and persistence will be necessary to have any chance of obtaining good observations.
Most other daily weather fluctuations are compensated for automatically by the
advanced instruments of today.
SOURCES OF ERROR AND ERROR MANAGEMENT
It is critical for a surveyor to take the time and care, both in the field and when
processing data, to avoid or minimize errors. The most common errors encountered
in the field include pointing errors, observation errors, vibration errors, calibration,
and instrument drift.
Pointing Errors
Pointing errors are caused when the instrument is not pointing directly at the target
when the reading is taken. This normally occurs when the surveyor does not take the
time to ensure that he/she is truly pointing at the target when taking a reading.
Observation Errors
Angle of observation errors are caused by the laser being smeared over a target as it
measures the distance. This normally occurs when the target is too oblique or acute in
relation to the instrument.

4
Long observation errors are caused by too much distance between the total station
and the target. This normally occurs when measurement distances exceed 100 meters.
Heat shimmer causes sighting problems when targets become a blur through the
telescope. This occurs more often in summer when the atmosphere carries a great
deal of heat and targets appear as wobbling, blurred smears as the day progresses.
Taking observations in the early morning is one of the most ideal options in this
situation. Other options include short sighting distances (not always possible), taking
observations in late afternoon (not as good as morning because of accumulated dust
and heat in the air) or taking observations at night (logistically difficult).
Vibration Errors
Vibrations from nearby machinery or de-watering systems on the project site can
cause a noticeable degradation in observations. This normally occurs when the
instrument is set up too close to a vibration source. Wind vibration is less of an issue;
however, it can cause the instrument to drift or create difficulties with calibration
checks. Setting up the instrument near a busy road with vehicles travelling over grates
or manholes can cause the instrument to move out of alignment due to vibrations.
Regular checks to reference points whilst working are recommended.
Calibration
Precision total station theodilites require calibration at least once a day. Calibration
is affected by temperature changes, barometric changes, and altitude changes.
Transporting the instrument in a vehicle can cause vibrations and it is advisable to
calibrate the instrument at the end of each journey. Yearly visits to the instrument
manufacturer for cleaning and factory calibration are also recommended.
Instrument Drift
Drifting of the instrument is most commonly caused by unstable ground conditions,
strong winds or uneven sun exposure. By anchoring the tripod legs securely, it is
possible to decrease the risk of drifting. It is also advisable to let the instrument
acclimatize on the tripod for five to ten minutes, before commencing observations. A
brace for the tripod legs prevents sliding when working on smooth surfaces. Even the
slightest bump or knock to the instrument may cause it to drift off alignment. Care
needs to be taken during observations to ensure there is nothing touching the tripod.
PLANNING AND EXECUTING A PROJECT
The outline below is presented from the perspective of a survey monitoring
specialist. It is always a good idea to take the time at the start of a project to confer
with the site authorities about site conditions and access plans. Some of the steps
involved in the precision surveying monitoring of shoring and abutting structures
include:
meetings with stakeholders, owners and engineers;
5
planning the site activities;
installing and initializing the control network and monitoring points;
taking regular observations and processing the data; and
reporting, distributing, and archiving the data.
Meet with Stakeholders, Owners and Engineers to Optimize Program
The first step in a project is to meet with the stakeholders in charge of the
construction and shoring design to plan the locations of the monitoring points, the
frequency of the observations, and to define the review/alarm levels, if any.
During this meeting, it is important to determine:
concerns for the project;
locations of any sensitive structures;
locations of any potentially hostile neighbours;
locations of any underground services;
expected movements for the project;
distribution method and list for the monitoring data;
action plan if the measured movements exceed the anticipated movements;
monitoring frequency;
party responsible for reviewing the data and adjusting the monitoring program if
necessary;
contact details for the site coordinator and shoring contractor to coordinate the
first site visit.
Planning the Site Activities
The next step is to visit the site and conduct introductions with the site supervisor
and shoring company supervisor. During this visit, it is necessary to determine the
details and staging of the excavation (i.e. the gate and ramp locations, the excavation
sequence and the location of a geodetic benchmark). Practical considerations to be
discussed include: the location and height of any hoarding being placed around the
site; sign in and out procedures for entering and leaving the site; specific site
conditions relating to safety and/or set-up; and location of first-aid kit, eye-wash, and
the nearest hospital.
In order to plan where to set up the total station, it is important to be aware that large
pieces of machinery will be moving even larger pieces of material around the site. A
key part of the planning involves obtaining information from the site supervisor
regarding staging of construction activities, with respect to selecting instrument set-
up locations that are safe and away from the influence of vibrations and heat exhaust.
Targets used for monitoring and control are self-adhesive and reflective, and are
attached directly to the structure to be monitored. Targets are available from various
suppliers. A small amount of cleaning is normally required to affix the target to a
structure or pile. Quite often, it is beneficial to place targets well above ground level
on structures, to facilitate their observation and to keep them out of the reach of the
public.

6
Before precision surveying monitoring points or reference points are placed on
structures around a site, it is good idea to obtain permission from the owners or
managers of these structures. It is also recommended to meet with building owners or
managers to gain access to the structure and answer questions about the project. If
your client (or your client’s client) is in the process of negotiating tie-back
encroachment agreements, then coordination and communication are critical. This
will reduce potentially upsetting hostile neighbours and/or replacing targets that have
been removed by owners and managers through ignorance or anger.
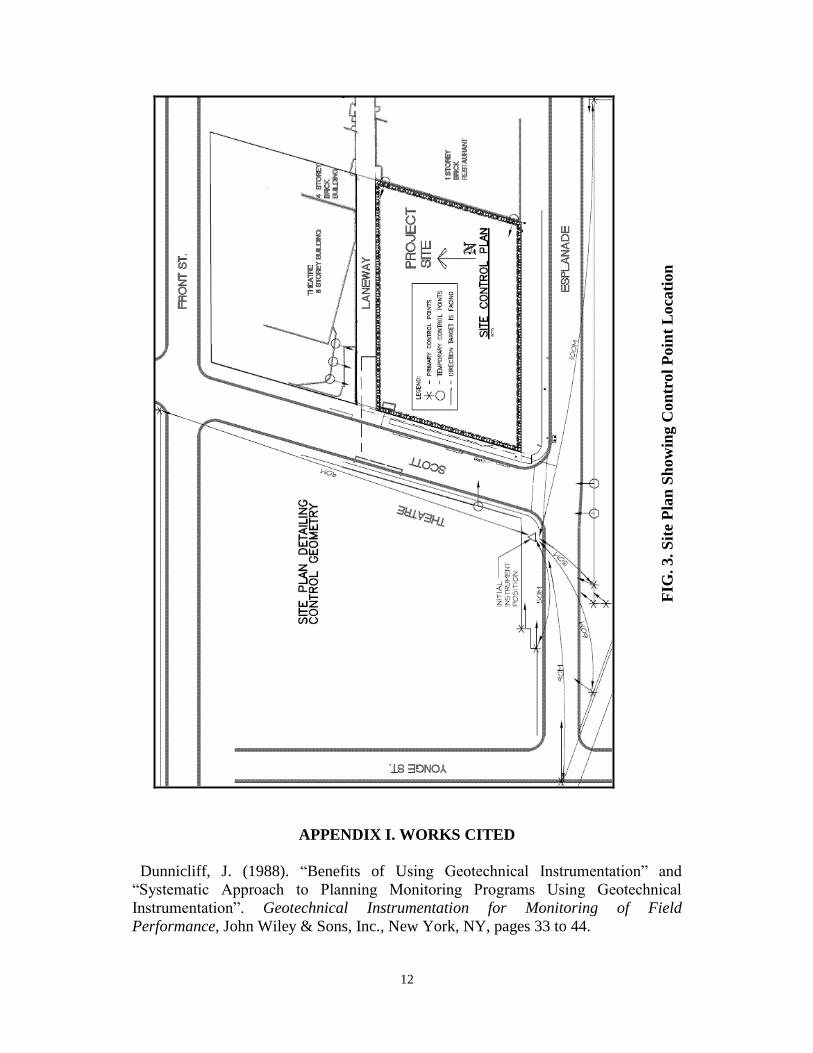
Installation and Initialization of Control Network and Monitoring Points
The control network is the anchor that ties the whole survey-monitoring package
together. See figure 3. Without strong control, the observations taken are of no
practical use. Control points should be placed on sound, rigid structures not prone to
movement due to thermal loading, frost invasion, etc. For example, targets on
structures with visible expansion joints or cracking typically do not make good
control points.
All control points must be placed outside the zone influenced by the excavation, but
in a location where access through the gates is possible without placing anyone in
danger, including the public. A good rule of thumb is to multiply the final depth of
the excavation by a factor of 1.5. Therefore, if the excavation is to be ten meters deep,
then the zone of influence will extend at least fifteen meters from the edge of the
excavation. For very large excavations, the effects from ground relaxation due to the
amount of material being moved can result in counter intuitive movements i.e.
neighbouring buildings may tilt away from the excavation.
Control points should be placed on at least two axes with a minimum of six points.
It is always a good idea to set one wall of the excavation either as a North-South
baseline or as an East-West baseline. This allows the lateral movements to be shown
in relation to moving into or out of the excavation. On most projects, due to line-of-
site constraints, it is necessary to utilize temporary control points that are within the
zone influenced by the excavation. The position of these points must be checked
relative to stable benchmarks each time they are to be used.
Once the control points have been installed, they can be surveyed using the total
station. By measuring the distance between two points along one wall, it is possible to
calculate local co-ordinates for them. It is much easier to set a baseline along the
shoring wall in the field, rather than utilizing rotations and/or co-ordinate shift
calculations during processing. By using the height difference, an assumed height
may be calculated for the points. Once an observation is taken to a benchmark, the
height difference between the starting points and the benchmark can be calculated to
assign the geodetic elevations.
The co-ordinates for these two points can be used to calculate a re-section solution.
This is typically done by the on-board computer on the total station using a least-
squared adjustment program. This solution should give values very close to zero, if
not zero (measured to 0.1 of a millimetre). If the solution is not less than two
millimetres, then the instrument should be moved to a better position relative to the
points.
7
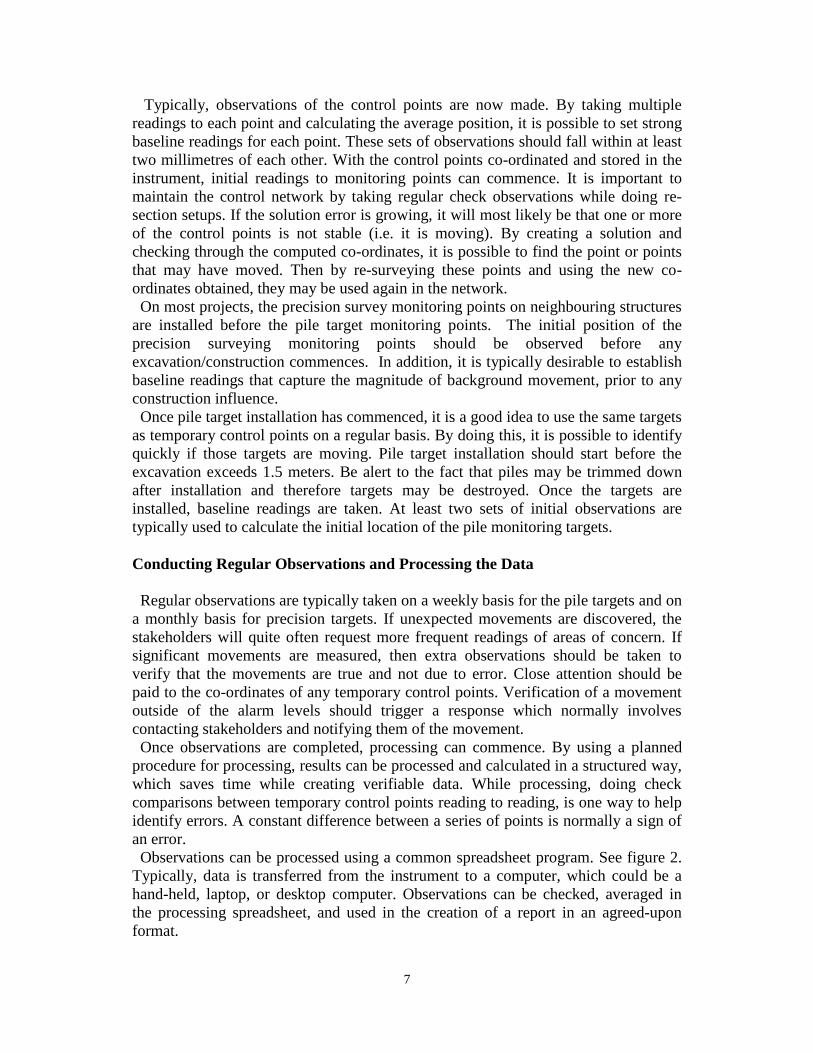
Typically, observations of the control points are now made. By taking multiple
readings to each point and calculating the average position, it is possible to set strong
baseline readings for each point. These sets of observations should fall within at least
two millimetres of each other. With the control points co-ordinated and stored in the
instrument, initial readings to monitoring points can commence. It is important to
maintain the control network by taking regular check observations while doing re-
section setups. If the solution error is growing, it will most likely be that one or more
of the control points is not stable (i.e. it is moving). By creating a solution and
checking through the computed co-ordinates, it is possible to find the point or points
that may have moved. Then by re-surveying these points and using the new co-
ordinates obtained, they may be used again in the network.
On most projects, the precision survey monitoring points on neighbouring structures
are installed before the pile target monitoring points. The initial position of the
precision surveying monitoring points should be observed before any
excavation/construction commences. In addition, it is typically desirable to establish
baseline readings that capture the magnitude of background movement, prior to any
construction influence.
Once pile target installation has commenced, it is a good idea to use the same targets
as temporary control points on a regular basis. By doing this, it is possible to identify
quickly if those targets are moving. Pile target installation should start before the
excavation exceeds 1.5 meters. Be alert to the fact that piles may be trimmed down
after installation and therefore targets may be destroyed. Once the targets are
installed, baseline readings are taken. At least two sets of initial observations are
typically used to calculate the initial location of the pile monitoring targets.
Conducting Regular Observations and Processing the Data
Regular observations are typically taken on a weekly basis for the pile targets and on
a monthly basis for precision targets. If unexpected movements are discovered, the
stakeholders will quite often request more frequent readings of areas of concern. If
significant movements are measured, then extra observations should be taken to
verify that the movements are true and not due to error. Close attention should be
paid to the co-ordinates of any temporary control points. Verification of a movement
outside of the alarm levels should trigger a response which normally involves
contacting stakeholders and notifying them of the movement.
Once observations are completed, processing can commence. By using a planned
procedure for processing, results can be processed and calculated in a structured way,
which saves time while creating verifiable data. While processing, doing check
comparisons between temporary control points reading to reading, is one way to help
identify errors. A constant difference between a series of points is normally a sign of
an error.
Observations can be processed using a common spreadsheet program. See figure 2.
Typically, data is transferred from the instrument to a computer, which could be a
hand-held, laptop, or desktop computer. Observations can be checked, averaged in
the processing spreadsheet, and used in the creation of a report in an agreed-upon
format.

8
Reporting, Distributing, and Storing Data
On completion of the processing, the data can be imported into a spreadsheet. While
the spreadsheet itself may be many columns wide, with a bit of patience and skill, a
format is possible that displays the data in a concise and clear way. By incorporating
visuals, such as a graph into the report, it is possible to convey information in an
easy-to-understand format. Many calculations can be performed in the spreadsheet,
and environmental conditions can also be recorded and plotted.
After compiling the report, it is normally sent to concerned stakeholders in whatever
communications format requested. Reports should be sent as soon as possible after
the observations and processing are completed. A cover letter is normally included in
the report and can be used to explain any problems reading targets on site or other
concerns, such as extreme weather conditions, access problems or safety issues. A
sketch showing target locations is commonly sent with the report.
After reporting the data, it is typically stored by creating a digital copy and a
hardcopy. The digital copy is burned to a physical disk, while the hardcopy is filed
the traditional way. It is important to remember that the report is the only work
product that the client receives. The report creates an impression with respect to
quality of data contained within the report. Simple spelling errors or wrongly
numbered reports produce doubts regarding the standard of care taken during
collection and analysis of the data.
An excellent summary of planning, designing and construction phases of an overall
monitoring program can be found in chapters three and four of Geotechnical
Instrumentation for Monitoring Field Performance, Dunnicliff (1988).
THE PROJECT
The project outlined permits discussion of the physical installation and layout for
precision survey monitoring.
Dig an excavation seven stories deep adjacent to several noteworthy and/or delicate
structures. Do it with as little impact on the neighbourhood as possible and as
economically as possible. Do it in reclaimed soil sitting on top of shale geology close
to a Great Lake. Sounds like a challenge.
Many steps outlined in the Installation and Initialization of Control Network and
Monitoring Points section of this paper were greatly simplified due to the prior
relationships between members of the project team, as both the shoring engineering
firm and contractor had worked together on many projects. The shoring engineer had
an exact idea of the monitoring plan, therefore planning of the installation required
minimal input with respect to monitoring point locations, etc. Additionally, the alarm
and review levels, report format, reading frequency, and distribution lists were easily
agreed upon. Sign-in procedures, safe access to instruments, and scheduling of work
were all covered during start-up meetings.
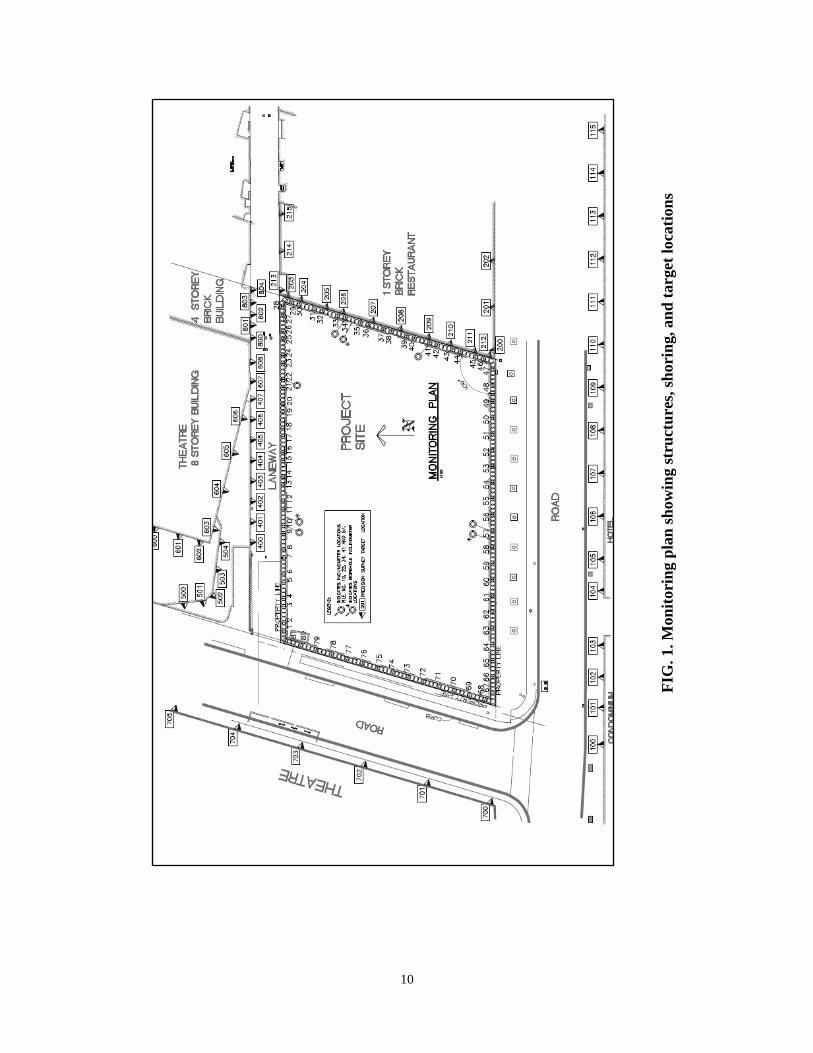
Figure 1 outlines the location of the survey monitoring points. To the north of the
site, precision survey target installation began just below the roof level of the eight-
storey theatre, facing south and west at three different levels to check for lateral and
vertical movement and twist. There was also a six-storey building monitored on a
9
laneway on the north side of the site. This laneway was too narrow to obtain accurate
observations on the south facing wall therefore targets were installed on the window
and door frames, facing west. To check for north-south movement, the bearing was
used instead of the distance. Across the road to the west was another theatre. Targets
were installed on the east face of this building; four stories above ground and at an
angle approximately sixteen degrees out of the local grid alignment. This was also the
situation for the restaurant on the eastern boundary of the site, which had sixteen
targets installed on its north, west and south faces.
By choosing a surveyed point located perpendicular to the point being monitored, a
reference distance was calculated between them. When the observations are reported,
a calculation is performed in a spreadsheet using the new co-ordinates. A new
reference distance is calculated, showing the direct movement towards or away from
the original reference point. This method is commonly used on most structures or
shoring that is not perpendicular to the local grid.
On the south side of the site, four targets were installed on the north face of a
condominium. Adjacent to this, twelve targets were installed on the north face of a
hotel. Targets placed on the restaurant, condominium and hotel were all
approximately 2.2 metres above ground level.
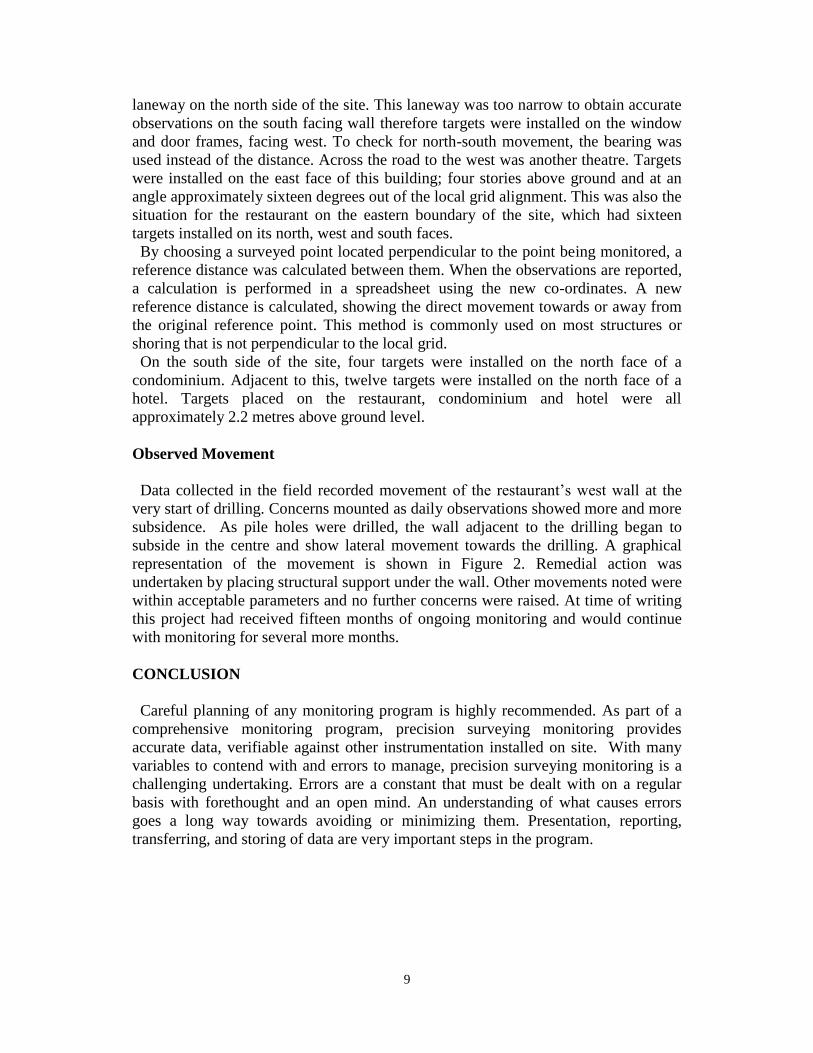
Observed Movement
Data collected in the field recorded movement of the restaurant’s west wall at the
very start of drilling. Concerns mounted as daily observations showed more and more
subsidence. As pile holes were drilled, the wall adjacent to the drilling began to
subside in the centre and show lateral movement towards the drilling. A graphical
representation of the movement is shown in Figure 2. Remedial action was
undertaken by placing structural support under the wall. Other movements noted were
within acceptable parameters and no further concerns were raised. At time of writing
this project had received fifteen months of ongoing monitoring and would continue
with monitoring for several more months.
CONCLUSION
Careful planning of any monitoring program is highly recommended. As part of a
comprehensive monitoring program, precision surveying monitoring provides
accurate data, verifiable against other instrumentation installed on site. With many
variables to contend with and errors to manage, precision surveying monitoring is a
challenging undertaking. Errors are a constant that must be dealt with on a regular
basis with forethought and an open mind. An understanding of what causes errors
goes a long way towards avoiding or minimizing them. Presentation, reporting,
transferring, and storing of data are very important steps in the program.
10
FIG
. 1. M
on
itori
ng p
lan
sh
ow
ing s
tru
ctu
res,
sh
ori
ng, an
d t
arg
et l
oca
tion
s

11
FIG
. 2. R
eport
an
d G
rap
hic
al
rep
rese
nta
tion
of
movem
ent
12
APPENDIX I. WORKS CITED
Dunnicliff, J. (1988). “Benefits of Using Geotechnical Instrumentation” and
“Systematic Approach to Planning Monitoring Programs Using Geotechnical
Instrumentation”. Geotechnical Instrumentation for Monitoring of Field
Performance, John Wiley & Sons, Inc., New York, NY, pages 33 to 44.
FIG
. 3
. S
ite
Pla
n S
how
ing
Con
trol
Poin
t L
oca
tion