precision, accuracy, and costs of survey methods for … costs of... · correction factors to...
TRANSCRIPT

940
Precision, accuracy, and costs of survey methods for giraffe Giraffa camelopardalis
Derek e. Lee* anD Monica L. BonD
Wild Nature Institute, P.O. Box 165, Hanover, NH 03755, USA
* Correspondent: [email protected]
Giraffes Giraffa camelopardalis are megafaunal browsers and keystone species in African savanna ecosystems. Range-wide population declines are suspected, but robust data are lacking. Tanzania holds the largest population of giraffe of any range state, and aerial surveys constitute most of Tanzania’s giraffe population monitoring data, but their accuracy has not yet been assessed. An IUCN status assessment for giraffe is currently underway, and calibrating aerial surveys with ground-based surveys can quantify accuracy of the aerial surveys to ensure more reliable estimates of populations nationwide. We estimated giraffe density and abundance in the Tarangire Ecosystem in northern Tanzania using 2 ground survey methods, distance sampling and capture-mark-recapture, and compared our ground-based estimates with those from the most recent aerial survey in 4 sites. We found aerial survey estimates were biased low, while ground-based surveys were more precise and cost less. We computed correction factors to improve the accuracy of aerial surveys and suggested ways to further improve aerial survey methods.
Key words: aerial survey bias, capture-mark-recapture, correction factor, distance sampling, giraffe, Giraffa camelopardalis, methods, population estimation, population monitoring
© 2016 American Society of Mammalogists, www.mammalogy.org
Precise estimates of population size are important for the proper conservation and management of species but are often difficult to obtain. Several methods are available to estimate population size, but most researchers use only 1 method, which makes resulting estimates subject to inherent biases. Individual iden-tification using photographic capture-mark-recapture (PCMR) allows a direct enumeration of sampled individuals, and pro-vides a means of comparing estimation methods.
Historically in Tanzania, East Africa, aerial surveys known as systematic reconnaissance flights (SRFs) have been the pri-mary method used to assess large mammal populations. These surveys use fixed-wing aircraft to observe animals and can be effective for estimating population size and trend across large areas (Caughley et al. 1976; Tracey et al. 2008; Lubow and Ransom 2009), but heterogeneous observation conditions can lead to biases that may significantly underestimate the true pop-ulation (Caughley 1974; Cook and Jacobson 1979; Samuel and Pollock 1981; Pollock and Kendall 1987; Samuel et al. 1992; Jachmann 2001, 2002; Borchers et al. 2006; Laake et al. 2008). Observation bias in aerial surveys may arise from a variety of factors (i.e., aircraft type, observer fatigue, observer skill, observer seat position, animal behavior, season, distance from the aircraft, group size, angle of the sun, landscape shading from cloud cover, topography, amount of vegetation cover, and
vegetation type) but many of these potential influences often are ignored when estimating animal abundance (Fleming and Tracey 2008).
Additionally, aerial survey data are considered expensive to collect and thus these surveys are only conducted every few years. Cost-effective methods that produce precise estimates of density and abundance are required for long-term monitor-ing of large mammal populations (Yuccoz et al. 2001; Nichols and Williams 2006; Ogutu et al. 2006; Peters 2010). The lack of cost-effective and precise methods could lead to inappropri-ate or inefficient management over large areas, possibly result-ing in long-term population-level declines (Jachmann 2001; Spellerberg 2005; Lindenmayer and Likens 2010).
A fundamental concern when conducting any visual surveys for wildlife is that some individuals are not seen by observ-ers (Norton-Griffiths 1978; Seber 1982; White 2005). When population estimation fails to incorporate variation in detect-ability, the resulting estimates and inferences based on those estimations will be biased low. Correcting estimates of popula-tion size ( N ) for detectability biases is vital for studies that compare population densities or abundances across space and time (White 2005), and is especially important for long-term monitoring of species of conservation concern (McQorquodale et al. 2013).
Journal of Mammalogy, 97(3):940–948, 2016DOI:10.1093/jmammal/gyw025Published online March 10, 2016
Downloaded from https://academic.oup.com/jmammal/article-abstract/97/3/940/2459801by gueston 18 April 2018
LEE AND BOND—GIRAFFE SURVEY PRECISION AND ACCURACY 941
Ground surveys using road networks as transects have been shown to be an effective and inexpensive method for density and population estimation (Ogutu et al. 2006; Caro 2011), and add value to aerial surveys through calibration and increased detection of small and cryptic species (Jachmann 2002; Waltert et al. 2008). Ground survey encounter data with perpendicular distance from road to animals can be analyzed in a distance sampling framework that accounts for different detection prob-abilities to produce precise density estimates (Buckland et al. 1993; Augustine 2010). PCMR surveys using natural marks can also produce precise and inexpensive abundance estimates while accounting for imperfect detectability (Bolger et al. 2012).
Giraffes Giraffa camelopardalis are megafaunal, browsing ruminants that eat leaves, twigs, and fruits of woody savanna vegetation in sub-Saharan Africa (Dagg 2014). Tanzania holds perhaps the largest population of giraffes of any range state. Range-wide population declines are suspected based mostly on aerial surveys, but robust data are lacking. A status assess-ment for the IUCN SSC Giraffe and Okapi Specialist Group is currently underway for giraffes (IUCN 2012). As part of this effort, the aerial surveys that constitute most of Tanzania’s giraffe population monitoring data should be calibrated with ground surveys to quantify their accuracy and, if necessary, adjust their estimates with a correction factor. In this study, our objectives were 1) to estimate giraffe density and abundance in the Tarangire Ecosystem (TE) of northern Tanzania using 2 ground survey methods, distance sampling (Buckland et al. 1993) and PCMR (Burnham and Overton 1979; Bolger et al. 2012); 2) compare our ground-based estimates with the aerial survey estimate; and 3) compute a correction factor to improve the accuracy of aerial surveys. We compared estimates from 4 sites in the TE with different giraffe densities and land manage-ment regimes, and discuss the precision, accuracy, and cost-effectiveness of the 3 survey methods. We offer suggestions for ongoing monitoring of giraffes in this and other fragmented landscapes.
Materials and Methods
Study Area
The Masai giraffe G. c. tippelskirchi is the most numerous of 6 giraffe subspecies (Dagg 2014), with the majority residing in Tanzania, East Africa. The 2nd highest density of Masai giraffe after the Serengeti Ecosystem occurs in the Tarangire Ecosystem (TE). The TE is in the eastern branch of the Great Rift Valley and encompasses roughly 30,000 km2 (Borner 1985; Prins 1987) defined by the migratory ranges of wildebeests Connochaetes taurinus and zebras Equus quagga from their core dry-season refuge along the perennial Tarangire River, stretching north to Lake Natron and south to the Simanjiro Plains and Irangi Hills (Lamprey 1964; Kahurananga and Silkiluwasha 1997; Foley and Faust 2010). The TE is a savanna–woodland ecosystem that supports one of the most diverse communities of migra-tory ungulates in the world (Bourliere and Hadley 1970; Bolger et al. 2008). Since the 1940s, human population and agricultural
development have increased 4-fold to 6-fold throughout the TE (Gamassa 1995), causing substantial habitat loss, increas-ing fragmentation, and reducing connectivity (Newmark 2008; Msoffe et al. 2011).
The core of the TE is divided into 4 sites (Fig. 1) represent-ing different land-use management regimes: Tarangire National Park (TNP), Manyara Ranch Conservancy (MRC), Lolkisale Game Controlled Area (LGCA), and Mto wa Mbu Game Controlled Area (MGCA). The 4 sites represented a variety of human land uses, including a national park (TNP), a private cattle ranch/wildlife conservancy with livestock grazing and tourism (MRC), and 2 Game Controlled Areas (MGCA and LGCA) that permit wildlife harvesting (subsistence and trophy hunting although hunting of giraffe is prohibited), agricultural cultivation, and permanent settlement (Caro et al. 2000; Nelson et al. 2010). MRC is included in the Kwakuchinja area in SRF reports. Estimates from each method were generated for each site. Our primary objective was to calculate correction factors for the aerial survey conducted in November 2011 based upon PCMR methods collected in 2012. We considered the PCMR method to provide the most accurate and precise estimates of abundance and density in each site because 1) the method accounts for detectability, 2) individuals are identified and enu-merated, and 3) individual accumulation curves leveled off at the end of the study period indicating that most animals present had been identified.
Data Collection
Aerial surveys.—Systematic reconnaissance flight (SRF) data and methodology were taken from Tanzania Wildlife Research Institute (TAWIRI). A total of 12 SRF surveys using light aircraft were carried out in the TE from 1986 to 2011 (Fig. 2) following the methodology of Norton-Griffiths (1978). SRF transects were flown in an east–west direction and spaced 5 km apart. Each transect was divided into subunits defined by 30 s flying time. This translates to approximately 1.1 km on the ground. Pilots recorded the beginning and end points of each transect using a GPS and simultaneously marked flight lines on 1:50,000 maps. At the beginning of each subunit, the Front Seat Observers (FSOs) announced the change of subunit, and recorded the radar altimeter to the nearest 3.3 m. Rear Seat Observers (RSOs) dictated onto cassette recorders the subunit identification, and all observations of large animals and human activities seen within sample strips defined by fiberglass rods attached to the wing struts of the aircraft. Target sample strip width was 150–170 m for each RSO, and was calculated based on altimeter readings for each subunit. Recorded observations were transcribed onto data sheets after each flight. Census data were entered into a computer and analyzed using software developed specifically for SRF surveys. Population estimates were calculated using Jolly’s Method 2 of Unequal Sized Units (Jolly 1969).
Ground surveys.—We conducted 6 daytime, fixed-route, road transect ground surveys for giraffe while simultaneously collecting both distance and PCMR data between January and October 2012. We surveyed according to a robust design
Downloaded from https://academic.oup.com/jmammal/article-abstract/97/3/940/2459801by gueston 18 April 2018

942 JOURNAL OF MAMMALOGY
Fig. 1.—Bold black line encloses typical systematic reconnaissance flight (SRF) aerial survey area (~12,000 km2) for Tarangire Ecosystem, Tanzania. Satellite image encompasses ground survey area. Four different management sites Mto wa Mbu Game Controlled Area (MGCA), Manyara Ranch Conservancy (MRC), Tarangire National Park (TNP), and Lolkisale Game Controlled Area (LGCA), outlined in thin black, gray lines, are ground-based fixed-route road transects for distance and photographic capture-mark-recapture surveys (2,230 km2), and available roads and tracks are white lines.
Fig. 2.—Aerial survey systematic reconnaissance flight (SRF) uncorrected population estimates for giraffes in the Tarangire Ecosystem, northern Tanzania, East Africa during wet (closed circles, solid line) and dry (open circles, dotted line) seasons from 1986 to 2011. Abundance estimates from SRF during dry-season surveys have significantly lower intercepts relative to wet-season surveys (t6 = −2.06, P = 0.042), but slopes of esti-mates in each season are similar over time. Error bars are ± 1 SE.
Downloaded from https://academic.oup.com/jmammal/article-abstract/97/3/940/2459801by gueston 18 April 2018

LEE AND BOND—GIRAFFE SURVEY PRECISION AND ACCURACY 943
sampling framework (Pollock 1982; Kendall et al. 1995; Kendall and Bjorkland 2001) with 3 sampling occasions per year near the end of each precipitation season (February, June, and October). Each sampling occasion was composed of 2 back-to-back sampling events during which we drove all fixed-route road transects in the study area (Fig. 1). Road density throughout the study area is high relative to giraffe home range size. Driving speed was maintained between 15 and 20 kph on all transects, and all survey teams included the same 2 dedi-cated observers and a driver. Each road segment was sampled only 1 time in a given event.
We collected distance data for all giraffes visible along both sides of the road out to 500 m. Distance data records the group size and perpendicular distance from the road transect to each group of animals when first detected. When a group or single-ton was sighted, we halted the vehicle and recorded the perpen-dicular distance from the road to the animal(s) measured with a laser rangefinder (Bushnell Arc 1000), the total number of individuals, and the GPS position of the vehicle. If the sighting was a cluster of animals, distance was measured as the perpen-dicular distance from the road to the approximate middle of the group.
For PCMR, during sampling events, the entire study area was surveyed and a sample of individuals were encountered and “marked” or “recaptured” by photographing them. We photographed, and later identified individual giraffe through-out the study area, using coat patterns that are unique to each animal and unchanged through time (Foster 1966). Each giraffe encountered during road transects was photographed on the right side for individual identification, and the following data recorded: age class (calf, subadult, adult), sex (male, female), site, and GPS location.
Data Analyses
We restricted ground survey analyses to adults for our method comparison because calves are difficult to detect from the air. Abundance estimates for distance and PCMR were calculated for the SRF area to allow for comparability among methods.
Distance.—Distance data were analyzed with program DISTANCE 6.0 (Thomas et al. 2010) to estimate density and abundance of animals in each site while accounting for varia-tion in detectability according to distance from the road tran-sect. We analyzed distance data following recommendations in Buckland et al. (2001, 2004). We analyzed data from each site independently. We considered all roads surveyed within a site during a single sampling event as a single transect, and each of the 6 ground survey events were treated as replicate samples. Transect lengths in km were TNP = 357, MRC = 80, LGCA = 100, and MGCA = 53. We discarded the farthest 15% of observations. We plotted frequency histograms of perpen-dicular distances and fitted models to the histogram based on the key function and series expansion approach. We fit uni-form, half-normal, and hazard-rate key functions with cosine and simple polynomial series expansions. We fit the key func-tion models and associated series expansions to the data and used corrected Akaike information criterion (AICc) to select the
best detection function model. We assessed goodness-of-fit of the top model using chi-square and Cramer von Misses tests. We regressed the logarithm of cluster size against the detection probability and adjusted detectability based on the expected cluster size. We estimated site-specific density and abundance using the top-ranked model for each site, which was the half-normal key function with cosine expansion in every case.
Photographic capture-mark-recapture.—For PCMR analy-ses, we matched images using WildID, a computer program that matches unique fur patterns from photographs to identify individuals, and that performs well-matching large datasets of giraffe (Bolger et al. 2012). We created individual encoun-ter histories of observed individuals for analysis in program MARK 7.1 (White and Burnham 1999). We modeled and estimated parameters using robust design statistical models by Pollock (1982). For each site, we modeled and estimated population sizes (N) as well as ancillary parameters of survival probabilities (S), capture probabilities (p), recapture probabili-ties (c), and temporary emigration parameters (γ′ and γ″). We analyzed PCMR data following methods described in Burnham and Anderson (2002). We used AICc to select the best model by beginning with a fully parameterized time- and site-specific model and using a stepwise approach to rank reduced param-eter models without time or site effects in temporary emigra-tion, capture, and recapture, in that order. Population size and survival were modeled as site specific, but constant over time, as we did not expect these parameters to change much season-ally, and some parameter constraints were necessary to achieve model convergence. We estimated site-specific population sizes using the top-ranked model: {S(site) p(time) c(time) γ′= γ″ (constant) N(site)}.
Correction factors.—Systematic reconnaissance flight (SRF) surveys were conducted in both wet and dry seasons (Fig. 2), and we detected a significant seasonal bias in SRF giraffe abun-dance estimates. Dry-season aerial surveys estimated signifi-cantly fewer giraffe in the ecosystem (t6 = −2.06, P = 0.042). Thus, we first computed a correction factor that would increase the 2011 dry-season SRF estimate to be equivalent to wet-season SRF estimates. In subsequent analyses, we used the 2011 SRF abundance estimates for the 4 sites, corrected to reflect wet-sea-son-equivalent values (2011 NWET = 2011 NDRY × 2.1). For aerial survey correction factors, we compared the wet-season-equiva-lent site-specific estimates of abundance and density from the November 2011 SRF survey with PCMR estimates from 2012. We calculated the SRF corrections as: NCORR = NRAW × C.
Means comparisons.—We compared site-specific estimates of density and abundance from SRF and distance methods with estimates from PCMR methods. We compared means using t-statistics computed as the difference in means divided by the pooled SEs. We used 5 degrees of freedom when compar-ing PCMR with SRF (n = 6 surveys contributed to estimates from PCMR and n = 1 survey formed the estimates from SRF). We used 10 degrees of freedom when comparing PCMR and distance (n = 6 surveys each). We also compared precision by computing coefficients of variation (CV) for all estimates, and a mean CV according to method.
Downloaded from https://academic.oup.com/jmammal/article-abstract/97/3/940/2459801by gueston 18 April 2018

944 JOURNAL OF MAMMALOGY
Costs.—We recorded fieldwork costs for our ground-based survey methods, and sought estimates of SRF costs from con-tractors within Tanzania. We compared costs by computing the cost in dollars per km surveyed.
results
We collected 503 distance data records of adult giraffe groups (TNP = 307, MRC = 111, LGCA = 43, and MGCA = 42). From PCMR data, we produced encounter histories for 1,347 indi-vidually recognizable adult giraffes. SRF observers detected 82 giraffes.
Means comparisons.—Density estimates, and associated abundance estimates, from SRF were significantly lower than PCMR estimates in 3 of the 4 sites (Fig. 3; Table 1). Mean dif-ference between PCMR and SRF density estimates was 0.636 adults/km2 (SD = 0.757), and mean difference between distance and SRF density estimates was 0.268 adults/km2 (SD = 0.343). Mean difference between PCMR and SRF abundance estimates was 734 adults (SD = 671), and mean difference between dis-tance and SRF abundance estimates was 212 adults (SD = 258).
Density estimates from distance methods were similar to PCMR in TNP and MGCA, but varied significantly in MRC and LGCA (Fig. 3; Table 1). Precision of estimates was great-est for PCMR (CV = 0.15), relative to distance (CV = 0.24), and SRF (CV = 0.44).
Correction factors.—Correction factors to adjust SRF abun-dance estimates varied according to site, but were not correlated with density (Table 1). We adjusted the 2011 ecosystem-wide SRF abundance estimate using the correction factor for TNP (CTNP = 3.0), because it represented a large surveyed area with moderate giraffe density. This correction made the ecosystem-wide estimate of giraffe abundance 2011 NCORR = 2011 NWET × CTNP = 7,902. To generate a 2nd ecosystem-wide estimate of giraffe abundance, we adjusted all SRF sites in the TE with individual correction factors (using the LGCA correction factor CLGCA = 1.2 for Engaruka, Simanjiro, Mkungenero, Kibaoni, and Outside SW areas) and summed the corrected estimates for a grand total of 7,844 giraffe.
Costs.—Each ground survey covered 590 km of transect over 10 days, and because both PCMR and distance methods were done simultaneously, we consider costs for both the same, with
Fig. 3.—Density (top) and abundance (bottom) estimates (error bars = SE) of giraffe at 4 sites in the Tarangire Ecosystem, northern Tanzania, East Africa: Tarangire National Park (TNP), Manyara Ranch Conservancy (MRC), Lolkisale Game Controlled Area (LGCA), and Mto wa Mbu Game Controlled Area (MGCA). Estimates were derived by 3 methods: systematic reconnaissance flights (SRFs), distance sampling (DISTANCE), and photographic capture mark recapture (PCMR).
Downloaded from https://academic.oup.com/jmammal/article-abstract/97/3/940/2459801by gueston 18 April 2018
LEE AND BOND—GIRAFFE SURVEY PRECISION AND ACCURACY 945
the additional cost of a camera for PCMR and a laser range-finder for distance. Costs of implementing a ground survey was $4,400, or $7.46/km. Costs were distributed as vehicle rental and driver $2,000; salary for 2 observers $2,000; fuel $200; and food $200. An estimate for SRF survey costs in Tanzania in 2011 was quoted at $29,000 for 3,575 km, or $8.10/km (K. Clark, PAMS Foundation, pers. comm.). SRF surveys also have been quoted as costing $11/km inclusive of all aircraft and staff costs (Msoffe et al. 2010). Ground survey costs in Kenya in 2003–2004 were $3.10/km (Ogutu et al. 2006).
discussion
This work was motivated by the need for an assessment of the current status of Masai giraffes in Tanzania. Our study is the 1st large-scale attempt to determine a correction factor for aerial surveys of giraffes in the country. Aerial surveys represent a basic and important tool for monitoring large mammal popula-tions over very large areas (Stoner et al. 2007), but raw data from aerial surveys are commonly plagued by detection biases (Caughley 1974; Cook and Jacobson 1979; Samuel and Pollock 1981; Pollock and Kendall 1987; Samuel et al. 1992). Our cor-rection factors attempted to account for detectability biases in estimates from aerial survey data. Our dry-season correction factor adjusted abundance estimates from aerial surveys that were conducted during the dry period when fewer giraffes are typically detected. In addition, our detectability correction fac-tor adjusted aerial SRF survey estimates to account for inherent methodological biases that resulted in systematic underestimat-ing of giraffe numbers.
Overall, our correction factors increased the population estimates for giraffes in the Tarangire Ecosystem from a naïve 2011 SRF estimate of 1,235 giraffes, to a wet-season and detectability corrected estimate of 7,844–7,902 giraffes, a 6.4-fold adjustment. This is a large increase to the previously held
population estimate for this ecosystem, but our correction fac-tors were generally in the range of the correction factors cal-culated for giraffes in Zambia (C = 3 to 10—Jachmann 2002). To apply our correction factors to historical SRF surveys may be problematic as vegetation density has changed throughout the ecosystem over time (van de Vijver et al. 1999; Msoffe 2011). We believe this corrected estimate may be larger than the true population size due to fine-scale differences in habitat and densities, including large areas of nonhabitat, within the SRF area. Stratified sampling during SRF and ground surveys or more detailed; stratified analyses should account for such differences.
We are confident that our PCMR estimates were indeed the most accurate of the 3 methods we examined, and precision of PCMR estimates was also greater than either distance or SRF. PCMR methods also can produce biased estimates when hetero-geneity in detectability or violations of assumptions are present but not accounted for (White et al. 1982; Kendall 1999), but we believe our methods were sound and our results robust. The much larger sample sizes in the PCMR method, combined with the detectability estimation inherent in this method, indicate this method was capable of discovering significant variation in density of giraffe among the 4 sites examined (Lee 2015). Significantly higher densities of giraffes in protected areas such as TNP and MRC may be expected due to the antipoaching patrols conducted by land managers at these sites (Caro et al. 2000; Nelson et al. 2010). Human–wildlife conflicts where people are living, or variation in vegetation or habitat quality, may result in the lower densities evident in the GCAs. The dis-tance method, again with higher sample sizes than SRF, found the same pattern in density variation among sites as the PCMR method, but our distance-based estimates of density were lower than PCMR estimates in sites with very high and very low den-sity. SRF methods were unable to detect the differences in den-sity among sites that were found using PCMR and distance,
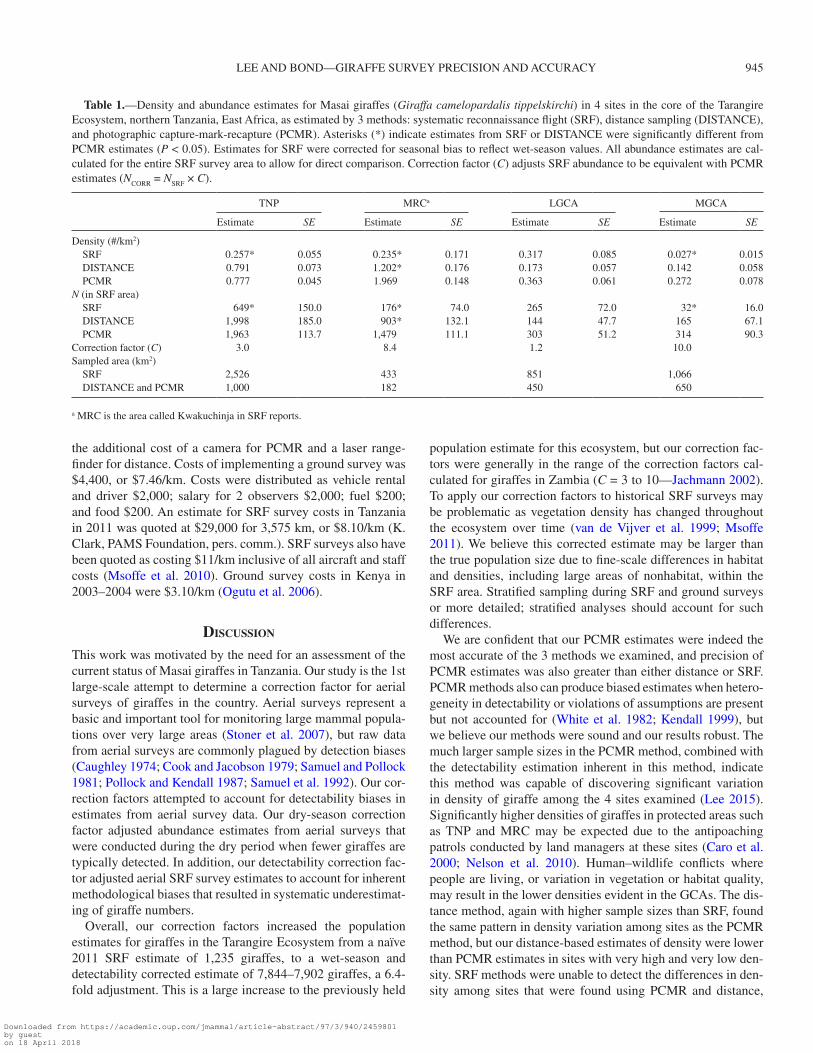
Table 1.—Density and abundance estimates for Masai giraffes (Giraffa camelopardalis tippelskirchi) in 4 sites in the core of the Tarangire Ecosystem, northern Tanzania, East Africa, as estimated by 3 methods: systematic reconnaissance flight (SRF), distance sampling (DISTANCE), and photographic capture-mark-recapture (PCMR). Asterisks (*) indicate estimates from SRF or DISTANCE were significantly different from PCMR estimates (P < 0.05). Estimates for SRF were corrected for seasonal bias to reflect wet-season values. All abundance estimates are cal-culated for the entire SRF survey area to allow for direct comparison. Correction factor (C) adjusts SRF abundance to be equivalent with PCMR estimates (NCORR = NSRF × C).
TNP MRCa LGCA MGCA
Estimate SE Estimate SE Estimate SE Estimate SE
Density (#/km2) SRF 0.257* 0.055 0.235* 0.171 0.317 0.085 0.027* 0.015 DISTANCE 0.791 0.073 1.202* 0.176 0.173 0.057 0.142 0.058 PCMR 0.777 0.045 1.969 0.148 0.363 0.061 0.272 0.078N (in SRF area) SRF 649* 150.0 176* 74.0 265 72.0 32* 16.0 DISTANCE 1,998 185.0 903* 132.1 144 47.7 165 67.1 PCMR 1,963 113.7 1,479 111.1 303 51.2 314 90.3Correction factor (C) 3.0 8.4 1.2 10.0Sampled area (km2) SRF 2,526 433 851 1,066 DISTANCE and PCMR 1,000 182 450 650
a MRC is the area called Kwakuchinja in SRF reports.
Downloaded from https://academic.oup.com/jmammal/article-abstract/97/3/940/2459801by gueston 18 April 2018

946 JOURNAL OF MAMMALOGY
and SRF estimates of abundance were biased low in areas with higher density, which were the protected areas where monitor-ing is concentrated and where authorities are primarily con-cerned with population status.
Costs of our ground-based surveys were slightly lower than SRF costs, but the difference in cost should be weighed against site-specific needs in terms of spatial coverage and pre-cision. SRF aerial surveys are the most effective at covering large areas, but the large confidence intervals around the esti-mates produced with this method makes trend detection dif-ficult. Aerial survey techniques can be employed to overcome the obstacles of large spatial expanses, limited road access to all areas of interest, and dense vegetation that may prevent observers from detecting animals from the ground. Relative abundance methods such as SRF can be useful for detecting trends if methods and the environment are consistent over time (Pollock et al. 2002), but this is unlikely to be a realis-tic assumption (van de Vijver et al. 1999), and low precision hinders trend detection. However, the use of so-called census methods, which assume that all animals are seen, remains a common practice. This can lead to many large mammals on the landscape being unaccounted for in aerial surveys (Pollock and Kendall 1987; Samuel et al. 1987; Ackerman 1988; Bodie et al. 1995). Employing aerial survey methodologies that apply statistical sampling techniques is critical to addressing many of the negative biases created by heterogeneity of these fac-tors (Ransom 2012; McQorquodale et al. 2013). Use of such techniques can produce more precise and accurate population estimates with quantified errors that will provide better infor-mation for decision-making and management.
Mark-recapture modeling represents a different approach to deal with imperfect detectability (Otis et al. 1978; White et al. 1982; Pollock et al. 1990; Schwarz and Seber 1999; Barker 2008). In mark-recapture models, the probabilities of detec-tion can be estimated during each recapture occasion. Mark-recapture methods have been widely applied to estimate large mammal population size and density (Bartmann et al. 1987; Neal et al. 1993; Bowden and Kufeld 1995; Mahoney et al. 1998; Gould et al. 2005), with varied success. Mark-recapture may be an impractical tool for long-term monitoring of exten-sive, very abundant populations because of issues of landscape and population scale and the need for perpetual marking. On this landscape, a photographic mark-recapture population mon-itoring strategy is feasible due to the good road coverage and distinct individual natural markings on giraffe, although the method is relatively intensive in effort.
Distance sampling represents a middle ground between aer-ial and PCMR surveys in that it incorporates detectability but is less intensive in effort than PCMR methods. However, our study revealed differences between distance and PCMR estimates for which we could not account. It is likely that variation in vegeta-tion, topography, or other environmental factors may need to be incorporated as covariates of distance sampling to overcome these heterogeneities in detectability. Distance sampling is best suited to estimating densities of large African mammals occur-ring at low to moderate densities in areas where visibility varies
substantially, but should be supplemented with other methods for abundant and highly clustered species (Ogutu et al. 2006).
The SRF in November 2011 was separated by 3–11 months from subsequent ground surveys in January–October 2012, so some incremental change in local population sizes could have occurred due to population dynamics or movement, but we believe such changes should be quite small due to the species’ slow reproductive rate, lack of evidence for massive poaching activities during this period, and the small size of home ranges relative to the study area. Another caveat to this study concerns the nonrandom placement of ground survey routes. Our use of roads for ground surveys was logistically necessary in this ter-rain (Ogutu et al. 2006), but may introduce biases if animals avoid or are attracted to roads. We do not believe this was the case in TNP, but the presence of many livestock herds and herdspeople walking on roadways may have negatively biased giraffe use of areas near roads outside the national park.
We recommend the adoption of aerial survey methodologies in the SRF monitoring scheme that apply statistical sampling techniques to address the negative biases created by hetero-geneity of detectability. In the meantime, correction factors should be applied to SRF estimates to account for the largest biases such as season, and overall bias in giraffe detectability documented here. We also recommend ancillary ground-based surveys for greater precision and faster trend detection, and for calibration of aerial surveys in this and other ecosystems across Tanzania. New methods should retain backward com-patibility so past and future estimates are directly comparable. Replicate SRF surveys done back-to-back is another option for increasing precision of estimates while maintaining the large spatial coverage. These adjustments would all increase the pre-cision and accuracy of monitoring efforts for the benefit of the natural resources and the tourism economy that relies upon them.
acknowledgMents
This research was carried out with permission from the Tanzania Commission for Science and Technology (COSTECH), Tanzania National Parks (TANAPA), the Tanzania Wildlife Research Institute (TAWIRI), African Wildlife Foundation, Manyara Ranch Conservancy, and the villages of Selela, Lolkisale, and Emboret, under COSTECH permits 2011-106-NA-90-172, 2012-175-ER-90-172, and 2013-103-ER-90-172. We are grateful to the Sacramento Zoo, Columbus Zoo, Cincinnati Zoo, Explorers Club, and the Dartmouth College Cramer Fund for financially supporting ground-based surveys. We thank H. Maliti for access to TAWIRI aerial survey reports.
literature cited
ackerMan, B. B. 1988. Visibility bias of mule deer aerial census procedures in southwest Idaho. Ph.D. dissertation, University of Idaho, Moscow.
augustine, D. J. 2010. Response of native ungulates to drought in semi-arid Kenyan rangeland. African Journal of Ecology 48:1009–1020.
Downloaded from https://academic.oup.com/jmammal/article-abstract/97/3/940/2459801by gueston 18 April 2018

LEE AND BOND—GIRAFFE SURVEY PRECISION AND ACCURACY 947
Barker, R. 2008. Theory and application of mark–recapture and related techniques to aerial surveys of wildlife. Wildlife Research 35:268–274.
BartMann, R. M., G. C. White, L. H. carpenter, anD R. A. garrott. 1987. Aerial mark-recapture estimates of confined mule deer in pinyon-juniper woodland. Journal of Wildlife Management 51:41–46.
BoDie, W. L., E. O. garton, E. R. tayLor, anD M. Mccoy. 1995. A sightability model for bighorn sheep in canyon habitats. Journal of Wildlife Management 59:832–840.
BoLger, D. T., T. A. Morrison, B. Vance, D. Lee, anD H. FariD. 2012. A computer-assisted system for photographic mark-recapture anal-ysis. Methods in Ecology and Evolution 3:812–822.
BoLger, D. T., W. neWMark, T. A. Morrison, anD D. Doak. 2008. The need for integrative approaches to understand and conserve migra-tory ungulates. Ecology Letters 11:63–77.
Borchers, D. L., J. L. Laake, C. southWeLL, anD C. G. M. paxton. 2006. Accommodating unmodeled heterogeneity in double-observer distance sampling surveys. Biometrics 62:372–378.
Borner, M. 1985. The increasing isolation of Tarangire National Park. Oryx 19:91–96.
BourLiere, F., anD M. haDLey. 1970. The ecology of tropical savan-nas. Annual Review of Ecology and Systematics 1:125–152
BoWDen, D. C., anD R. C. kuFeLD. 1995. Generalized mark-sight pop-ulation estimation applied to Colorado moose. Journal of Wildlife Management 59:840–851.
BuckLanD, S. T., D. R. anDerson, K. P. BurnhaM, anD J. L. Laake. 1993. Distance sampling: estimating abundance of biological pop-ulations. 1st ed. Chapman and Hall, New York.
BuckLanD, S. T., D. R. anDerson, K. P. BurnhaM, J. L. Laake, D. L. Borchers, anD L. thoMas. 2001. Introduction to distance sam-pling. Oxford University Press, Oxford, United Kingdom.
BuckLanD, S. T., D. R. anDerson, K. P. BurnhaM, J. L. Laake, D. L. Borchers, anD L. thoMas. 2004. Advanced distance sampling. Oxford University Press, Oxford, United Kingdom.
BurnhaM, K. P., anD D. R. anDerson. 2002. Model selection and mul-timodel inference: a practical information–theoretical approach. Springer–Verlag, New York.
BurnhaM, K. P., anD W. S. oVerton. 1979. Robust estimation of population size when capture probabilities vary among animals. Ecology 60:927–936.
caro, T. 2011. On the merits and feasibility of wildlife monitoring for conservation: a case study from Katavi National Park, Tanzania. African Journal of Ecology 49:320–331.
caro, T. M., M. rejManek, anD N. peLkey. 2000. Which mammals benefit from protection in East Africa? Pp. 221–238 in Priorities for the conservation of mammalian diversity: has the panda had its day? (A. Entwistle and N. Dunstone, eds.). Cambridge University Press, Cambridge, United Kingdom.
caughLey, G. 1974. Bias in aerial survey. Journal of Wildlife Management 38:921–933.
caughLey, G., R. sincLair, anD D. scott-keMMis. 1976. Experiments in aerial survey. Journal of Wildlife Management 40:290–300.
cook, R. D., anD J. O. jacoBson. 1979. A design for estimating vis-ibility bias in aerial surveys. Biometrics 35:735–742.
Dagg, A. I. 2014. Giraffe biology, behavior and conservation. Cambridge University Press, New York.
FLeMing, P., anD J. tracey. 2008. Some human, aircraft and animal factors affecting aerial surveys—how to enumerate animals from the air. Wildlife Research 35:258–267.
FoLey, C. A. H., anD L. J. Faust. 2010. Rapid population growth in an elephant Loxodonta africana population recovering from poaching in Tarangire National Park, Tanzania. Oryx 44:205–212.
Foster, J. B. 1966. The giraffe of Nairobi National Park: home range, sex ratios, the herd, and food. East African Wildlife Journal 4:139–148.
gaMassa, D. G. M. 1995. Blockade of wildlife migration corridors by agricultural development in northern Tanzania. Pp. 609–613 in Integrating people and wildlife for a sustainable future (J. Bisonette and P. Krausman, eds.). The Wildlife Society, Bethesda, Maryland.
gouLD, W. R., S. T. sMaLLiDge, anD B. C. thoMpson. 2005. Mark-resight superpopulation estimation of a wintering elk Cervus ela-phus canadensis herd. Wildlife Biology 11:341–349.
iucn. 2012. IUCN Red List of Threatened Species. Version 2012.1. www.iucnredlist.org. Accessed 24 February 2016.
jachMann, H. 2001. Estimating abundance of African Wildlife: an aid to adaptive management. Kluwer Academic Publishers, Dordrecht, Netherlands.
jachMann, H. 2002. Comparison of aerial counts with ground counts for large African herbivores. Journal of Applied Ecology 39:841–852.
joLLy, G. M. 1969. Sampling methods for aerial census of wild-life populations. East African Agriculture and Forestry Journal 34:46–49.
kahurananga, J., anD F. siLkiLuWasha. 1997. The migration of zebra and wildebeest between Tarangire National Park and Simanjiro Plains, northern Tanzania, in 1972 and recent trends. African Journal of Ecology 35:179–185.
kenDaLL, W. L. 1999. Robustness of closed capture-recapture methods to violations of the closure assumption. Ecology 80:2517–2525.
kenDaLL, W. L., anD R. BjorkLanD. 2001. Using open robust design models to estimate temporary emigration from capture-recapture data. Biometrics 57:1113–1122.
kenDaLL, W. L., K. H. poLLock, anD C. BroWnie. 1995. A likelihood-based approach to capture-recapture estimation of demographic parameters under the robust design. Biometrics 51:293–308.
Laake, J., M. DaWson, anD J. hone. 2008. Visibility bias in aerial survey—mark–recapture, line-transect or both? Wildlife Research 35:299–309.
LaMprey, H. 1964. Estimation of the large mammal densities, bio-mass, and energy exchange in the Tarangire Game Reserve and the Maasai Steppe in Tanzania. East African Wildlife Journal 1:3–92.
Lee, D. E. 2015. Demography of giraffe in the fragmented Tarangire Ecosystem. Ph.D. dissertation, Dartmouth College, Hanover, New Hampshire.
LinDenMayer, D., anD G. E. Likens. 2010. The science and application of ecological monitoring. Biological Conservation 143:1317–1328.
LuBoW, B. C., anD J. I. ransoM. 2009. Validating aerial photographic mark–recapture for naturally marked feral horses. Journal of Wildlife Management 73:1420–1429.
Mahoney, S. P., J. A. VirgL, D. W. Fong, A. M. MaccharLes, anD M. Mcgrath. 1998. Evaluation of a mark-resighting technique for woodland caribou in Newfoundland. Journal of Wildlife Management 62:1227–1235.
McQorQuoDaLe, S. M., S. M. knapp, M. A. DaVison, J. S. Bohannon, C. D. DaniLson, anD W. C. MaDsen. 2013. Mark-resight and sight-ability modeling of a western Washington elk population. Journal of Wildlife Management 77:359–371.
MsoFFe, F. U., et aL. 2010. Participatory wildlife surveys in commu-nal lands: a case study from Simanjiro, Tanzania. African Journal of Ecology 48:727–735.
Downloaded from https://academic.oup.com/jmammal/article-abstract/97/3/940/2459801by gueston 18 April 2018
948 JOURNAL OF MAMMALOGY
MsoFFe, F. U., et aL. 2011. Drivers and impacts of land-use change in the Maasai Steppe of northern Tanzania: an ecological, social, and political analysis. Journal of Land Use 6:261–281.
neaL, A. K., G. C. White, R. B. giLL, D. F. reeD, anD J. H. oLterMan. 1993. Evaluation of mark-resight model assumptions for estimating mountain sheep numbers. Journal of Wildlife Management 57:436–450.
neLson, F., et aL. 2010. Payments for ecosystem services as a frame-work for community-based conservation in northern Tanzania. Conservation Biology 24:78–85.
neWMark, W. D. 2008. Isolation of African protected areas. Frontiers in Ecology and the Environment 6:321–328.
nichoLs, J. D., anD B. K. WiLLiaMs. 2006. Monitoring for conserva-tion. Trends in Ecology and Evolution 21:668–673.
norton-griFFiths, M. 1978. Counting animals. 2nd ed. Pp. 139. African Wildlife Foundation technical handbook No. 1 (J. J. R. Grimsdell, ed.). African Wildlife Foundation, Nairobi, Kenya.
ogutu, J. O., N. BhoLa, H.-P. piepho, anD R. reiD. 2006. Efficiency of strip- and line-transect surveys of African savanna mammals. Journal of Zoology 269:149–160.
otis, D. L., K. P. BurnhaM, G. C. White, anD D. R. anDerson. 1978. Statistical inference from capture data on closed animal popula-tions. Wildlife Monographs 62:1–135.
peters, D. P. C. 2010. Accessible ecology: synthesis of the long, deep, and broad. Trends in Ecology and Evolution 25:592–601.
poLLock, K. H. 1982. A capture-recapture design robust to unequal probability of capture. Journal of Wildlife Management 46:752–757.
poLLock, K. H., anD W. L. kenDaLL. 1987. Visibility bias in aerial surveys—a review of estimation procedures. Journal of Wildlife Management 51:502–510.
poLLock, K. H., J. D. nichoLs, C. BroWnie, anD J. E. hines. 1990. Statistical inference for capture-recapture experiments. Wildlife Monographs 107:1–97.
poLLock, K. H, J. D. nichoLs, T. R. siMons, G. L. FarnsWorth, L. L. BaiLey, anD J. R. sauer. 2002. Large scale wildlife monitoring studies: statistical methods for design and analysis. Envirometrics 13:105–119.
prins, H. H. T. 1987. Nature conservation as an integral part of opti-mal land use in East Africa: the case of the Masai Ecosystem of northern Tanzania. Biological Conservation 40:141–161.
ransoM, J. I. 2012. Detection probability in aerial surveys of feral horses. Journal of Wildlife Management 76:299–307.
saMueL, M. D., E. O. garton, M. W. schLegaL, anD R. G. carson. 1987. Visibility bias during aerial surveys of elk in northcentral Idaho. Journal of Wildlife Management 51:622–630.
saMueL, M. D., anD K. H. poLLock. 1981. Correction of visibility bias in aerial surveys where animals occur in groups. Journal of Wildlife Management 45:993–997.
saMueL, M. D., R. K. steinhorst, E. O. garton, anD J. W. unsWorth. 1992. Estimation of wildlife population ratios incorporating sur-vey design and visibility bias. Journal of Wildlife Management 56:718–725.
schWarz, C. J., anD G. A. F. seBer. 1999. Estimating animal abun-dance—review III. Statistical Science 14:427–456.
seBer, G. A. F. 1982. The estimation of animal abundance. Charles Griffin, London, United Kingdom.
speLLerBerg, I. F. 2005. Monitoring ecological change. Cambridge University Press, Cambridge, United Kingdom.
stoner, C., T. M. caro, S. MDuMa, C. MLingWa, G. saBuni, anD M. Borner. 2007. Assessment of effectiveness of protection strate-gies in Tanzania based on a decade of survey data for large herbi-vores. Conservation Biology 21:635–646.
thoMas, L., et aL. 2010. Distance software: design and analysis of distance sampling surveys for estimating population size. Journal of Applied Ecology 47:5–14.
tracey, J. P., P. J. S. FLeMing, anD G. J. MeLViLLe. 2008. Accuracy of some aerial survey estimators—contrasts with known numbers. Wildlife Research 35:377–384.
Van De VijVer, C. A. D. M., C. A. FoLey, anD H. oLFF. 1999. Changes in the woody component of an east African savanna during 25 years. Journal of Tropical Ecology 15:545–564.
WaLtert, M., et aL. 2008. Foot surveys of large mammals in wood-lands of western Tanzania. Journal of Wildlife Management 72:603–610.
White, G. C. 2005. Correcting wildlife counts using detection prob-abilities. Wildlife Research 32:211–216.
White, G. C., D. R. anDerson, K. P. BurnhaM, anD D. L. otis. 1982. Capture-recapture and removal methods for sampling closed popu-lations. Los Alamos National Laboratory Report No. LA-8787-NERP, Los Alamos, New Mexico.
White, G. C., anD K. P. BurnhaM. 1999. Program MARK: sur-vival estimation from populations of marked animals. Bird Study 46:120–138.
yuccoz, N. G., J. D. nichoLs, anD T. BouLinier. 2001. Monitoring of biological diversity in space and time. Trends in Ecology and Evolution 16:446–453.
Submitted 1 December 2015. Accepted 29 January 2016.
Associate Editor was Harald Beck.
Downloaded from https://academic.oup.com/jmammal/article-abstract/97/3/940/2459801by gueston 18 April 2018