precipitation & runoff modeling of savinja catchment · •cad (autocad map 3d, quicksurf,...
TRANSCRIPT

Precipitation & Runoff modeling of Savinja catchment
Ljubljana, 01.12.2016
Email: [email protected]
1
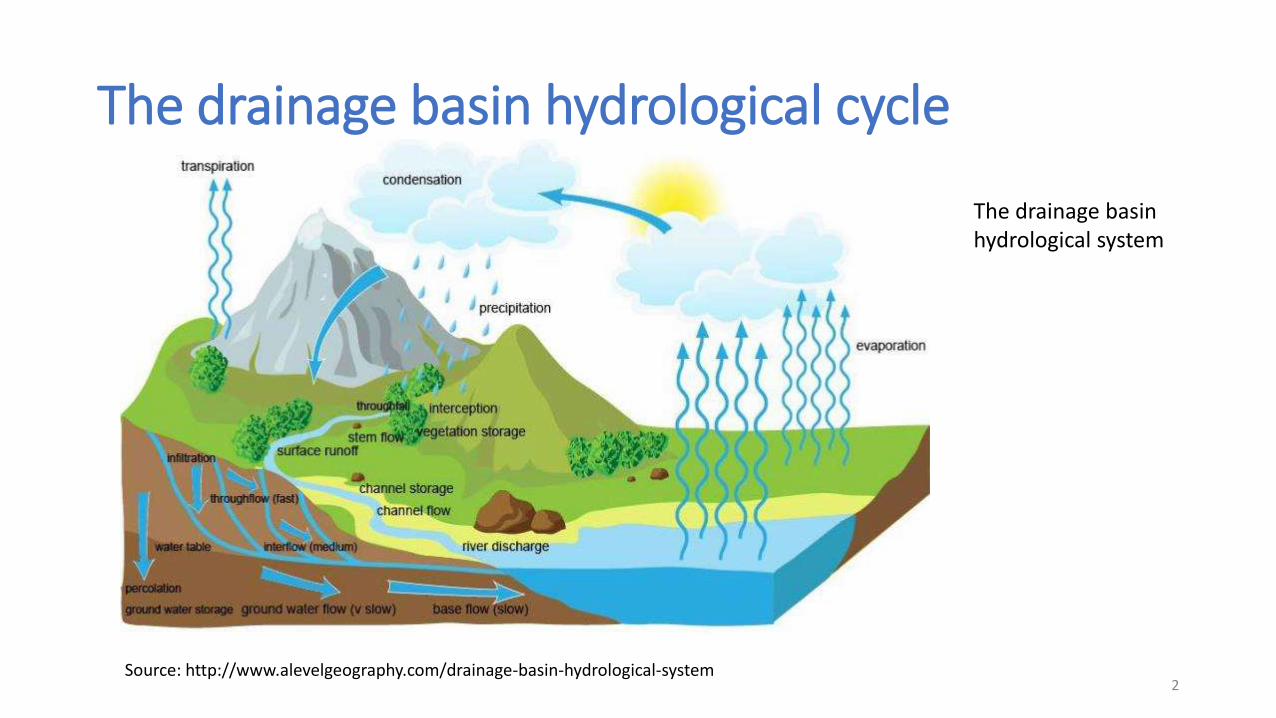
The drainage basin hydrological cycle
Source: http://www.alevelgeography.com/drainage-basin-hydrological-system
The drainage basin hydrological system
2
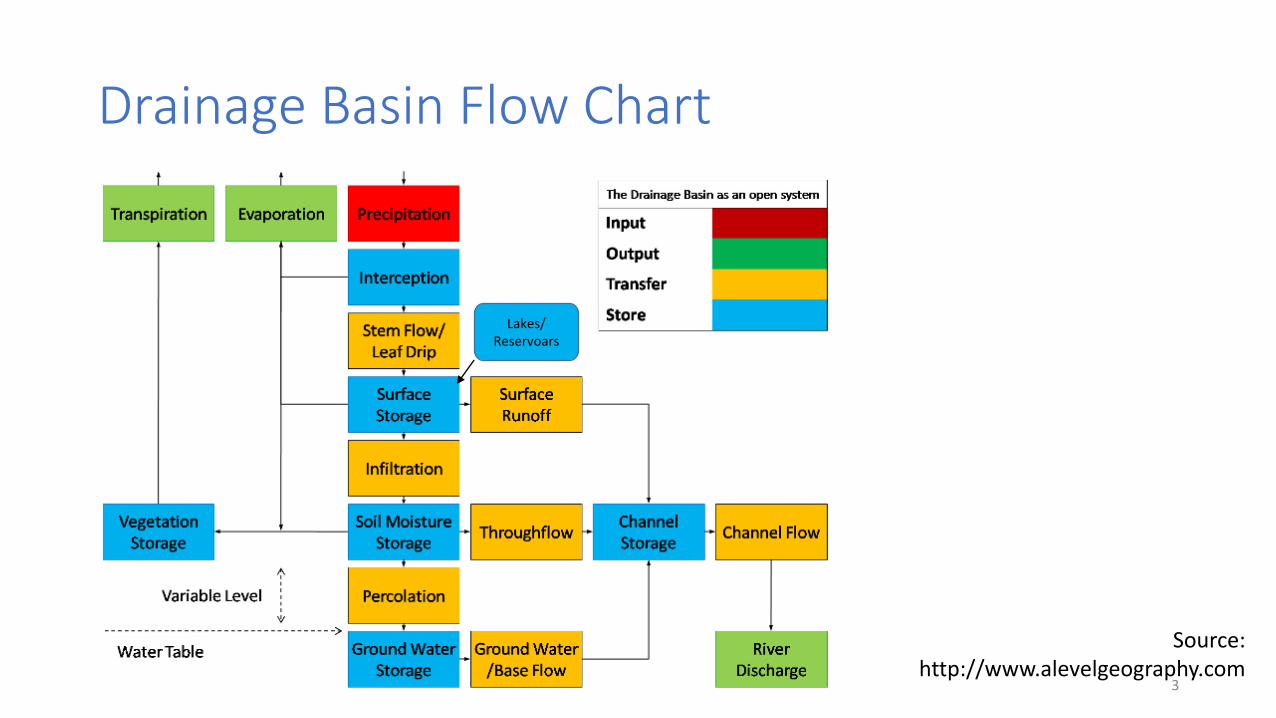
Drainage Basin Flow Chart
Source: http://www.alevelgeography.com
Lakes/ Reservoars
3

The basicprinciple
4

Which hydrological model?
• various ongoing researches are there on topics like which model will give more compatible results compared to P-R relations
• HSPF, TOPMODEL, HBV, MIKE-SHE, SWAT,…
HBV-light & PEST
HBV-light: http://www.geo.uzh.ch/en/units/h2k/services/hbv-model/
PEST: http://www.pesthomepage.org/
5

HBV - Hydrologiska Byråns Vattenbalansavdelning(Hydrological Agency Water Balance Department)
• The HBV model (Bergström, 1976, 1992) is a rainfall-runoff model, which includes conceptual numerical descriptions of hydrological processes at the catchment scale. The general water balance can be described as
Where
P = precipitation
E = evapotranspiration
Q = runoff
SP = snow pack
SM = soil moisture
TZ = storage in soil top zone (introduced in HBV-light) UZ = upper groundwater zone storage
LZ = lower groundwater zone storage
lakes = lake volume
lakesLZUZTZSMSPdt
dQEP
6Source: http://www.smhi.se/forskning/forskningsomraden/hydrologi/hbv-1.1566
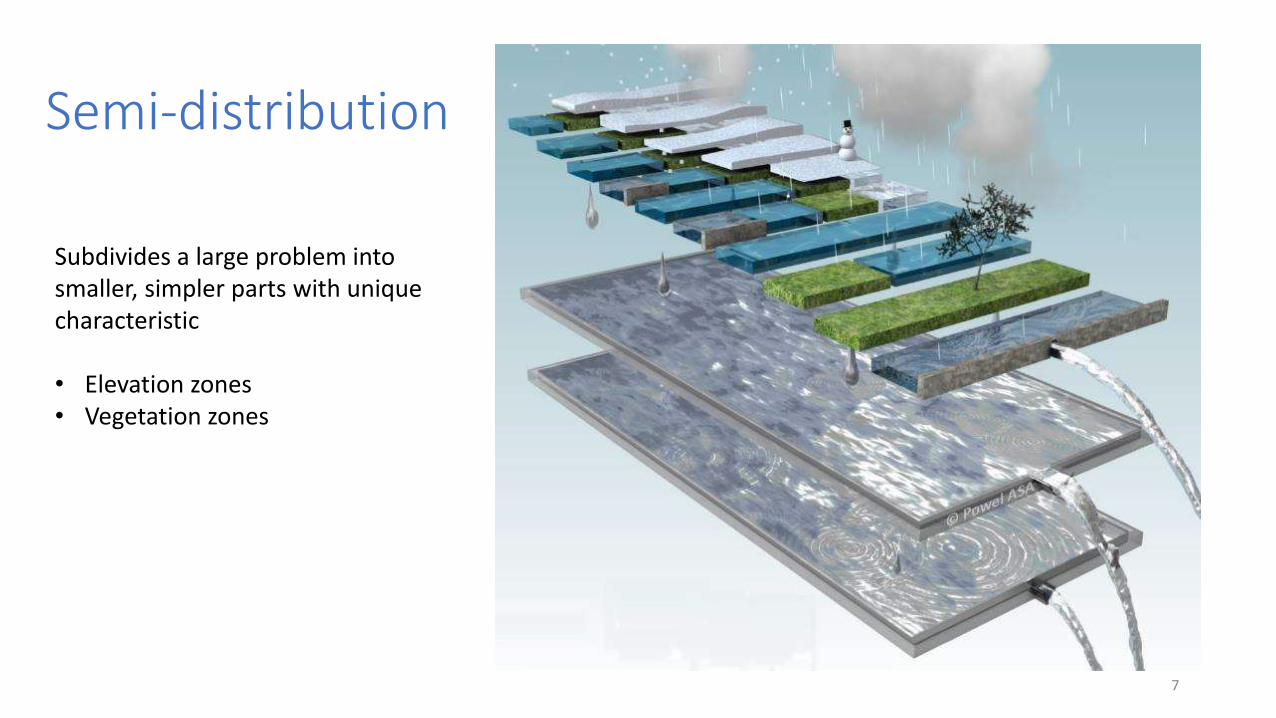
Semi-distribution
7
Subdivides a large problem into smaller, simpler parts with unique characteristic
• Elevation zones• Vegetation zones
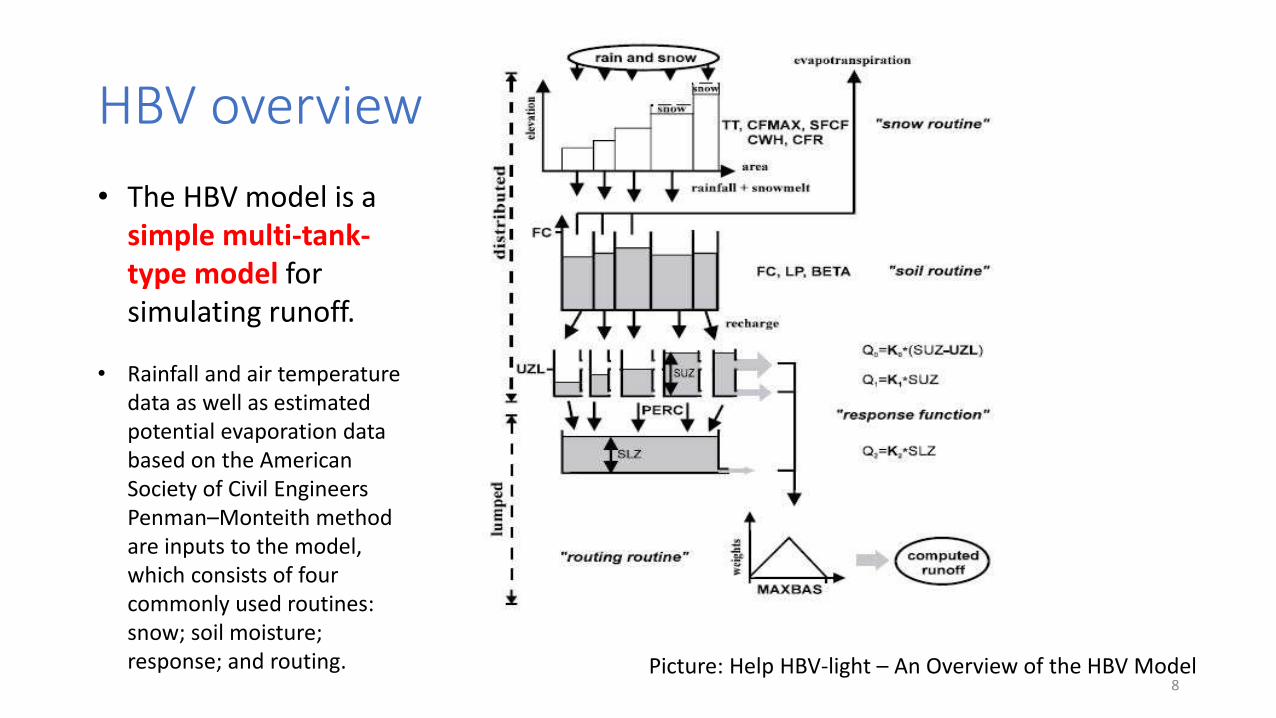
HBV overview
8
• The HBV model is a simple multi-tank-type model for simulating runoff.
• Rainfall and air temperature data as well as estimated potential evaporation data based on the American Society of Civil Engineers Penman–Monteith method are inputs to the model, which consists of four commonly used routines: snow; soil moisture; response; and routing. Picture: Help HBV-light – An Overview of the HBV Model

Model of Computed Runoff
9Source: Help HBV-light – Three GW Box (Distributed STZ and SUZ) Model
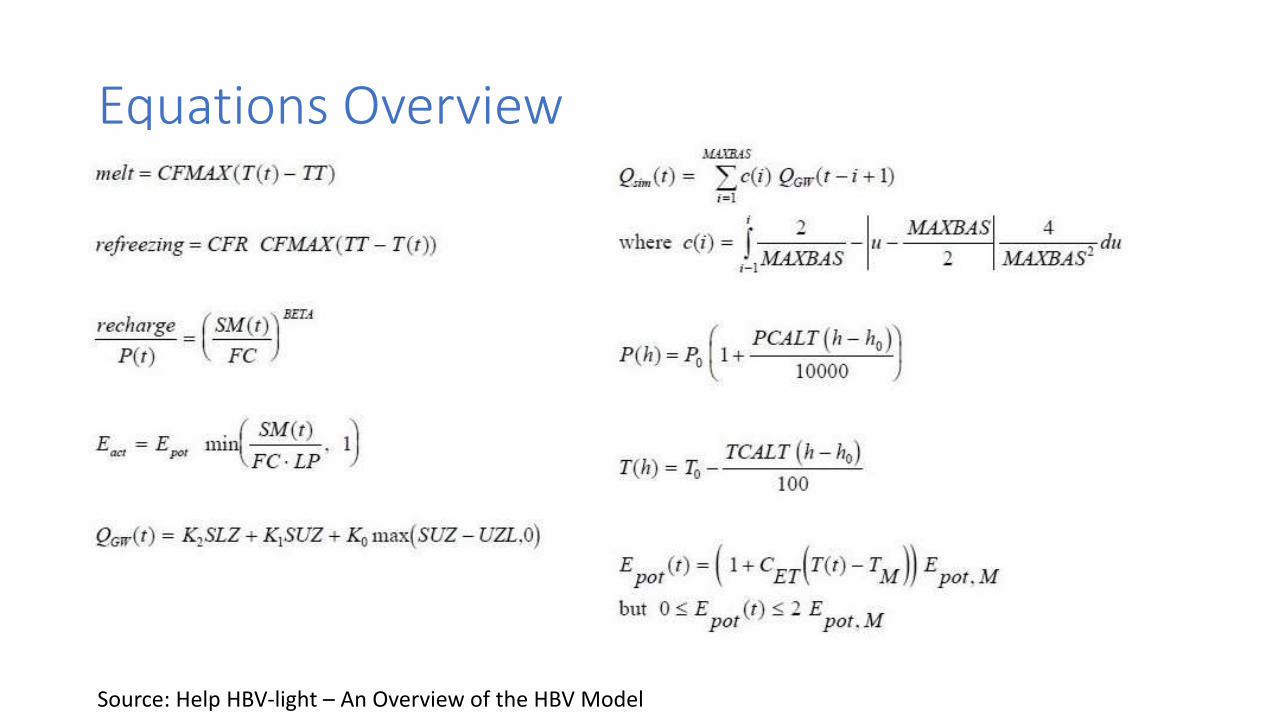
Equations Overview
Source: Help HBV-light – An Overview of the HBV Model

Catchment Parameters
Three GW Box (Distributed STZ and SUZ) Model
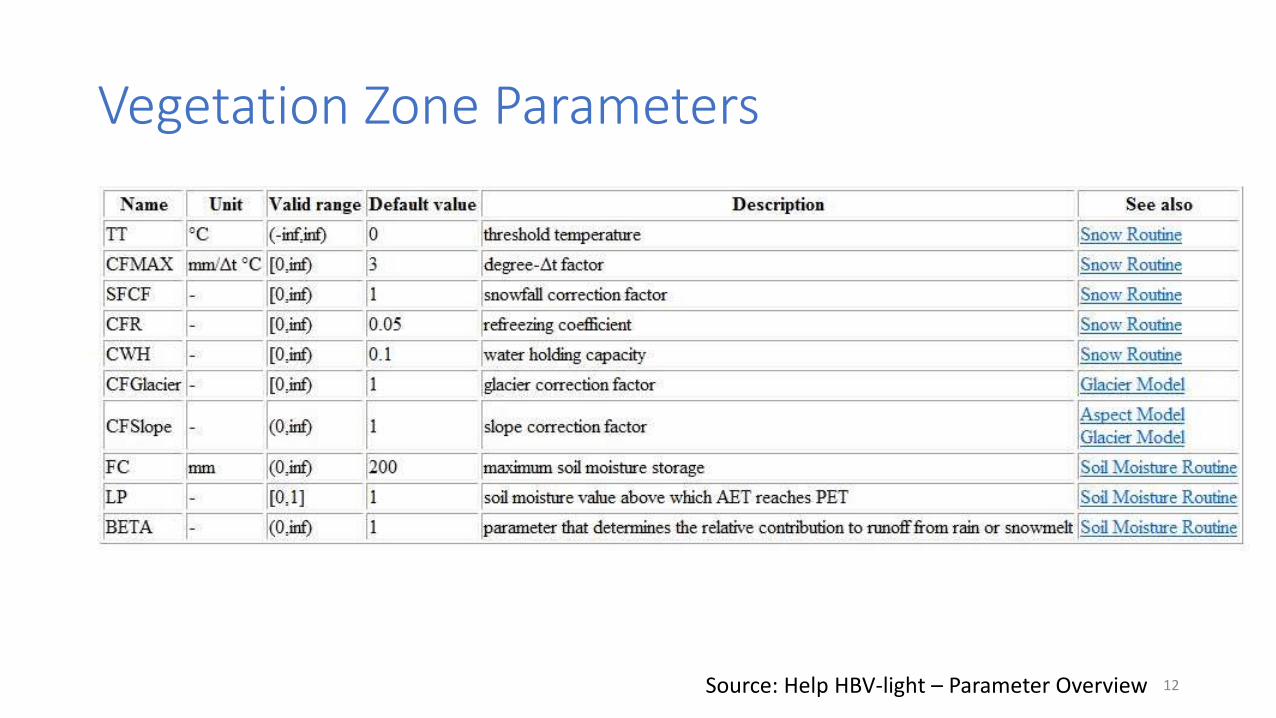
Vegetation Zone Parameters
12Source: Help HBV-light – Parameter Overview
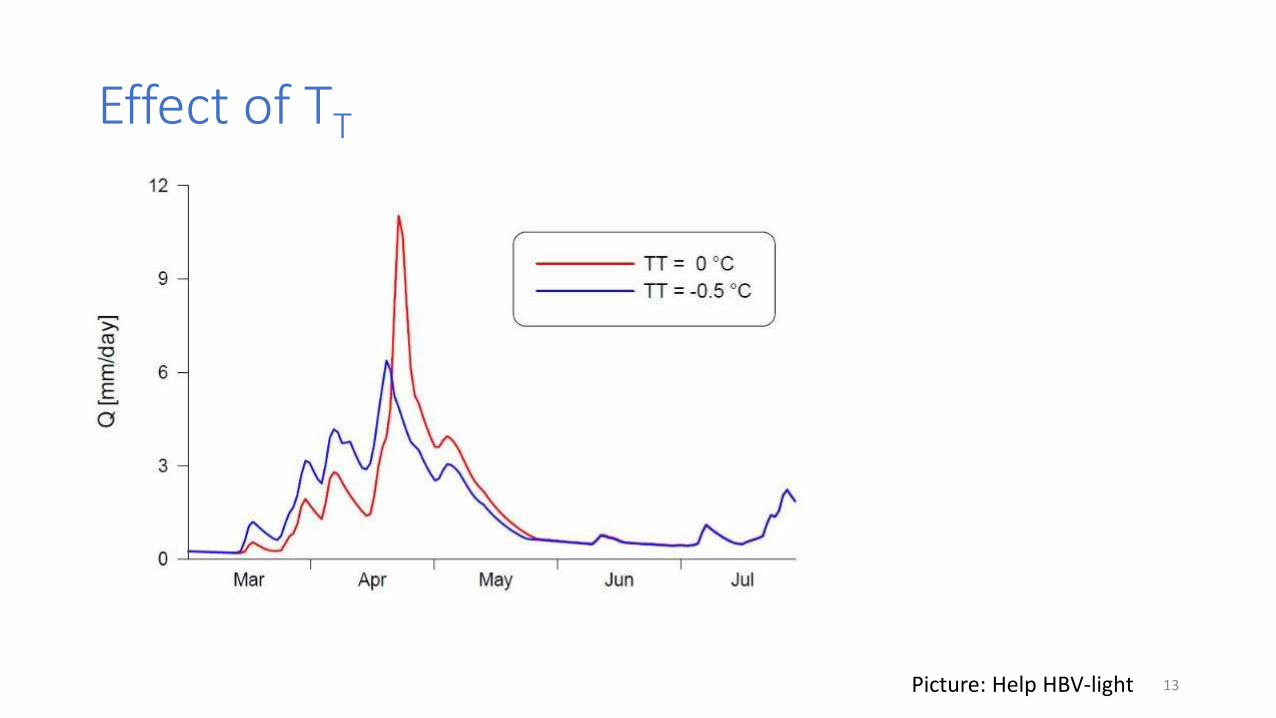
Effect of TT
13Picture: Help HBV-light

Savinja Catchment
14
• Enclosed Area of 1852.3 sq km• min_Elev_m=190.1 m• max_Elev_m=2429.0 m• avg_Elev_m=604.5 m• avg_Aspect=SE (127°)• Older_Celje_elev=~238.0 m

Flood 1954 Savinja-Celje
15

Josephinische Landesaufnahme (1763-1787)
16

Flood 1990 Savinja-Laško
17

HIGRIS –Hydrologic Graphical IS
- basically designed with Global Mapper and has more than 130 layers and a lot of external links
• GIS (Global Mapper [LiDAR], Map Window, SAGA, ILWIS, Google Earth Pro)
• CAD (AutoCAD MAP 3D, QuickSurf, Surfer)
• Graphic design (PhotoLine, PaintShop)
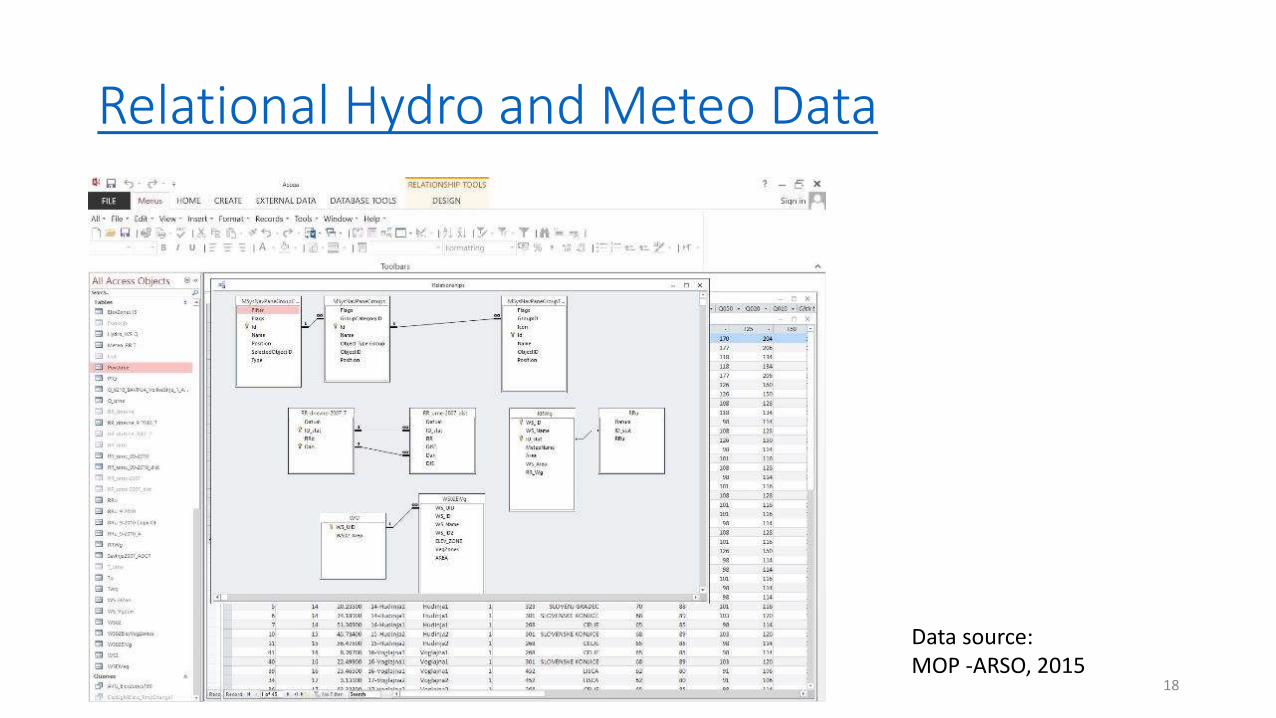
• DB (ASCII, MS Access, PostGIS)
• Statistic (MS Excell, Origin, Scilab)
• Programming (SQL, PowerBasic, Python with NumPy)
• P-R model (HBV-light_CLI, HBV-light-GUI)
• Calibration Tools (PEST, GAP and Monte Carlo are included in HBV-light)
• File navigation and data preview (Total Commander, IrfanView, Acrobat) 19
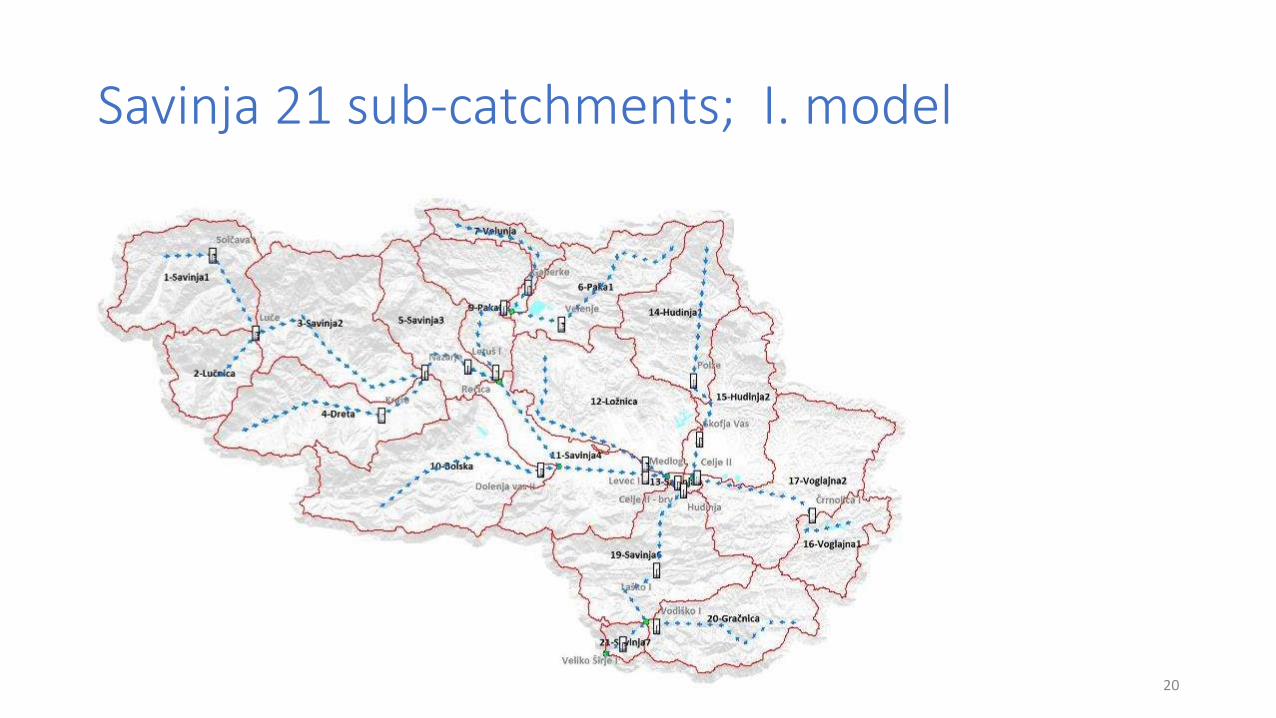
Savinja 21 sub-catchments; I. model
20
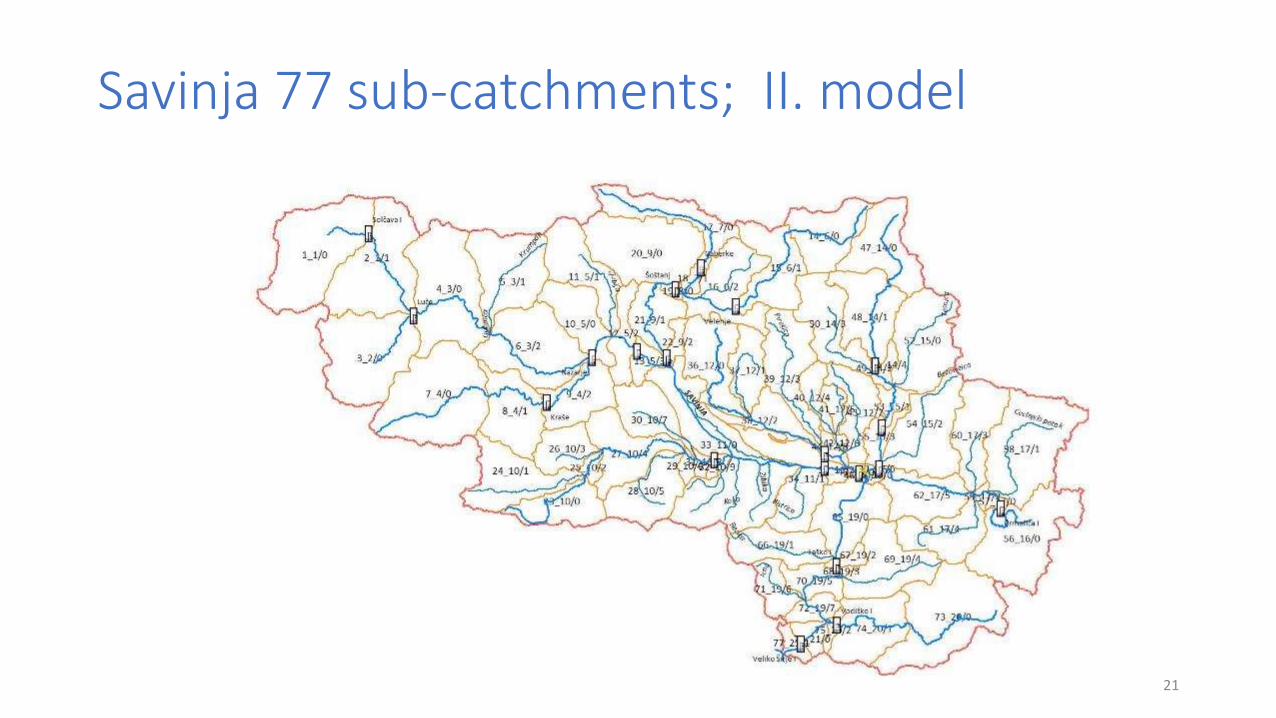
Savinja 77 sub-catchments; II. model
21
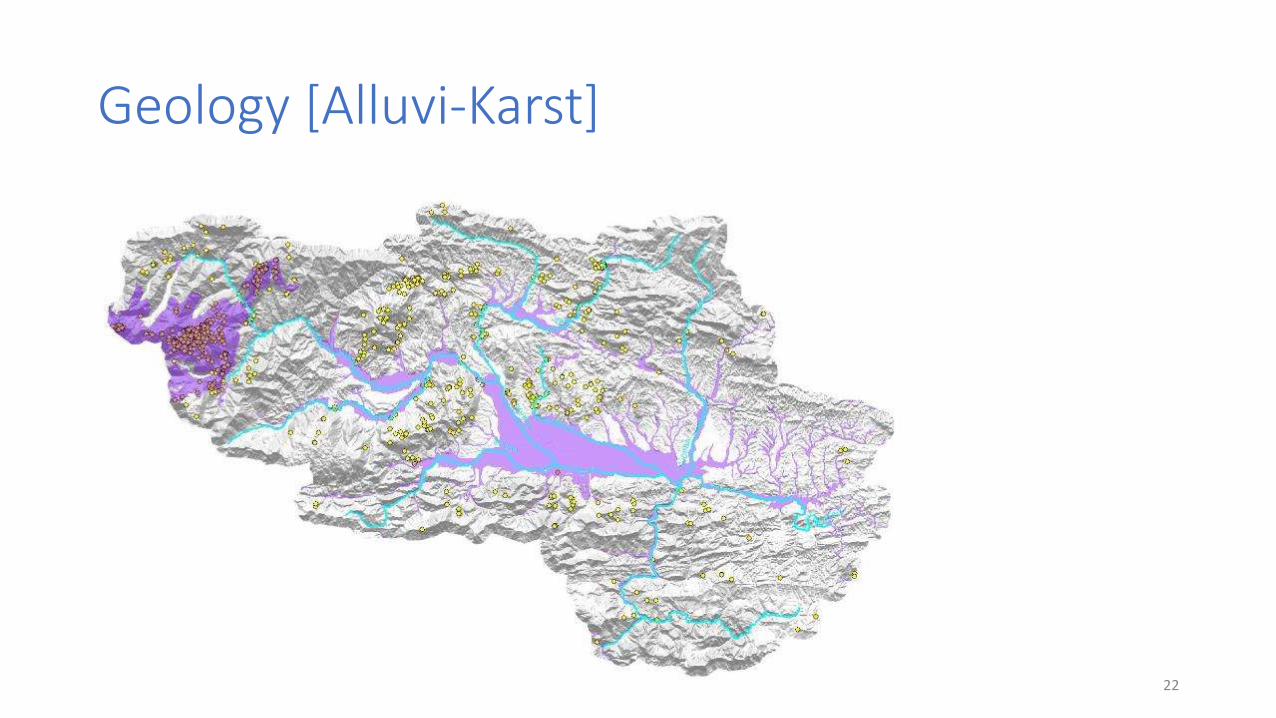
Geology [Alluvi-Karst]
22
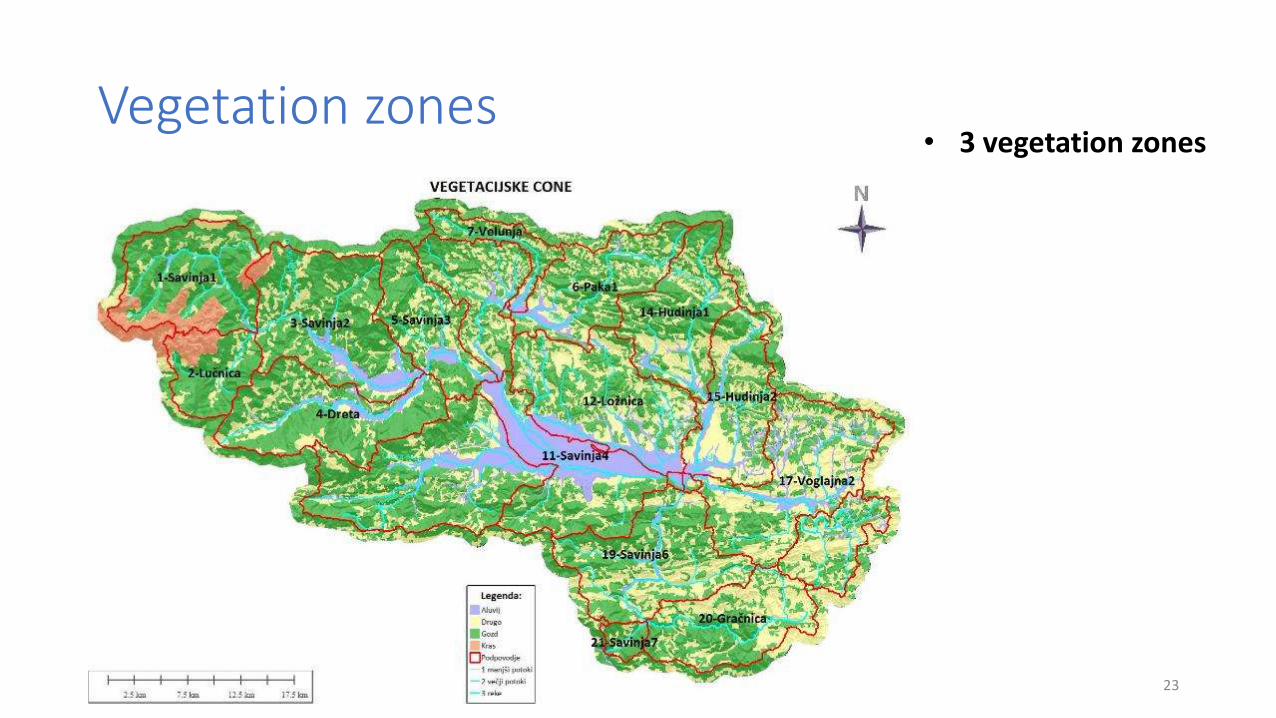
Vegetation zones
23
• 3 vegetation zones
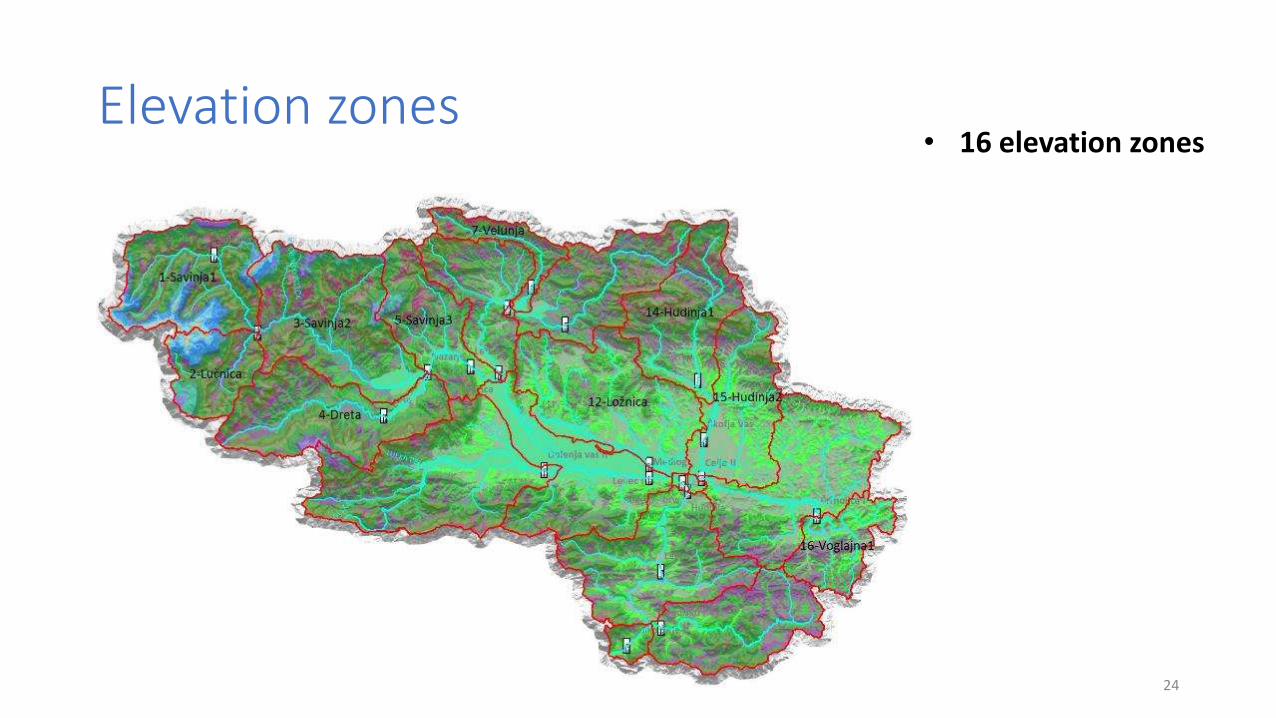
Elevation zones
24
• 16 elevation zones
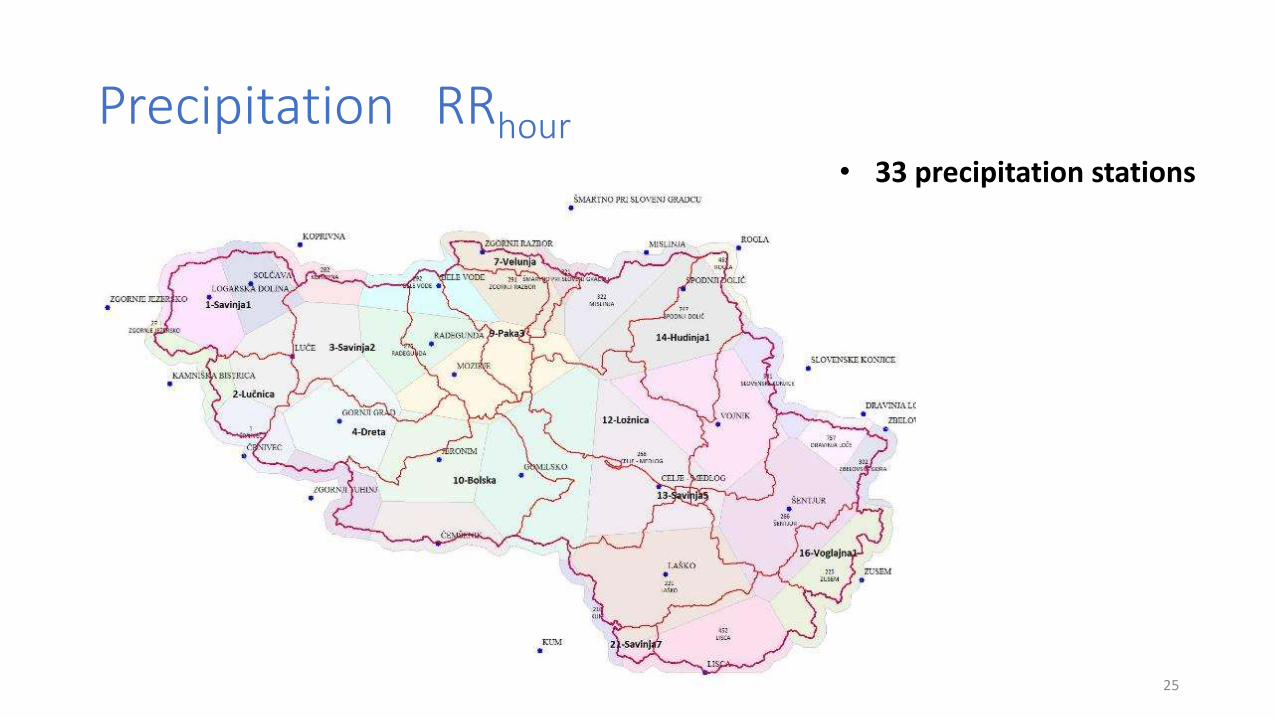
Precipitation RRhour
25
• 33 precipitation stations

What is PEST?
26
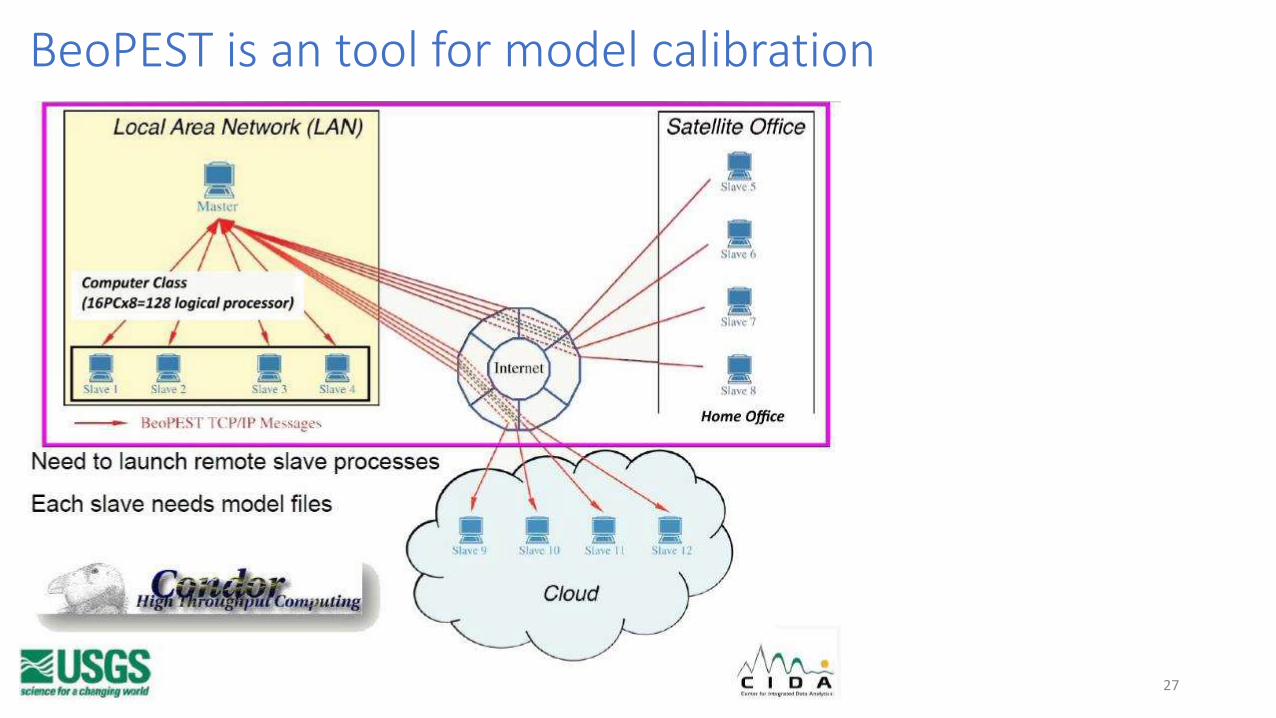
BeoPEST is an tool for model calibration
27
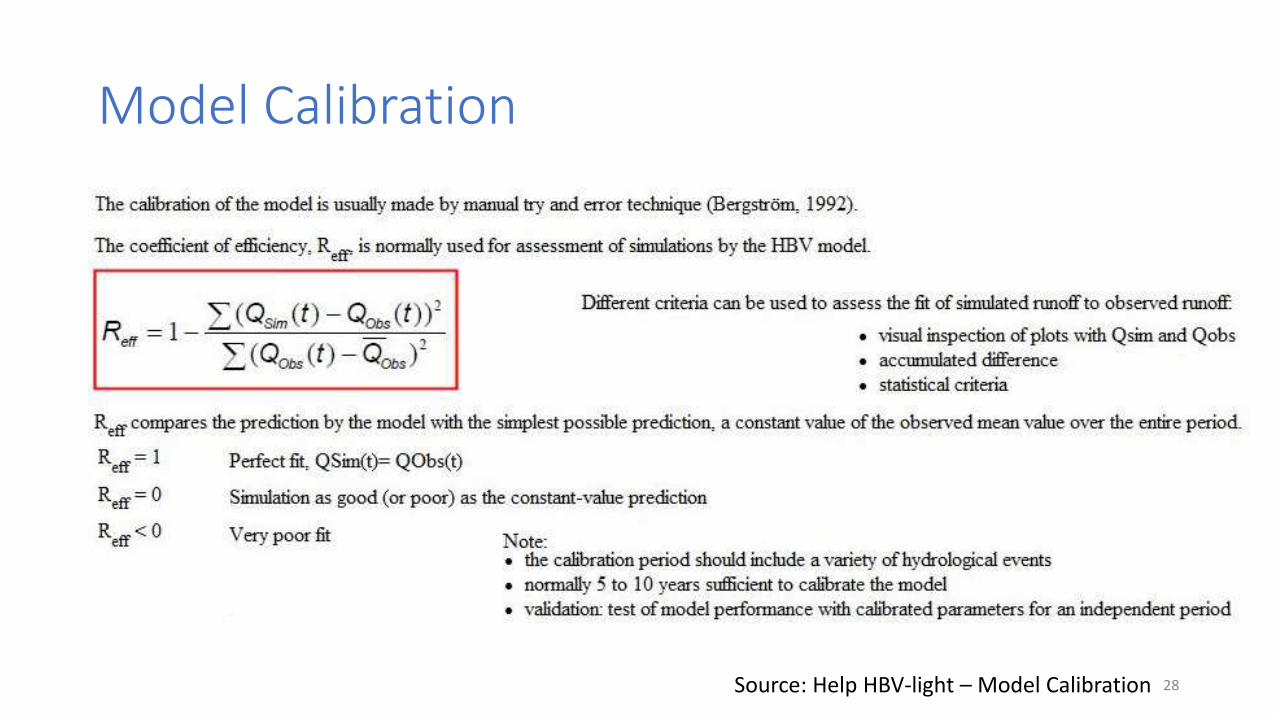
Model Calibration
28Source: Help HBV-light – Model Calibration
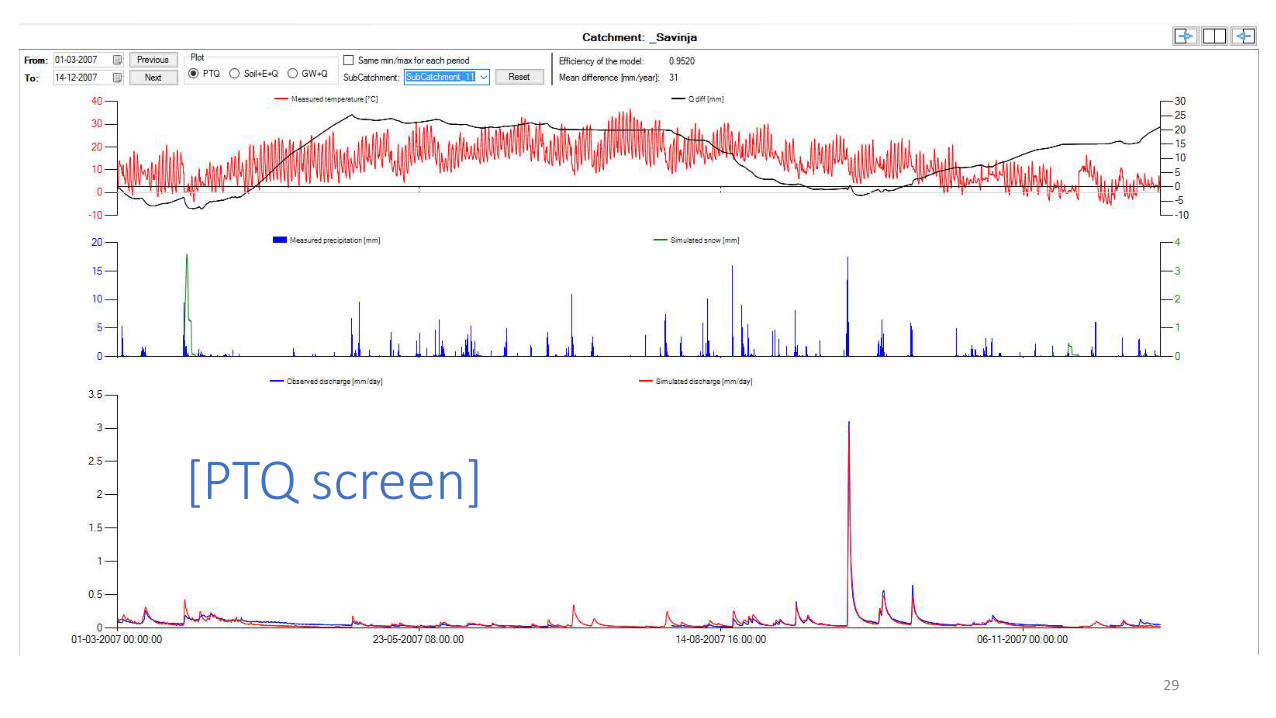
[PTQ screen]
29

Flood Wave Celje18.-20.09.1007
30
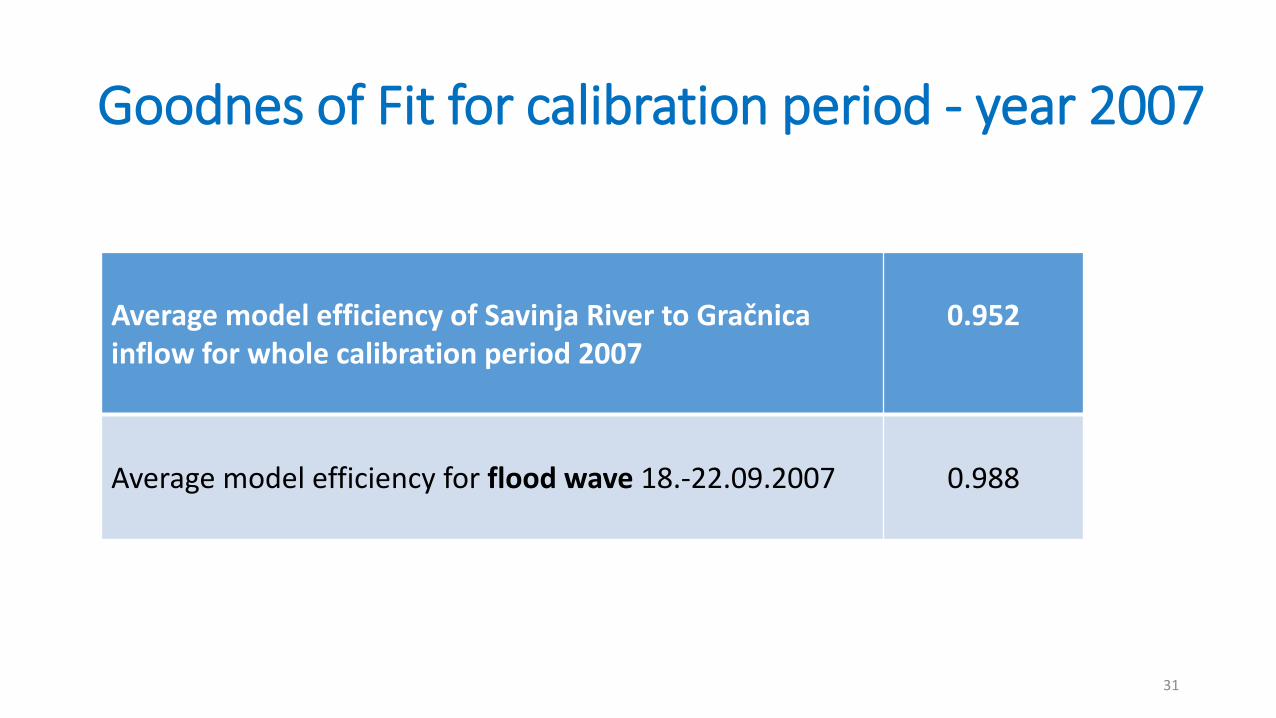
Goodnes of Fit for calibration period - year 2007
31
Average model efficiency of Savinja River to Gračnica inflow for whole calibration period 2007
0.952
Average model efficiency for flood wave 18.-22.09.2007 0.988
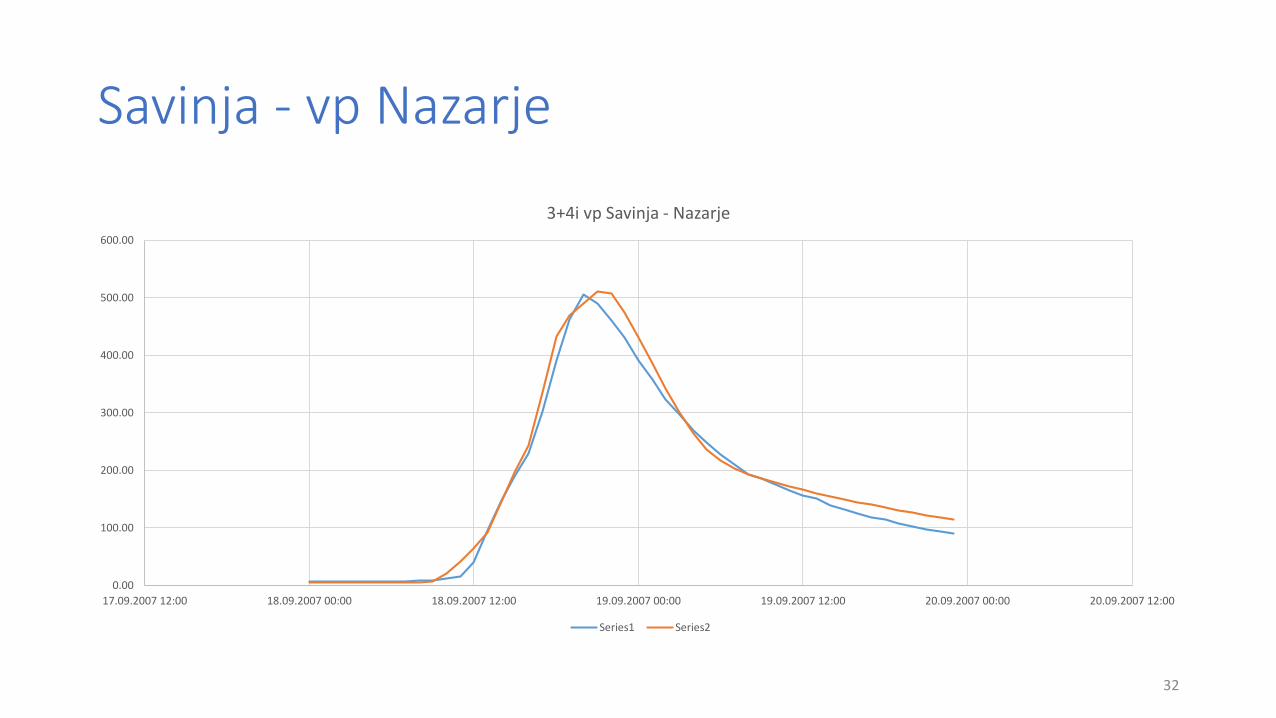
Savinja - vp Nazarje
32
0.00
100.00
200.00
300.00
400.00
500.00
600.00
17.09.2007 12:00 18.09.2007 00:00 18.09.2007 12:00 19.09.2007 00:00 19.09.2007 12:00 20.09.2007 00:00 20.09.2007 12:00
3+4i vp Savinja - Nazarje
Series1 Series2

Savinja - vp Letuš 1
33
0
100
200
300
400
500
600
700
17.09.2007 12:00 18.09.2007 00:00 18.09.2007 12:00 19.09.2007 00:00 19.09.2007 12:00 20.09.2007 00:00 20.09.2007 12:00
5 vp Savinja -Letuš I
Series1 Series2

Savinja – vp Medlog
34
0
100
200
300
400
500
600
700
800
900
1000
17.09.2007 12:00 18.09.2007 00:00 18.09.2007 12:00 19.09.2007 00:00 19.09.2007 12:00 20.09.2007 00:00 20.09.2007 12:00
11 vp Savinja - Medlog
Series1 Series2

Savinja – vp Celje II _ brv
35
0
200
400
600
800
1000
1200
17.09.2007 12:00 18.09.2007 00:00 18.09.2007 12:00 19.09.2007 00:00 19.09.2007 12:00 20.09.2007 00:00 20.09.2007 12:00
13 vp Savinja - Celje II - brv
Series1 Series2

Savinja – vp Laško
36
0
200
400
600
800
1000
1200
1400
17.09.2007 12:00 18.09.2007 00:00 18.09.2007 12:00 19.09.2007 00:00 19.09.2007 12:00 20.09.2007 00:00 20.09.2007 12:00
19 vp Savinja - Laško
Series1 Series2

Dreta – vp Kraše
37
0.00
50.00
100.00
150.00
200.00
250.00
17.09.2007 12:00 18.09.2007 00:00 18.09.2007 12:00 19.09.2007 00:00 19.09.2007 12:00 20.09.2007 00:00 20.09.2007 12:00
4 vp Dreta - Kraše
Series1 Series2

Bolska – vp Dolenja vas
38
0
20
40
60
80
100
120
140
160
17.09.2007 12:00 18.09.2007 00:00 18.09.2007 12:00 19.09.2007 00:00 19.09.2007 12:00 20.09.2007 00:00 20.09.2007 12:00
10 vp Bolska - Dolenja vas
Series1 Series2
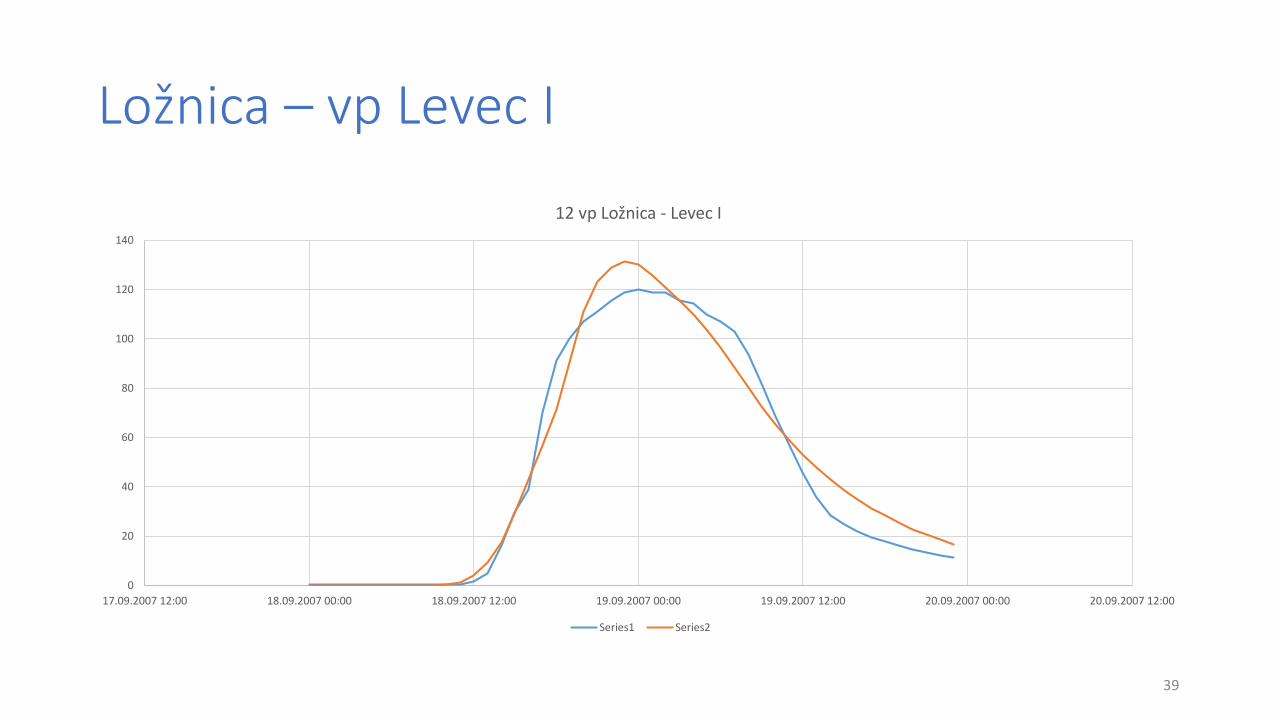
Ložnica – vp Levec I
39
0
20
40
60
80
100
120
140
17.09.2007 12:00 18.09.2007 00:00 18.09.2007 12:00 19.09.2007 00:00 19.09.2007 12:00 20.09.2007 00:00 20.09.2007 12:00
12 vp Ložnica - Levec I
Series1 Series2

Gračnica – vp Vodiško I
40
0
2
4
6
8
10
12
14
17.09.2007 12:00 18.09.2007 00:00 18.09.2007 12:00 19.09.2007 00:00 19.09.2007 12:00 20.09.2007 00:00 20.09.2007 12:00
20 vp Gračnica - Vodiško I
Series1 Series2

Goodnes of Fit for validation period - year 1990
41
WS2 WS2_Name NS (1.10-14.11.1990)
1 Savinja do VP Solčava I 0.85
8 Dreta do VP Kraše 0.90
38 Ložnica do VP Levec I 0.94
45 Savinja do VP Celje II - brv 0.97
53 Hudinja do VP Škofja Vas 0.8
62 Voglajna do VP Celje II 0.8
67 Savinja do VP Laško 0.97
76 Savinja do VP Veliko Širje I 0.84

Flood Wave vp Laško26.10.-05.11.1990
42

Savinja – vp Celje II _ brv
43
0
200
400
600
800
1000
1200
1400
26.10.1990 00:00:00 28.10.1990 00:00:00 30.10.1990 00:00:00 01.11.1990 00:00:00 03.11.1990 00:00:00 05.11.1990 00:00:00 07.11.1990 00:00:00 09.11.1990 00:00:00 11.11.1990 00:00:00
Savinja-Celje II - brv
Series2 Series3
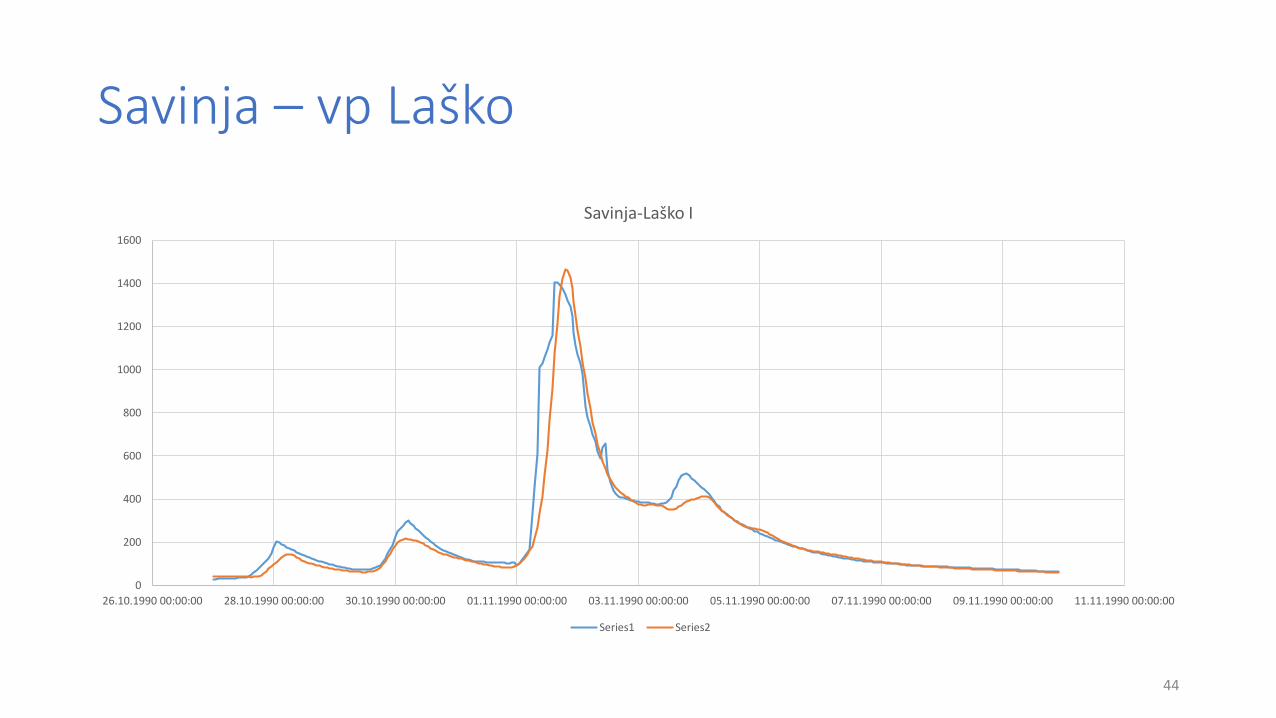
Savinja – vp Laško
44
0
200
400
600
800
1000
1200
1400
1600
26.10.1990 00:00:00 28.10.1990 00:00:00 30.10.1990 00:00:00 01.11.1990 00:00:00 03.11.1990 00:00:00 05.11.1990 00:00:00 07.11.1990 00:00:00 09.11.1990 00:00:00 11.11.1990 00:00:00
Savinja-Laško I
Series1 Series2

Ložnica – vp Levec I
45
0
10
20
30
40
50
60
70
80
90
26.10.1990 00:00 28.10.1990 00:00 30.10.1990 00:00 1.11.1990 00:00 3.11.1990 00:00 5.11.1990 00:00 7.11.1990 00:00 9.11.1990 00:00 11.11.1990 00:00
Ložnica-Levec I
Series1 Series2

Dreta – vp Kraše
46
0
50
100
150
200
250
300
26.10.1990 00:00:00 28.10.1990 00:00:00 30.10.1990 00:00:00 01.11.1990 00:00:00 03.11.1990 00:00:00 05.11.1990 00:00:00 07.11.1990 00:00:00 09.11.1990 00:00:00 11.11.1990 00:00:00
Dreta-Kraše
Series1 Series2
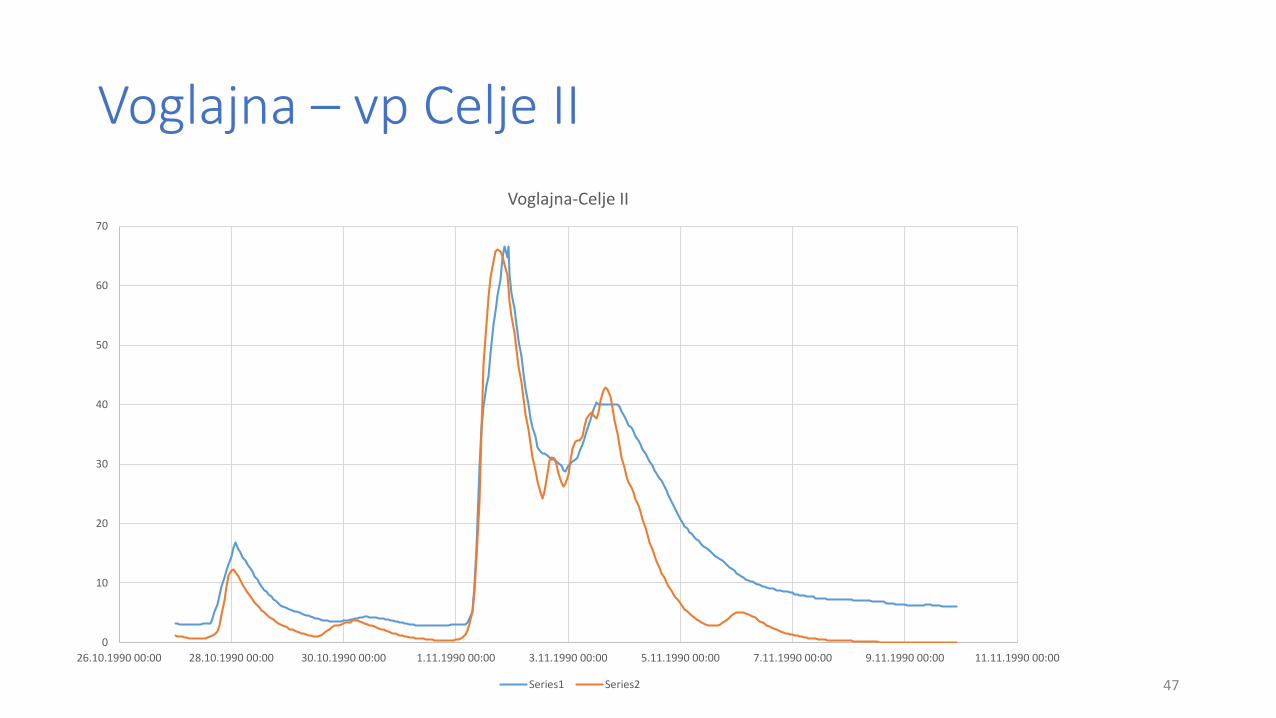
Voglajna – vp Celje II
47
0
10
20
30
40
50
60
70
26.10.1990 00:00 28.10.1990 00:00 30.10.1990 00:00 1.11.1990 00:00 3.11.1990 00:00 5.11.1990 00:00 7.11.1990 00:00 9.11.1990 00:00 11.11.1990 00:00
Voglajna-Celje II
Series1 Series2
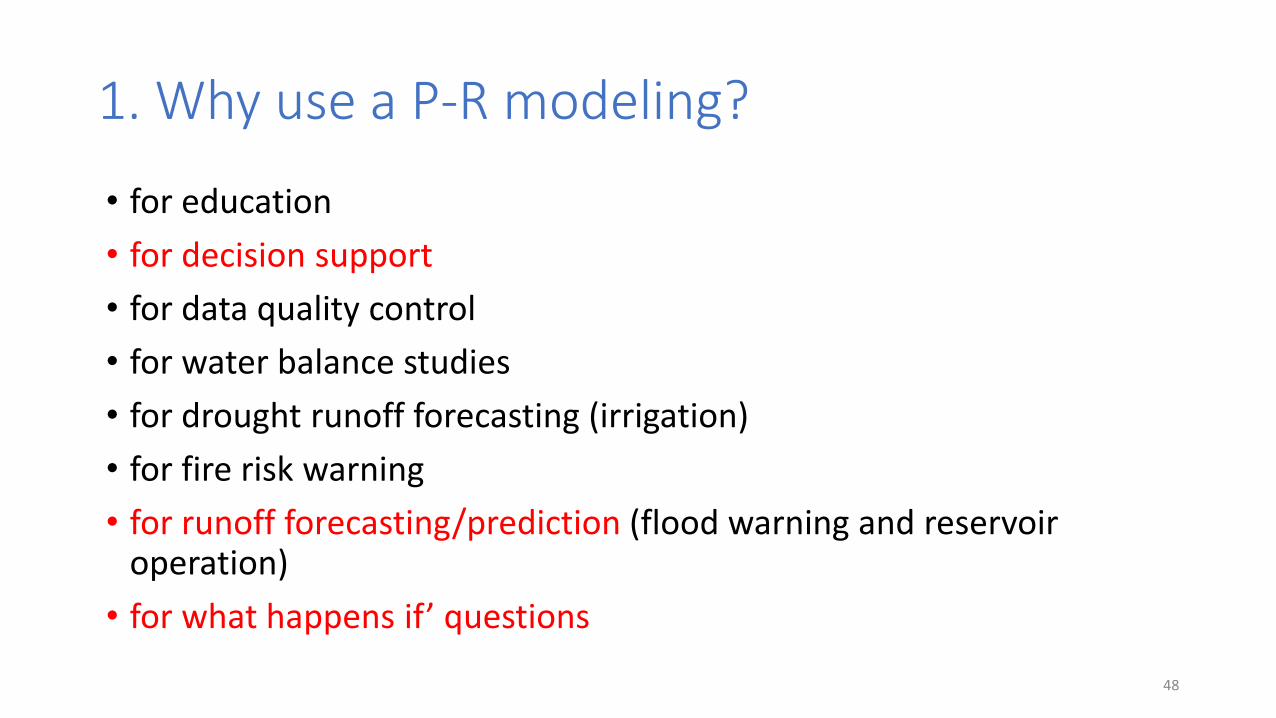
1. Why use a P-R modeling?
• for education
• for decision support
• for data quality control
• for water balance studies
• for drought runoff forecasting (irrigation)
• for fire risk warning
• for runoff forecasting/prediction (flood warning and reservoir operation)
• for what happens if’ questions
48

2. Why use a P-R modeling?
• to compute design floods for flood risk detection
• to extend runoff data series (or filling gaps)
• to compute design floods for dam safety
• to compute energy production
• to investigate the effects of land-use changes within the catchment
• to simulate discharge from ungauged catchments
• to simulate climate change effects
49

Designed Flood Predictions
• based on flood event 2007 (50 year return period)24 hour Precipitation Event for Q10, Q20, Q50, Q100, Q200 and Q500
• based on flood event 1990 and 1998 (100 year return period)48 hour Precipitation Event for Q10, Q20, Q50, Q100, Q200 and Q500
50