precipitation associated with 500 hpa closed cyclones anantha aiyyer eyad atallah department of...
Post on 19-Dec-2015
213 views
TRANSCRIPT

Precipitation Associated with 500 hPa Closed Cyclones
Anantha Aiyyer
Eyad Atallah
Department of Earth and Atmospheric Sciences, University at Albany

Motivation
• What percentage of precipitation in the Northeast is associated with closed lows?
• What are the regional and seasonal precipitation signals?
• Availability of gridded data sets.

Data and Methodology
• NCEP/NCAR Reanalyses at 500 hPa. • Unified Precipitation Dataset – .250 lat-lon
grid (http://www.cdc.noaa.gov/cdc/data.unified.html).
• Period of interest 1950-1998.• Use an objective algorithm to identify
closed lows.• Define a closed low as a 30 m height rise
from a local min in the height field.


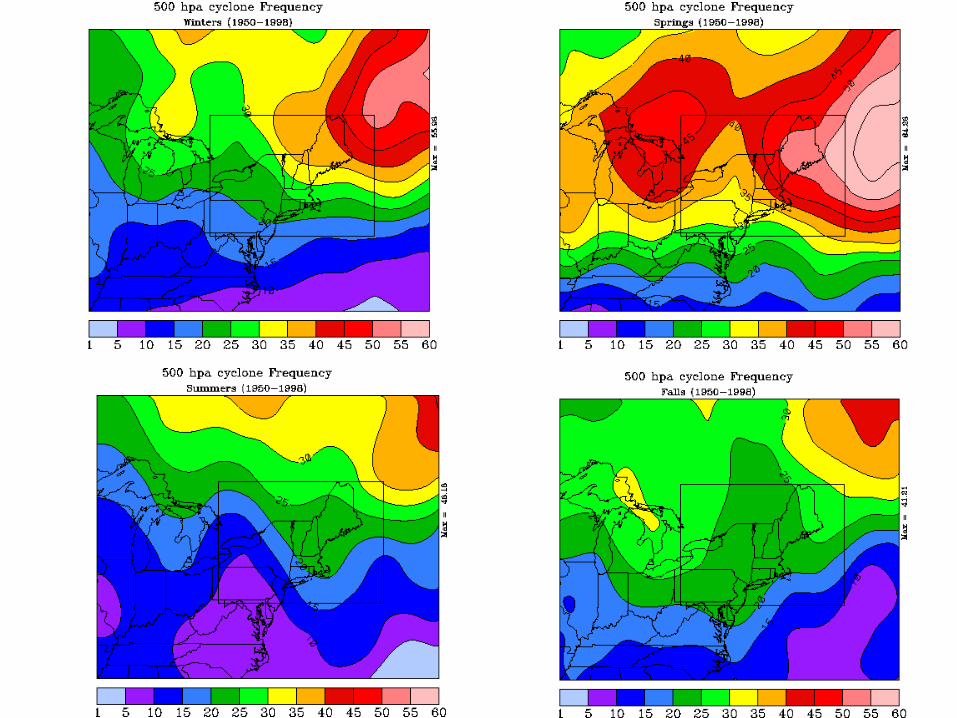

• Mainly zonal distribution of closed lows.
• Genesis area in the NW Atlantic.
• Spring is the most active season.
• Summer is the least active season.
• Possible tropical cyclone contribution in the summer.


• Annual mean precipitation field strongly modulated by topography.
• Upslope and lake effect signatures dominate cool season precip.
• Terrain elevation signatures dominate warm season precip.
• Lows contribute a higher percentage of total precipitation in coastal areas, especially in Spring.
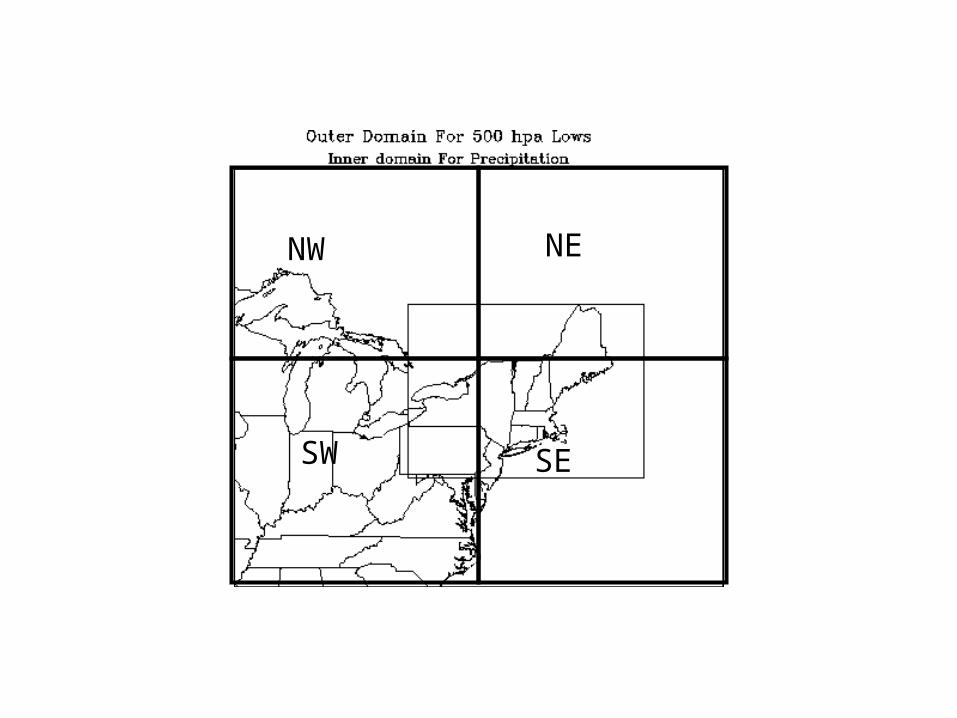
NW NE
SW SE


• Heaviest precip from lows in western quadrants.
• Upslope signatures strongest in western quadrants.
• Precip rates maximized with lows in SW quadrant.
• NE quadrant shows prominent lake effect signature.
• SE quadrant precip rates maximized along eastern most terrain features.


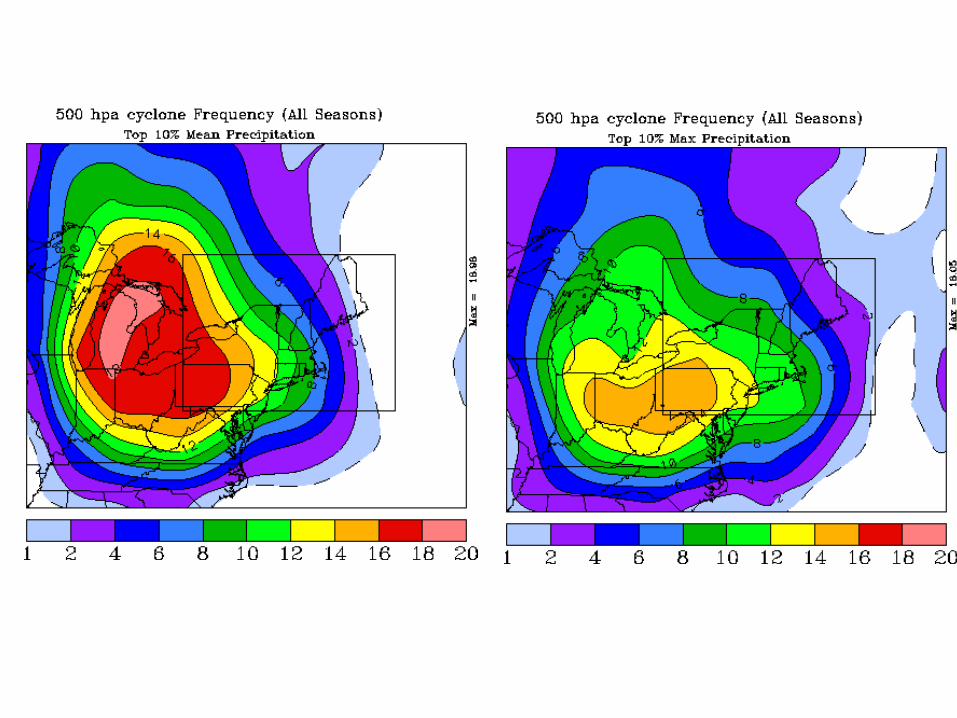


• Probability of occurrence decreases rapidly with increasing precip rates.
• 60% of lows produce mean precip rates of 5 mm or greater over the entire domain.
• Local maximum precipitation has a relatively even distribution over wide range of rates.
• Ideal low position for highest domain-wide precip is west of the NE.
• Ideal low position for highest local max precip is southwest of the NE.


Speed vs. Mean Precip
0
0.2
0.4
0.6
0.8
1
1.2
1.4
1.6
0 10 20 30 40 50
Speed (m/s)
Are
a a
vg
pre
cip
(m
m/d
ay)
Avg precip
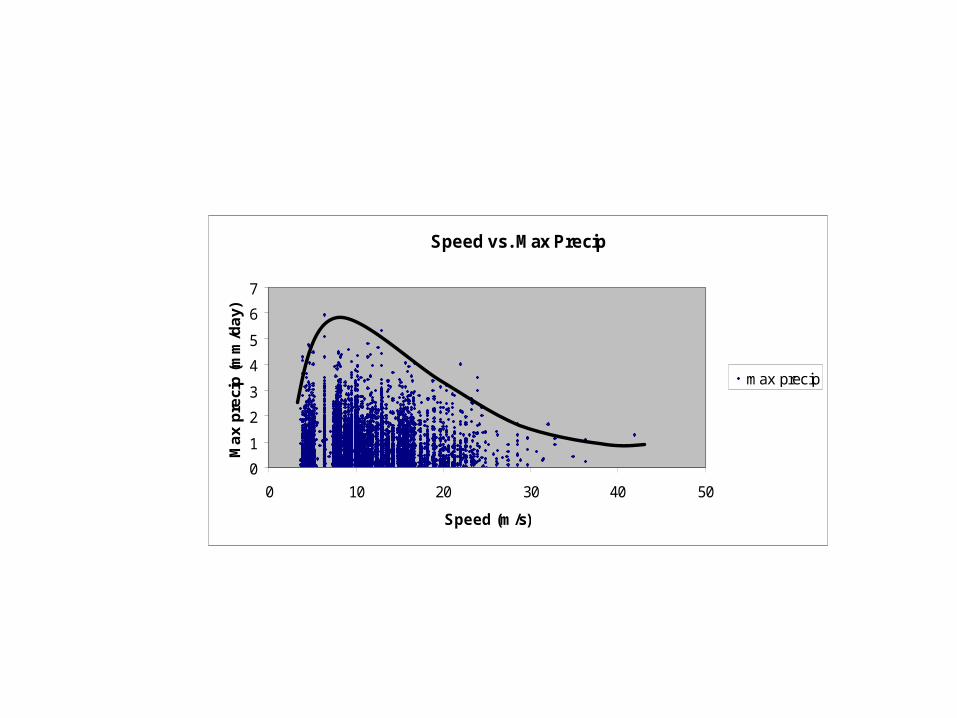
Speed vs. Max Precip
0
1
2
3
4
5
6
7
0 10 20 30 40 50
Speed (m/s)
Ma
x p
reci
p (
mm
/da
y)
max precip
