pre-treatment of wastewater at wet … of wastewater at wet market using effective microorganism...
TRANSCRIPT
PRE-TREATMENT OF WASTEWATER AT WET MARKET USING
EFFECTIVE MICROORGANISM (EM) TECHNOLOGY
NUR AFIQA B1NTI ISHAK
A thesis submitted in fulfillment of the requirements for the award of the degree of
Bachelor of Civil Engineering
Faculty of Civil Engineering & Earth Resources
University Malaysia Pahang
NOVEMBER 2010

ABSTRACT
Wastewater quality was very important because it surround us almost everywhere. Aquatic life can be destroyed and health problems also can occur and affect human being. The quality of wastewater coming from wet market was known to be a public problem before it being treated. Pre-treatment process by using environment friendly method, Effective Microorganism (EM) Technology was proposed to be a solution way to reduce pollution problem with the wastewater. The objectives of the research were to determine the level of parameters of wastewater coming from the wet market and to see how effectiveness of using EM technology as the pre-treatment of the wastewater from the wet market. Sample taken from Pasar Borong Kemunting, Pahang and be analyzed in UMP laboratory. The experimental was carried out once a week and continues for 12 weeks period. The 7 parameters were analyzed which include pH, Turbidity, Total Dissolve Solid (TDS), Ammonia Nitrogen, Total Suspended Solid (TSS), Chemical Oxygen Demand (COD) and Biochemical Oxygen Demand (BOD). The 7 parameters will be referred to Standard Examination of Water and Wastewater by American Public Health Associate (APHA, 2002). In this research, wastewater sample collected from the wet market being added by two types of EM which were Effective Cultura (EC) and J-M2 1 (JM). The results obtained then being compared to the Interim National Water Quality Standard (INWQS) for Malaysia to see the differences. Statistical analysis of the data to evaluate performance differences among two type of EM was done by using Independent Sample T-test in Social Scientific Statistical Software (SPSS). Based on the finding result, it was found that most of the parameter improved in water quality after EM was added like turbidity, AN, TSS, COD and BOD. The most positively improvement from the results was turbidity parameter, which changes from Class II to nearly Class I after pre-treatment were made. Turbidity percentages of changing were determined as 73% for EC and 74.7% for JM. However, more time was needed to see the optimum reaction of the EM. From the study, it hopes to provide solutions to the pollution. EM technology was easy to use and cost effective because it does not requires changes to the existing treatment and collection system and application equipment is relatively inexpensive.
V

ABSTRAK
Kualiti Air Sisa adalah sangat penting kerana ia berada hampir di mana-mana. la boleh mengakibatkan hidupan air musnahkan dan masalah kesihatan berlaku terhadap manusia. Sebelum air sisa dirawat, kualiti air sisa dari pasar basah telah dikesan menjadi salah satu masalah umum. Proses pra-rawatan dengan menggunakan kaedah yang mesra alam iaitu Teknologi Mikroorgãnisma Efektif (EM) dicadangkan menjadi penyelesaian bagi mengurangkan masalah pencemaran air sisa. Tujuan kajian mi adalah untuk menentukan tahap parameter air sisa yang berasal dari pasar basah dan untuk melihat bagaimana keberkesanan penggunaan teknologi EM sebagai proses pra-rawatan air sisa dari pasar basah. Sampel diambil daripada Pasar Borong Kernunting, Pahang dan dianalisa di lab UMP. Data eksperirnen diambil pada setiap rninggu dan dijalankan selama 12 minggu. Tijuh parameter dianalisis yang meliputi pH, Kekeruhan, Jumlah Pepejal Terlarut (TDS), Ammonia Nitrogen (AN), Jumlah Pepejal Terampai (TSS), Keperluan Oksigen Kimia (COD) dan Keperluan Oksigen Biokimia (BOD). Tujuh parameter tersebut dirujuk kepada Standard Pemeriksaan Air dan Air Sisa oleh 'American Public Health Association (APHA, 2002). Dalam kajian mi, sampel air sisa dikumpul dari pasar basah dan ditambah dengan dua jenis EM iaitu 'Effective Cultura' (EC) dan J-M21 QM). Keputusan yang diperolehi kemudian dibandingkan dengan Interim National Water Quality Standard (INWQS) untuk Malaysia. Keputusan mi juga dianalisis secara statistik untuk melihat perbezaan dengan menggunakan 'Independent Sample T-test' di dalam 'Social Scientific Statistical Software' (SPSS). Berdasarkan hasil kajian, didapati bahawa sebahagian besar parameter mengalami peningkatan kualiti air selepas EM ditambah seperti kekeruhan, AN, TSS, COD dan BOD. Keputusan yang paling efektif adalah kekeruhan dimana keputusan dari parameter kekeruhan berubah danipada Kelas II ke Kelas I selepas pra-rawatan dibuat. Peratusan perubahan bagi setiap jenis EM adalah 73% untuk EC dan 74.7% untuk JM. Namun, iebih banyak masa diperlukan untuk melihat reaksi optimum EM. Dari kajian mi, ia harap dapat memberikan penyelesaian untuk pencemaran. Teknologi EM adalah rnudah digunakan dan kos efektif kerana tidak memerlukan perubahan untuk rawatan yang sedia ada dan sistem pengumpulan dan peralatan aplikasi yang relatifmurah.
Vi

TABLE OF CONTENTS
CHAPTER TITLE PAGE
DECLARATION ii
DEDICATION iii
ACKNOWLEDGEMENTS iv
ABSTRACT v
ABSTRAK vi
TABLE OF CONTENTS vii
LIST OF TABLES xi
LIST OF FIGURES xii
LIST OF ABBREVIATIONS xiv
LIST OF SYMBOLS xv
LIST OF APPENDICES xvi
INTRODUCTION 1
1.1 Introduction 1
1.2 Problem Statement 2
1.3 Objectives of Study 4
1.4 Scope of Study 4
1.5 Significant of study 5
vi'
viii
2 LITERATURE REVIEW 6
2.1 Introduction 6
2.2 Water Pollution 7
2.2.1 Water Pollution Problem in Malaysia 7
2.2.2 Point Source Pollution 9
2.2.3 Non-point Source Pollution 10
2.3 Water and Disease 10
2.3.1 Microorganisms and Disease 10
2.4 Wastewater 11
2.4.1 Definition of Wastewater 11
2.4.2 Characteristic of Wastewater 12
2.5 Wastewater Treatment 12
2.6 Wet Market 13
2.7 Pathogen 14
2.8 The Concept of Effective Microorganisms (EM) 14
2.8.1 Microorganisms Contains in EM 15
2.8.2 The Technology of EM 16
2.8.3 EM Effect on .Suspended Solid 17
2.8.4 Odor Control with EM 18
2.8.4.1 Hydrogen Sulfide Reduction, 18
Mercaptans, Ammonia.
2.9 Water Quality Parameters 18
2.10 Summary 19
ix
3 METHODOLOGY 20
3.1 Introduction 20
3.2 Study Approaches 20
3.2.1 First Phase 21
3.2.2 Second Phase 22
3.2.3 Third Phase 22
3.2.4 Fourth Phase 22
3.3 Background of Study Area 24
3.4 Sampling Location 25
3.5 Sampling and Preservation of Samples 26
3.6 Sample Testing! Experiment 27
3.6.1 On-site Test 27
3.6.2 Laboratory Test 28
3.6.2.1 Adding the EM 29
3.6.2.2 Ammonia Nitrogen (AN) Test 30
3.6.2.3 BOD Test 31
3.6.2.4 COD Test 32
3.6.3 Quality Standard 33
4 RESULT AND DISCUSSION 34
4.1 Introduction 34
4.2 Experiment Result 34
4.3 Parameter Analysis 35
4.3.1 pH Analysis 36
4.3.2 Turbidity Analysis 39
4.3.3 Total Dissolve Solid Analysis 41
4.3.4 Ammonia Nitrogen Analysis 44
4.3.5 Total Suspended Solid Analysis. 46
4.3.6 Chemical Oxygen Demand Analysis 49
4.3.7 Biochemical Oxygen Demand Analysis 52
CONCLUSION AND RECOMMENDATION 55
5.1 Conclusion
55
5.2 Recommendation 57
REFERENCES
APPENDICES A-D 62
LIST OF TABLES
TABLE NO. TITLE PAGE
2.1 Total BOD Load (kg/day) from Sewage Treatment Plants 9
(IWK, 2008).
3.1 Water Sample Preservation. 31
3.2 Interim National Water Quality Standard (1NWQS) for 33
Malaysia.
4.1 Value of each parameter at the beginning phase. 35
4.2 pH parameter data from the laboratory experiment. 36
4.3 Turbidity parameter data from the laboratory experiment. 39
4.4 TDS parameter data from the laboratory experiment. 42
4.5 AN parameter data from the laboratory experiment. 44
4.6 TSS parameter data from the laboratory experiment 47
4.7 COD parameter data from the laboratory experiment 49
4.8 BOD parameter data from the laboratory experiment 52
xi

LIST OF FIGURES
FIGURE TITLE
PAGE
NO.
xl'
1.1 Water Quality Status for River Basins of Peninsular
Malaysia, 2008
2.1 Composition of Water Pollution Sources by Sector (DOE
Malaysia, 2008).
2.2 Timeline of Federal Water Pollution Control Acts and
Programs (US EPA, 2003).
3.1 Flow chart of the experiment.
3.2 Study area location at Pasar Borong Kemunting,
Kuantan, Pahang
3.3 Location map of study area at Pasar Borong Kemunting,
Kuantan, Pahang
3.4 Location wastewater from the wet market flows out.
3.5 Multi-parameter Water Quality Checker
3.6 Both type of EM added to the sample.
3.7 Sample of Ammonia Nitrogen (AN) test.
3.8 BOD samples tested by using DO meter
3.9 Samples for COD test
4.1 Graph comparison between pH parameter with Interim
National Water Quality Standard for Malaysia.
4.2 Comparison between averages of pH values for each
phase.
3
8
10
26
24
24
25
28
29
30
31
32
38
38

xlii
4.3 Graph comparison between turbidity parameter with 40
INWQS for Malaysia
4.4 Comparison between averages of turbidity values for 41
each phase.
4.5 Graph comparison between TDS parameter with INWQS 43
for Malaysia
4.6 Comparison between averages of TDS values for each 43
phase.
4.7 Graph comparison between AN parameter with INWQS 45
for Malaysia
4.8 Comparison between averages of AN values for each 46
phase.
4.9 Graph comparison between TSS parameter with INWQS 48
for Malaysia
4.10 Comparison between averages of TSS values for each 48
phase.
4.11 Graph comparison between COD parameter with 51
1NWQS for Malaysia
4.12 Comparison between averages of COD values for each 51
phase.
4.13 Graph comparison between BOD parameter with 54
INWQS for Malaysia
4.14 Comparison between averages of BOD values for each 54
phase.

LIST OF ABBREVIATIONS
EM - Effective Microorganism
BOD - Biochemical Oxygen Demand
TDS - Total Dissolved Solids
COD - Chemical Oxygen Demand
TSS - Total Suspended Solids
AN - Ammonia Nitrogen
DOE - Department of Environment
IWK - Indah Water Konsortium Sdn. Bhd.
STP - Sewerage Treatment Plant
PE - Population Equivalent
NPS - Non-point source
FOG - Fats Oils and Grease
CWA - Clean Water Act
NFR - Non-filterable residue
INWQS - INTERIM National Water Quality Standard
SPSS - Social Scientific Statistical Software
APHA - American Public Health Association
EC - Effective Cultura
JM - J-M21
xiv

LIST OF SYMBOLS
% - Percent
kg - Kilogram
m3 - Cubic meter
ppm - Parts per million
mgfL - Milligrams per liter
°C - Degree Celsius
- Ratio
OF - Degree Fahrenheit
ML - Mililiter
xv

LIST OF APPENDICES
APPENDIX TITLE PAGE
A Interim National Water Quality Standard for 62
Malaysia.
B Analysis Data for Laboratory Test Results 64
C Analysis Data for SPSS Data Results 72
D Water Sample Preservation 80
xvi

CHAPTER 1
INTRODUCTION
1.1 Introduction
Water quality is a term to express the suitability of water to sustain various
uses or processes. Wastewater is any water that has been adversely affected in
quality by anthropogenic influence. It needs to be treated to minimize the effect on
human's health and environment.
Although there are many methods used, there are numerous concerns raised
regarding the presence of constituents including heavy metals, pathogens and other
toxic substances. This requires the selection of the correct disposal method focusing
on efficient and environmentally safe disposal. New technologies are being produced
to assist in the treatment and disposal of sewage sludge, conforming to strict
environmental regulations. One of these new technologies being proposed is the use
of Effective Microorganisms (Szymanski and Patterson, 2003).
The technology of Effective Microorganisms (EM) was developed during the
1970's at the University of Ryukyus, Okinawa, Japan (Sangakkara, 2002). Studies
have suggested that EM may have a number of applications, including agriculture,
livestock, gardening and landscaping, composting, bioremediation, cleaning septic
tanks, algal control and household uses (EM Technology, 1998).

2
Effective Microorganisms or EM was first introduced 25 years ago by Dr.
Teruo Higa, a professor of Horticulture from Japan. EM and useful microorganism is
produced from ingredients which are used in the food industry through the
fermentation process. EM is highly effective for the degradation of organic
ingredients which has been used from more than 150 countries. The principles of EM
usage are to improve human health standards, provide economical benefits, ease of
use, environment friendly and quality productivity. EM is a mixture of groups of
organisms that are coexisting anaerobic and aerobic beneficial microorganisms for
humans, animals and the natural environment. The main species involved in EM are:
Lactic acid bacteria, Photosynthetic bacteria, yeasts, Actinomycetes and fermenting
fungi (Szymanski and Patterson, 2003).
The basic purpose of EM is the restoration of healthy ecosystem in both soil
and water by using mixed cultures of beneficial and naturally-occurring
microorganism. Therefore, the EM has great potential in creating an environment
most suitable for the existence, propagation, and prosperity of life (Higa & Parr,
1994).
The EM technology has a great potential for restoring water quality by
increasing freshwater supply to meet the demand of various sectors. However, the
sustainability of the freshwater supply for domestic, agriculture and industrial use
need to be analyzed as it would be a critical aspect of sustainable water management.
1.2 Problem Statement
The river systems in Malaysia are an integral part of the water resources
system. There are more than 100 river systems in Malaysia, contributing more than
90 per cent of the raw water supply. Decades of rapid modernization and
industrialization have inevitably led to the severe deterioration of the river water
quality. Recently EM has become a successful weapon in the cleaning of water in
nature, especially in regions of Asia. It is through the activity of these EM that the
river pollutants in Malaysia are also starting to be broken down and cleaned. The EM
technology has and is being applied in different domains nationwide beginning 2008
(Zakaria et. al., 2010)
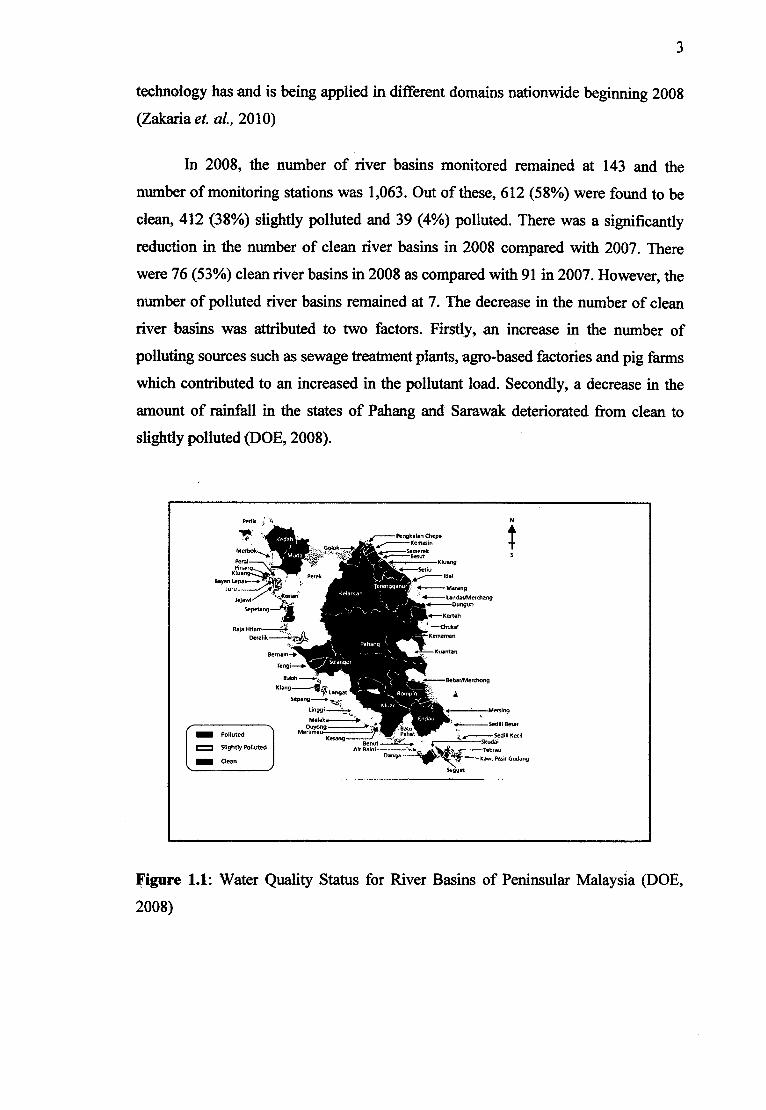
In 2008, the number of river basins monitored remained at 143 and the
number of monitoring stations was 1,063. Out of these, 612 (58%) were found to be
clean, 412 (38%) slightly polluted and 39 (4%) polluted. There was a significantly
reduction in the number of clean river basins in 2008 compared with 2007. There
were 76 (53%) clean river basins in 2008 as compared with 91 in 2007. However, the
number of polluted river basins remained at 7. The decrease in the number of clean
river basins was attributed to two factors. Firstly, an increase in the number of
polluting sources such as sewage treatment plants, agro-based factories and pig farms
which contributed to an increased in the pollutant load. Secondly, a decrease in the
amount of rainfall in the states of Pahang and Sarawak deteriorated from clean to
slightly polluted (DOE, 2008).
Perlis Q N
j----P.ngk.I.n Ch,p.
Me,boL
P.r,k
L. S.p.t.ngJ1
Kerteh
RoJ, —thkI
Derslik Kern.,.,.
BernaZT*.fl] Nith
L.nQt
Unggi Mrn,Ing
MKlkp -p- . - todd B,.u, MerIu,ou P.het - Polluted ._._.-ediU Kedi K.nç..7
.10'r = Slightly Polluted Al,
L- Clean J
O.ng. Ca,.. Prnir Sudang
Figure 1.1: Water Quality Status for River Basins of Peninsular Malaysia (DOE,
2008)
4
The scenery of wet market in Malaysia which synonyms with unpleasant
odor, dirty environment, and pathogen development. It can cause pathogenic
organisms transmit disease to humans and cause water pollution. Wastewater
produce by the wet market can causing pollution if not being treated at the early
stage. Problems that have to be study is due to the wastewater from composing
vegetables, fruits, meats and fish at the main Kuantan's wet market that are doubted
in their quality.
This research will propose economically and easy-to-use method that can be
used by the hawkers to improve their working environment at the wet market. The
method suggested was an environment friendly method to solve the problems.
1.3 Objectives of Study
The objectives of this research are:
a) To determine the parameters level of wastewater at the wet market.
b) To determine the effectiveness of using EM technology as the pre-treatment
of the wastewater from wet market.
1.4 Scope of Study
The scope of this study is to determine the wastewater profile of Kuantan's
wet market (Pasar Borong Kemunting) after being treated by Effective
Microorganism (EM) technology. Study will also show the effectiveness of this
method in order to improving wet market environment and decreasing the number of
water pollution.
Area of research is in Kuantan's main wet market where the sample of
wastewater from fresh composing materials flow in drain will be taken and

5
experimental in UMP's environment laboratory. Sampling of the study will be taken
in several locations at the wet market to see the accuracy of the result.
For laboratory testing, samples will be added with several dosage of EM. The
laboratory and on-site testing which will be conduct are Biochemical Oxygen
Demand BOD), Total Dissolved Solids (TDS), Chemical Oxygen Demand (COD),
pH, and Total Suspended Solids (TSS), Ammonia Nitrogen (AN) and Turbidity. The
quality parameters of wastewater also will be obtained from the laboratory testing.
1.5 Significant of study
From the study, it hope to improve the wet market environment to be more
comfortable and clean, so that it will help the trades in their economic which have
been problems due to competition from the hypermarkets.
We can know how EM will affect with the problem occur in wet market
which will increase the wastewater quality. It later will act as the lowest impact and
environment friendly method can be used by the communities in order to minimize
the environment water pollution.

CHAPTER 2
LITERATURE REVIEW
2.1 Introduction
Water pollution is the contamination of water bodies like lakes, rivers,
oceans, groundwater. Water pollution affects plants and organisms living in these
bodies of water and in almost all cases the effect is damaging either to individual
species and populations, but also to the natural biological communities.
In nature, the nutrition and environmental load of a water system will depend
on the ecology in that particular area and the water quality will be sustained by the
functioning of a self-cleansing process. This ecology stands on an ecological
pyramid with the microflora as the base, and the water is purified through the food
chain of plankton, small animals, and fish that are sustained by the microflora.
However in polluted water systems, where pollution has built up and foul odors are
produced, the amount of beneficial microorganisms will be reduced and putrefactive
microorganisms will become dominant. Because of this, the purifying ability of the
ecology will decrease, and a vicious circle will occur in which, as the nutrition and
oxygen needed to sustain the ecology decrease, the ecology will be damaged even
further (EM Research Organization, 2008).
7
2.2 Water Pollution
Water pollution is a major problem in the global context. It has been
suggested that it is the leading worldwide cause of deaths and diseases, and that it
accounts for the deaths of more than 14,000 people daily. An estimated 700 million
Indians have no access to a proper toilet, and 1,000 Indian children die of diarrhea
sickness every day. Some 90% of China's cities suffer from some degree of water
pollution, and nearly 500 million people lack access to safe drinking water. In
addition to the acute problems of water pollution in developing countries,
industrialized countries continue to struggle with pollution problems as well. In the
most recent national report on water quality in the United States, 45 percent of
assessed stream miles, 47 percent of assessed lake acres, and 32% of assessed bay
and estuarine square miles were classified as polluted (Wikipedia, 2010).
2.2.1 Water Pollution Problem in Malaysia
The Department of Environment (DOE) maintains mainly records of point
sources. In 2008, 17,633 water pollution point sources were recorded. These
comprise of sewage treatment plants (9,524: 54.01% inclusive of 668 Network Pump
Stations), manufacturing industries (6,830: 38.73 0/o), animal farm (788: 4.48%) and
agro-basediiidustries (491:2.78%) as shown in Figure 2.1.
The number of sewage treatment plants under the management of Indah
Water Konsortium Sdn. Bhd. (IWK) had increased from 9,337 plants in 2007 to
9,524 plants in 2008. Selangor had the largest number of sewage treatment plants
(2,715:: 28.50/o), followed .by Perak (1,422: 14.9%), Johor (1,061: 11.1%) and Negeri
Sembilan (945: 9.9%)

Sewage Teatnient
Plants au ring ManiIndustry 9,24 (54.01 %)
6,830 (38.73 %)
Agro [aiarn, 491 (2.78%) (Pig Farm)
788 (4.48 %)
Figure 2.1: Composition of Water Pollution Sources by Sector (DOE Malaysia,
2008).
Domestic sewage discharge, in the form of treated sewage and partially
treated sewage, remained the largest contributor of organic pollution load with an
estimated biochemical oxygen demand (BOD) load of 944,533.80 kg/day. The
estimated BOD loading contributed by other major sectors were agro-based and
manufacturing industries (76,186.36 kg/day) and pig fanning (226,929.17 kg/day).
Table 2.1 indicates the total BOD load in kg/day discharged from sewage treatment
plants throughout Malaysia in the states managed by LWK in 2008 (DOE Malaysia,
2008).
8

Table 2.1: Total BOD Load (kg/day) from Sewage Treatment Plants (IWK, 2008).
State No. of STP Total PEFlow
(M3 /day)
BOD Load
(kg/day)
Selangor 2,715 6,579,871 1,480,471 370,117.74
Perak 1,422 1,300,646 292,645 73,161.34
Johor 1,061 1,370,605 308,386 77,096.53
Negeri Sembilan 945 996,659 224,248 56,062.07
Kedah 806 626,258 140,908 35,227.01
Melaka 770 623,622 140,315 35,078.74
Pulau Pinang 662 1,554,709 1 349,810 87,452.38
Pahang 521 332,668 74,850 18,712.58
WP Kuala Lumpur 307 3,195,659 719,023 179,755.82
Terengganu 231 69,165 15,562 3,890.53
Perlis 43 21,839 4,914 1,228.44
WP Labuan 32 42,309 9,520 2,379.88
WP Putrajaya 9 77,702 17,483 4,370.74
Total 9,524 I 16,791,712 3,7781,135 9449533.80
ote: STP = Sewage Treatment Plant, PE Population Equivalent
2.2.2 Point Source Pollution
Point source pollution refers to contaminants that enter a waterway through a
discrete conveyance, such as a pipe or ditch. Examples of sources in this category
include discharges from a sewage treatment plant, a factory,, or a city storm drain.
The U.S. Clean Water Act (CWA) defines point source for regulatory enforcement
purposes. The CWA definition of point source was amended in 1987 as in Figure 2.2,
to include municipal storm sewer systems, as well as industrial stormwater (U.S
EPA, 2003).

10
llmoIirio of Fod'rctI Wotr Pouli on CoiiUoI Acts iind Pr"rcsms
, ConS.I 1i7
04 Igo 1. In 97-177
I cI.ur Wal... AA2 Ornendments...i 1987II
Phase I Sic... Water Rul. — I 99d>
OndiorUsnund Di.poioU of So..oq..
CSO Ccn.ol PcIIc'r I '1 ,•.s 1 •1 ___________________________________________________
.€i9BT-I c4.,rcI CI.c WI.r .on Plon II Pir II Sici.. Wolor Rule I
ConFj4;:!4n jam
Figure 2.2: Timeline of Federal Water Pollution Control Acts and Programs (U.S
EPA, 2003).
2.2.3 Non-point Source Pollution
Non-point source (NPS) pollution refers to diffuse contamination that does
not originate from a single discrete source. NPS pollution is often accumulative
effect of -small amounts of contaminants gathered from a large area. The leaching out
of nitrogen compounds from agricultural land which has been fertilized is a typical
example.
2.3 Water and Disease
2.3.1 Microorganisms and Disease
Many aspects of daily life are dependent upon the activities of the smallest of
organisms (microorganisms): from the preparation of food (e.g. yoghurt, bread,

11
cheese) and drink (e.g. wine and beer), the production of antibiotics (e.g. penicillin),
the natural breakdown of decaying material (composting), sewage treatment
(activated sludge, filtration beds) - the list is endless. Equally, they can also be a
nuisance to mankind causing, for instance, the corrosion of concrete pipes, spoilage
of food and, of course, disease. indeed, the history of mankind is inextricably
dominated by a close interaction with the microbial world. However, the most
effective manifestation of the activities of microorganisms is the range of diseases
which they may give rise to in susceptible hosts (EM Trading, 2000).
Raw domestic wastewaters normally carry, the full spectrum of pathogenic
microorganisms - the causative agents of bacterial, virus and protozoan diseases
endemic in the community and excreted by diseased and infected individuals. While
recycling and reuse of wastewater for agriculture, industry and non-potable urban
purposes can be a highly effective strategy for developing a sustainable water
resource in water short areas, nutrient conservation :and environmental protection, it
is essential to understand the health risks involved and to develop appropriate
strategies for the control of those risks (EM Trading, 2000).
2.4 Wastewater
2.4.1 Definition of Wastewater
Wastewater is any water that has been adversely affected in quality by
antrophogenic influence. It comprises liquid waste discharge by domestic residences,
commercial properties, industries, or agriculture and can encompass a wide range of
potential contaminant and concentration. In the most comman usage, it refers to the
municipal wastewater that contains a broad spectrum of contaminant resulting from
the mixing of wastewater from different sources (Salt, 2001).
Generally waste water is synonymously with sewage even though sewage is a
more general term that refers to any polluted water including wastewater, which may
contain organic and inorganic substance, industrial waste, groundwater that happens

12
to infiltration and to mix with contaminated water, storm, runoff, and other similar
liquids (Miretzky et al. 2004).
2.4.2 Characteristic of Wastewater
In genera!, wastewater is water that has been generated from domestic and
industrial sources where throughout the world by dumping 10,000 new organic
compounds each year. These compound needs to be properly handled and removed if
they cause health problem. There are many industrial plants that have required pre-
treating their wastewater before dumping in the wastewater system :(Chandra and
Kulshrenta, 2004).
2.5 Wastewater Treatment
Wastewater collection systems like sewer networks and centralized and
decentralized treatment systems are designed and managed primarily to protect
human and environmental health. Though their benefits are widely recognized, there
are other aspects of this infrastructure and associated technologies that are not so
obvious and hence less acknowledged, yet they impact communities and the
surrounding environment. For example a positive aspect of the sewer network is the
collection and transport of wastewater to appropriate treatment facilities, whereby
pathogens and chemical constituents such as oxygen-depleting organic matter and
phosphorus are removed before the treated water is returned to the environment. A
negative aspect of such a network is that it can create an imbalance in water and
nutrient fluxes and therefore distort natural hydrological and ecological regimes. For
instance the discharge of large volumes of treated wastewater that contains low
concentrations of chemical constituents may still lead to an excessive input of
nutrients in a, receiving water body, thus, leading to a water quality problem (Muga
and Mihelcic, 2008).