pre feasibility study for development logistics park near ... · pre‐feasibility study for...
TRANSCRIPT

Pre‐feasibility Study for Development of Logistics Park
near Devanahalli, Bangalore on PPP Basis
Draft Report
TO
Infrastructure Development Department Government of Karnataka
SUBMITTED BY
KSIIDC‐IL&FS Project Development Company Limited (KIPDC) Khanija Bhavan, 4th Floor, East Wing,
#49, Race Course Road, Bangalore – 560 001

1
TABLE OF CONTENTS
1 BACKGROUND ....................................................................................................................................... 7
2 LOGISTICS .............................................................................................................................................. 9
2.1 Introduction .................................................................................................................................. 9
2.2 Logistics Services ......................................................................................................................... 10
2.2.1 Material flow ....................................................................................................................... 10
2.2.2 Inbound services ................................................................................................................. 10
2.2.3 Warehousing services ......................................................................................................... 11
2.2.4 Park internal services .......................................................................................................... 11
2.2.5 Outbound services .............................................................................................................. 12
2.3 Logistics Service Providers (LSP) ................................................................................................. 12
2.4 Global Scenario ........................................................................................................................... 14
2.5 Indian Scenario ............................................................................................................................ 16
3 LOGISTICS INFRASTRUCTURE .............................................................................................................. 18
3.1 Logistics Value Chain ................................................................................................................... 18
3.2 Logistics Facilities ........................................................................................................................ 19
3.2.1 Distribution Center/ Warehouse ........................................................................................ 19
3.2.2 Inland Container Depot (ICD) / Container Freight Station (CFS) ......................................... 24
3.2.3 Free Trade Warehousing Zone (FTWZ) ............................................................................... 26
3.2.4 Logistics Park ....................................................................................................................... 29
4 COMPONENTS OF A LOGISTICS PARK ................................................................................................. 30
4.1 Basic Requirements of a Logistics Park ....................................................................................... 30
4.2 Facilities within a Logistics Park .................................................................................................. 30
4.3 Structure of a Logistics Park ........................................................................................................ 32
4.4 Functioning of a Logistics Park .................................................................................................... 33
5 DEMAND DRIVERS ............................................................................................................................... 40
5.1 Key Demand Drivers of Logistics in India .................................................................................... 40
5.2 Present Demand Drivers in Bangalore ........................................................................................ 43
5.2.1 Location and Connectivity ................................................................................................... 43

Pre‐feasibility Study for Development of Logistics Park Draft Pre‐feasibility Report
2
5.2.2 Major Production Centre .................................................................................................... 46
5.2.3 Major Consumption Centre ................................................................................................ 52
5.2.4 Major Transportation Centre .............................................................................................. 61
5.3 Future Demand Drivers in Bangalore .......................................................................................... 62
5.3.1 Suvarna Karnataka Industrial Corridors (SKDC) .................................................................. 62
5.3.2 Information Technology Investment Region (ITIR) ............................................................. 64
5.3.3 Other Proposed Developments .......................................................................................... 65
6 SUPPLY SCENARIO ............................................................................................................................... 69
6.1 Major Existing Logistics Facilities in Bangalore (Select) .............................................................. 69
6.1.1 Truck Terminals ................................................................................................................... 69
6.1.2 Railway Goods Terminals .................................................................................................... 70
6.1.3 Inland Container Depot (ICD)/ Domestic Rail Hub (DRH) ................................................... 71
6.1.4 Air Cargo Centre .................................................................................................................. 73
6.1.5 Retail Warehousing ............................................................................................................. 73
6.1.6 Logistics Parks ..................................................................................................................... 75
7 PROJECT LOCATION............................................................................................................................. 77
7.1 Emerging Logistics Hubs in and around Bangalore ..................................................................... 77
7.2 Preferred Project Location .......................................................................................................... 80
8 PROPOSED DEVELOPMENT ................................................................................................................. 82
8.1 Suggestions on Site Requirements .............................................................................................. 82
8.2 Suggestions on Project Phasing .................................................................................................. 83
8.3 Suggestions on Product Mix ........................................................................................................ 84
8.4 Broad Land utilization and facilities ............................................................................................ 85
9 PRELIMINARY PROJECT FINANCIALS ................................................................................................... 86
9.1 Assumptions ................................................................................................................................ 86
9.1.1 Cost Assumptions ................................................................................................................ 86
9.1.2 Revenue Assumptions ......................................................................................................... 87

Pre‐feasibility Study for Development of Logistics Park Draft Pre‐feasibility Report
3
9.2 Estimated Project Cost ................................................................................................................ 88
9.2.1 Phase ‐ I ............................................................................................................................... 88
9.2.2 Phase‐II & Phase‐III ............................................................................................................. 88
9.3 Estimated Revenues .................................................................................................................... 90
9.4 Project Returns ........................................................................................................................... 91
10 SUGGESTED PROJECT STRUCTURE & PROJECT BENEFITS ............................................................... 92
10.1 Suggested Project Structure ....................................................................................................... 92
10.2 Project Benefits ........................................................................................................................... 92
11 CONCLUSIONS AND RECOMMENDATIONS ..................................................................................... 93
11.1 Summary of Findings ................................................................................................................... 93
11.2 Risk Allocation and Mitigation .................................................................................................... 94
11.3 Recommendations on Way Forward .......................................................................................... 95
LIST OF TABLES
Table 1 Range of Services provided by the Logistics Players....................................................................... 14
Table 2 Global Logistics Industry – current Statistics .................................................................................. 15
Table 3 Supply Statistics of select 3PL Operators in India ........................................................................... 17
Table 4 Typical Warehouse Typologies ‐ Retail ........................................................................................... 23
Table 5 List of Approved FTWZs (as on Jan ’09) .......................................................................................... 27
Table 6 List of FTWZs with valid In‐Principle Approvals (as on Jan ’09) ...................................................... 28
Table 7 Logistics Parks vs. Free Trade Warehousing Zones (FTWZ) ............................................................ 29
Table 8 Rates of Growth (FY ’03‐’04 to ’08‐’09) for different sectors of Economy ..................................... 41
Table 9 Projects in Auto & Auto Ancillaries Sector ...................................................................................... 47
Table 10 List of Major Auto Ancillaries Units in Karnataka ........................................................................ 47
Table 11 MSME Clusters in Karnataka ........................................................................................................ 50
Table 12 Retail formats of Retail Market Players in India .......................................................................... 53

Pre‐feasibility Study for Development of Logistics Park Draft Pre‐feasibility Report
4
Table 13 Quantity of Auto/Auto Ancillary Products entering Bangalore through Tumkur Road Check Post (Nov. 09) ...................................................................................................................................................... 55
Table 14 Quantity of Agri Products entering Bangalore through Tumkur Road Check Post (Nov. 09) ....... 55
Table 15 Quantity of Electrical/ Electronics Products entering Bangalore through Tumkur Road Check Post (Nov. 09) .............................................................................................................................................. 57
Table 16 Quantity of Textiles & Apparels entering Bangalore through Tumkur Road Check Post ............. 57
Table 17 Demand‐Supply Scenario in Residential Market in Bangalore ..................................................... 58
Table 18 Demand‐Supply Scenario in Office Market in Bangalore ............................................................. 58
Table 19 Quantity of Other Building Materials entering Bangalore through Tumkur Road Check Post (Nov. 09) ...................................................................................................................................................... 59
Table 20 Quantity of Other Building Materials entering Bangalore through Tumkur Road Check Post .... 60
Table 21 Quantity of Other Goods entering Bangalore through Tumkur Road Check Post (Nov. 09) ........ 60
Table 22 Approved SEZs in the State of Karnataka ..................................................................................... 65
Table 23 Comparison of the Emerging Logistics / Warehousing hubs in & around Bangalore .................. 79
Table 24 Suggested area for different phases of development .................................................................. 83
Table 25 Broad Land Utilization and Facilities ............................................................................................ 85
Table 26 Cost Assumptions ......................................................................................................................... 86
Table 27 Revenue Assumptions ................................................................................................................... 87
Table 28 Occupancy for Phase‐I facilities .................................................................................................... 87
Table 29 Estimated Project Cost – Phase‐I .................................................................................................. 88
Table 30 Estimated Project Cost – Phase‐II ................................................................................................. 89
Table 31 Estimated Project Cost – Phase‐III ................................................................................................ 89
Table 32 Project Revenues in the first year of operation – Phase‐I ............................................................ 90
Table 33 Project Revenues in the first year of operation – Phase‐II ........................................................... 90
Table 34 Project Revenues in the first year of operation – Phase‐III .......................................................... 90
Table 35 Estimated Project Returns ............................................................................................................ 91

Pre‐feasibility Study for Development of Logistics Park Draft Pre‐feasibility Report
5
LIST OF FIGURES
Figure 1 Evolution of Logistics and SCM ....................................................................................................... 9
Figure 2 Logistics Services ........................................................................................................................... 10
Figure 3 Warehousing Services ................................................................................................................... 11
Figure 4 Logistics Park Internal Services ..................................................................................................... 11
Figure 5 Outbound Services ........................................................................................................................ 12
Figure 6 Logistics & Warehousing Potential – Emerging Economies of the World ..................................... 15
Figure 7 Emerging Logistics Locations in India ........................................................................................... 17
Figure 8 Structure of a Logistics Value Chain .............................................................................................. 18
Figure 9 Moving up in a Logistics Value Chain ............................................................................................ 19
Figure 10 Retail Logistics Value Chain......................................................................................................... 20
Figure 11 Modern Distribution Center with warehousing facility ............................................................... 21
Figure 12 Modern Warehouse Value Cahin ................................................................................................ 22
Figure 13 Modern Distribution Warehouse ................................................................................................ 22
Figure 14 Flow of goods in a Distribution Warehouse ................................................................................ 24
Figure 15 Inland Container Depot with Rail siding ...................................................................................... 25
Figure 16 Free Trade Warehousing Zone in proximity to a seaport ............................................................ 26
Figure 17 Structure of a Typical Logistics Park............................................................................................ 32
Figure 18 Inbound / Outbound Operations of a Warehousing Facility ....................................................... 33
Figure 19 Different Types of Pallets ............................................................................................................ 35
Figure 20 Cartons and Cases ....................................................................................................................... 36
Figure 21 Pallet Racking Systems ................................................................................................................ 37
Figure 22 Air Freight – Unit Load Device (ULD) ........................................................................................... 39
Figure 23 Recent GDP Figures ..................................................................................................................... 41
Pre‐feasibility Study for Development of Logistics Park Draft Pre‐feasibility Report
6
Figure 24 Map showing the central location of Bangalore City in South India .......................................... 43
Figure 25 National Highways Development Project (NHDP) – Golden Quadrilateral, North‐South & East‐West Corridors ............................................................................................................................................ 44
Figure 26 Indian Railway Map .................................................................................................................... 45
Figure 27 Major Production Centres in Karnataka...................................................................................... 52
Figure 28 Vehicle Growth Rate in Bangalore .............................................................................................. 54
Figure 29 White goods & Consumer Electronics Market ............................................................................ 56
Figure 30 Suvarna Karnataka Industrial Corridors ..................................................................................... 64
Figure 31 Satellite image of the D. Devaraj Urs Truck Terminal, Yeswantpur ............................................ 69
Figure 32 Satellite image of the Satellite Goods Terminal, Whitefield ....................................................... 70
Figure 33 Satellite Image of the Concor ICD Whitefield .............................................................................. 71
Figure 34 Satellite image of the Pearl Harbour Container Terminal, Whitefield ........................................ 72
Figure 35 Safexpress Facility – Docks (Numbered & Leveled) ..................................................................... 75
Figure 36 Safexpress Facility – Hub operations .......................................................................................... 76
Figure 37 Emerging Logistics Hubs in and around Bangalore ..................................................................... 77
Figure 38 Location of BIAAPA...................................................................................................................... 80
Figure 39 Location of Bangalore International Airport (BIA) & Devanahalli town ..................................... 81
Figure 40 Project Structure for Phase‐1 Development ................................................................................ 92

Pre‐feasibility Study for Development of Logistics Park Draft Pre‐feasibility Report
7
1 BACKGROUND a) Infrastructure Development Department (IDD), Government of Karnataka (GoK) is the
Infrastructure arm of GoK with the primary objective of facilitating development of infrastructure projects across Karnataka.
b) Karnataka State Industrial Investment & Development Corporation Limited (KSIIDC) wishes to develop a Logistics Park near Bengaluru International Airport (BIA) on Public Private Partnership (PPP) Model.
c) The Logistics Park would further catalyse the economic activity in the area and generate employment opportunities, besides augmenting the logistics services support to the city and the region.
d) In order to assess if the above project would be prima facie feasible for development on PPP basis and its financial self‐sustainability or otherwise, KSIIDC proposed to conduct a Pre‐feasibility study for the same.
e) KSIIDC, vide its letter no.: DGM(IPD)/1231/2009‐10 dated 11.08.2009, requested IDD to entrust the preparation of Pre‐Feasibility Report for the Logistics Park to KSIIDC‐IL&FS Project Development Company Limited (KIPDC) and the same was approved by the Principal Secretary, IDD on 11.08.2009.
f) Based on IDD’s approval, KSIIDC, vide its letter no.: DGM(IPD)/1277/2009‐10 dated 14.08.2009, has requested KIPDC to take necessary action to conduct the Pre‐feasibility study for Development of Logistics Park near Bengaluru International Airport on PPP Model (hereinafter referred to as the “Project”).
g) KIPDC, vide letter dated 19.08.2009 to the Principal Secretary, IDD, confirmed acceptance of the Project as per the terms & conditions mentioned in IDD’s letter no.: ID/89/ITS/2008 [Part – 1] dated 18.03.2009 for conducting pre‐feasibility studies by the Consultants. IDD vide its letter no: ID/63/ITS/2009 dated 09.09.2009 confirmed award of this assignment to KIPDC.
h) On completion of the pre‐feasibility study, KSIIDC and IDD have agreed to assign the project development and bid process management of this Project to KIPDC, if found viable for development on PPP basis without any financial support/VGF from Government of India (GoI). On such assignment of the project development and bid process management of this Project to KIPDC, IDD would permit KIPDC to recover the

Pre‐feasibility Study for Development of Logistics Park Draft Pre‐feasibility Report
8
Professional fees for the same, as may be mutually agreed upon between IDD and KIPDC, from the selected developer/bidder of the Project
i) However, if this Project is found to be viable for development only with financial assistance/VGF from GoI, then the project development and bid process management related work of this Project would be bid out by IDD as per GoI guidelines for PPP projects, in which KIPDC would also be eligible to participate.
Pre‐feasibility Study for Development of Logistics Park Draft Pre‐feasibility Report
9
2 LOGISTICS
2.1 Introduction
Logistics is the management of the flow of goods and other resources between the point of origin and the point of consumption in order to meet the requirements of consumers. Logistics involves the integration of information, transportation, inventory, warehousing, material‐handling and packaging.
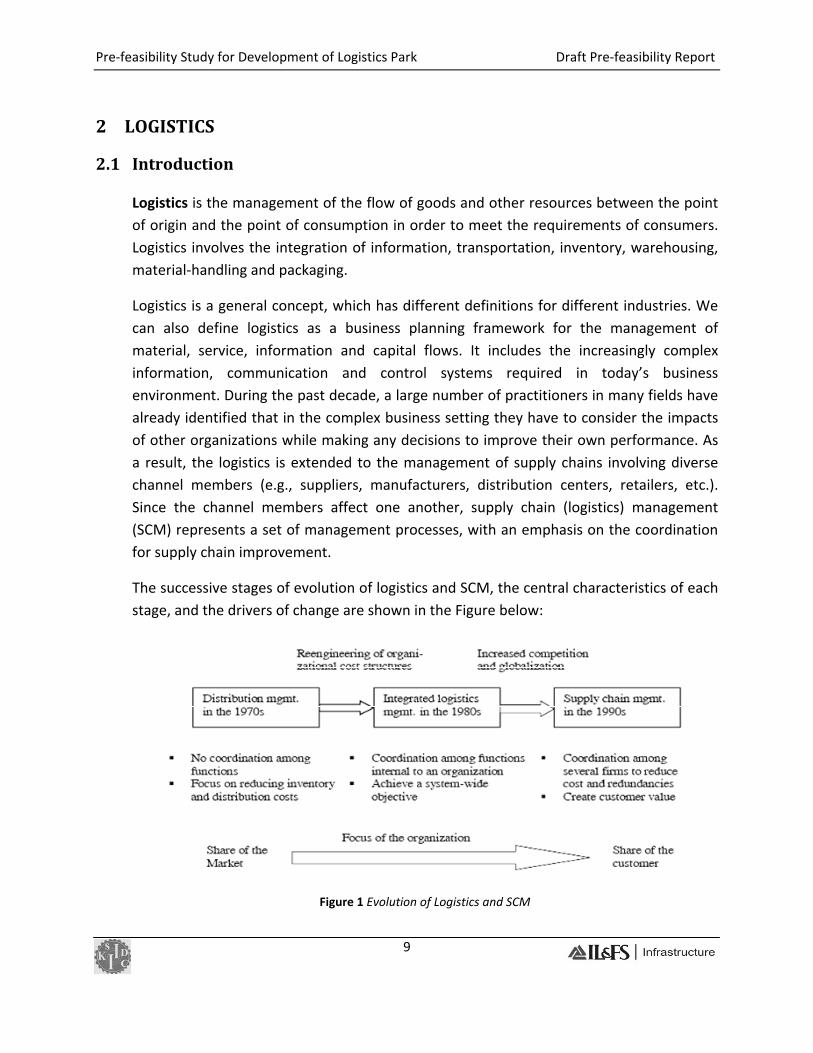
Logistics is a general concept, which has different definitions for different industries. We can also define logistics as a business planning framework for the management of material, service, information and capital flows. It includes the increasingly complex information, communication and control systems required in today’s business environment. During the past decade, a large number of practitioners in many fields have already identified that in the complex business setting they have to consider the impacts of other organizations while making any decisions to improve their own performance. As a result, the logistics is extended to the management of supply chains involving diverse channel members (e.g., suppliers, manufacturers, distribution centers, retailers, etc.). Since the channel members affect one another, supply chain (logistics) management (SCM) represents a set of management processes, with an emphasis on the coordination for supply chain improvement.
The successive stages of evolution of logistics and SCM, the central characteristics of each stage, and the drivers of change are shown in the Figure below:
Figure 1 Evolution of Logistics and SCM

Pre‐feasibility Study for Development of Logistics Park Draft Pre‐feasibility Report
10
2.2 Logistics Services
Figure 2 Logistics Services
2.2.1 Material flow The materials flow includes the goods movement from the provider to the receptor, thus creating the time value, location value, and improvement value.
2.2.2 Inbound services Inbound services involve all national and international inbound activities facilitated by
the logistics service provider(s). These activities include:
• Forwarding and clearing of all inbound raw materials (including national and
international consolidation activities).
• Management of the truck staging area in accordance to delivery time windows.
• Management of the container facility.
• Management of warehousing activities on behalf of tenants (suppliers & other
customers).
• Container call‐ins for destuffing.
• Direct deliveries into the Logistics Service Provider facilities.
• Receiving & re‐packing of raw materials.
• Administration of raw materials orders and provision of relevant IT data and required
information

Pre‐feasibility Study for Development of Logistics Park Draft Pre‐feasibility Report
11
2.2.3 Warehousing services Warehousing services done on behalf of tenants (suppliers) on both inbound raw
materials and outbound finished goods. These activities include: • Raw Materials Receipts:
− Re‐packing of raw materials
into economic bin quantities
− Storage − Picking − Order Administration
− Inventory control (Real time stock
information)
• Finished Goods Distribution:
− Storage − Picking − Re‐packing into economic delivery quantities
− Value added services (kitting, sequencing, tracking and tracing) − Delivery Administration
− Inventory control (Real time stock information)
2.2.4 Park internal services Park internal services pertain to distribution
of raw material stored and collection of
finished goods stored and/ or distributed
on behalf of tenants (suppliers). These
activities include:
• Many trips to distribute raw materials
stored on behalf of tenants (suppliers)
− Tow motors and trolleys to distribute
raw materials in a specified
frequency
• Many trips to collect finished goods to be stored/ distributed on behalf of tenants
(suppliers)
− Tow motors and trolleys to collect finished goods on a specified frequency
Figure 3 Warehousing Services
Figure 4 Logistics Park Internal Services

Pre‐feasibility Study for Development of Logistics Park Draft Pre‐feasibility Report
12
2.2.5 Outbound services Outbound services to local, national or international customers facilitated by the
logistics service provider(s). These activities include: • Transport services:
− Direct deliveries to local & national customers
− Collection from the tenant and delivery
to customers.
− JIT (Just‐in‐Time) / JIS (Just‐in‐
Sequence) deliveries to local customers
from the warehouse facilities.
− Park external milk‐runs to distribute
finished goods to local and national
customers if volumes can be justified
from the warehouse facilities.
− Direct deliveries to international customers from the warehouse facilities (via
shipping lines, etc.).
• Container management:
− Outgoing containers to domestic/ international customers.
2.3 Logistics Service Providers (LSP) Global production outsourcing has led to increased logistical challenges. The need for efficient, time and cost‐effective supply chain management has created new opportunities for integrated logistics providers.
Tracing the evolution of logistics outsourcing in recent decades, we find that, in the 1950s and 60s, logistics outsourcing was limited to transportation and warehousing. The transactions were mainly short‐term in nature. In the 70s, the emphasis was on improved productivity, cost reduction and long‐term contracts, while value‐added services such as packaging, labeling, systems support and inventory management were on offer in the 80s. Since the 90s, outsourcing has picked up momentum, and more value‐added services are being offered.
Figure 5 Outbound Services

Pre‐feasibility Study for Development of Logistics Park Draft Pre‐feasibility Report
13
a) 2PL or 2nd Party Logistics Service Providers Logistics outsourcing was traditionally primarily used for warehousing, inbound and outbound transportation and shipment consolidation/ distribution by the companies. The reason for this was the massive initial investment & low returns in the setting up of a warehouse and maintaining a large transport fleet. 2PL Logistics Service Providers are also referred to as Traditional LSPs.
With globalization of the economy and the subsequent rise in competition, cost reduction and shorter product life‐cycles have become the key determining areas of the competency of firms. This in turn, has led to increased importance and business opportunities for LSPs. Hence the LSPs widened their span of service offerings, based on which new classifications as 3PL and 4PL came into existence.
b) 3PL or 3rd Party Logistics Service Providers 3rd Party Logistics (3PL) is the supply chain practice where one or more logistics functions of a firm are outsourced to a 3PL service provider. Typical outsourced logistics functions are: inbound freight, customs and freight consolidation, public warehousing, contract warehousing, order fulfillment, distribution and management of outbound freight to the client’s customers.
The main aim behind outsourcing logistics to a 3PL service provider is to keep the firm competitive & lean without owning many assets and, thus, allowing it to reduce operational costs and focus on niche areas. Further, also value added services can be provided such as: repackaging, assembling and return logistics. The 3PL service provider manages and executes these particular logistics functions using its own assets and resources, on behalf of the client company and can be classified as Asset‐based Logistics Service Provider. 3PL is also referred to as Contract Logistics.
c) 4PL or 4th Party Logistics Service Providers Fourth‐party logistics (4PL), Lead Logistics Provider or 4th Party Logistics, is a term coined by global consulting firm Accenture: “A 4PL is an integrator that assembles the resources, capabilities, and technology of its own organization and other organizations to design, supply chain solutions of their supply chain management function.” A 4PL uses a 3PL to supply service to customers, owning only computer systems and intellectual capital and hence can be classified as Non–Asset based Logistics Service Provider.
Supply chains of companies have become increasingly complex and at any point in time, many different 3PL providers may be employed by any one firm. The need for
Pre‐feasibility Study for Development of Logistics Park Draft Pre‐feasibility Report
14
an interface between the companies and the various service providers that it employs, is leading to the recognition of benefits that a 4PL can provide.
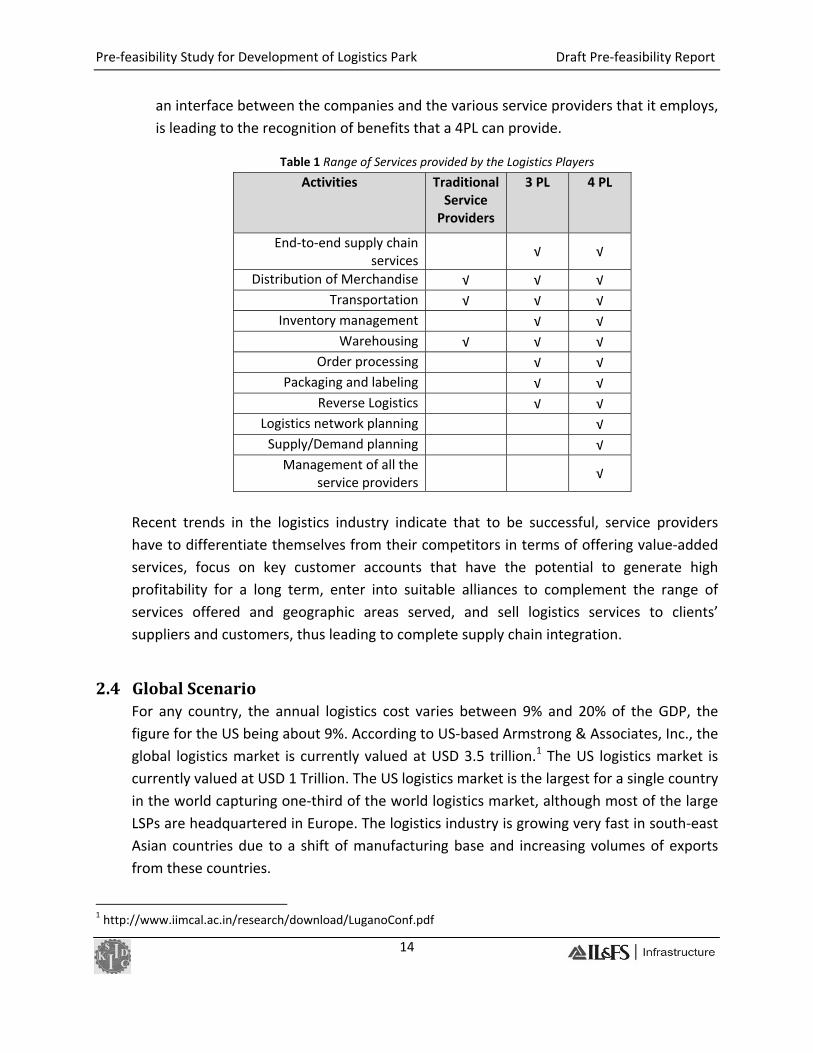
Table 1 Range of Services provided by the Logistics Players
Activities Traditional Service Providers
3 PL 4 PL
End‐to‐end supply chain services
√ √
Distribution of Merchandise √ √ √ Transportation √ √ √
Inventory management √ √ Warehousing √ √ √
Order processing √ √ Packaging and labeling √ √
Reverse Logistics √ √ Logistics network planning √ Supply/Demand planning √
Management of all the service providers
√
Recent trends in the logistics industry indicate that to be successful, service providers have to differentiate themselves from their competitors in terms of offering value‐added services, focus on key customer accounts that have the potential to generate high profitability for a long term, enter into suitable alliances to complement the range of services offered and geographic areas served, and sell logistics services to clients’ suppliers and customers, thus leading to complete supply chain integration.
2.4 Global Scenario
For any country, the annual logistics cost varies between 9% and 20% of the GDP, the figure for the US being about 9%. According to US‐based Armstrong & Associates, Inc., the global logistics market is currently valued at USD 3.5 trillion.1 The US logistics market is currently valued at USD 1 Trillion. The US logistics market is the largest for a single country in the world capturing one‐third of the world logistics market, although most of the large LSPs are headquartered in Europe. The logistics industry is growing very fast in south‐east Asian countries due to a shift of manufacturing base and increasing volumes of exports from these countries.
1 http://www.iimcal.ac.in/research/download/LuganoConf.pdf

Pre‐feasibility Study for Development of Logistics Park Draft Pre‐feasibility Report
15
The following table highlights select logistics markets:
Table 2 Global Logistics Industry – current Statistics Particulars US Europe China India
Value of Logistics Market
US$ 1 Trillion US$ 1.46 Trillion (€ 1 Trillion)
US$ 0.29 Trillion (CNY 2 Trillion )
US$ 0.09 Trillion (Rs. 4.14 Trillion)
%age of GDP 8.7% 11% 14.5% 13% Growth Rate
‐ ‐ 15.4 %
8%‐10% p.a since 2002. Expected to post 11% p.a. for next 5 years
Other Largest logistics market (1/3rd)
Headquarters of most of the large LSPs
Only 6% in organized sector
According to the survey done by the United Nations Industrial Development Organization (summarized in The Central Intelligence Agency or CIA World Factbook) to assess the Logistics & Warehousing potential in some of the important emerging economies of the world, the potential for logistics is high both in India and China.
Figure 6 Logistics & Warehousing Potential – Emerging Economies of the World

Pre‐feasibility Study for Development of Logistics Park Draft Pre‐feasibility Report
16
2.5 Indian Scenario The Logistics market in India is currently valued at approximately Rs. 4.14 Trillion (US$ 0.09 Trillion). It is growing around 8% to 10% per annum since 2002 and expected to grow @ 12% per annum for the next 5 years.
The annual logistics cost in India is currently estimated to be 13% of the GDP. However, the industry is growing at a fast pace and if India can bring down its logistics cost from 13% to 9% of the GDP (level in the US), savings to the tune of USD 50 billion will be realized at the current GDP level, making Indian goods more competitive in the global market. Moreover, growth in the logistics sector would imply improved service delivery and customer satisfaction leading to growth of export of Indian goods and potential for creation of job opportunities.
Almost 94% of India’s logistics market is accounted for by the unorganized sector such as owners of less than 5 trucks, affiliated to a broker or a transport company, small warehouse operators, customs brokers, freight forwarders, etc., and only 6% is contributed by the organized sector.
In the Indian context, the major logistics functions include transportation, warehousing, freight forwarding, express cargo delivery, courier services, container services, shipping services, etc. The Logistics sector investment in India is not primarily focused on sustained development of planned infrastructure such as warehouses, Transport centers, ICDs, etc. Availability of cold chain logistics infrastructure facilities for perishables and fresh produce is sporadic and the concept of Integrated Cold Chain is in a very nascent stage.
Major investments on these infrastructures have come from government agencies like Central Warehousing Corporation (CWC), State Warehousing Corporation (SWC), Container Corporation of India Ltd. (CONCOR), etc. The warehousing capacities added by government agencies in the year 2007 are 35.3 million tons by CWC & SWC and 25.2 million tons by Food Corporation of India (FCI). Private sector initiatives are still small and sporadic.
Though the estimated size of the industry is still very small and the industry is still concentrated, there is immense potential for growth and a lot of consolidation activities are taking place as more and more multi‐national LSPs are expanding their presence in India through direct investments, acquisitions and alliances.
The emerging logistics locations across India are shown in the following figure:

Pre‐feasibility Study for Development of Logistics Park Draft Pre‐feasibility Report
17
Figure 7 Emerging Logistics Locations in India
Growing at 25%, p.a, India's 3PL industry is poised to expand its market manifold. Select major service providers/organizations in India along with details pertaining to their scale of operation is listed below:
Table 3 Supply Statistics of select 3PL Operators in India
S. No Name of the Organisation Total built up area (mn. Sq. ft.)
No. of warehouses Existing Upcoming
1 TCI 6.5 3.5 494 2 Indo Arya 3.6 1.0 36 3 Prologistics 3.5 3.5 35 4 Safexpress 3.0 7.0 N.A. 5 DRS Logistics 1.2 3.8 N.A. 6 Reliance Logistics 1.0 1.0* 151 7 AFL Dauscher 1.0 N.A 46 8 Gati 0.6 5.0 200 TOTAL 20.4 23.8
*Only in the eastern region

Pre‐feasibility Study for Development of Logistics Park Draft Pre‐feasibility Report
18
3 LOGISTICS INFRASTRUCTURE
3.1 Logistics Value Chain A typical logistics value chain consists of three building blocks namely Transportation, Warehousing and Value added services. Based on these building blocks, the transformation of the logistics industry took place over the past decades from 2PL to 3PL. In recent times, the concept of 4PL logistics has evolved, which includes 3PL along with IT support / Supply Chain Management as part of its service offering.
The following matrix explains the basic structure of a Logistics value chain with the different modes of transportation on one hand and the range of services provided on the other hand.
Figure 8 Structure of a Logistics Value Chain

Pre‐feasibility Study for Development of Logistics Park Draft Pre‐feasibility Report
19
The vertical movement from Service to Solution to Strategy in this chain is shown in the figure:
Figure 9 Moving up in a Logistics Value Chain
3.2 Logistics Facilities Over the decades, different forms of cross‐bundling have taken place in the logistics chain, leading to different types of Facility/ Infrastructure planning. There are a number of Logistics Facilities based on their components and service offerings. A few important forms of Logistics Facilities include:
• Distribution Center/ Warehouse (for Retail Logistics, etc.)
• Inland Container Depot (ICD)/ Container Freight Station (CFS)
• Free Trade Warehousing Zone (FTWZ)
• Logistics Park
3.2.1 Distribution Center/ Warehouse Retailing is the interface between the manufacturer and the individual consumer buying for personal consumption. It is the last link that connects the individual consumer with the manufacturing and distribution chain. Indian retail spending is growing at double digits (11.3% between 2006‐07 & 2007‐08) and the private final consumption expenditure at current prices was estimated at Rs. 26,07,584 crores in 2007‐08.

Pre‐feasibility Study for Development of Logistics Park Draft Pre‐feasibility Report
20
Organized retail is growing at 400% p.a. and is expected to reach around $30billion by 2010.
The retail chain starts with the international suppliers, domestic suppliers, and own manufacturing facilities supplying products to distribution centers which then go to city hubs/warehouses. From city hubs/ warehouses, these are transported to retail stores and finally to the consumer. Due the growth of retail, the demand for Distribution centers and Regional Warehouses is high.
Figure 10 Retail Logistics Value Chain
a) Modern Distribution Center
A modern Distribution Center is at the heart of logistics and is a complex space that acts as the focal point for the storage of goods. It also provides value‐added services like packaging, labeling, inventory control, bar coding and customer service functions such as repair, rework and repackaging. They are the indisputable nodal point within any logistics network, be it for retail or otherwise.

Pre‐feasibility Study for Development of Logistics Park Draft Pre‐feasibility Report
21
Figure 11 Modern Distribution Center with warehousing facility
The primary role of a distribution center is to receive large quantities of products and ship small quantities to individual stores; an important secondary role is storage (Distribution Warehouse). Many retailers have prioritized having as many items in stock at one time as possible. To conserve space, minimize inventory costs, and maximize the variety they offer the retail might only stock one or a few items of a particular product. This requires the ability to ship a replacement quickly once an item is sold. By keeping product on hand in the distribution center, the retailer can ship a replacement almost immediately after a product is sold.
b) Modern Distribution Warehouse
A Distribution warehouse is a part of a Distribution Center and is defined as a nodal point of a logistics network where goods are temporarily stored or transferred to another route running through the network.

Pre‐feasibility Study for Development of Logistics Park Draft Pre‐feasibility Report
22
Figure 12 Modern Warehouse Value Cahin
Figure 13 Modern Distribution Warehouse

Pre‐feasibility Study for Development of Logistics Park Draft Pre‐feasibility Report
23
The following table gives details about typical warehouse typologies and their specifications:
Table 4 Typical Warehouse Typologies ‐ Retail
Typical Warehouse Typologies Parameters Go‐down Modern Warehouse Distribution Warehouse Clear Height
10‐12 ft 20‐24 ft 37‐42 ft
Flooring Plain cement concrete
150‐200 mm; reinforced cement concrete flooring of M15‐M20 strength
250‐300 mm; reinforced cement concrete flooring of M20‐M25 strength
Levels Single floor; may have a mezzanine
Multiple level, with a maximum of four including ground floor
Multiple level, with a maximum of eight including ground floor
Dock Level Not applicable 1 mtr 1.1‐1.5 mtrs Area Typically between
5,000 ‐ 50,000 sq.ft.
Typically between 50,000 ‐ 3,00,000 sq.ft.
More than 3,00,000 sq.ft.
Type of Structure
Concrete or steel structure
Steel structure or pre‐engineered structure
Pre‐engineered structure
Equipment Manual operations Loading platforms, forklifts, dock levelers, etc
Dock levellers, mechanised loading, conveyors, cranes etc.
Technology Absence of automated systems and WMS
Warehouse Management System (WMS) present
Sophisticated Warehouse Management System present
Fire Fighting
Manual fire extinguishers
Sprinklers, smoke detectors etc.
Sprinklers, smoke detectors etc.
There are four primary functions that a Distribution Warehouse layout must accommodate:
1. Product storage
2. Inbound operations (including receiving and returns)
3. Outbound operations (including picking and staging)
4. Value‐added processes

Pre‐feasibility Study for Development of Logistics Park Draft Pre‐feasibility Report
24
Figure 14 Flow of goods in a Distribution Warehouse
3.2.2 Inland Container Depot (ICD) / Container Freight Station (CFS) An Inland Container Depot (ICD)/ Container Freight Station (CFS) can be defined as: A common user facility with public authority status equipped with fixed installations and offering services for handling and temporary storage of import/ export laden and empty containers carried under customs control and with Customs and other agencies competent to clear goods for home use, warehousing, temporary admissions, re‐export, temporary storage for onward transit and outright export. Transshipment of cargo can also take place from such stations.
Functionally there is no distinction between an ICD / CFS as both are transit facilities, which offer services for containerization of break bulk cargo and vice‐versa. These could be served by rail and/ or road transport. An ICD is generally located in the interiors (outside the port towns) of the country away from the servicing ports. CFS, on the other hand, is an off dock facility located near the servicing ports which helps in decongesting the port by shifting cargo and Customs related activities outside the port area. CFSs are largely expected to deal with break‐bulk cargo originating/ terminating in the immediate hinterland of a port any may also deal with rail borne traffic to and from inland locations.

Pre‐feasibility Study for Development of Logistics Park Draft Pre‐feasibility Report
25
Figure 15 Inland Container Depot with Rail siding
Keeping in view the requirements of Customs Act, and need to introduce clarity in nomenclature, all containers terminal facilities in the hinterland are designated as “ICDs".
The primary functions of ICD/CFS may be summed up as under:
• Receipt and dispatch/delivery of cargo
• Stuffing and stripping of containers
• Transit operations by rail/road to and from serving ports
• Customs clearance
• Consolidation and desegregation of LCL cargo
• Temporary storage of cargo and containers
• Reworking of containers
• Maintenance and repair of container units
The operations of the ICDs/CFSs revolve around the following centre of activities:
• Rail Siding (in case of a rail based terminal) The place where container trains are received, dispatched and handled in a terminal. Similarly, the containers are loaded on and unloaded from rail wagons at the siding through overhead cranes and / or other lifting equipments.
• Container Yard Container yard occupies the largest area in the ICD/ CFS. It is stacking area where the export containers are aggregated prior to dispatch to port, import containers are stored till Customs clearance and where empties await onward movement.

Pre‐feasibility Study for Development of Logistics Park Draft Pre‐feasibility Report
26
Likewise, some stacking areas are earmarked for keeping special containers such as refrigerated, hazardous, overweight/over‐length, etc.
• Warehouse A covered space/ shed where export cargo is received and import cargo stored/ delivered; containers are stuffed/stripped or reworked; LCL exports are consolidated and import LCLs are unpacked; and cargo is physically examined by Customs. Export and import consignments are generally handled either at separate areas in a warehouse or in different nominated warehouses/sheds.
• Gate Complex The gate complex regulates the entry and exit of road vehicles carrying cargo and containers through the terminal. It is place where documentation, security and container inspection procedures are undertaken.
The minimum area requirement for a CFS would be One Hectare (2.5 acres) and for ICD Four Hectares (10 acres). However, a proposal could also be considered having less area on consideration of technological upgradation and other peculiar features justifying such a deviation.
3.2.3 Free Trade Warehousing Zone (FTWZ)
Figure 16 Free Trade Warehousing Zone in proximity to a seaport
The Free Trade & Warehousing Zones (FTWZ) is a special category of Special Economic Zone with a focus on trading & warehousing. The scheme was announced in the foreign trade policy 2004‐09 to create trade related world class infrastructure to facilitate the import & export of goods & services with the freedom to carry out the trade transaction in free currency. This has since incorporated in the SEZ Act 2005 and therefore all

Pre‐feasibility Study for Development of Logistics Park Draft Pre‐feasibility Report
27
benefits available to SEZs shall be applicable to FTWZs. FTWZ shall be under the administrative control of the Development Commissioner (DC). Foreign Direct Investment (FDI) to the tune of 100 % is permitted in the development and establishment of FTWZ.
FTWZ is a deemed foreign territory and all equipments and materials sourced from the Domestic Tariff Area (DTA) will be considered as deemed exports. Movement of goods from FTWZ to DTA will be considered as imports. The minimum land requirement for a FTWZ is 40 hectares (approx. 100 acres) and 1 lakh sq.m. of warehousing space.
Each FTWZ would provide ‘World Class’ Infrastructure for:
• Warehousing for various kinds of products
• Handling and Transportation Equipment
• Commercial office space
• All related utilities –telecom, power, water, etc
• One stop clearance of Import and Export of goods
These Zones would be established in areas proximate to seaports, airports or dry ports so as to offer easy access by rail and road.
The List of Approved FTWZs (as on Jan ‘09) is given below:
Table 5 List of Approved FTWZs (as on Jan ’09)
Sr Name of the developer
Location State Type of SEZ Area in Acres
1. FAB City SPV (India) Pvt. Ltd.
Hyderabad AP FTWZ 300.15
2. Deccan Infrastructure and Land Holdings Ltd
Ranga Reddy District
AP FTWZ 101.17
3. Balaji Infra Projects Limited
Dighi Port, District Raigarh
MH Port based SEZ for Multi Product
inclusive of FTWZ
250
4. Chiplun Infrastructure Private Limited (formerly M/s FTWZ Ltd.)
Mumbai MH FTWZ 100
5. Arshiya Technologies International Limited
Village Sai, Taluka Panvel
MH FTWZ 170
6. J. Matadee Eco Parks Pvt. Ltd
Mannur Village, Sriperembdur
Taluk, Kancheepuram
TN FTWZ 100

Pre‐feasibility Study for Development of Logistics Park Draft Pre‐feasibility Report
28
Sr Name of the developer
Location State Type of SEZ Area in Acres
Distt. 7. Jafza Chennai
Business Parks Private Limited
Vallur Village, Ponneri Taluka, Tirvallur District
TN FTWZ 340.95
8. Jhunjhunwala Vanaspati Ltd.
Sahupuri, Distt. Chandauli
UP Multi Services SEZ with FTWZ & 25
MW Captive Power Plant
259.07
9. Arshiya International Ltd.
Village Ibrahimpur, Junaidpur
Urf, Moujpur, Bulandshar
UP FTWZ 136.65
10 Haldia Free Trade Warehousing Private Limited
Haldia WB FTWZ 114.3
The List of FTWZs with Valid In‐Principle Approvals (as on Jan ‘09) is given below:
Table 6 List of FTWZs with valid In‐Principle Approvals (as on Jan ’09)
Sr Name of the developer
Location State Type of SEZ Area in Acres
1. LMJ Warehousing Private Limited
Kandla GJ FTWZ 100
2. Shipco Infrastructure Private Limited (SIPL)
Karnataka KN FTWZ 300
3. Vibrant IL&FS Consortium
Naigaon MH FTWZ 117.35
4. Jafza Pvt. Ltd. Raigad MH FTWZ 213.75 5. Modern India Free
Trade Warehousing Pvt. Ltd.
Raigad MH FTWZ 101.175
6. M/s. DLF Unviersal Limited
Amtritsar, Punjab PB FTWZ 100
7. Vikram Logistics and Maritime Services Private Limited
Vallur and Edayanchavadi Villages, Ponneri Taluk, Tiruvallur
District
TN FTWZ 106.25
8. Greater Noida Integrated
Warehousing Pvt. Ltd. (Earlier known as
Free Trade Warehousing Zone
Pvt. Ltd.
Greater Noida UP FTWZ 200

Pre‐feasibility Study for Development of Logistics Park Draft Pre‐feasibility Report
29
3.2.4 Logistics Park A Logistics park is an attributed area that facilitates domestic and foreign trade by providing services including warehousing, cold storage, multimodal transport facilities and ICD/ CFS. Key factors that differentiate a logistics park from a typical ICD/ CFS/ Warehouse are value‐added services such as cross‐docking, customization, stacking and labeling.
Companies that are located within the facility get benefited in the form of reduced costs (less tied‐up capital, economies of scale, and/or logistics outsourcing) or an ability to provide better services in cooperation with other companies operating within the park.
The concept of a Logistics Park is a recent phenomenon. It can be traced back to the Foreign Trade Policy of 2004, which led to the development of FTWZs. While FTWZs were aimed at facilitating import and export of goods, the need for one‐stop solution that could additionally cater to the domestic market led to the development of Logistics Parks as a part of the infrastructure industry since 2005.
The comparison between Logistics Parks and FTWZs is given below:
Table 7 Logistics Parks vs. Free Trade Warehousing Zones (FTWZ)

Pre‐feasibility Study for Development of Logistics Park Draft Pre‐feasibility Report
30
4 COMPONENTS OF A LOGISTICS PARK
4.1 Basic Requirements of a Logistics Park The case studies of select Logistics Parks in India and abroad are highlighted in Annexure 1. Based on the case studies, it s observed that the development of a logistics park should have the following basic criteria:
a) Land & Area Requirements
Land parcels involved in Logistics Park projects should be preferably on city peripheries. The area has to be adequate in order to accommodate the facilities planned in the development of the Logistics Park. The site area affects the facilities planning and the vice‐versa also holds good. Hence the area of the site plays an important role in the development of Logistics Park.
b) Connectivity
Transportation is an essential and major sub‐function of logistics that creates time and place utility in goods. The key transport infrastructure required for moving goods from one place to another in India involve roads, rail, shipping ports and air freight.
Road transportation provides key services like cargo management, trucking related services like fleet management, network optimization and route planning.
Rail transportation provides cost effective movement of bulk cargo within the country.
Major ports and airports also facilitate container/ export‐import (EXIM) movement in the country. In addition airports account for high value domestic cargo and Express cargo movement within the country.
c) Human Resource Availability
Human resource is an important criterion in the selection of site for development of logistics parks. Skilled manpower is needed to be available in the area. Alternatively, the site should have easy access to the public transportation network of the city.
4.2 Facilities within a Logistics Park A form of cross‐bundling with a wider focus to include almost all the facilities across the Logistics value chain has given birth to the concept of Logistics Parks. A logistics park

Pre‐feasibility Study for Development of Logistics Park Draft Pre‐feasibility Report
31
facilitates both domestic and foreign trade. Some of the base facilities that form the skeleton structure of a logistics park are as follows.
1. Transportation Facility
Based on the project location and its access to the different modes of transportation the following facilities can be proposed in a logistics park.
• Road – Truck parking area/ Truck terminal
• Rail – Inland Container Depot/ Domestic Rail Head (DRH)
• Water – Port/ Container Freight Station(CFS)
• Air – Air Cargo Centre
2. Warehousing Facility ‐ Storage
Storage is an important function of a logistics park and the warehousing component of the park takes care of the same. Based on the products to be stored, the following storage facilities are planned within the park.
• Customised Warehouse
• Cold Storage Warehouse
• Bonded Warehouse
• General Warehouse
3. Support and Social Infrastructure facilities

Pre‐feasibility Study for Development of Logistics Park Draft Pre‐feasibility Report
32
4.3 Structure of a Logistics Park
Figure 17 Structure of a Typical Logistics Park
Common Facility
• Terminal Buildings – Truck, Rail
• Internal Roads & Railway Sidings
• Central Admin Facility
• Power Transmission & Distribution Network
• Telecom Network
Support Infrastructure
• Cooler Facility
• Power Back‐Up
• Water Storage & Treatment Plant
• Sewerage Treatment Plant
• Green Area
Warehousing Facility
• Customized Warehouse
• Cold Storage Warehouse
• Warehouses
• Office Space & Amenities – Agents, etc.
Air Cargo Centre
• Stuffing/De‐stuffing Area
• Bonded Warehouse
• Office Space & Amenities – Agents, etc.
Inland Container Depot
• Container Freight Station
• Container Stacking Area
• Bonded Warehouse
• Office Space & Amenities – Customs, etc.
Logistics Park

Pre‐feasibility Study for Development of Logistics Park Draft Pre‐feasibility Report
33
4.4 Functioning of a Logistics Park The functioning of a logistics park can be explained on the same lines on which the basic components of the park are formulated.
1. Transportation
Transportation plays an important role in the logistics value chain and is a vital component to decide upon the facilities to be created in a logistics park. Goods are exported/ imported and/or transported within the country by the different modes of transportation available such as road, rail, water and air. The road and rail bound goods are directly transported till the warehousing facility. However, water borne and air borne goods are further transported either by road or rail till the warehousing facility.
Truck Terminal, internal roads, rail siding, rail network, ICD/ CFS, Air Cargo Centre, etc. for the efficient movement of the goods, within the park forms the Transportation component of the logistics park.
2. Warehousing
a) Inbound / Outbound operations
The handling of goods at the warehousing facility is termed as the Inbound/ Outbound operations of the facility. The handling includes both loading and unloading of goods from/ to the warehouse.
Figure 18 Inbound / Outbound Operations of a Warehousing Facility

Pre‐feasibility Study for Development of Logistics Park Draft Pre‐feasibility Report
34
b) Storage
I. Storage Locations
The storage locations are of two types. They are Climate Controlled Storage Spaces and Non‐Climate Controlled Storage Spaces.
• Climate Controlled Storage space Warehouses offer climate controlled spaces for items that require storage in a climate controlled environment.
− Humidity Control Items that are sensitive to high humidity are generally stored in rooms with humidity at levels that are below 55 RH (Relative Humidity). Molds and mildew can grow on most surfaces and can spread easily as the spores can become air borne however mold and mildew growth is inhibited at 55 RH.
− Temperature Control Goods require storage in cold conditions and temperature controlled storage is the suitable option. Especially Food products need this kind of temperature controlled storage.
− Humidity and Temperature Control Certain kind of goods need both temperature and humidity control.
• Traditional Storage – Non Climate Controlled Storage Space Traditional storage offers no control over humidity and temperature. The space is basically maintained at whatever temperature and humidity levels as the remainder of the warehouse. Warehouses are generally maintained at a temperature a few degrees above the outside temperature in the winter and a few degrees below the outside temperature in the summer and the humidity level is dependent on outside humidity levels.
II. Storage Containers
The following is a list of some of the names and characteristics of common storage containers used in warehouses:

Pre‐feasibility Study for Development of Logistics Park Draft Pre‐feasibility Report
35
• Intermodal containers (shipping containers) are used for the efficient transportation of goods. There are standards that specify the volume and dimensions of containers to facilitate efficient handling.
• Pallets are one of the most commonly used means to store and move product in a distribution center. There are many specialized devices (MHE) used to handle pallets ‐ forklift truck, pallet jack, pallet inverter, and unit load Automated Storage / Retrieval System (ASRS). Pallets are stored on the floor, may be stacked, and may be stored in pallet rack.
Figure 19 Different Types of Pallets
Single Way Entry – Single Deck ‐ Non‐Reversible Pallet
Single Way Entry – Double Deck ‐ Reversible Pallet
2 Way Entry – Double Deck – Non‐Reversible Pallet
4 Way Entry – Double Deck – Non‐Reversible Pallet

Pre‐feasibility Study for Development of Logistics Park Draft Pre‐feasibility Report
36
4 Way Entry – Double Deck – Reversible Pallet
• Cases and Cartons are boxes usually containing many items. In distribution centers there is a generally accepted distinction made between the terms carton and case although both are boxes. Goods are received and stored in cartons. Goods are shipped in cases. A stored carton is called a case once it has been picked or pulled for shipment.
Different Sizes of Cartons
Cartons placed on Pallets – Cases
Figure 20 Cartons and Cases

Pre‐feasibility Study for Development of Logistics Park Draft Pre‐feasibility Report
37
• Totes are reusable containers used to hold and transport goods.
• Pallet Racking Systems: The choice of which type of racking best suits the requirement which comes down from type of storage. The various type of pallet racks used for the storage of different container size are shown in fig. below:
Figure 21 Pallet Racking Systems
Teardrop
Many Size Options
Rigurak
12' 14' Tall 90" Beams
Inca
15' & 20' Tall 8' and 9' Beams
Unarco T-Bolt
16' Tall 144" Beams
Unarco T-Bolt 21' tall
8' and 9' Beams
Amerack 72" Deep
Speedrack
22' Tall 92" Beams
Structural Rack
15' Tall,20' Tall,26' Tall 8', 8 1/2' and 11' Beams
Konstant 17' Tall
93" Beams
Sturdibilt
13' Tall 9' Beams
Paltier 16' Tall
8' Beams
Amerlock 12' Tall
9' Beams

Pre‐feasibility Study for Development of Logistics Park Draft Pre‐feasibility Report
38
Sammons
12' Tall 8' & 9'Beams
Speedrack
16' Tall and 15 Tall';100" Beams
Frontier 12’ Tall
8' Beams
Sturdibilt in San Antonio
20' Tall 8' and 9' Beams
Sturdibilt
20' Tall and 30' Tall 8' and 9' Beams
Teardrop Bulk Storage
24' Tall 8' Beams
Webb 12' Tall
8' Beams
Pennco 21' Tall
8' Beams
Unarco II 15' Tall
7' Beams
Amerack
16' and 18' Tall 5' Deep
Structural
22' Tall 9' and 10'6" beams
Unarco 2 19' 6"Tall
104" Long Beams
Republic 16' ' Tall 8' Beams
Rigurak 14' ' Tall
90" Beams
Hi-Line
19'6" and 23 ' Tall 92" , 108" & 144" Beams

Pre‐feasibility Study for Development of Logistics Park Draft Pre‐feasibility Report
39
• Air Freight Handling – Unit Load Devices (ULD) are an integral part of both wide‐bodied and some narrow‐bodied aircraft operations. The ULDs play an increasingly important role in providing safe, efficient movement of cargo and baggage.
Figure 22 Air Freight – Unit Load Device (ULD)
c) Value‐added Services
The Value‐added services provided by a warehousing facility, is an important function in the service portfolio of a LSP to establish their competitive advantage over the other LSPs in the market. A few of the value added services offered include Packaging & Labeling, Inventory Management, Quality Checking, Planning for cost control, etc.
One of the value‐added services gaining importance in the recent logistics market is the Reverse logistics. Reverse logistics as such recaptures the value of the product that is redundant and moves it back to the supply chain. Integration of similar, highly demanded value‐added services at the warehouse level would greatly enhance the value proposition of the LSPs.
3. Support and Social Infrastructure Facilities
The support and social infrastructure facilities include both essential infrastructure facilities for the effective functioning of the logistics park and other facilities that address the environmental and land‐use regulations within the park.
The facilities such as the Central administration facility, Office Spaces and Amenities, Cooler facility, Power back‐up, Power Transmission & Distribution network, Water storage & Treatment Plant, Sewerage Treatment Plant, Telecom network, etc. are necessary for the effective functioning of the logistics park are part of the Support Infrastructure facilities. The Social Infrastructure facilities include the eating areas, toilets, dormitories, recreational areas, etc.

Pre‐feasibility Study for Development of Logistics Park Draft Pre‐feasibility Report
40
5 DEMAND DRIVERS
5.1 Key Demand Drivers of Logistics in India The key demand drivers for the logistics Industry in India are:
• Economic growth
• Industrial growth
• Trade growth
• Agricultural growth
• Air cargo growth
• Retail growth
• Increased Exports from the state of Karnataka
a) Overall Economic Growth
i. India is among the fastest growing economies in the world, achieving an average growth rate of 8.8% in the five year period 2003‐04 to 2007‐08.
ii. Due to the Global Economic Slowdown, economic growth decelerated in 2008‐09 to 6.7 per cent.
iii. Recent Economic Growth:
The Indian economy is growing faster than earlier predicted, with growth in the 2nd Quarter of the FY09‐10 pegged at 7.9% year on year. The economy had earlier posted a growth rate of 6.1% in the 1st Quarter of the FY09‐10, an improvement over the 5.8% rate registered in the previous two quarters.
This is the highest quarterly growth registered in the past 18 months and would provide the ground to post at least 7% growth for the full FY 2009‐10.

Pre‐feasibility Study for Development of Logistics Park Draft Pre‐feasibility Report
41
Figure 23 Recent GDP Figures
iv. Following table shows the Rates of growth (FY 2003‐04 to 2008‐09) at factor cost at 1999‐2000 prices (per cent) for the different sectors of the economy.
Table 8 Rates of Growth (FY ’03‐’04 to ’08‐’09) for different sectors of Economy
b) Industrial Growth
i. Industrial growth is showing signs of recovery in the current Financial Year (2009‐10), with growth rate reaching a 22‐month high of 10.4% in August 2009.
ii. In the same period (August 2009), manufacturing output grew by 10.2 %, mining by 12.9 % and electricity production by 10.6 %. Of 17 industry groups, 14 showed positive growth. On the basis of use‐based industrial break‐up, consumer durables production grew by 22.3 %, basic goods by 10 % and intermediate goods by 14.3 %.

Pre‐feasibility Study for Development of Logistics Park Draft Pre‐feasibility Report
42
iii. Overall in the 2nd Quarter of FY 2009‐10, Manufacturing output grew by 9.2%
iv. The proposed Industrial Corridors (e.g. Delhi Mumbai Industrial Corridor or DMIC, Peninsular Region Industrial Development or PRIDe Corridor, Suvarna Karnataka Development Corridors or SKDC, etc.), Investment Regions (e.g. Petroleum, Chemicals & Petrochemical Investment Region or PCPIR, Information Technology Investment Regions or ITIR, etc.) and Special Economic Zones (SEZs), will further boost the industrial growth across the country.
c) Trade Growth
i. India’s exports have grown by 12.8 % in 2008‐09 and imports have grown by 17.9%.
ii. The EXIM growth would increase the requirement for ports, Inland Container Depots (ICDs) and Free Trade Warehousing Zones (FTWZs).
d) Agricultural Growth
i. For three consecutive years (2005‐06 to 2007‐08), food‐grain production recorded an average annual increase of over 10 million tonnes. The production of food‐grains in 2008‐09 was estimated to be 229.85 million tonnes.
ii. As per conservative estimates, around 35 million tonnes of agro warehousing are needed in next 5 to 10 years.
e) Air cargo Growth
i. India's increasing international trade combined with the strong domestic economy, is continuing to drive demand for air cargo and logistics. All major international cargo operators are reporting strong growth in the Indian market. New dedicated cargo airlines are being launched.
ii. It is estimated that the total processing space required at Indian airports is around 2,00,000 sq.m., while the current processing capacity is about 50,000 sq.m.
f) Retail Growth
i. At present, organized retail accounts for only about 3% of the total retail and is expected to reach 10% by end of the next financial year 2010‐11.
ii. This would require the creation of a huge backend infrastructure for this sector

Pre‐feasibility Study for Development of Logistics Park Draft Pre‐feasibility Report
43
5.2 Present Demand Drivers in Bangalore
5.2.1 Location and Connectivity
Figure 24 Map showing the central location of Bangalore City in South India
Bangalore is centrally located in south India and has good connectivity to other locations in the region. The following map shows the central location of Bangalore in south India:
a) Road
iii. Bangalore city is very well connected to the region as well as the rest of India through a strong network of National Highways (NH) and State Highways (SH).
iv. Bangalore is strategically located on both the Golden Quadrilateral and the North‐South Corridor of National Highways Authority of India (NHAI).
v. The major highways radiating from Bangalore (clockwise from North) include: NH‐7: towards Anathapur, Kurnool, Hyderabad, Nagpur & Delhi and is part
of the North‐South Corridor of NHAI NH‐4: towards Chittoor, Tirupati (from Chittoor) & Chennai NH‐7: towards Krishnagiri, Chennai (from Krishnagiri), Pondicherry (from
Krishnagiri), Salem, Madurai, Kanyakumari, Coimbatore (from Salem)

Pre‐feasibility Study for Development of Logistics Park Draft Pre‐feasibility Report
44
& Kochi (from Salem) and is part of both the Golden Quadrilateral & the North‐South Corridor of NHAI
NH‐209: towards Chamrajnagar & Coimbatore SH‐17: towards Mysore, Madikeri (from Mysore) & Kozhikode (from Mysore) NH‐48: towards Hassan & Mangalore NH‐4: towards Tumkur, Shimoga (from Tumkur), Goa (from Tumkur),
Chitradurga, Hubli, Belgaum, Pune & Mumbai and is part of the Golden Quadrilateral of NHAI
vi. The following figure shows the strategic location of Bangalore city on both the Golden Quadrilateral and North‐south Corridor of NHAI:
Figure 25 National Highways Development Project (NHDP) – Golden Quadrilateral, North‐South & East‐West Corridors

Pre‐feasibility Study for Development of Logistics Park Draft Pre‐feasibility Report
45
b) Rail
i. Bangalore city is well connected to major cities of India by the Indian Railways. It is part of the South‐Western Railways (SWR) zone, headquartered at Hubli, Karnataka.
ii. The following figure shows the network of Indian Railways:
Figure 26 Indian Railway Map

Pre‐feasibility Study for Development of Logistics Park Draft Pre‐feasibility Report
46
c) Air
i. The Bengaluru International Airport (BIA) is located 40 km north of the city’s central business district (CBD).
ii. The airport, which opened for traffic in May 2008, has been developed and is managed by the Bengaluru International Airport Ltd. (BIAL).
iii. In its 1st year of operation the airport has handled 8.7 million passengers and over 1,20,000 aircraft movements.
iv. 31 airlines currently operate from the airport, of which 20 are international airlines (including three freighters) and 11 are domestic airlines (including two freighters).
v. According to cargo projections made by BIAL, the airport is projected to handle 300,000 tonnes of cargo by 2010.
5.2.2 Major Production Centre Bangalore city is one of the major production centers in south India. Some of the key sectors which are driving the demand for logistics in Bangalore include Auto & Auto ancillaries, Textiles & Garments, Agro‐based & Food Processing, Floriculture, Electronics and Engineering. In addition to the above sectors, Cement and Iron & Steel are other important sectors in Karnataka. The highlights of these sectors are given below:
a) Auto & Auto ancillaries sector
Bangalore is an important centre for Auto & Auto Ancillaries sector, with presence of major players. These include Volvo (Bus unit at Hoskote near Bangalore), Toyota (Car unit at Bidadi near Bangalore) and Reva (Electric car unit at Bangalore). Other important units in the state include Tata Motors [Existing truck & bus (Marco Polo) units and proposed small car (Nano) unit at Dharwad] and TVS (2‐wheeler unit at Mysore). The list of Major Auto Units in Karnataka is given below:

Pre‐feasibility Study for Development of Logistics Park Draft Pre‐feasibility Report
47
Table 9 Projects in Auto & Auto Ancillaries Sector
Table 10 List of Major Auto Ancillaries Units in Karnataka
b) Textiles & Garments sector
The textiles & garments industry is the second largest employer in Karnataka after information technology and is worth nearly Rs 5,000 crores. Karnataka produced 6.5 lakh bales of cotton in 2008‐09, each bale weighing around 170 kg. The state
Pre‐feasibility Study for Development of Logistics Park Draft Pre‐feasibility Report
48
produced over 7,200 tons of silk in 2008‐09, amounting to 70% of India‘s total production. The state is a major apparel sourcing destination for the global market, with export of over US $ 1 billion. Bellary is emerging as major jeans manufacturing center for international brands.
Bangalore is a major center for textiles and garments. Several leading international brands have their units in the city. Companies such as Gokaldas Exports supply apparel to major global fashion labels. Around 1800‐2000 units (including small, medium & big) are located in & around Bangalore alone, employing over 5 lakhs people. Several units are located in the Peenya Industrial Estate. Doddaballapur, near Bangalore, is emerging as an important textiles & garments centre, with the Apparel Park, spread over 187 acres and housing 30 garment units, already operational. Apparel Park Phase II, spread over 282 acres, is currently under development and the Doddaballapur Integrated Textile Park, coming up under GoI’s Scheme for Integrated Textile Park (SITP), has already received an investment of Rs 160 crore and recruits 5,000 people.
c) Agro‐based & Food Processing sector
In 2008‐09, Karnataka produced 10.9 million tons of food grains (including 9.97 million tons of cereals & about 1 million ton of pulses), 1.01 million tons of oilseeds and 22.1 million tons of sugar cane. The state produced over 206 million tons of coffee in 2006‐07, accounting for nearly 70% of the country‘s total production. Karnataka is also one of the leading producers of fruits and vegetables in the country.
Several major international food companies have located their facility in Karnataka, including Nestle, Unilever, Global Green, Danone, Wrigley’s, Heinz, Pepsi, Coca Cola, Nissin, Ovobel and ITC Foods.
d) Floriculture sector
Karnataka is the leader in floriculture, accounting for 75% of India’s total flower production. The state has the highest area under modern cut flowers and over 40 large flower growing & exporting units, most of them located around Bangalore.

Pre‐feasibility Study for Development of Logistics Park Draft Pre‐feasibility Report
49
e) Electronics sector
Karnataka is one of the leading states in the electronics & telecommunications industry, with 300 leading international players and a number of public sector electronic companies, most of the located in & around Bangalore. The state also had over Rs. 3,000 crores of Hardware exports in 2007‐08.
f) Engineering sector
Karnataka has a strong engineering base with several PSUs, as well as large & medium privately owned units and small scale units, several of them located in & around Bangalore. The state’s engineering exports increased from over Rs. 1,048 Crores in 2002‐03 to over Rs. 8,300 Crores in 2008‐09 and constitute about 6% of exports from the state.
Bharat Earth Movers Ltd (BEML) (including equipments & metro coaches), Hindustan Machine Tools Ltd. (HMT) and Bharat Heavy Electricals Ltd. (BHEL) are among the leading PSUs in this sector in the state, while private sector companies include Bosch and Tyco.
g) Cement sector
The installed capacity of India’s cement industry is expected to increase to 241 MTPA by FY 2010‐end, according to a report by ICRA Industry Monitor. The industry is likely to record an annual growth of 10% in coming years.
Karnataka’s installed capacity of cement production was 13.38 MTPA in 2007‐08. The existing major cement plants in Karnataka include ACC Ltd. at Wadi, Gulbarga District (2 plants of 2.59 MTPA & 3.20 MTPA capacities), Vasavadatta Cement at Sedam, Gulbarga District (3.00 MTPA), Rajashree Cements at Sedam, Gulbarga District (3.0 MTPA) and JSW Cements Ltd. at Tornagallu, Bellary district (2.8 MTPA Slag grinding with 1.1 MTPA Portland Slag Cement). The projects under implementation/ proposed include JK Cement at Muddapur, Bagalkot District (3.50 MTPA capacity), Ultratech Cement at Ginigera, Koppal District, Sagar Cements Ltd. (5.0 MTPA capacity), Dalmia Cement at Yadwad near Gokak, Belgaum District (4.0 MTPA capacity) and Chambal Fertilizers & Chemicals at Ferozabad, Gulbarga district (3.2 MTPA capacity).

Pre‐feasibility Study for Development of Logistics Park Draft Pre‐feasibility Report
50
h) Metal sector
The Installed capacity of Karnataka’s iron & steel industry in 2007‐08 was 7.29 MTPA and is expected to increase to 43.89 MTPA after completion of all the proposed units. Several companies in the Hospet‐Bellary region are engaged in iron & steel based industries. Jindal Iron & Steel Company Limited (JISCO) promoted JSW Steel Limited (formerly Jindal Vijayanagar Steel Ltd or JVSL), located at Toranagallu in Hospet‐Bellary region, is the state’s largest steel plant. The Visweswaraiah Iron & Steel Ltd. at Bhadravathi is another major iron & steel plant in the state.
Hindalco has an aluminium plant near Belgaum.
i) Micro, Small and Medium Enterprises (MSME) Clusters in Karnataka
The following table gives the MSME clusters in the state of Karnataka. Micro, Small and Medium units are located among these clusters which control their logistics functions individually and according to their budgetary allocations.
Table 11 MSME Clusters in Karnataka
MSME Clusters in Karnataka
Sl.No District Cluster Place Cluster Activity
1 Bengaluru Bengaluru Machine Tools
2 Bengaluru Bengaluru Power loom
3 Bengaluru Bengaluru Electronic Goods
4 Bengaluru Bengaluru Readymade Garments
5 Bengaluru Bengaluru Light Engineering
6 Bengaluru Bengaluru Leather Products
7 Belgaum Belgaum Foundry
8 Belgaum Belgaum Power loom
9 Bellary Bellary Jeans Garments

Pre‐feasibility Study for Development of Logistics Park Draft Pre‐feasibility Report
51
MSME Clusters in Karnataka
Sl.No District Cluster Place Cluster Activity
10 Bijapur Bijapur Oil Mills
11 Bijapur Bijapur Grape Processing
12 Dakshina Kannada Mangalore Food Products
13 Davangere Davangere Puffed Rice
14 Darwad Hubli, Dharwad Agriculture Implements and
Tractor Trailer
15 Darwad Darwad Industrial Valves
16 Gadag Gadag Betgeri Power loom
17 Gulburga Gulburga Gadag
belt Dal Mills
18 Hassan Arasikere Coir & Coir Products
19 Koppal Gangavathi Rice Mills
20 Mandya Mandya Jagggery
21 Mysore Mysore Food Products
22 Mysore Mysore Silk
23 Raichur Raichur Leather Products
24 Shimoga Shimoga Foundry
25 Shimoga Shikaripura Rice Mills
26 Shimoga Shimoga Rice Mills
Source: Directorate of Industries

Pre‐feasibility Study for Development of Logistics Park Draft Pre‐feasibility Report
52
Figure 27 Major Production Centres in Karnataka
5.2.3 Major Consumption Centre Bangalore is the 5th largest metropolitan city in India with a population of around 8 million and spread over an area of 709.53 sq. kms.
The city has been recently rated as the 2nd most affluent city in India, in terms of lifestyle and consumption habits according to an Upper Middle and Rich (UMAR) survey conducted by Nielsen. The annual disposable income of over 650,000 professionals employed in the IT & ITES sector in Bangalore is estimated to be around Rs. 12,000 crores (US$ 2.79 billion) per annum.
Some of the key contributors to consumption in Bangalore include retail in general and automobile, food, FMCG and white goods & consumer electronics markets in particular. The growing demand for real estate (residential, commercial/ retail & industrial) has

Pre‐feasibility Study for Development of Logistics Park Draft Pre‐feasibility Report
53
increased the consumption of construction materials, including steel & cement. The highlights of these markets are given below:
a) Retail Market
India is the 5th largest retail destination globally and is ranked as the most attractive emerging market for investment in retail sector by AT Kearney's eighth annual Global Retail Development Index (GRDI) in 2009.
Bangalore has over 3.2 million sq ft. of organised retail and 16.3 million sq. ft. is projected by 2012‐13. The table below depicts the different retail formats offered by the large retail players in India, majority of which are present in Bangalore:
Table 12 Retail formats of Retail Market Players in India
Several large retail players have set up Distribution Hubs in Bangalore. Pantaloon Retail (Future Group), one of the biggest players in organised retail sector, currently has over 3 lakhs sq. ft. of warehousing space in the city (at Hoskote & Nelamangala) and is planning another 3 lakhs sq. ft. in the near‐term future, with land already

Pre‐feasibility Study for Development of Logistics Park Draft Pre‐feasibility Report
54
acquired for adding another 4.5 lakhs sq. ft. in the medium‐term future. Thus, the potential demand from just one large retail player is over 10 lakhs sq. ft. Thus, if we consider the growing number of large retail players in the city as well as the different formats offered by them, the Retail Warehousing requirements in Bangalore, prima facie, is at least 10 lakhs sq. ft. in the near future and 30‐50 lakhs sq. ft. in the next 5‐10 years, at a conservative estimate. Assuming 50% ground coverage, the site requirement would be at least 50 acres (~21,78,000 sq. ft.) in the near future and 100‐150 acres (~43,46,000 – 65,34,000 sq. ft.) in the next 5‐10 years.
b) Auto & Auto Ancillaries Market
Over 34 lakh vehicles are currently registered in Bangalore, of which about 70% are 2‐wheelers and 15% are cars. The city has an annual vehicular growth rate of over 10%, with 1,000 new vehicles added to the city’s roads everyday, on an average. Growth of Bangalore’s vehicle population is depicted in the table below:
Figure 28 Vehicle Growth Rate in Bangalore
As per data obtained from the Department of Commercial Taxes, Government of Karnataka the following quantity of Auto & Auto Ancillary products entered Bangalore in a period of one month (November 2009) through the Check Post at Tumkur Road (NH‐4):
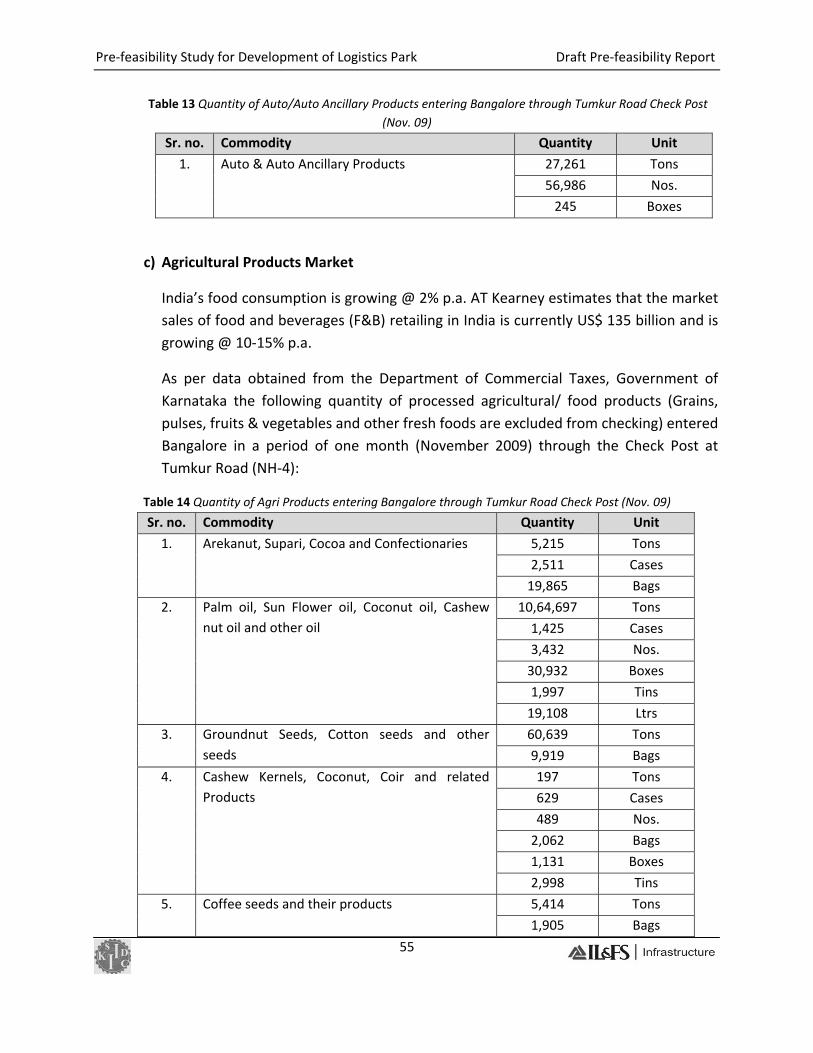
Pre‐feasibility Study for Development of Logistics Park Draft Pre‐feasibility Report
55
Table 13 Quantity of Auto/Auto Ancillary Products entering Bangalore through Tumkur Road Check Post (Nov. 09)
Sr. no. Commodity Quantity Unit
1. Auto & Auto Ancillary Products 27,261 Tons
56,986 Nos.
245 Boxes
c) Agricultural Products Market
India’s food consumption is growing @ 2% p.a. AT Kearney estimates that the market sales of food and beverages (F&B) retailing in India is currently US$ 135 billion and is growing @ 10‐15% p.a.
As per data obtained from the Department of Commercial Taxes, Government of Karnataka the following quantity of processed agricultural/ food products (Grains, pulses, fruits & vegetables and other fresh foods are excluded from checking) entered Bangalore in a period of one month (November 2009) through the Check Post at Tumkur Road (NH‐4):
Table 14 Quantity of Agri Products entering Bangalore through Tumkur Road Check Post (Nov. 09)
Sr. no. Commodity Quantity Unit
1. Arekanut, Supari, Cocoa and Confectionaries 5,215 Tons
2,511 Cases
19,865 Bags
2. Palm oil, Sun Flower oil, Coconut oil, Cashew nut oil and other oil
10,64,697 Tons
1,425 Cases
3,432 Nos.
30,932 Boxes
1,997 Tins
19,108 Ltrs
3. Groundnut Seeds, Cotton seeds and other seeds
60,639 Tons
9,919 Bags
4. Cashew Kernels, Coconut, Coir and related Products
197 Tons
629 Cases
489 Nos.
2,062 Bags
1,131 Boxes
2,998 Tins
5. Coffee seeds and their products 5,414 Tons
1,905 Bags

Pre‐feasibility Study for Development of Logistics Park Draft Pre‐feasibility Report
56
Sr. no. Commodity Quantity Unit
6. Pepper and Black pepper 101 Tons
565 Bags
7. Gutka 4,525 Cases
2,083 Bags
8. Dry Grapes, Dry Chilly, Chilly Powder and Closures
181 Tons
256 Cases
1,209 Bags
992 Boxes
9. Other Food Products and Medicines 543 Tons
956 Cases
4,941 Bags
856 Boxes
d) FMCG Market
India’s Fast Moving Consumer Goods (FMCG) market is poised to grow @ 10‐12% p.a. for next 10 years to reach US$ 43 billion by 2013 and US$ 74 billion by 2018, according to a new FICCI‐Technopak report.
e) Electrical & Electronics Products Market
India’s consumer electronics industry is estimated to grow @ 10‐12% p.a. for the next 10 years. The sales trends & future projections of select consumer electronic goods is shown below:
Figure 29 White goods & Consumer Electronics Market

Pre‐feasibility Study for Development of Logistics Park Draft Pre‐feasibility Report
57
As per data obtained from the Department of Commercial Taxes, Government of Karnataka the following quantity of Electrical & Electronics Products entered Bangalore in a period of one month (November 2009) through the Check Posts at Tumkur Road (NH‐4):
Table 15 Quantity of Electrical/ Electronics Products entering Bangalore through Tumkur Road Check Post (Nov. 09)
Sr. no. Commodity Quantity Unit
1. Electrical, Electronics and Precision Equipments
3,442 Tons
806 Cases
1,69,330 Nos.
13,058 Pcs
2. Cables 14,041 Tons
5 Bundles
3. Transformers, Generators and Heavy Electricals
130 Tons
11,751 Nos.
f) Textiles & Apparels Market
As per data obtained from the Department of Commercial Taxes, Government of Karnataka the following quantity of Textiles & Apparels entered Bangalore in a period of one month (November 2009) through the Check Posts at Tumkur Road (NH‐4):
Table 16 Quantity of Textiles & Apparels entering Bangalore through Tumkur Road Check Post (Nov. 09)
Sr. no. Commodity Quantity Unit
1. Cotton Products 1,55,465 Tons
3,520 Bags
1,36,616 Bales
378 Boxes
420 Bundles
2. Apparels, Garments, Fibre, Foam, Yarn, Threads and related products
222 Tons
5,030 Nos.
7,557 Pcs
33 Boxes

Pre‐feasibility Study for Development of Logistics Park Draft Pre‐feasibility Report
58
g) Construction Materials Market
Bangalore is witnessing a steady increase in construction activity in all categories‐ residential, commercial (office & retail) and industrial.
The following table indicates the demand‐supply scenario in residential market in Bangalore:
Table 17 Demand‐Supply Scenario in Residential Market in Bangalore
Year Demand (DU) Supply (DU) Demand‐Supply Gap (DU)
Year 2009 16,68,381 14,79,395 1,88,986
Year 2010 17,26,775 15,97,746 1,29,028
Year 2011 17,87,212 17,25,566 61,645
Following table indicates demand‐supply scenario in office market in Bangalore:
Table 18 Demand‐Supply Scenario in Office Market in Bangalore
Year Cumulative Demand
(Million sq. ft.)
Cumulative Supply (Million sq. ft.)
Demand Supply Gap (Million sq. ft.)
Year 2009 73.14 63.09 10.05
Year 2010 80.97 69.01 11.96
Year 2011 87.86 75.23 12.63
As mentioned earlier, Bangalore has over 3.2 million sq ft. of organised retail and 16.3 million sq. ft. is projected by 2012‐13.
i. Cement
• India’s per capita cement consumption is estimated to be 150 kg p.a., less than 1/3rd of China’s consumption. The demand for cement is expected to grow @ 10% p.a.
• The cement consumption in Karnataka was 11.17 MPTA in 2006‐07.
• Around 7,500 tons of cement arrive everyday by rail alone at the Satellite Goods Terminal, Whitefield, Bangalore from the ACC Plant at Wadi. Only about

Pre‐feasibility Study for Development of Logistics Park Draft Pre‐feasibility Report
59
30% is stored in the Central Railside Warehouse Company Ltd. (CRWC) warehouse due to space constraints, while the balance is vacated immediately to construction sites or other warehouses. The process of vacating the cement for onward storage adds to the handling & inventory cost and increases the chances of damage. Hence, it is preferable to store the cement at the raliside warehouse itself and deliver it direclty to the construction site. Assuming that 40‐50% of the vacated cement is stored in other warehouses, the unmet railside warehousing demand is almost equivalent to the existing storage capacity of around 2.3 lakhs sq. ft. (~5 acres area).
• Also, 1370 bags and 80 tons of Cement & Cement Products arrived in one single month (November 2009) in Bangalore by road at the Tumkur Road (NH‐4) Check Post.
ii. Other Building Materials
• As per data obtained from the Department of Commercial Taxes, Government of Karnataka the following quantities of other construction materials entered Bangalore in a period of one month (November 2009) through the Check Posts at Tumkur Road (NH‐4) alone:
Table 19 Quantity of Other Building Materials entering Bangalore through Tumkur Road Check Post (Nov. 09)
Sr. no. Commodity Quantity Unit
1. Granite Block, Slabs and related products 4,577 Tons
38,014 Nos.
13,372 Pcs.
5,945 Boxes
2,52,033 Cu. m
4,70,905 Sq. m.
2. Timber, Wood, Teak logs and Wooden products
18,313 Tons
31,711 Nos.
58,787 Cu. M.
19,382 Sq. m.
3. Plywood and related products 1,073 Tons
3,27,736 Nos.
14,491 Pcs.
3,261 Sq. m.
4. Ceramics and Tiles 30,706 Nos.
6,273 Boxes

Pre‐feasibility Study for Development of Logistics Park Draft Pre‐feasibility Report
60
h) Iron & Steel Products (inlcuding for construction purpose) Market:
• India’s per capita steel consumption is estimated to be 30 kg p.a., less than the world average of 150 kg p.a. and 350 kg p.a. in developed countries.
• The demand for steel is expected to grow by 7.3% p.a. to reach a per capita figure of 165 kg p.a.
• As per data obtained from the Department of Commercial Taxes, Government of Karnataka the following quantities of Iron & Steel products entered Bangalore in a period of one month (November 2009) through the Check Posts at Tumkur Road (NH‐4) alone:
Table 20 Quantity of Other Building Materials entering Bangalore through Tumkur Road Check Post (Nov. 09)
Sr. no. Commodity Quantity Unit
1. Iron & Steel Products 22,03,540 Tons
695 Cases
68,838 Nos.
733 Pcs.
200 Bags
6,176 Bundles
i) Other Goods/ Products Market:
• As per data obtained from the Department of Commercial Taxes, Government of Karnataka the following quantities of other goods/ products entered Bangalore in a period of one month (November 2009) through the Check Posts at Tumkur Road (NH‐4) alone:
Table 21 Quantity of Other Goods entering Bangalore through Tumkur Road Check Post (Nov. 09)
Sr. no.
Commodity Quantity Unit
1. Copper, Brass and Metal Scrap 23,941 Tons
1,147 Nos.
203 Bags
548 Boxes
1,483 Bundles

Pre‐feasibility Study for Development of Logistics Park Draft Pre‐feasibility Report
61
Sr. no.
Commodity Quantity Unit
2. Chemicals, Bottles, Bitumen and related products
97,767 Tons
91 Cases
1,50,437 Nos.
7001 Pcs.
2,842 Bags
2,646 Boxes
58 Bundles
3. Rubber, latex and related products 14,300 Tons
5,562 Bags
4. Furniture 17,420 Nos.
5. PVC Products 43,812 Tons
79,925 Nos.
2,668 Pcs.
1,081 Bags
123 Boxes
6. Other Miscellaneous Products 1,19,759 Tons
8,956 Cases
8,39,548 Nos.
28,428 Pcs.
17,488 Bags
70,822 Boxes
2,510 Bundles
40,000 Ltrs
444 Sq. m
5.2.4 Major Transportation Centre Bangalore is a Major Transportation Centre due to its location & connectivity as well being a major production & consumption centre.
a) As per information from the Karnataka Goods Transporters Association (KGTA), everyday around 3000–3500 trucks reach the outskirts of Bangalore, out of which around 1000‐1500 trucks enter the city while around 2000 trucks bypass the city and have no loading/ unloading requirements within the city.
b) The existing D. Devaraj Urs Truck Terminal at Yeshwanthpur handles around 600 – 700 trucks per day, over & above the 500 small vehicles using the facility for carrying the goods to the city.

Pre‐feasibility Study for Development of Logistics Park Draft Pre‐feasibility Report
62
c) The KGTA has expressed the need for the development of a Goods Transport Complex, similar to the Transport Nagars in north India (e.g. Sanjay Gandhi Transport Nagar in Delhi), of atleast 200 acres area in the Nelamangala region (NH‐4). According to the association, its 600 members require a minimum area of around 4,500 sq. ft. (500 sq. yds.) each and its 1000 agents require a minimum area of around 2,250 sq.ft. (250 sq.yds.) each, while the support facilities like Repair shops require a minimum area of 1,080 sq.ft. (120 sq.yds.). The association has further indicated the requirement of around 1000 shops and a minimum of 10–15 acres for idle parking of the trucks. The KGTA has also expressed the need for proportionately smaller facilities along Hosur Road (NH‐7), Old Madras Road (NH‐4) and Bellary Road (NH‐7).
d) According to the D. Devaraj Urs Truck Terminal Ltd. (DDUTTL), there is a demand for organized truck handling facility of about 30 acres area along the Bellary Road (NH‐7). DDUTTL is under the process of land acquisition of about 9 acres through the Bangalore Development Authority (BDA) in Kogilu, Yelahanka to create a Truck Terminal facility. However, the project has been delayed for due to land acquisition issues. Thus, even if the facility is developed, there will still be a Demand‐Supply gap of about 21 acres along Bellary Road (NH‐7).
5.3 Future Demand Drivers in Bangalore
5.3.1 Suvarna Karnataka Industrial Corridors (SKDC)
a) GoK, in the state budget for 2008‐09, spelt out its intension to implement the Suvarna Karnataka Development Corridor (SKDC) Programme.
b) The overall objective of such Industrial Corridors is to accelerate industrial growth through infrastructure support and enable contribution to the economy from potential areas along the Corridor.
c) Core infrastructure such as energy, road & rail linkages, inland container depots, free trade zones and urban infrastructure would be developed/ augmented to stimulate industrial growth along these corridors.
d) SKDC proposes to cover about 11 District headquarters and more than 20 major towns along the highways/major roads and rail links. As a part of this Programme, the major industrial corridors/zones/nodes are proposed along the following locations: i. Bidar‐Gulbarga‐Bellary‐Hiriyur ii. Tumkur‐ Honnavar via Shimoga

Pre‐feasibility Study for Development of Logistics Park Draft Pre‐feasibility Report
63
iii. Chitradurga‐Mangalore via Shimoga‐Udupi iv. Chitradurga‐Hospet‐Koppal‐Raichur v. Chitradurga‐Hospet‐Bagalkot‐Bijapur
e) In addition to the proposed Industrial Corridors, GoK also proposes to develop
following ten Special Industrial Zones on the PPP model, most of which will have direct impact from the proposed SKDC Programme: i. Steel: Bellary, Koppal, Bagalkot, Haveri, Gadag & Raichur Districts ii. Cement: Gulbarga, Bagalkot, Chitradurga, Belgaum & other Districts. iii. Food Processing: Bangalore Rural, Kolar, Belgaum, Gadag, Koppal, Shimoga,
Bagalkot, Bijapur, Davangere, Mandya and Dharwad Districts. iv. IT / BT: Mysore, Mangalore, Hubli‐Dharwad, Belgaum, Shimoga, Gulbarga, Kolar &
Mandya Districts. v. Automobile: Ramanagara, Shimoga Dharwad & Kolar Districts. vi. Readymade Garments: Bangalore Rural, Tumkur, Kolar, Mandya, Belgaum, Bidar,
Dharwad & other Districts. vii. Sugar and co‐gen, power: Bidar, Belgaum, Bagalkot, Shimoga & Mandya Districts. viii. Pharmaceutical/Bio‐Technology: Bangalore, & Hassan Districts. ix. Power Generation: Raichur, Bellary, Bijapur & Chitradurga Districts. x. Media & Entertainment: Bangalore (R) & Ramanagara Districts.
f) The following map shows the proposed Development Corridors and Special Industrial
Zones under the SKDC Programme.
g) Once the SKDC Programme is implemented, the logistics requirements in Karnataka, in general, and Bangalore, in particular, will exponentially increase.

Pre‐feasibility Study for Development of Logistics Park Draft Pre‐feasibility Report
64
Figure 30 Suvarna Karnataka Industrial Corridors
5.3.2 Information Technology Investment Region (ITIR)2 The Ministry of Information Technology and Communication (MIT), Government of India (GoI), vide Gazette notification dated 28.05.2008, has published a policy resolution for setting up of Information Technology Investment Regions (ITIRs) across the country. The policy is aimed at promoting investment in the Information Technology (IT), Information Technology Enabled Services (ITES) and Electronic Hardware Manufacturing
2 Source: EoI issued by KEONICS

Pre‐feasibility Study for Development of Logistics Park Draft Pre‐feasibility Report
65
(EHM) sector. ITIR is expected to be spread over 40 Sq. Kms. area covering 10,000 acres in each region.
Recognising the potential of the ITIR concept, the Karnataka State Electronics Development Corporation Ltd. (KEONICS), proposes to develop an ITIR in the “Bangalore‐BIAL” region of Karnataka. The proposed ITIR covers parts of Devanahalli and Doddaballapur taluks (Bangalore Rural district) and would have provision for Electronic Hardware Zones, housing Electronic Hardware Manufacturing (EHM) Units, apart from IT & ITES Zones.
5.3.3 Other Proposed Developments A. Hardware Technology Park
GoK has proposed to develop a Hardware Technology Park spread over an area of 869.09 acres at Bagalur, Mahadevakodigehalli and Hoovinayakanalli villages of Jala hobli in Bangalore North taluk in the vicinity of the Bengaluru International Airport (BIA). The Karnataka Industrial Area Development Board (KIADB) has issued final notification for acquisition of land.
B. SEZs / Industrial Parks The following is the list of approved SEZs / Industrial Parks (IPs) in the state of Karnataka, out of which most of the SEZs / IPs are in and around Bangalore.
Table 22 Approved SEZs in the State of Karnataka
Approved SEZs/IPs in the State of Karnataka3
Location Name of Promoter
Nidege, Shimoga‐IT/ITES/Electronic Hardware SEZ‐145.50 Hec‐Formal Approval
M/s KEONICS
Kundalahalli, KR Puram, Bangalore‐Bio‐Tech SEZ, 10.95 Hect‐Formal Approval
M/s Gopalan Enterprises India Pvt Ltd
Bellary Road, Yelahanka, Bangalore‐IT/ITES SEZ, 12.00 Hect‐Formal approval
M/s Gulf Oil Corporation Limited
Koorgalli Indl.Area, Mysore ‐ 10 hec ‐ IT/ITES ‐ formal approval. Rennaisance Design Build Private Limited
KIADB Indl.Area, Holenarasipura Road, Hassan ‐ 100 hec ‐ Electronic Hardware/IT/ITES ‐ formal approval.
Opto Infrastructure Limited
Kadugodi Industrial Area, K.R. Puram, Bangalore ‐ 23.47 hec ‐IT/ITES ‐ formal approval.
M/s. Concord India Private Limited
3 SEZ’s/IPs approved by Board of Approval, GOI & Under establishment – Source: Karnataka Udyog Mitra (KUM)

Pre‐feasibility Study for Development of Logistics Park Draft Pre‐feasibility Report
66
Approved SEZs/IPs in the State of Karnataka3
Location Name of Promoter
Chokkanahalli, Yelahanka, Bangalore ‐ 10 hec ‐ IT/ITES ‐ formal approval.
Milestone Buildcon Private Limited
Bangalore International Airport Premises, Devanahalli, Bangalore ‐112.96 hec ‐ Airport Based SEZ ‐ formal approval.
Bangalore International Airport Limited
Hire Amanikere, N.H.7, Devanahalli, Bangalore ‐ IT/ITES ‐ 10.36 hec ‐ formal approval.
Gokaldas Images Infrastructure Private Limited
EPIP Indl.Area, Ganjimutt, Mangalore ‐ 10 hec ‐ IT/ITES ‐ formal approval and notified. Under implementation
Brigade Enterprises Private Limited
Hoodi, Whitefield, Bangalore. Formal approval & notified‐ IT/ITES SEZ ‐ 10 hec. Under implementation
Gopalan Enterprises India Pvt. Ltd.
Belgaum. Formal approval and notified ‐ 103 hec ‐ under implimentation.
Quest SEZ Development Pvt. Ltd.
Mangalore. Formal approval and notified ‐ Petroleum and Petrochemicals SEZ ‐ 588 hec.‐ under implimentation.
Mangalore SEZ Ltd.
Thumbay, Bantwal, Dakshina Kannada District Formal approval and notified ‐ IT/ITES SEZ ‐ 10 hec ‐ under implimentation.
B.A.Tech Park Pvt. Ltd.
Sonnenahalli, K.R.Puram, Bangalore. Formal approval ‐ IT/ITES SEZ ‐14 hec.
Salarpuria Properties Pvt. Ltd.
Doddenakundi & Mahadevapura, K.R.Puram, Bangalore. Formal approval and notified ‐ IT/ITES SEZ ‐ 12 hec ‐First phase operational
Bagmane Constructions Pvt. Ltd.
EPIP Industrial Area, Ganjimutt, Mangalore. Formal approval ‐IT/ITES SEZ ‐ 10 hec.
Kinfotech Software Pvt. Ltd.,
Nanjangud Taluk, Mysore. Formal approval ‐ Electronic Hardware and IT/ITES SEZ ‐ 12 hec
Opto Infrastructure Ltd.
Mahadevapura & Kaggadasapura, K.R.Puram, Bangalore. Formal approval and notified ‐ IT/ITES SEZ ‐ 14 hec Under implemenation
Gopalan Enterprises India Pvt. Ltd.
Nagavara, Bangalore. Formal approval ‐ IT/ITES SEZ ‐ 11 hec.Notified & under implimentation
Karle Infra Projects
Padubidre, Udupi District. Notified and 1st phase operational ‐ Hi‐tech Engineering SEZ ‐ 259 hec.
Suzlon Infrastructure Ltd.
Bangalore, Electronic City 3rd Phase, Bio Technology SEZ, 43.00 Hectares ‐ formal approval and notified.
KBITS
Bangalore, Whitefield Main Road, IT / ITES SEZ, 20.24 Hectares Chaitanya Infrastructure Pvt. Ltd.,
Bangalore, Bellandur, Amanikane, IT / ITES SEZ, 20.23 Hectares Divyashree Infrastructure
Bangalore, C.V. Raman Nagar, IT / ITES SEZ, 12.14 Hectares Bagmane Developers Pvt. Ltd.,
Bangalore, Bagur Village, Hoskote Tq., SEZ for Hardware and IT, Ittina Properties Pvt. Ltd.,

Pre‐feasibility Study for Development of Logistics Park Draft Pre‐feasibility Report
67
Approved SEZs/IPs in the State of Karnataka3
Location Name of Promoter
15.73 Hectares. Notified and under implimentation.
Bangalore Rural District, Akkalalenahalli and Mallenahalli, Devanahalli Tq, IT & ITES SEZ, 13.44 Hectares
Concord Investments
Bangalore, Bellandur, Varthur Hobli. Notified and 1st phase operational‐ Electronic Hardware and IT /ITES SEZ, 12.65 Hectares ‐
Primal Projects Pvt. Ltd.,
Bangalore, Jaala Hobli North, IT & ITES SEZ, 26.30 Hectares Golden Gate Developers Private Ltd.,
Bangalore, Sadaramangala Indl. Area, Whitefield, IT & ITES SEZ, 10 Hectares
San Engineering & Locomotive Company Ltd.,
Mysore, Hebbal, IT & ITES SEZ, 30.99 Hectares. Notified and under implimentation.
Infosys Technolgies Ltd.,
Banglaore, Devarabeesanahalli Village, Varthur Hobli, Bangalore East Taluk, IT & ITES SEZ, 36.85 Hectares. Notified and 1st phase operational.
Vikas Telecom Limited
Bangalore, Marathahalli‐Sarjapur Outer Ring Road, IT & ITES SEZ, 19.22 Hectares. Notified and 1st phase operational.
Cessna Garden Developers Pvt. ltd.,
Shimoga, Nidige Village, Shimoga Tq. Engineering Sector SEZ, 101 Hectares
Karnataka Industrial Area Development Board
Bangalore ‐ Mysore Highway. Electronic Hardware and IT/ ITES SEZ, 26.6 Hectares. Notified and 1st phase operational.
Tanglin Developments Ltd.,
Bangalore, Whitefield, IT / ITES SEZ, 10.88 Hectares. Notified and 1st phase operational.
Information Technology Park Ltd.,
Mangalore, IT&ITES SEZ, 125 Hectares. Notified and 1st phase operational.
Infosys Tech. Ltd.,
Bangalore, Devarabeesanahalli, Boganahalli etc. Bangalore East Tq. IT / ITES SEZ, 27.91 Hectares. Notified and 1st phase operational.
Adarsh Prime Projects Pvt. Ltd.,
Bangalore, Nagawara & Rachenahalli Villages, IT / ITES SEZ, 22 Hectares. Notified and 1st phase operational.
Manyatha Promoters
Bangalore, Khudalahalli, K.R. Puram, IT & ITES SEZ, 21 Hectares. ‐Notified and 1st phase operational.
Shmaraj and Company (India) Pvt. Ltd.,
Bommasandra Industrial Area, Bangalore, Bio Technology SEZ, 36 Hectares. Notified and 1st phase operational.
Biocon Limited
Hassan, Pharma SEZ‐ 109 Hectares ‐ Notified and under implimentation.
Karnataka Industrial Area Development Board
Bangalore (Electronics City) IT/ITES SEZ ‐ 5.17 hectares ‐ Notified and 1st phase operational.
Wipro Infotech
Bangalore (Sarjapur)IT/ITES,(Area 6.84 Hectares) ‐ Notified and 1st phase operational.
Wipro Limited.
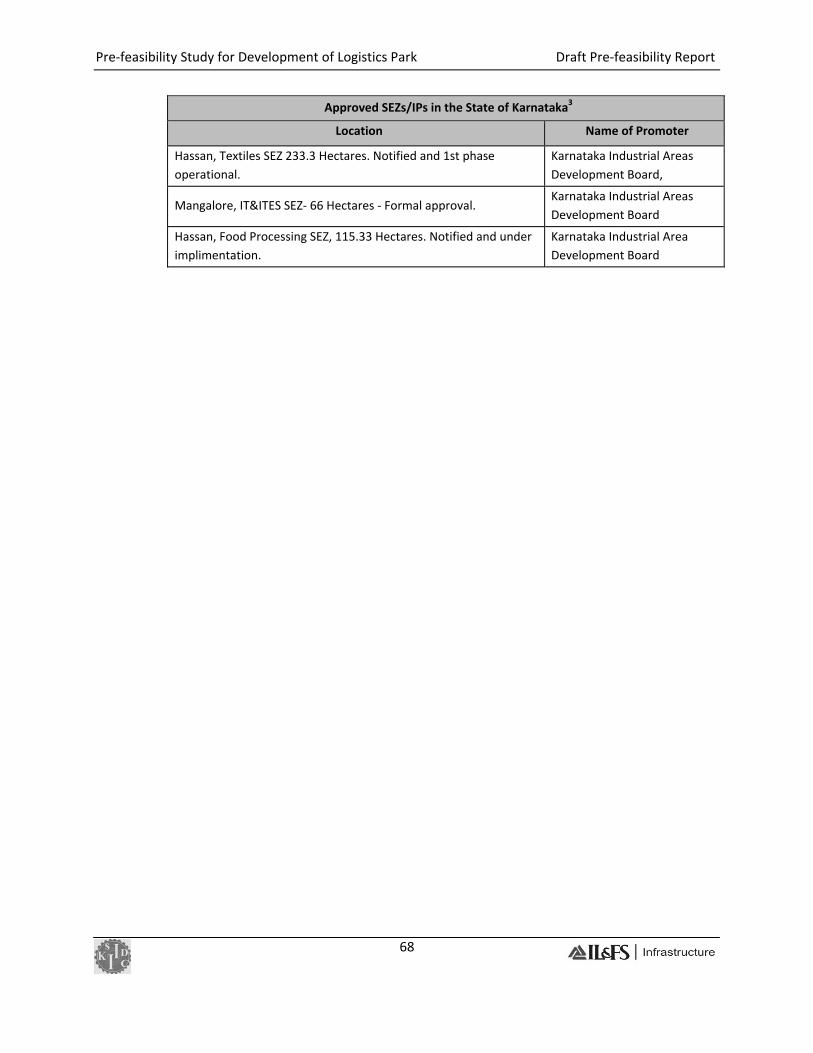
Pre‐feasibility Study for Development of Logistics Park Draft Pre‐feasibility Report
68
Approved SEZs/IPs in the State of Karnataka3
Location Name of Promoter
Hassan, Textiles SEZ 233.3 Hectares. Notified and 1st phase operational.
Karnataka Industrial Areas Development Board,
Mangalore, IT&ITES SEZ‐ 66 Hectares ‐ Formal approval. Karnataka Industrial Areas Development Board
Hassan, Food Processing SEZ, 115.33 Hectares. Notified and under implimentation.
Karnataka Industrial Area Development Board

Pre‐feasibility Study for Development of Logistics Park Draft Pre‐feasibility Report
69
6 SUPPLY SCENARIO
6.1 Major Existing Logistics Facilities in Bangalore (Select)
6.1.1 Truck Terminals a) D. Devaraj Urs Truck Terminal at Yeshwantpur
i. The Truck Terminal was developed by the D. Devaraj Urs Truck Terminals Ltd (DDUTTL), a Government of Karnataka undertaking, and was completed in 1995.
ii. It is spread over an area of 43 acres. Totally, 500 sites have been allotted ‐ 400 to transport/ logistics companies and 100 to commercial establishments.
iii. Facilities at the Terminal include, parking for 500 trucks alongside the sites, idle parking for 300 trucks (outsourced to private operator), fuelling station, rest rooms, fire station and police outpost.
iv. The Terminal handles around 600–700 trucks per day, over & above the 500 small vehicles using the facility for carrying the goods to the city.
Figure 31 Satellite image of the D. Devaraj Urs Truck Terminal, Yeswantpur
b) Other planned terminals
i. To cater to the trucks that enter Bangalore every day, DDUTTL is also planning to develop 6 more truck terminals along the arterial roads (including NH) radiating from Bangalore.

Pre‐feasibility Study for Development of Logistics Park Draft Pre‐feasibility Report
70
ii. The Bangalore Development Authority (BDA) is in the process of acquiring 61 acres land for 4 of these planned terminals. These include 9 acres at Kogilu, Yelahanka (Bellary Road/ NH‐7), about 20 acres along Old Madras Road, about 16 acres at Kudregere, Nelamangala and 16.25 acres along Hosur Road (NH‐7). The projects are proposed to be implemented through PPP after BDA hands over land to DDUTTL.
6.1.2 Railway Goods Terminals a) Satellite Goods Terminal at Whitefield
i. The terminal, developed by Indian Railways, was completed in 2002 at a construction cost of Rs. 25 crores.
ii. Warehousing at the terminal is managed by the Central Railside Warehouse Company Ltd. (CRWC), a subsidiary of Central Warehousing Corporation (CWC). CRWC has taken the land on nominal lease from Indian Railways, along with revenue sharing of 5% p.a.
iii. The total warehousing space is 6 acres (2.6 lakhs sq. ft.) with storage capacity of over 30,000 tons. The warehouses have a height of 7‐8 m with adequate ventilation. The normal occupancy of the warehouses is 70%.
iv. Goods handled at the terminal include: • Cement:
This constitutes 90% of the total goods handled at the terminal. Around 7,500 tons of cement arrives at the terminal everyday by 3 rakes of 2,500 tons each from the ACC Ltd. plants at Wadi. 70% orders are vacated immediately to construction sites or other warehouses, while 30% is stored at the CRWC warehouses at the terminal.
• Others: These include wheat (10 rakes per month), salt (from ITC), baby food powder, fertilizers, garments (arriving by parcel trains), etc.
Figure 32 Satellite image of the Satellite Goods Terminal, Whitefield
b) SAIL & Tata Steel Rail Terminal & Warehouses at Channasandra
c) Byapannahalli Goods Shed

Pre‐feasibility Study for Development of Logistics Park Draft Pre‐feasibility Report
71
6.1.3 Inland Container Depot (ICD)/ Domestic Rail Hub (DRH)
a) ICD/ DRH at Whitefield
i. The ICD/DRH, commissioned in 1993, was developed and is managed by the Container Corporation of India Ltd. (CONCOR).
ii. The ICD handles Export cargo of 3,000 TEUs per month and Import cargo of 2,400 TEUs per month. The out‐bound goods handled include granite, grinding stone, coffee, auto parts, machinery, UPS, garments, etc. and In‐bound goods handled include paper, stationary, marbles, electronic items, etc.
iii. CONCOR operates the following Rail Services: • EXIM Services to Chennai Port (daily) and Cochin Port (weekly) • Domestic Services to Tughlakabad, Delhi (Thrice a week) and Shalimar, Kolkata
(Twice a month)
Figure 33 Satellite Image of the Concor ICD Whitefield
iv. The total area of the facility is 125 acres, of which the paved area is 35.3 acres (15,39,239 Sq. ft.). The facilities include:

Pre‐feasibility Study for Development of Logistics Park Draft Pre‐feasibility Report
72
• Warehousing for Export (28,255.26 Sq. ft.), Import (18,836.84 Sq. ft.), Bonded (2,33,038.7 Sq. ft.) & Domestic (39,826.47 Sq. ft.)
• Rail Sidings (2 for EXIM and 1 Domestic ‐ 45 Wagons each) • Dedicated rakes for EXIM & Domestic services Equipments like Reach Stackers, Sling Cranes (10 Tons), Fork Lifts, Cargo Trolleys, Trucks, Inter‐carting Trailers, Electronic weighing Scales & Electronic Weigh Bridge.
b) Pearl Harbour Container Terminal (PHCT) at Whitefield
i. The terminal is managed by Pearl Harbour Ports & Warehousing (P) Ltd., a partnership between Central Warehousing Corporation (CWC) and Friends & Friends Shipping Pvt. Ltd., Gandhidham.
ii. It has an area of 15 acres with closed warehousing for 27,000 tons, comprising bonded, import & export cargo.
iii. The terminal caters to 4 gateway ports of J.N. Port, Chennai, Tuticorin & Cochin and all containers are moved by road.
Figure 34 Satellite image of the Pearl Harbour Container Terminal, Whitefield

Pre‐feasibility Study for Development of Logistics Park Draft Pre‐feasibility Report
73
c) Container Rail Terminals (CRT)
The following Container Rail Terminals or CRTs (en route terminals where container train collects and dispatches containers) are operational in the vicinity of Bangalore City and cater to the needs of the city:
i. Byappanahalli Goods Shed
ii. Satellite Goods Terminal, Whitefield
iii. Hosur (Tamil Nadu)
6.1.4 Air Cargo Centre
a) Air India ‐ SATS Air Cargo Centre at BIA
i. The plot area of the facility is 7.4 acres (322917.3 sq. ft.), with Warehouse of 1,93,750.4 sq. ft. (in 2 levels), Office Area of 21,527.82 sq. ft. and Design Capacity of 1,50,000 TPA.
ii. It is equipped with latest Material Handling System (MHS) to handle general, perishable and specialized cargo, including courier & mail.
b) Menzies Aviation Bobba (Bangalore) Pvt. Ltd. (MABB) Air Cargo Centre at BIA
i. The plot area of the facility is 7.3 acres (3,17,989.3 sq. ft.), with International Warehouse of (1,07,000 Sq. ft.) & Domestic Warehouse of (49,000 Sq. ft.) in 4 levels and Office Area of 21,527.82 sq. ft.
ii. It has a Design Capacity of 1,50,000 TPA in Phase‐1, 1,90,000 TPA in Phase‐2 & 2,80,000 TPA in Phase‐3.
iii. The facility is equipped with Lift & Run System for Unit Load Device (ULD) movement.
6.1.5 Retail Warehousing
Several large Retail/ FMCG players have set‐up their logistics hubs in & around Bangalore. These include: Pantaloon Retail (Future Group) at Hoskote & Nelamangala,

Pre‐feasibility Study for Development of Logistics Park Draft Pre‐feasibility Report
74
Reliance Retail at Nelamangala & Dobbaspet (proposed), Lifestyle at 6 different locations around the city and Hindustan Unilever Ltd. (HUL) at Nelamangala.
a) Pantaloon Retail (Future Group) Warehouses at Hoskote & Nelamangala
Pantaloon Retail (Future Group) is one of the largest players in the organized retail sector in the country. The logistics functions are managed by Future Logistics, a group company set‐up for the purpose.
i. Hoskote Warehouses:
Two warehouses have been taken on long term lease from M/s Kaveri Logistics @ Rs. 10 per sq. ft. per month.
The warehouses cater to apparel & general items (2,00,000 sq. ft.) and furniture (45,000 sq.ft.), respectively
The facilities provided by the developer include: − Truck parking/ docking area and stacking area for 60 TEUs. − Kirby‐type Box structure with 5 m clear height, curved Galvilium sheet roofing,
and dock doors for loading/ unloading The facilities added by Future Logistics include: − Zones for every item
− Racks (upto 4 levels, excluding floor) − Shelves (Shelving area constitutes 40‐50% of total area in case of apparel and
30% of total area in case of general)
− Material Handling Equipment (MHE) and pallets for movement of goods
− Installation of Warehouse Management Service (WMS) Inventory Management:
− Future Logistics maintains 20 days of inventory at the warehouses and 10 days inventory at the retail store for the Big Bazaar format
− The Inventory Carrying Costs constitutes 1.5% ‐ 7% of the total cost
ii. Nelamangala Warehouses: Two warehouses of 30,000 sq. ft. each to cater to food and consumer durables/ electronics, respectively.
iii. The total existing warehousing in Bangalore is 3,05,000 sq. ft. and the total no. of employees is 540.

Pre‐feasibility Study for Development of Logistics Park Draft Pre‐feasibility Report
75
iv. Future Logistics is in the process of developing another modern facility in Bangalore spread over a total land area of 34 acres, with 3 lakhs sq. ft. warehousing on 6.5 acres land in Phase 1, with potential for adding another 4.5 lakhs sq. ft. Modern handling systems, clear height of 13 m and efficient Traffic Management have been planned at the facility.
6.1.6 Logistics Parks
Several Logistics companies are in the process of setting up Logistics Parks in and around Bangalore. These, inter alia, include:
a) Safexpress
Safexpress Pvt. Ltd. is one of the leading logistics companies of the country. Its Bangalore facility (Safexpress Cargo Complex) is located on the Sarjapur‐Hoskote Road (NH 207) at Koralur, Nandavathi with total area of 33.5 acres. Operations commenced in February 2006. The facility includes:
• Hub Operations (Loading/ Unloading for Express Cargo) in 6.5 acres, comprising 60% open/ truck parking space and 1,25,000 sq.ft. built‐up area (BUA) for the operations
• Warehousing in 27 acres, comprising 45% open/ truck parking space and 5,00,000 sq.ft. warehouses.
Pharma products, Apparels, Electrical & Electronics and IT–High tech electronics comprise 70% of the products handled by the facility. The company did not handle the movement of commodities.
Figure 35 Safexpress Facility – Docks (Numbered & Leveled)

Pre‐feasibility Study for Development of Logistics Park Draft Pre‐feasibility Report
76
Figure 36 Safexpress Facility – Hub operations
The company did not have any immediate expansion plans as the present capacity was planned to cater to the current requirements. However, the company had already acquired 40 acres of land at Hoskote (near the Volvo factory) for future expansion.
Safexpress also plans to develop 32 Logistics Parks consisting of 6 million sq. ft. of additional warehousing space across the country (including Bangalore, Nagpur, Ahmedabad, Chennai & Kolkata) in the next couple of years. The total investment on these 32 Logistics Parks has been estimated at Rs. 600 crores.
b) DRS Logistics
DRS Logistics Private Limited has proposed setting up a total of 2‐million sq.ft. warehousing space at Hosur (near Bangalore) and Sriperembudur in Tamil Nadu and Hyderabad in Andhra Pradesh by the end of the next financial year (2010‐11) as part of a Rs 450‐crore expansion in south India.
DRS proposes to float a special purpose vehicle (SPV) – DRS Warehousing South Private Limited – in which the prospective PE investor will hold 50 per cent while DRS will invest the rest by way of land. The company has already acquired 72 acres, of the required 100 acres for the expansion.
The proposed warehousing facilities in south India will primarily cater to the retail industry, offering both rental and 3PL services.

Pre‐feasibility Study for Development of Logistics Park Draft Pre‐feasibility Report
77
7 PROJECT LOCATION
7.1 Emerging Logistics Hubs in and around Bangalore
a) The map below shows the emerging logistics/ warehousing hubs in & around Bangalore:
Bengaluru International Airport
(BIA)
Whitefield-Hoskote
Electronics City-Bommasandra
Peenya-Nelamangala
BIA-Devanahalli
Figure 37 Emerging Logistics Hubs in and around Bangalore
b) Salient features of these locations include: i. Whitefield‐Hoskote region
Location & Connectivity: − The region is served by the NH‐4 (towards Chennai) and the Bangalore‐
Chennai main railway line.
− The Outer Ring Road or ORR (via K.R. Puram) provides road connectivity to other highways as well as other areas of Bangalore city.
Industries: − Several industries are located in the region, besides IT & ITES units.

Pre‐feasibility Study for Development of Logistics Park Draft Pre‐feasibility Report
78
Logistics & Warehousing:
− It is an established logistics & warehousing location, with presence of the CONCOR ICD/ DRH, Pearl Harbour Container Terminal, Indian Railways Satellite Goods Station (with CRWC warehousing), retail warehouses, etc.
ii. Electronics City‐Bommasandra region
Location & Connectivity: − The region is served by the NH‐7 (towards Hosur/ Krishnagiri/ Chennai/
Salem and part of both the Golden Quadrilateral & North‐South Corridor of NHAI) and the Bangalore‐Salem railway line.
− The ORR (via Silk Board Junction) provides road connectivity to other highways as well as other areas of Bangalore city.
− The upcoming Electronics City elevated highway and proposed Metro line (Phase II) would further improve its connectivity to the city.
Industries: − It is an important industrial region with several units located within
Electronics City, Bommasandra Industrial Area, Jigani Industrial Area and SIPCOT, Hosur (Tamil Nadu).
Logistics & Warehousing:
− It is an important warehousing location.
iii. Peenya‐Nelamangala region Location & Connectivity: − The region is served by the NH‐4 (towards Tumkur/ Hubli and part of the
Golden Quadrilateral of NHAI) and the Bangalore‐Hubli main railway line.
− The ORR (via Peenya) provides road connectivity to other highways as well as other areas of Bangalore city.
− The upcoming elevated highway and Metro line would further improve connectivity to the city
Industries: − It is a major industrial region with several units located within Yeswantpur
Industrial Area, Peenya Industrial Area, Nelamangala & Dobbaspet. Logistics & Warehousing:
− It is also an established logistics & warehousing location, with presence of the D. Devaraj Urs Truck Terminal and several industrial & retail warehouses.

Pre‐feasibility Study for Development of Logistics Park Draft Pre‐feasibility Report
79
iv. BIA‐Devanahalli region Location & Connectivity: − The Bengaluru International Airport (BIA) provides good domestic &
international air connectivity for both passenger & freight
− The region is served by the NH‐7 (towards Ananthapur/ Hyderabad and part of the North‐South Corridor of NHAI) and the Yelahanka‐Chikaballapur‐Kolar railway line.
− The proposed Chikaballapur‐Puttaparthi (SSP Nilayam) railway line would provide direct rail connectivity to north Karnataka & Hyderabad.
− The ORR (via Hebbal) provides road connectivity to other highways as well as other areas of Bangalore city.
− The proposed elevated highway between Hebbal & Yelahanka and the proposed High Speed Rail Link (HSRL) to BIA will further improve connectivity to the city.
Industries: − Currently, only few industries are located in the area.
− Several major projects have been proposed in the region, including the BIA Airport City, Devanahalli Business Park (DBP), the Hardware Technology Park and the Bangalore‐Devanahalli IT Investment Region (ITIR).
− The Apparel Park (Phase I & upcoming Phase II) and the Integrated Textile Park at Doddaballapur are also located in proximity.
Logistics & Warehousing:
− It is an emerging logistics & warehousing location, with the presence of BIA being a major advantage.
c) A brief comparison of the emerging logistics/ warehousing hubs in & around Bangalore is given below:
Table 23 Comparison of the Emerging Logistics / Warehousing hubs in & around Bangalore
Particulars Electronics City‐
Bommasandra
Peenya‐Nelamangala
Whitefield‐Hosakote
BIA‐Devanahalli
Proximity to BIA √
Proximity to railway line √ √ √ √
Proximity to NH/ ORR √ √ √ √
Distance from city centre 20‐25 km 15‐20 km 15‐20 km 30‐35 km

Pre‐feasibility Study for Development of Logistics Park Draft Pre‐feasibility Report
80
7.2 Preferred Project Location
a) Based on the salient features and comparison of the emerging logistics/ warehousing hubs in & around Bangalore (given in 7.1 above), the BIA‐Devanahalli region has, prima facie, emerged as the preferred location for the proposed project. The area falls under the Bangalore International Airport Area Planning Authority or BIAAPA jurisdiction.
b) As mentioned earlier, the biggest advantage of the location is the presence of BIA, which would facilitate express and air cargo movement.
c) Besides retail, industrial & agricultural warehousing for Bangalore city & the surrounding region, the Logistics Park would also serve the Apparel Park & Integrated Textile Park at Doddaballapur, proposed projects like BIA Airport City, Devanahalli Business Park, Hardware Technology Park & ITIR and other developments in the region.
d) The map below shows the location of BIAAPA with respect to Bangalore city.
Figure 38 Location of BIAAPA
40 km
Doddaballapur
Bangalore North Taluk
BIAAPA Area
Bangalore
Bengaluru International Airport
Devanahalli Business Park

Pre‐feasibility Study for Development of Logistics Park Draft Pre‐feasibility Report
81
e) The map below depicts the immediate surroundings of BIA & Devanahalli town.
Figure 39 Location of Bangalore International Airport (BIA) & Devanahalli town

Pre‐feasibility Study for Development of Logistics Park Draft Pre‐feasibility Report
82
8 PROPOSED DEVELOPMENT
8.1 Suggestions on Site Requirements
a) Area requirements:
i. As mentioned in 5.2.4 d), there is a demand for organized truck handling facility of at least 21 acres area along the Bellary Road (NH‐7).
ii. As mentioned in 5.2.3 f) i, it is estimated there is a railside warehousing requirement of at least 2,30,000 sq. ft. (~5 acres) for cement alone. Other bulk commodities like wheat, fertilizers, salt, etc. would require around 0.5‐1 acre area. The rail siding would require another 1.5 acres area.
iii. The Logistics Park would also serve the existing and proposed developments in the region, as mentioned in 7.2 c), and would require an ICD/ DRH to serve the logistics needs of the region. Based on case studies, an ICD would require at least 10 acres land, including container stacking area & warehousing, while the rail siding would require another 1.5 acres area.
iv. Proximity to BIA necessitates the inclusion of an Air Cargo Centre in the Logistics Park to supplement the existing facilities at airport and the proposed Mysore Sales International Ltd. (MSIL) facility in the DBP. The Air Cargo centre may be a relatively smaller facility to cater to the demands of the proposed developments in the region as well as overflow from the above mentioned facilities. Based on the case studies of the existing facilities, it is estimated that an area of 2‐3 acres may be required for the proposed Air Cargo Centre.
v. As mentioned in 5.2.3 a), it is, prima facie, estimated that at least 10,00,000 sq. ft. of warehousing space may be required in Bangalore by the large retail players in the near future and 30,00,000 – 50,00,000 sq. ft. in the next 5‐10 years. Assuming 50% ground coverage, the site requirement would be at least 50 acres (~21,78,000 sq. ft.) in the near future and 100‐150 acres (~43,46,000 – 65,34,000 sq. ft.) in the next 5‐10 years. The above requirements do not include unorganized retail, which constitutes over 90% of the total retail market. Hence, the actual retail warehousing requirements are much higher.

Pre‐feasibility Study for Development of Logistics Park Draft Pre‐feasibility Report
83
vi. Based on i‐v, there is potential for logistics/ warehousing facility of at least 80 acres in the near future and 140‐180 acres in the next 5‐10 years in the Devanahalli area. However, at a conservative estimate, a facility of 150 acres area may be considered at the proposed location.
b) In order to facilitate multi‐modal transportation and minimize the land acquisition/
R&R requirements for providing last mile road/ rail connectivity, the site should either be located along or in close proximity to both NH‐7 & Yelahanka‐Chikaballapur‐Kolar Railway Line.
c) Other site requirements would, inter alia, include: Adequate water & power supply Relatively flat terrain to minimize land development costs Relatively regular shape of plot to optimize warehousing/ logistics facilities Access to public transport for the employees working at the park
8.2 Suggestions on Project Phasing
Based on 8.1 a) v, a facility of 150 acres may be considered at the suggested location. However, the near‐term future demand is around 80 acres and potential demand over the next 5‐10 years is estimated as 140‐180 acres. Thus, the following phasing of development is suggested:
Table 24 Suggested area for different phases of development
Phases Area
Phase‐I 50 acres
Phase‐II (Yr 5) 50 acres
Phase‐III (Yr 10) 50 acres
Total 150 acres

Pre‐feasibility Study for Development of Logistics Park Draft Pre‐feasibility Report
84
8.3 Suggestions on Product Mix Based on the assessment of the factors mentioned in section 8.1, the following Product Mix is suggested within the proposed Logistics Park.
a) Multi‐modal/ Integrated Logistics Transport Centre
Road: Truck Terminal, including Agent Offices & Driver Facilities/ Dormitories
Rail: Rail sidings (for bulk/ parcel rakes and container trains)
b) Bulk Warehousing
Rail side warehousing for bulk goods
Offices for Agents
c) Inland Container Depot (ICD)/ Domestic Rail Head (DRH)
Container stacking area
Customs Bonded/ Domestic Warehousing, including cold storage
Offices for Customs & Agents
d) Air cargo centre
Stuffing/ de‐stuffing area
Customs Bonded/ Domestic Warehousing, including cold storage
Offices for Customs & Agents
e) Other Warehousing:
General Warehousing, including Agent Offices
Customized Warehousing (e.g. Retail Distribution), including Agent/ Client Offices
Cold Storage, including Agent Offices
Hub Operations (Loading/ Unloading for Express Cargo)

Pre‐feasibility Study for Development of Logistics Park Draft Pre‐feasibility Report
85
f) Other Common Facilities:
Administration & other offices
Restaurants, rest rooms, etc.
Utilities (Power Back‐up, T&D Network, IT & Telecom Infrastructure, Water Supply & Sewerage System, etc.)
Green Area
The above facilities include most facilities that can be planned within a typical logistics park, considering the modes of transportation available in the project location and the range of services that can be accommodated as per the Logistics Value Chain.
8.4 Broad Land utilization and facilities The proposed land utilization pattern for Phase I is described briefly as follows:
Table 25 Broad Land Utilization and Facilities
Land Use
Area
(in Acres) In Sq. ft. %
Covered warehouse 25 10,89,004.0 50%
Container Stacking Area & Truck Parking Area
7.50 3,26,701.3 15%
Road (2.2 km), Railway Siding (2 km) & Circulation
12.5 544502.2 25%
Green areas & Other Support Infrastructure
5.0 217800.9 10%
Total 50 21,78,009.0 100%

Pre‐feasibility Study for Development of Logistics Park Draft Pre‐feasibility Report
86
9 PRELIMINARY PROJECT FINANCIALS A preliminary financial model has been prepared to assess the Estimated Project Cost, Estimated Revenues and the Project Returns. The Cost and Revenue assumptions were taken based on gross bulk estimate only to assess the feasibility of the project. However, it is recommended that the Project Financials may be firmed up only after preparation of the DPR for the project. The Preliminary Financial Model is given in Annexure 2. The salient features of the preliminary financial model are highlighted in this section of the report.
9.1 Assumptions The assumptions are made under two heads the Cost and the Revenue.
9.1.1 Cost Assumptions The following are some of the base cost assumptions made in the preliminary financial model to work out the Estimated Project Cost. These are the cost assumptions made for Phase‐I development.
Table 26 Cost Assumptions
Assumptions Amount Unit
Development Cost for Built‐up Area of Office Space & Warehouses
1,000 INR / sq.ft.
Development Cost for Container Stacking Area
30 INR / sq.ft.
Development Cost for the Internal Road Network
3,00,00,000 INR / KM
Development Cost for the Rail Network
7,00,00,000 INR / KM
Development Cost for Truck Parking Spaces
398 INR / sq.ft.
Cost of Power Back‐up 4,00,00,000 INR / MW
Cost of Transmission & Distribution Network – Power
4,00,00,000 INR / MW
Development of Telecom Infrastructure
3,50,000 INR / KM
Water Supply Infrastructure 2,25,00,000 INR / MLD
Sewerage Treatment 1,27,00,000 INR / MLD

Pre‐feasibility Study for Development of Logistics Park Draft Pre‐feasibility Report
87
The cost assumptions for Phase‐II and Phase‐III are made based on a Capex Inflation of 7% p.a.
9.1.2 Revenue Assumptions The following are some of the base revenue assumptions made in the preliminary financial model to work out the Estimated Revenues. These are the revenue assumptions made for Phase‐I development.
Table 27 Revenue Assumptions
Assumptions Amount Unit
Warehouse Rentals 25.00 INR / sq.ft. / month
Container Stacking Area Rentals (Calculations given in Financial Model)
9.61 INR / sq.ft. / month
Truck Parking Spaces Rentals (Calculations given in Financial Model)
3.75 INR / sq.ft. / month
Water Supply Charges 5.00 INR / KL
Sewerage Treatment Charges 5.00 INR / KL
The revenue assumptions for Phase‐II and Phase‐III are taken by inflating the above figures by certain percentages. Warehouse Rentals form the major portion of the revenue component. The Rental Inflation is taken as 5% p.a.
The Occupancy of the different facilities in Phase‐I over the years is taken as follows:
Table 28 Occupancy for Phase‐I facilities
Facility ‐ Phase‐I Year 1 Year 2 Year 3 Year 4 Year 5 to Year 30
Warehouses Construction 75% 75% 85% 95% Container Stacking Area
Construction75% 75% 85% 85%
Truck Parking Area Construction 60% 75% 75% 75% In Phase‐II and Phase‐III the occupancy is taken in a similar way. The Phase‐II construction starts in the Year 5 and the Phase‐III construction starts in the Year 10.

Pre‐feasibility Study for Development of Logistics Park Draft Pre‐feasibility Report
88
9.2 Estimated Project Cost
9.2.1 Phase I The detailed print out of the preliminary financial model, prepared for assessing the financial viability of the project, is enclosed with this report. The figures, calculated to arrive at the Estimated Project Cost for Phase‐I are listed below:
Table 29 Estimated Project Cost – Phase‐I
Capital Expenditure Amount (Rs. Lakh)
Warehouses & Offices 10,890
Container Stacking Area 65
Roads 664
Rail Siding 1400
Truck Parking Spaces 434
Basic Amenities 109
Power Backup 200
T&D Network 200
Telecom Infrastructure 7
Water Supply 68
Sewerage Systems 29
Contingencies 703
Interest During Construction
704
Total Capital Cost 15,473
The Interest to be paid during construction to service the debt component is capitalised. Project Contingency of 5% has been assumed in the Project Cost.
9.2.2 PhaseII & PhaseIII Estimated Project Cost for Phase‐II and Phase‐III is calculated by taking a Capex Inflation of 7% p.a., over the cost assumptions made for Phase‐I development. The Project Costs for Phase‐II and Phase‐III are as below:
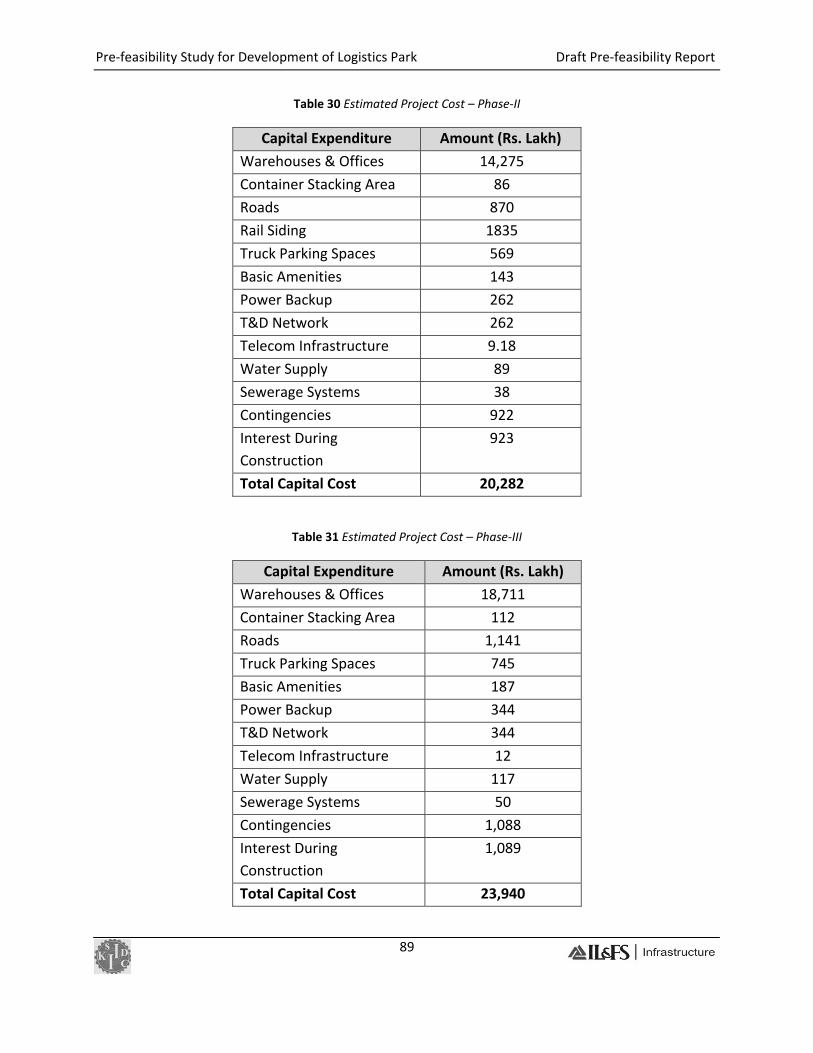
Pre‐feasibility Study for Development of Logistics Park Draft Pre‐feasibility Report
89
Table 30 Estimated Project Cost – Phase‐II
Capital Expenditure Amount (Rs. Lakh)
Warehouses & Offices 14,275
Container Stacking Area 86
Roads 870
Rail Siding 1835
Truck Parking Spaces 569
Basic Amenities 143
Power Backup 262
T&D Network 262
Telecom Infrastructure 9.18
Water Supply 89
Sewerage Systems 38
Contingencies 922
Interest During Construction
923
Total Capital Cost 20,282
Table 31 Estimated Project Cost – Phase‐III
Capital Expenditure Amount (Rs. Lakh)
Warehouses & Offices 18,711
Container Stacking Area 112
Roads 1,141
Truck Parking Spaces 745
Basic Amenities 187
Power Backup 344
T&D Network 344
Telecom Infrastructure 12
Water Supply 117
Sewerage Systems 50
Contingencies 1,088
Interest During Construction
1,089
Total Capital Cost 23,940

Pre‐feasibility Study for Development of Logistics Park Draft Pre‐feasibility Report
90
9.3 Estimated Revenues The Project Revenues are calculated on the basis of the base revenue assumptions made earlier. The following table shows the Project Revenues in the first year of operation of the Phase‐I development.
Table 32 Project Revenues in the first year of operation – Phase‐I
Revenues Amount (Rs. Lakh)
Warehouse Rentals 1,470
Container Stacking Rentals 188
Truck Parking Rentals 29
Basic Amenities Rentals 1
Water Supply Charges 5
Sewerage Treatment Charges 4
Total Revenues 1,698
The Project Revenues for the successive years of operation till 30 years are calculated considering a revenue inflation of 5%.
The Project Revenues for the Phase‐II and Phase‐III development are as follows:
Table 33 Project Revenues in the first year of operation – Phase‐II
Revenues Amount (Rs. Lakh)
Warehouse Rentals 1,786.98
Container Stacking Rentals 229.07
Truck Parking Rentals 35.74
Basic Amenities Rentals 1.49
Water Supply Charges 6.51
Sewerage Treatment Charges 5.54
Total Revenues 2,065.32
The Project Revenues for the successive years of operation till 30 years are calculated considering a revenue inflation of 5%.
Table 34 Project Revenues in the first year of operation – Phase‐III
Revenues Amount (Rs. Lakh)
Warehouse Rentals 2,172
Container Stacking Rentals 278
Truck Parking Rentals 43

Pre‐feasibility Study for Development of Logistics Park Draft Pre‐feasibility Report
91
Revenues Amount (Rs. Lakh)
Basic Amenities Rentals 2
Water Supply Charges 9
Sewerage Treatment Charges 7
Total Revenues 2,512
The Project Revenues for the successive years of operation till 30 years are calculated considering a revenue inflation of 5%.
9.4 Project Returns The Debt : Equity Ratio is taken as 70 : 30. The Loan repayment period is 7 years and the Loan Moratorium on Repayment is one year i.e. the first year of the construction.
The Project Returns are assessed by calculating the Project Internal Rate of Return (PIRR) and Equity Internal Rate of Return (EIRR).
The Project Returns are calculated after considering the following expenditure:
• Annual Operation & Maintenance cost of the common infrastructure facilities @ 3% of the capex.
• Renovation Expenditure for the Common Infrastructure facilities once in every five years @ 10% of the capex.
• Interest to service the debt @ 13% per annum.
• Depreciation of assets @ 3.50% per annum.
• Income Tax @ 22.66% per annum.
The following are the Estimated Project Returns as per the preliminary financial model:
Table 35 Estimated Project Returns
Development Project IRR Equity IRR
Phase‐I 16.63% 15.81%
Phase‐II 15.46% 14.43%
Phase‐III 16.29% 15.36%

Pre‐feasibility Study for Development of Logistics Park Draft Pre‐feasibility Report
92
10 SUGGESTED PROJECT STRUCTURE & PROJECT BENEFITS
10.1 Suggested Project Structure
a) It is suggested that the project be structured on Public Private Partnership (PPP) Basis, with an operator selector through a competitive bidding process. The operator for Phase‐I may be given the option of First Right of Refusal for Phase‐II and similarly for the subsequent Phase/s.
b) It is also suggested that KSIIDC/ GoK provide the requisite land (50 acres in each Phase and 150 acres totally) in lieu of 26% equity in the Project SPV/s.
c) Thus, KSIIDC/ GoK equity of 26% would be worth around Rs. 12.07 Crores in Phase‐1 and around Rs. 15.82 Crores & Rs. 18.67 Crores in Phases 2 & 3.
10.2 Project Benefits
a) The development of the Logistics Park is expected to augment the logistics infrastructure in Bangalore.
b) The Logistics Park is expected to boost the development of the surrounding area and each Phase is expected to generate a direct employment of around 3200.
c) Based on the Preliminary Project Financials, the NPV of GoK Returns are estimated to be Rs.18.82 Crores for Phase‐1, Rs. 18.66 Crores for Phase‐2 and Rs. 27.00 Crores for Phase‐3.
Equity Returns
(Equity IRR: 15.81%)
DeveloperKSIIDC/ GoKDevelopment on PPP Basis
Through Transparent Competitive Bidding Process
50 acres land in lieu of 26% Equity
Direct Employment Generation: ~3,200
NPV of GoK Returns: Rs. 18.82 Cr Figure 40 Project Structure for Phase‐1 Development

Pre‐feasibility Study for Development of Logistics Park Draft Pre‐feasibility Report
93
11 CONCLUSIONS AND RECOMMENDATIONS
11.1 Summary of Findings
a) Based on the Preliminary Assessment of the Demand Drivers & Supply Scenario, there is, prima facie, need for development of a Logistics Park near Bangalore.
b) It is suggested to locate the Logistics Park in the emerging logistics hub of BIA‐
Devanahalli (BIAAPA Jurisdiction) along or in close proximity to NH‐7 & the Yelahanka‐Chikabalapur‐Kolar railway line.
c) It is suggested to take up 50 acres (10,89,000 sq. ft. built‐up area) in Phase 1, followed by additional 50 acres each in Phases 2 & 3, with an overall development of 150 acres. However, the same may need to be firmed up vide a Detailed Demand Assessment as part of the Detailed Project Report (DPR).
d) The Suggested Product Mix includes Multi‐modal/ Integrated Transport Logistics Centre (including Truck Terminal & Rail sidings), Inland Container Depot (ICD)/ Domestic Rail Head (DRH), Air cargo centre, Bulk Warehousing, Retail & other Warehousing and Other Common Facilities.
e) As per the Preliminary Financial Assessment, the Estimated Project Cost is Rs. 154.73 Crores for Phase‐1, Rs. 202.82 Crores for Phase‐2 and Rs. 239.40 Crores for Phase‐3. The Revenue Streams have been assumed based on select industry benchmarks. Accordingly, the Project Returns (Equity IRR of 15.81% for Phase‐1, 14.43% for Phase‐2 and 15.36% for Phase‐3) have been calculated. However, the estimates may need to be confirmed based on the DPR.
f) It is suggested that the project be structured on PPP Basis, with an operator selector through a competitive bidding process, and KSIIDC/ GoK provide the land in lieu of 26% equity. The NPV of GoK Returns are estimated to be Rs. 18.82 Crores for Phase‐1, Rs. 18.66 Crores for Phase‐2 and Rs. 27.00 Crores for Phase‐3.
g) The development of the Logistics Park is expected to augment the logistics infrastructure in Bangalore, boost development of the surrounding area and generate a direct employment of around 3200 in each phase.

Pre‐feasibility Study for Development of Logistics Park Draft Pre‐feasibility Report
94
11.2 Risk Allocation and Mitigation Appropriate risk mitigation structures would have to be evolved for the Project. Various risks associated with the Project and broad mitigation structure is explained below:
a) Traffic Risk This includes risk arising out of shortfall in projected cargo traffic volumes. This can be mitigated by the port operator by:
i. Positioning the tariffs/ rentals competitively compared to other Logistics Parks/ Warehouses/ ICDs/ DRHs/ Truck Terminals, etc in Bangalore.
ii. Taking effective steps for marketing the location & services amongst the target users (e.g. 3PL operators, logistics companies, retail chains, container train operators, truck operators, etc.).
iii. Entering into long term arrangements with captive users.
b) Logistics Risk This includes risk arising out of non‐completion of the last‐mile road/ rail connectivity. This can be mitigated by GoK by pursuing the matter with NHAI/ Ministry of Railways, if required.
c) Land Acquisition Risk This includes risk arising out of land acquisition, R&R, etc, if required. This can be mitigated by the developer offering a fair compensation and rehabilitation package to the land owners.
d) Statutory Risk
This includes risk arising out of non‐issue of statutory permissions, environmental clearances, etc. This can be mitigated by GoK taking steps to grant or facilitate all necessary clearances related to the project.
e) Development Risk
This includes risk arising out of site and construction related issues like soil conditions, materials used, quality & type of construction, etc. This can be mitigated by the developer taking all factors into account while preparing the DPR.

Pre‐feasibility Study for Development of Logistics Park Draft Pre‐feasibility Report
95
f) Financial Risk KIPDC has taken conservative assumptions in Preliminary Project Financials in terms of construction costs and estimates of revenues, which mitigates the downside risks of the Project.
g) Political Risk: These can be mitigated by effective legal documentation and insurance.
11.3 Recommendations on Way Forward
a) GoK may appoint KIPDC as Project Development and Transaction advisor for comprehensive development of the project and bidding out the project through a transparent and competitive bidding process.
b) On award of the Project development and Bid process management assignment to KIPDC, it is estimated to take around 14‐18 months to complete the project development activities and in bidding out the project after conducting requisite studies, preparation of DPR, obtaining mandatory approvals, project structuring, bid documentation and bid process management.
c) Based on the DPR, GoK may take steps for acquiring the requisite land, if required.