pre-feasibility studykissanlink.com/images/documents/olive processing unit... · 2018-04-07 ·...
TRANSCRIPT

Pre-Feasibility Study
Olive Oil Extraction Units
March 2017

Pre-Feasibility Study Olive Oil Extraction Units
February 2017 2
Table of Contents
1 DISCLAIMER .......................................................................................................................................... 3
2 EXECUTIVE SUMMARY ...................................................................................................................... 4
3 INTRODUCTION ................................................................................................................................... 5
4 PURPOSE OF THE DOCUMENT ........................................................................................................ 5
5 BRIEF DESCRIPTION OF PROJECT & PRODUCT ........................................................................ 6
5.1 PROJECT DESCRIPTION ........................................................................................................................ 6 5.2 PRODUCT DESCRIPTION ....................................................................................................................... 8 5.3 INSTALLED AND OPERATIONAL CAPACITIES ................................................................................. 9 5.4 DEMAND AND SUPPLY FORECAST ................................................................................................. 10
6 PRODUCTION PROCESS FLOW ..................................................................................................... 11
7 CRITICAL FACTORS .......................................................................................................................... 13
8 GLOBAL MARKET OF OLIVE OIL .................................................................................................. 14
9 GEOGRAPHICAL POTENTIAL FOR INVESTMENT ................................................................... 16
10 POTENTIAL TARGET CUSTOMERS / MARKETS ...................................................................... 17
11 PROJECT COST SUMMARY .............................................................................................................. 17
11.1 PROJECT ECONOMICS........................................................................................................................ 17 11.2 PROJECT FINANCING .......................................................................................................................... 18 11.3 PROJECT COST ..................................................................................................................................... 18 11.4 SPACE REQUIREMENT ........................................................................................................................ 18 11.5 MACHINERY & EQUIPMENT REQUIREMENT ................................................................................ 20 11.6 FURNITURE & FIXTURES REQUIREMENT ..................................................................................... 20 11.7 OFFICE EQUIPMENT REQUIREMENT ............................................................................................. 21 11.8 OFFICE VEHICLE REQUIREMENT .................................................................................................... 21 11.9 HUMAN RESOURCE REQUIREMENT .............................................................................................. 22 11.10 UTILITIES AND OTHER COSTS ..................................................................................................... 23 11.11 REVENUE GENERATION ................................................................................................................ 23 11.12 RAW MATERIAL REQUIREMENT ................................................................................................. 24
12 USEFUL WEB LINKS .......................................................................................................................... 25
13 ANNEXURES ........................................................................................................................................ 26
13.1 INCOME STATEMENT ........................................................................................................................... 26 13.2 BALANCE SHEET ................................................................................................................................... 27 13.3 CASH FLOW STATEMENT .................................................................................................................. 28 13.4 EXPECTED YIELD OF OLIVE FRUIT (YEAR WISE) ..................................................................... 29 13.5 PROCESSING FACILITIES REQUIREMENT .................................................................................... 29 13.6 PROJECTED CAPITAL EXPENDITURE ............................................................................................ 29 13.7 PROJECTED REVENUE ....................................................................................................................... 30 13.8 PROJECTED COST OF GOODS SOLD ............................................................................................ 31
14 KEY ASSUMPTIONS ........................................................................................................................... 32
14.1 OPERATING COST ASSUMPTIONS.................................................................................................. 32 14.2 PRODUCTION COST ASSUMPTIONS .............................................................................................. 32 14.3 REVENUE ASSUMPTIONS .................................................................................................................. 33 14.4 CASH FLOW ASSUMPTIONS.............................................................................................................. 33 14.5 OLIVE TREES YIELD ............................................................................................................................ 33
15 SENSITIVITY ANALYSIS ................................................................................................................... 34
15.1 RAW MATERIAL COST SENSITIVITY ANALYSIS .......................................................................... 34 15.2 SALE PRICE SENSITIVITY ANALYSIS ............................................................................................. 37

Pre-Feasibility Study Olive Oil Extraction Units
February 2017 3
1 DISCLAIMER
This document has been prepared with the objective to provide basic information
about the subject business proposition. The content of the document has been
derived from data and information collected from various reliable secondary and
primary sources and is based on certain assumptions. While reasonable due
diligence has been carried out during information collection and working out the
presented calculations, the reader is strongly encouraged to carry out any further
scrutiny and diligence to collect any other information that may be deemed
necessary to take an informed decision. Professional advice from qualified
technical expert/consultant should preferably be sought before taking any decision
to act upon the information presented in the document. Department of Agriculture,
Government of Punjab does not assume any liability for any financial or other loss
in consequence of undertaking any activity on the basis of the information
provided in the document.

Pre-Feasibility Study Olive Oil Extraction Units
February 2017 4
2 EXECUTIVE SUMMARY
Olive Oil Extraction Units are proposed to be located in Pothohar region which is
a large plateau region in north-eastern Pakistan covering an area of 8,592 square
miles. It has been identified as suitable for olive production because of its
favorable climate and ideal topography. The proposed planting area covers 15,100
acres, where 2,038,500 olive saplings will eventually be planted under the five-
year project running till 2020.
This Pre-feasibility study has been developed keeping in view the forecast yield
from olive cultivation in future. Hence, the machinery and equipment to be
procured is also suggested as per the forecasting of the future yield. The proposed
units will extract Olive Oil from the olive fruits, and cake will be sold to local
market. The units will extract olive oil through centrifugation process of olives. The
product will be sold in 3 different packages of 0.5, 1.0 and 4.0 liter.
Each processing facility has capacity to process 200 kgs of olive fruit per hour
which will produce 40 liters of Olive Oil under ideal conditions and produce 57,600
liters of virgin oil per annum based on 60 working days (1,440 hours a season,
working three shifts per day). Total 30 facilities will be installed in next 10 years.
The proposed Olive Oil Extraction Units comprise a total investment of PKR
462,143,227 with fixed investment of PKR 459,957,8561 and working capital of
PKR 2,185,372. The Net Present Value (NPV) of the project is PKR 281,801,919
with an Internal Rate of Return (IRR) of 39% and a payback period of 6.53 years.
The project will provide employment opportunity to 20 people at the head office as
well as 3 plant operator and 3 helpers at each processing facility will be hired on
seasonal basis. Additionally, 2 guards for each processing facility will be hired on
permanent basis. Higher return on investment and a steady growth of business is
expected with the entrepreneur having some prior experience or education in the
related field of business.
1 Capital Expenditures are accumulated for next 10 years

Pre-Feasibility Study Olive Oil Extraction Units
February 2017 5
3 INTRODUCTION
With a population of over 190 million people, Pakistan is the sixth most populous
country and the 43rd largest economy in the world. In the current global economic
scene, Pakistan is being seen as the top emerging market economy in South Asia
that is progressing towards a more advanced stage through rapid growth and
industrialization. Pakistan is being classified as one of the Next Eleven (N-11)
countries that have the potential to become one of the world's large economies in
the 21st century. Economic growth of the country has been on a rise during recent
years; being 4.0% in 2014 and 4.2% in 2015. The IMF projects that the growth
trend will continue and reach 5.2% by the year 2020. The World Bank projects that
by 2018, Pakistan's economic growth will increase to 5.4% due to greater inflow of
foreign investment from China-Pakistan Economic Corridor (CPEC). The present
government is fully committed to capitalize on the emerging growth trend and is
working hard to ensure implementation of all the necessary steps in the right
direction to increase the flow of private sector investment. Strengthened
macroeconomic outlook, improved law and order situation and facilitative
government policies are contributing to improve the investment climate for foreign
and local investors.
For private sector investment to flow, identifying and providing information about
the feasible business opportunities is an important starting point. Investment
promotion materials are developed to introduce the investors to potential business
opportunities, provide basic information about the projects' capital and operational
costs and work out basic financial feasibility of the presented propositions.
Agriculture, being the mainstay of Pakistan's economy, offers host of attractive
opportunities which can be converted into profitable businesses by mobilizing
private sector investment. The current document discusses the pre-feasibility of
one such option.
4 PURPOSE OF THE DOCUMENT
The purpose of this document is to facilitate potential investors in establishing
Olive Oil Extraction Units by providing them with a general understanding of the
business with the intention of supporting potential investors in crucial investment
decisions.
The need to come up with pre-feasibility reports for undocumented or minimally
documented sectors attains greater imminence as the research that precedes

Pre-Feasibility Study Olive Oil Extraction Units
February 2017 6
such reports reveals certain thumb rules; best practices developed by existing
enterprises by trial and error, and certain industrial norms that become a guiding
source regarding various aspects of business setup and its successful
management.
Apart from carefully studying the whole document, one must consider critical
aspects provided later on which form the basis of any investment decision.
5 BRIEF DESCRIPTION OF PROJECT & PRODUCT
Pakistan is predominantly an agrarian economy, yet it is unable to fulfill the
demand of edible oil for domestic requirements. One of the challenges to the
economy of Pakistan is the edible oil deficit. Edible oil is considered as a necessity
and not a luxury product and hence its demand is relatively inelastic and grows
with time. There are many reasons behind the shortcomings such as lack of
awareness of farmers and technological deficiency in oilseed production etc.
5.1 Project Description
The demand for olive oil is increasing day by day due to eating habits of people of
Pakistan. Local production does not meet the demand which indicates a huge
potential for growing olive trees. Currently in Pakistan about 6 to 8 olive oil
extraction units having capacity to process 750 to 1,000 kgs of olive fruit per hour
are installed which cannot meet the local demand of Olive Oil2. In 2015, Pakistan
imported 2,706 tons of Olive Oil worth 7.38 million US dollars3. Like Pakistan,
China is also new in Olive cultivation and currently has 25 oil mills. In 2015-16, it
produced approximately 5,000 tons of olive oil from 86,000 hectares. China is
continuously importing Olive Oil and Pomace Olive Oil from the world especially
from European countries which is 96% of their total import. In 2014-15 china
imported 35,899 tons of olive oil4.
This Pre-feasibility study is about setting up “Olive Oil Extraction Units” in different
areas of Potohar region in Punjab. The Barani Agriculture Research Institute
(BARI) located in Punjab‟s Chakwal district, has already planted 473,265 olive
trees in the region so far5. The BARI reveals that the massive Olive Valley Project
2 Undocumented data, collected from industry experts
3 Trade Map (Product: 1509, 151000)
4 www.oliveoilmarket.eu/olive-growing-in-china/
5 Director Olive BARI, Chakwal

Pre-Feasibility Study Olive Oil Extraction Units
February 2017 7
is not only providing olive saplings to local farmers, but also technical support on
olive grove management and financial support for water resource development
and drip irrigation.
It is estimated that in next 10 years BARI, with the help of Government of Punjab,
will plant 3.16 million trees in the area covering 23,400 acres that give 21,000 tons
of olive fruit which will be available in market for further processing6. The long-term
objectives of the project are to produce olive oil for export while creating a
sustainable olive oil economy which will also benefit the rural communities of the
region. Pakistan presently produces 34 percent of the edible oils it consumes
domestically and is forced to spend significant foreign exchange on the import of
edible oil to meet domestic demand. The future and yield of olive plantation in this
region is given in table 17;
Table 1: Future Plantation and Yield in Punjab Region
Years Estimated Plantation
Plan (Acres)
Planted Area (Acres)
Accumulated
Planted Trees (Nos)
Planted Trees (Accumulated)
Expected Yield of
Olive Fruits (Tons)8
Current
4,045 473,265
6
Year 1 2,100 6,145 283,500 756,765 189
Year 2 2,500 8,645 337,500 1,094,265 607
Year 3 2,100 10,745 283,500 1,377,765 1,412
Year 4 2,100 12,845 283,500 1,661,265 2,650
Year 5 2,100 14,945 283,500 1,944,765 3,961
Year 6 2,500 17,445 337,500 2,282,265 5,844
Year 7 2,500 19,945 337,500 2,619,765 8,576
Year 8 2,500 22,445 337,500 2,957,265 12,188
Year 9 2,500 24,945 337,500 3,294,765 16,711
Year 10 2,500 27,445 337,500 3,632,265 21,249
Total 23,400 27,445 3,159,000 3,632,265 73,387
6 Calculated keeping in view the olive tree age and yield.
7 Data provided by Director BARI, Chakwal.
8 The expected yield from Olive Trees are given in Assumptions after discussion with industry experts /
consultants.

Pre-Feasibility Study Olive Oil Extraction Units
February 2017 8
5.2 Product Description
The proposed processing facilities will extract Olive Oil from the olive fruits and
remaining cake will be sold to local market. The olive cakes are used for different
purposes, such as in cosmetics, recipes, medicines, animal feed, etc.
There are many types of olive oil, some of them are described below;
Virgin Olive Oil: The most popular variety, virgin olive oil is a well-known
cooking oil with a surprisingly low acid content. It is best suitable for people
who want to enjoy the benefits of olive oil.
Extra Virgin Olive Oil: “Extra” is the highest grade for olive oil, made by
cold pressing olive fruit, this oil is considered to be the best for human body
and it is very expensive. The virgin oil produced from the mechanical
pressing described above may be called “extra” if it has less than 1% free
oleic acid, and if it exhibits superior taste, color and aroma. Thus, the
“extra” in extra virgin olive oil means “premium,” or simply, “the best.”
Pure Olive Oil: This oil is actually an amalgamation of refined and virgin
olive oils. It has a high acidic content.
Lampante Oil: This type of oil is used only as a fuel and is not suitable for
cooking.
The proposed processing facilities will extract virgin olive oil through centrifugation
process. The benefits of olive oil are given below;
The Vitamin E available in Olives is the body's primary fat-soluble
antioxidant. Anti-oxidants help to strengthen the body's immune system;
reducing the severity of asthma, cancer, osteoarthritis, and rheumatoid
arthritis, premature ageing, as well as delaying the effects of ageing.

Pre-Feasibility Study Olive Oil Extraction Units
February 2017 9
Used as a balm, it fortifies and moisturizes the skin, combating dry skin and
softening it. It also combats acne.
Helps against wrinkles and delays the effects of old age.
Helps combat strokes, heart-disease, high blood pressure and diabetes.
The decoction of olive leaves in water is effective against mouth and lip
ulcers and allergic dermatitis also.
Tea of Olive leaves helps against high blood pressure.
5.3 Installed And Operational Capacities
One facility will have the capacity to process 200 kgs / hour of olives which brings
20% of the olive oil out of those fruits. Total 30 units will be installed in next 10
years keeping in view the future yield and need. The year wise expansion in
processing facilities along with recovery of Olive Oil is given in table 2;
Table 2: Installed and Operational Capacity (Year Wise)
Years Processing
Facilities Required
Processed by this Facility
40% of Expected Yield
(Tons)
Olive Oil to be Extracted @20%
Recovery (Liters)
Year 1 1 76 15,125
Year 2 - 243 48,557
Year 3 1 565 112,921
Year 4 2 1,060 212,023
Year 5 2 1,584 316,898
Year 6 3 2,338 467,512
Year 7 3 3,430 686,098
Year 8 5 4,875 975,078
Year 9 7 6,684 1,336,878
Year 10 6 8,500 1,699,908
Total (Accumulated for 10 Years)
30 29,355 5,870,999

Pre-Feasibility Study Olive Oil Extraction Units
February 2017 10
5.4 Demand and Supply Forecast
Currently in Pakistan there is no state of the art facility to extract olive oil as not
much fruit is available for processing. The future demand and availability of Olive
Oil to be processed in Pakistan is given in table 3;
Table 3: Demand and Supply Analysis
Upcoming Years
Future Demand of Olive Oil (Tons)
Estimated9
Processed by these Units (000 liters)
Percentage of Demand Meet
Year 1 3,118 15 0.49%
Year 2 3,592 49 1.35%
Year 3 4,138 113 2.73%
Year 4 4,768 212 4.45%
Year 5 5,493 317 5.77%
Year 6 6,329 468 7.39%
Year 7 7,292 686 9.41%
Year 8 8,401 975 11.61%
Year 9 9,680 1,337 13.81%
Year 10 11,152 1,700 15.24%
After 10 years, the project will be meeting 15.24% of the demand in Pakistan.
9 Took average of last 5 years’ growth in Olive Oil import and apply to find the next 10 years demand.

Pre-Feasibility Study Olive Oil Extraction Units
February 2017 11
6 PRODUCTION PROCESS FLOW
Extraction Process of Olive Oil is given below in detail:
Figure 1: Extraction Process Flow
I. SORTING & CLEANING
After the ripe olives have been combed from the trees, they are picked over by
hand to weed out unsound olives. The olives are divided into categories
according to their plumpness, state of ripeness, and quality. Then the olives are
taken to the press and stored for a short period of time. The period is short
enough to prevent fermentation but long enough to allow the olives to get warm
so that they release their oil easily.
The first step after the Sorting & Grading is cleaning the olives and removing the
stems, leaves, twigs, and other debris left with the olives. The olives should be
washed with water to remove pesticides, dirt, etc. Rocks and sand will damage
a hammer mill and quickly wear out a centrifugal decanter or oil separator,
reducing life span from 25 to as little as 5 years.

Pre-Feasibility Study Olive Oil Extraction Units
February 2017 12
II. GRINDING & PASTE FORMATION
In ancient times, the olives were mashed into a paste with a simple mortar and
pestle. This principle was expanded upon until the stone mortars were large
enough to require slaves or pack animals to operate them. In the modern
process, the milled olives travel from the mill into vats in which slowly turning
blades mash the olives into a homogenized paste. The purpose of crushing is to
tear the flesh cells to facilitate the release of the oil from the vacuoles. This step
can be done with stone mills, metal tooth grinders, or various kinds of hammer
mills.
III. MALAXING (MIXING THE PASTE)
Malaxing (mixing) the paste for 20 to 45 minutes allows small oil droplets to
combine into bigger ones. It is an indispensable step. The paste can be heated
or water added during this process to increase the yield, although this generally
results in lowering the quality of the oil. The most common mixer is a horizontal
trough with spiral mixing blades. Longer mixing times increase oil yield but
allows a longer oxidation period that decreases shelf life.
IV. SEPARATING / EXTRACTION
The next step is separating the oil from the rest of the olive components. This
used to be done with presses, but is now done by centrifugation. Some
centrifuges are called three-phase because they separate the oil, the water, and
the solids separately. The two-phase centrifuges separate the oil from a wet
paste. In most cases, the oil coming out of the first centrifuge is further
processed to eliminate any remaining water and solids by a second centrifuge
that rotates faster. The oil is then left in tanks or barrels where a final
separation, if needed, happens through gravity. This is called racking the oil.
Finally the oil can be filtered, if desired. Centrifugation methods are becoming
more popular for the pressing process as well as for separating the oil from the
vegetable water. Although centrifugation requires more energy and water, the
method takes up less space in the factory and requires a shorter set-up time.
Centrifugation also eliminates the need for pressing bags, which must be
washed after each pressing.
Lastly, possible additional processing steps include refining the oil to reduce its
acidity and improve flavor (in defective oils) by alkali (chemical reaction with an

Pre-Feasibility Study Olive Oil Extraction Units
February 2017 13
alkali – caustic soda) or steam processing; bleaching the oil to reduce
chlorophyll, carotenoids, residual fatty acids, and pesticides using diatomaceous
earth, activated carbon, or synthetic silica treatment, and deodorization to
reduce odors with the use of activated carbon. Needless to say, these steps are
only used for low quality oil.
V. STORAGE & PACKAGING
The oil is stored in underground vats until it is ready to be transported. Then the
oil is canned or bottled on an assembly line. Cans or dark-tinted bottles will keep
the deep-green color of the olive oil intact. Oil placed in clear-glass bottles will
fade to a yellowish-green. However, the flavor is not affected. In many cases,
olive oil distributors purchase the olive from the producers and rebottle it.
Packaging has become more ornate as the popularity of olive oil has grown. It is
not unusual to purchase olive oil in unusually shaped bottles topped with netting
or rope. Some packagers also hire professional artists to design their labels.
7 CRITICAL FACTORS
Following principles need to be pursued for the best extraction of Olive Oil;
For best quality Olive Oil, fruit should be transported to facility within 24 hours and if extra virgin Olive Oil is to be extracted, the transportation time should be less than 6 hours.
As this project is designed for future yield of olives and extraction units, the expansion will be done in the years later so future contract with machinery suppliers, farm owners, should be placed keeping in view the inflationary effect.
When choosing storage location, remember that heat, air, and light are the adversaries of oil. These elements help create free radicals, which eventually lead to excessive oxidation and rancidity that will develop bad taste in the oil. Even worse, oxidation and free radicals contribute to heart disease and cancer.
For best flavor, olive oil should be stored in a cool, dark place. Properly stored olive oil can be used for at least two years. It is, however, at its peak within a year of production, and is most flavorful for the first two months.

Pre-Feasibility Study Olive Oil Extraction Units
February 2017 14
Heat, light and air are not good for Olive Oil, hence it is ideal to store Olive Oil in either metal tins or dark colored glass bottles. These steps should be taken to protect the oil from the light in order to preserve the quality. The olive oil should be stored in a cool, dark place at home with the cap tightened when not in use.
Enhancing the skill of the contract farmers and the process relevant staff and management should be ensured.
Effective marketing and distribution of Olive Oil should be ensured keeping in view the international food safety and hygiene standards.
8 GLOBAL MARKET OF OLIVE OIL10
Demand for Olive Oil is increasing. Information about the major importing and
exporting countries of Olive Oil is given in the tables 4, 5 and 6.
Table 4: Top Importing Countries
Rank Top Importing Countries
2011 2012 2013 2014 2015
(Import Quantity in Tons)
1 Italy 625,425 599,335 481,746 666,240 581,365
2 United States of America
292,908 323,002 289,890 312,106 313,168
3 Spain 63,965 95,281 164,509 80,863 249,646
4 France 114,912 116,541 113,572 115,292 113,953
5 Portugal 90,463 105,958 120,576 109,933 105,507
(Import Value in Thousand US $)
1 Italy 1,682,252 1,485,096 1,626,066 2,006,442 2,053,702
2 United States of America
996,618 1,008,960 1,150,239 1,171,550 1,260,180
3 Spain 136,688 164,438 436,943 192,104 699,603
4 France 421,678 377,548 473,075 431,908 481,352
5 Portugal 232,809 261,826 394,766 321,787 347,861
10
Source: Trademap (Product: 1509, Olive oil and its fractions obtained from the fruit of the olive
tree; 151000, other oils and their fractions, obtained solely from olives, whether or not refined.

Pre-Feasibility Study Olive Oil Extraction Units
February 2017 15
China and Pakistan have imported 1.90% and 0.13% of the World‟s Olive Oil in
2015 respectively which is worth 184 million US dollars. Spain and Italy are the
major exporters to China and Pakistan. In 2015, Spain met 77% of China‟s and
84% of Pakistan‟s demand and Italy met 12% of China‟s and 10% of Pakistan‟s
demand. Details of China‟s and Pakistan‟s trade partners are given in the table
below.
Table 5: China and Pakistan Import Trade Partners
Rank Countries 2011 2012 2013 2014 2015
Top Importing Countries by China (Import Quantity in Tons)
World 35,973 46,151 40,027 35,782 38,645
1 Spain 20,688 28,042 24,488 23,054 29,862
2 Italy 9,480 10,313 9,301 7,133 4,823
3 Greece 2,041 2,958 2,050 1,114 999
4 Morocco - 53 311 950 749
5 Australia 746 802 727 628 646
(Import Value in Thousand US $)
World 148,759 170,892 191,405 153,044 176,696
1 Spain 84,436 100,667 117,720 94,188 134,829
2 Italy 37,063 36,942 43,093 31,012 21,948
3 Greece 9,225 12,906 10,730 6,611 5,470
4 Morocco - 216 1,463 4,218 3,469
5 Australia 4,972 5,723 5,218 4,648 3,680
Top Importing Countries by Pakistan (Import Quantity in Tons)
World 1,496 1,922 1,683 2,427 2,706
1 Spain 1,136 1,573 1,277 1,905 2,283
2 Italy 298 230 211 363 274
3 Turkey 48 85 88 72 57
4 Tunisia 3 - 72 48 47
5 China - - - - 13
(Import Value in Thousand US $)
World 4,303 5,181 4,892 7,400 7,383
1 Spain 3,132 4,134 3,611 5,815 6,021
2 Italy 1,017 695 765 1,126 979
3 Turkey 78 247 239 195 151
4 Tunisia 6 - 169 137 118
5 China 1 - - - 29
Pre-Feasibility Study Olive Oil Extraction Units
February 2017 16
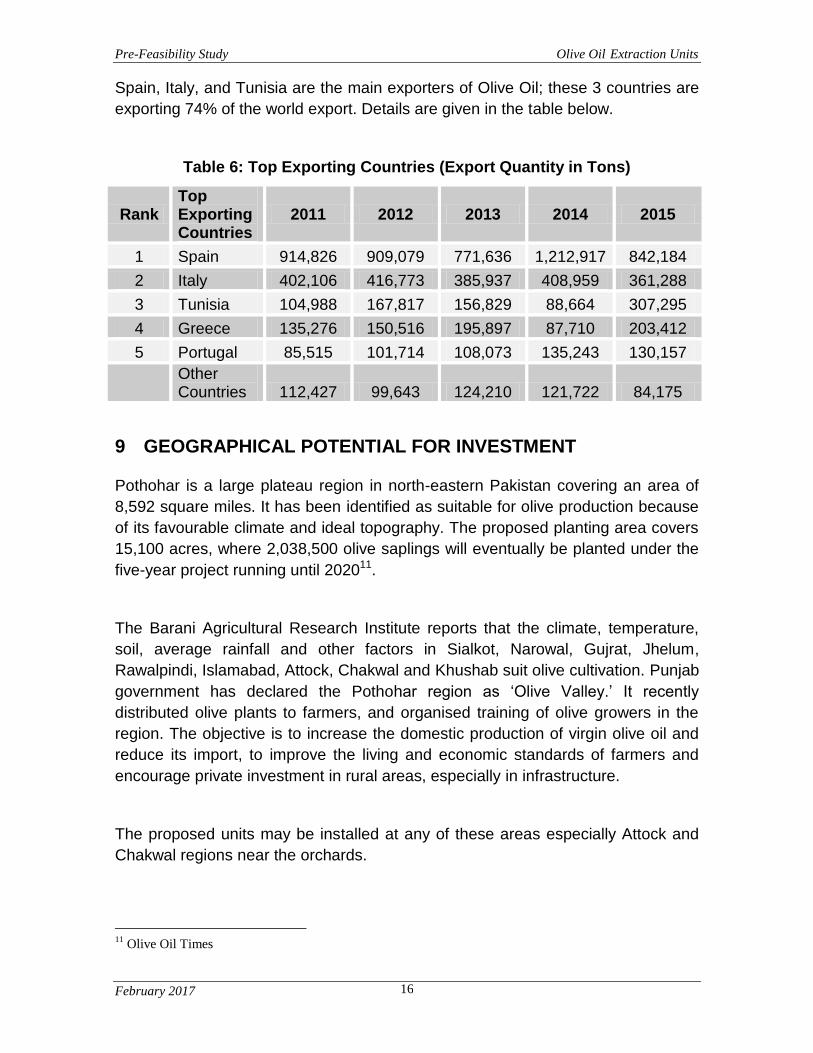
Spain, Italy, and Tunisia are the main exporters of Olive Oil; these 3 countries are
exporting 74% of the world export. Details are given in the table below.
Table 6: Top Exporting Countries (Export Quantity in Tons)
Rank Top Exporting Countries
2011 2012 2013 2014 2015
1 Spain 914,826 909,079 771,636 1,212,917 842,184
2 Italy 402,106 416,773 385,937 408,959 361,288
3 Tunisia 104,988 167,817 156,829 88,664 307,295
4 Greece 135,276 150,516 195,897 87,710 203,412
5 Portugal 85,515 101,714 108,073 135,243 130,157
Other Countries 112,427 99,643 124,210 121,722 84,175
9 GEOGRAPHICAL POTENTIAL FOR INVESTMENT
Pothohar is a large plateau region in north-eastern Pakistan covering an area of
8,592 square miles. It has been identified as suitable for olive production because
of its favourable climate and ideal topography. The proposed planting area covers
15,100 acres, where 2,038,500 olive saplings will eventually be planted under the
five-year project running until 202011.
The Barani Agricultural Research Institute reports that the climate, temperature,
soil, average rainfall and other factors in Sialkot, Narowal, Gujrat, Jhelum,
Rawalpindi, Islamabad, Attock, Chakwal and Khushab suit olive cultivation. Punjab
government has declared the Pothohar region as „Olive Valley.‟ It recently
distributed olive plants to farmers, and organised training of olive growers in the
region. The objective is to increase the domestic production of virgin olive oil and
reduce its import, to improve the living and economic standards of farmers and
encourage private investment in rural areas, especially in infrastructure.
The proposed units may be installed at any of these areas especially Attock and
Chakwal regions near the orchards.
11
Olive Oil Times

Pre-Feasibility Study Olive Oil Extraction Units
February 2017 17
10 POTENTIAL TARGET CUSTOMERS / MARKETS
As stated above, China and Pakistan are importing large quantities of Olive Oil
and it is estimated that in next 10 years these two countries will be importing
126,00012 tons of Olive Oil from the world. These units and similar ones to these
will help reduce the import of such products and make us capable of exporting
Olive Oil and its related products to the world.
The targeted customers of these products are food, cocktails / juices, agriculture /
animal feed, and various other industries. The main export markets for Pakistani
Olive Oil are Afghanistan and other neighbouring countries. However, majority of
the produce will be consumed locally because most of the local demand is
currently met by the imports.
11 PROJECT COST SUMMARY
11.1 Project Economics
All the figures in this financial model have been calculated for estimated
processing of 15,125 liters of olive oil which will be extracted from 76 tons of fruit
in year 1. Detail of processing facilities required in later years along with
calculation of cost of goods sold and revenue generation are attached in
annexure.
The following table shows internal rate of return, payback period and net present
value of the proposed venture.
Table 7: Project Economics
Description Details
Internal Rate of Return (IRR) 39%
Payback Period (Years) 6.53
Net Present Value (@20%) PKR 281,801,919
12
Forecasted as per data available on the trade map, by taking average of last 5 years import
trends of China and Pakistan.

Pre-Feasibility Study Olive Oil Extraction Units
February 2017 18
11.2 Project Financing
The project will be financed through 100% Owner‟s equity, however, short term
debt would be generated to meet its cash requirement in case of loss / negative
cash flows.
11.3 Project Cost
Following fixed and working capital requirements have been identified for
operations of the proposed business in initial year, however as the processing
facilities will increase in later years, capital cost will also increase. The details of
these increased capital costs are given in annexure.
Table 8: Project Cost (Initial Year)13
Description Amount PKR
Land 10,000,000
Building/Infrastructure 22,742,192
Machinery & equipment 4,555,625
Furniture & fixtures 2,010,000
Office vehicles 4,697,875
Office equipment 3,852,500
Pre-operating costs14 2,462,000
Training costs 700,000
Total Capital Costs 51,020,192
Working Capital
Equipment spare part inventory 18,907
Raw material inventory 666,465
Cash 1,500,000
Total Working Capital 2,185,372
Total Investment 53,205,563
11.4 Space Requirement
Approximately, 3 kanal15 of land would be required for establishment of head office
and 0.5 kanal of land is required for each processing facility. It is recommended
that required land should be acquired near the Olive orchards. The cost of land is
13
The cost includes for Head Office and 1 processing facility in initial year. 14
Includes salaries, utility connection charges, etc., occurred before business start of operations. 15
1 kanal is equal to 4,500 square feet.

Pre-Feasibility Study Olive Oil Extraction Units
February 2017 19
estimated at the rate of PKR 3.00 million per kanal for head office and PKR 2.00
million for processing facilities.
The infrastructural requirements of the project mainly comprise the construction of
Management Building, Sorting, Processing Hall, Store and other facilities. The cost
of construction of building for the proposed unit is provided in the table 9 and 10:
Table 9: Building / Infrastructure Requiremnt (Head Office)
Description Area (Sq.ft) Cost
(PKR /Sq. ft.)
Amount (PKR)
Office 1,000 2,200 2,200,000
Laboratory 1,500 2,000 3,000,000
Storage Facility 6,000 1,800 10,800,000
Meeting Room 1,000 2,200 2,200,000
Open Area 4,000 25 100,000
Boundary Wall (Running Feet) 465 1,600 743,613
Total
19,043,613
Table 10: Building / Infrastructure Requiremnt (Processing Facilities)
Description Area (Sq.ft) Cost
(PKR /Sq. ft.)
Amount (PKR)
Processing and Packaging Area 800 1,600 1,280,000
Raw Material Store 700 1,300 910,000
Finish Good Store 400 1,500 600,000
Mini Laboratory 100 2,000 200,000
Office 225 1,800 405,000
Boundary Wall (Running Feet) 190 1,600 303,579
Total
3,698,579

Pre-Feasibility Study Olive Oil Extraction Units
February 2017 20
11.5 Machinery & Equipment Requirement
Plant, machinery and equipment for each processing facility is given in table 11;
Table 11: Machinery & Equipment
Description Amount (PKR)
Olive Oil Extraction Unit (200 Kgs Processing Capacity Per Hour) including Custom duty, Sales Tax, other taxes, etc.
3,205,625
Port Clearance Charges 50,000
Lifting and Freight Charges to facility 50,000
Other Allied Machinery including Generator, Mini Lab, Packaging Machine and other
1,000,000
Installation Charges (Plant, Utilities, other) 250,000
Total Machinery & Equipment Cost16 4,555,625
11.6 Furniture & Fixtures Requirement
Details of the furniture and fixture required for the Head Office and Processing
Facilities are given below;
Table 12: Furniture & Fixture Requirement
Description Quantit
y Unit Cost (PKR)
Amount (PKR)
Head Office
Furniture for CEO 1 100,000 100,000
Furniture for Meeting Room 1 250,000 250,000
Furniture for Other Office Staff 13 50,000 650,000
Electric Fitting 1 300,000 300,000
Air conditioners (1.5 ton split) 5 65,000 325,000
Misc. 1 250,000 250,000
Total
1,875,000
Processing Facilities
Furniture 1 60,000 60,000
Electric Fitting 1 50,000 50,000
Misc. 1 25,000 25,000
Total
135,000
Total Furniture & Fixture
2,010,000
16
The cost of Plant and Machinery may be reduced as Government of Pakistan has announced the tax
holidays for foreign investor under Special Economic Zones
Pre-Feasibility Study Olive Oil Extraction Units
February 2017 21
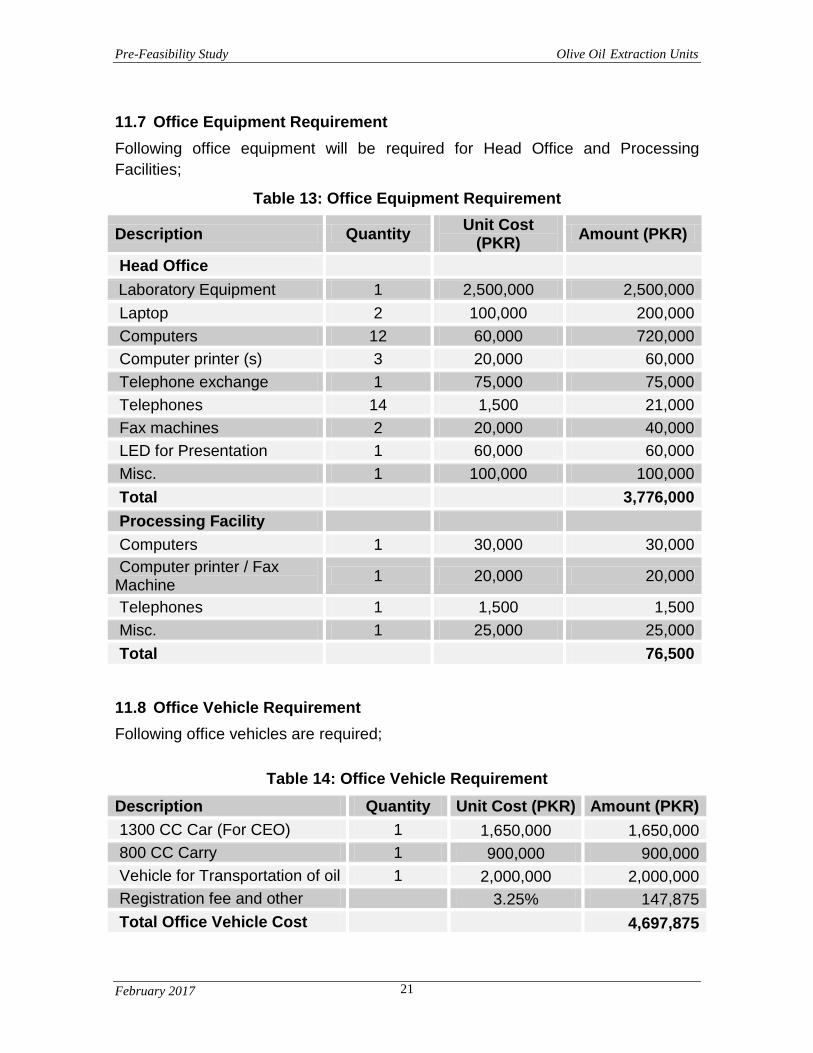
11.7 Office Equipment Requirement
Following office equipment will be required for Head Office and Processing
Facilities;
Table 13: Office Equipment Requirement
Description Quantity Unit Cost
(PKR) Amount (PKR)
Head Office
Laboratory Equipment 1 2,500,000 2,500,000
Laptop 2 100,000 200,000
Computers 12 60,000 720,000
Computer printer (s) 3 20,000 60,000
Telephone exchange 1 75,000 75,000
Telephones 14 1,500 21,000
Fax machines 2 20,000 40,000
LED for Presentation 1 60,000 60,000
Misc. 1 100,000 100,000
Total 3,776,000
Processing Facility
Computers 1 30,000 30,000
Computer printer / Fax Machine
1 20,000 20,000
Telephones 1 1,500 1,500
Misc. 1 25,000 25,000
Total
76,500
11.8 Office Vehicle Requirement
Following office vehicles are required;
Table 14: Office Vehicle Requirement
Description Quantity Unit Cost (PKR) Amount (PKR)
1300 CC Car (For CEO) 1 1,650,000 1,650,000
800 CC Carry 1 900,000 900,000
Vehicle for Transportation of oil 1 2,000,000 2,000,000
Registration fee and other
3.25% 147,875
Total Office Vehicle Cost
4,697,875

Pre-Feasibility Study Olive Oil Extraction Units
February 2017 22
11.9 Human Resource Requirement
To run operations of Olive Oil Extraction Units smoothly, details of human
resources required along with number of employees and monthly salary are
recommended as under;
Table 15: Human Resource Requirment
Description No. of
Employees Salary Per Month
(PKR)
Head Office
CEO 1 125,000
Marketing Manager 1 70,000
Asst. Marketing Manager 2 35,000
Quality Control Officer 2 35,000
Procurement Officer 1 50,000
Assistant Procurement Officer 1 25,000
Lab Assistant 2 25,000
Production Supervisor 1 60,000
Assistant Production Supervisor 1 30,000
Account Officer/Manager 1 30,000
Admin Officer 1 30,000
Driver 2 16,000
Guards 2 16,000
Office Boy 2 14,000
Total 20
Processing Facilities
Plant Operator* 3 25,000
Helper* 3 15,000
Guard 2 16,000
Seasonal Staff**
Total 8
* Plant operators and helpers will be hired for 2.5 months. 1 Production Supervisor and 1 Assistant at head office will provide training to operate plant during the season and provide assistance, if needed. ** For loading / unloading of olive fruit and olive oil.
Salaries of Head Office and Processing Facility staff will be raised by 10% each year, Seasonal labor will be hired on daily wages. In year 1, the seasonal labor cost will be around PKR 56,720.

Pre-Feasibility Study Olive Oil Extraction Units
February 2017 23
11.10 Utilities and other costs
An essential cost to be borne by the project is the cost of electricity both in Head
Office and Processing Facilities. The utility expenses are estimated to be around
PKR 1,477,222 for head office and PKR 88,318 for Processing Facility in year 117.
Furthermore, promotional expenses are essential for marketing of this unit, and
are estimated as 0.25% of revenue each year.
11.11 Revenue Generation
Based on the availability of Olive Fruit for processing, the revenue for the 1st year
is calculated as under;
17
Processing facilities load is 13 kilo watts per hour (9 kilo watt for Plant and 5 for other equipment) while
head office load is estimated at 19 kilo wats per hour.

Pre-Feasibility Study Olive Oil Extraction Units
February 2017 24
Table 16: Revenue Generation – Year 1
Product Mix Percentage Production
Quantity
Sales Price Per
Unit (PKR)
Revenue (PKR)
0.5 Liter Packing (No) 50% 15,125 375 5,672,040
1.0 Liter Packing (No) 40% 6,050 650 3,932,614
4.0 Liter Packing (No) 10% 378 2,100 794,086
Total from Olive Oil 100% 21,554 10,398,740
Olive Cake (Kgs)
60,502 10 605,018
Total Revenue from Oil and Cake 11,003,758
11.12 Raw Material Requirement
Fresh Olives are the main raw material for the proposed facility, which will be procured either directly from the farms or from distributors.
Table 17: Raw Material Requirement – Year 1
Description Quantity (Tons)
Purchase Price Per Ton (PKR)
Total Cost (PKR)
Olive Fruit 76 95,000 7,184,584
Freight 76 5,000 378,136
Daily Wages* 76 750 56,720
Total 7,619,440 * Daily wages are for loading / unloading of olive fruit and olive oil

Pre-Feasibility Study Olive Oil Extraction Units
February 2017 25
12 USEFUL WEB LINKS
Small & Medium Enterprises Development
Authority (SMEDA) www.smeda.org.pk
Government of Pakistan www.pakistan.gov.pk
Ministry of Industries & Production www.moip.gov.pk
Government of Punjab www.punjab.gov.pk
Government of Sindh www.sindh.gov.pk
Government of Khyber Pakhtunkhwa www.khyberpakhtunkhwa.gov.pk
Government of Balochistan www.balochistan.gov.pk
Government of Gilgit Baltistan www.gilgitbaltistan.gov.pk
Government of Azad Jamu Kashmir www.ajk.gov.pk
Trade Development Authority of Pakistan
(TDAP) www.tdap.gov.pk
Securities and Exchange Commission of
Pakistan (SECP) www.secp.gov.pk
Federation of Pakistan Chambers of
Commerce and Industry (FPCCI) www.fpcci.com.pk
State Bank of Pakistan (SBP) www.sbp.org.pk
Punjab Small Industries Corporation www.psic.gop.pk
Sindh Small Industries Corporation www.ssic.gos.pk
Pakistan Horticulture Development and Export
Company (PHDEC) www.phdec.org.pk
Punjab Vocational Training Council (PVTC) www.pvtc.gop.pk
Technical Education and Vocational Training
Authority (TEVTA) www.tevta.org
Punjab Industrial Estates (PIE) www.pie.com.pk
Ministry of National Food Security and
Research (MNFSR) www.mnsfr.gov.pk
Pakistan Agriculture Research Council (PARC) www.parc.gov.pk
National Agriculture Research Council (NARC) www.narc.gov.pk
Agriculture University of Faisalabad (UAF) www.uaf.edu.pk
Agriculture Marketing Information Service www.amis.pk
Barani Agricultural Research Institute (BARI),
Chakwal barichakwal.org
Pre-Feasibility Study Olive Oil Extraction Units
February 2017 26
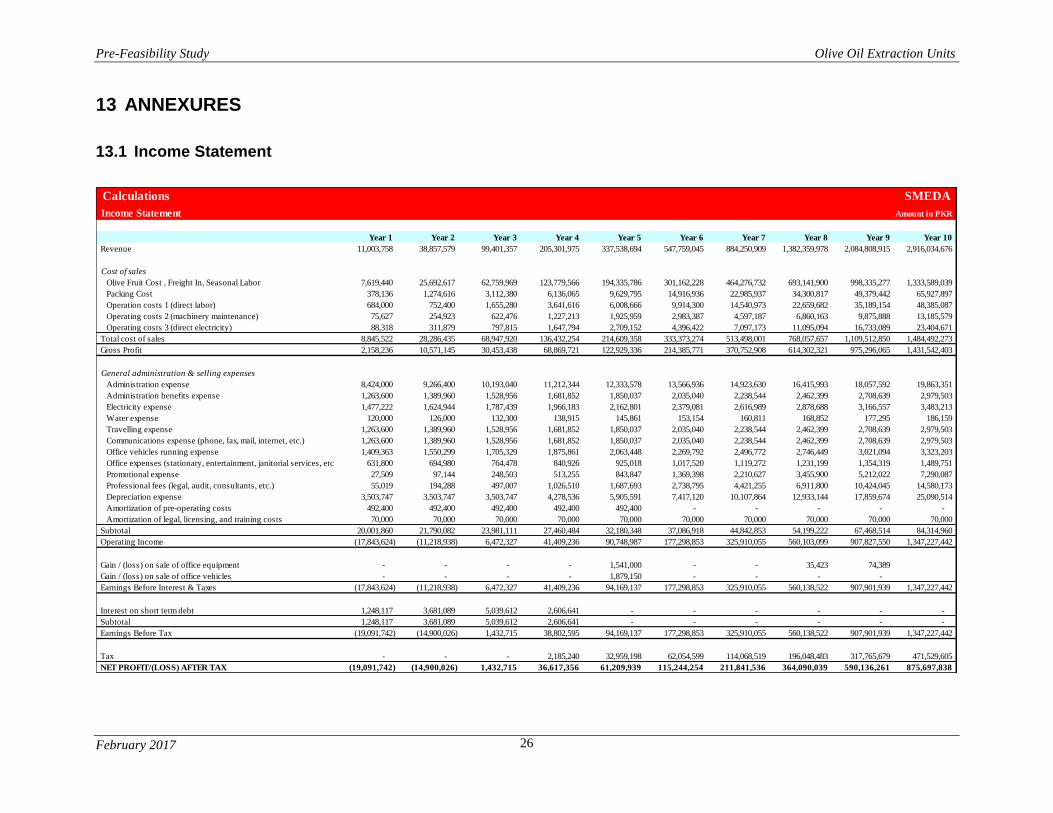
13 ANNEXURES
13.1 Income Statement
Calculations SMEDA
Income Statement Amount in PKR
Year 1 Year 2 Year 3 Year 4 Year 5 Year 6 Year 7 Year 8 Year 9 Year 10
Revenue 11,003,758 38,857,579 99,401,357 205,301,975 337,538,694 547,759,045 884,250,909 1,382,359,978 2,084,808,915 2,916,034,676
Cost of sales
Olive Fruit Cost , Freight In, Seasonal Labor 7,619,440 25,692,617 62,759,969 123,779,566 194,335,786 301,162,228 464,276,732 693,141,900 998,335,277 1,333,589,039
Packing Cost 378,136 1,274,616 3,112,380 6,136,065 9,629,795 14,916,936 22,985,937 34,300,817 49,379,442 65,927,897
Operation costs 1 (direct labor) 684,000 752,400 1,655,280 3,641,616 6,008,666 9,914,300 14,540,973 22,659,682 35,189,154 48,385,087
Operating costs 2 (machinery maintenance) 75,627 254,923 622,476 1,227,213 1,925,959 2,983,387 4,597,187 6,860,163 9,875,888 13,185,579
Operating costs 3 (direct electricity) 88,318 311,879 797,815 1,647,794 2,709,152 4,396,422 7,097,173 11,095,094 16,733,089 23,404,671
Total cost of sales 8,845,522 28,286,435 68,947,920 136,432,254 214,609,358 333,373,274 513,498,001 768,057,657 1,109,512,850 1,484,492,273
Gross Profit 2,158,236 10,571,145 30,453,438 68,869,721 122,929,336 214,385,771 370,752,908 614,302,321 975,296,065 1,431,542,403
General administration & selling expenses
Administration expense 8,424,000 9,266,400 10,193,040 11,212,344 12,333,578 13,566,936 14,923,630 16,415,993 18,057,592 19,863,351
Administration benefits expense 1,263,600 1,389,960 1,528,956 1,681,852 1,850,037 2,035,040 2,238,544 2,462,399 2,708,639 2,979,503
Electricity expense 1,477,222 1,624,944 1,787,439 1,966,183 2,162,801 2,379,081 2,616,989 2,878,688 3,166,557 3,483,213
Water expense 120,000 126,000 132,300 138,915 145,861 153,154 160,811 168,852 177,295 186,159
Travelling expense 1,263,600 1,389,960 1,528,956 1,681,852 1,850,037 2,035,040 2,238,544 2,462,399 2,708,639 2,979,503
Communications expense (phone, fax, mail, internet, etc.) 1,263,600 1,389,960 1,528,956 1,681,852 1,850,037 2,035,040 2,238,544 2,462,399 2,708,639 2,979,503
Office vehicles running expense 1,409,363 1,550,299 1,705,329 1,875,861 2,063,448 2,269,792 2,496,772 2,746,449 3,021,094 3,323,203
Office expenses (stationary, entertainment, janitorial services, etc.) 631,800 694,980 764,478 840,926 925,018 1,017,520 1,119,272 1,231,199 1,354,319 1,489,751
Promotional expense 27,509 97,144 248,503 513,255 843,847 1,369,398 2,210,627 3,455,900 5,212,022 7,290,087
Professional fees (legal, audit, consultants, etc.) 55,019 194,288 497,007 1,026,510 1,687,693 2,738,795 4,421,255 6,911,800 10,424,045 14,580,173
Depreciation expense 3,503,747 3,503,747 3,503,747 4,278,536 5,905,591 7,417,120 10,107,864 12,933,144 17,859,674 25,090,514
Amortization of pre-operating costs 492,400 492,400 492,400 492,400 492,400 - - - - -
Amortization of legal, licensing, and training costs 70,000 70,000 70,000 70,000 70,000 70,000 70,000 70,000 70,000 70,000
Subtotal 20,001,860 21,790,082 23,981,111 27,460,484 32,180,348 37,086,918 44,842,853 54,199,222 67,468,514 84,314,960
Operating Income (17,843,624) (11,218,938) 6,472,327 41,409,236 90,748,987 177,298,853 325,910,055 560,103,099 907,827,550 1,347,227,442
Gain / (loss) on sale of office equipment - - - - 1,541,000 - - 35,423 74,389
Gain / (loss) on sale of office vehicles - - - - 1,879,150 - - - -
Earnings Before Interest & Taxes (17,843,624) (11,218,938) 6,472,327 41,409,236 94,169,137 177,298,853 325,910,055 560,138,522 907,901,939 1,347,227,442
Interest on short term debt 1,248,117 3,681,089 5,039,612 2,606,641 - - - - - -
Subtotal 1,248,117 3,681,089 5,039,612 2,606,641 - - - - - -
Earnings Before Tax (19,091,742) (14,900,026) 1,432,715 38,802,595 94,169,137 177,298,853 325,910,055 560,138,522 907,901,939 1,347,227,442
Tax - - - 2,185,240 32,959,198 62,054,599 114,068,519 196,048,483 317,765,679 471,529,605
NET PROFIT/(LOSS) AFTER TAX (19,091,742) (14,900,026) 1,432,715 36,617,356 61,209,939 115,244,254 211,841,536 364,090,039 590,136,261 875,697,838

Pre-Feasibility Study Olive Oil Extraction Units
February 2017 27
13.2 Balance Sheet
Calculations SMEDA
Balance Sheet Amount in PKR
Year 0 Year 1 Year 2 Year 3 Year 4 Year 5 Year 6 Year 7 Year 8 Year 9 Year 10
Current assets
Cash & Bank 1,500,000 - - - 156,630 20,330,503 24,665,062 42,880,687 69,858,684 120,154,224 435,857,146
Accounts receivable 452,209 1,024,548 2,840,937 6,261,027 11,154,260 18,191,049 29,424,862 46,574,196 71,243,196 102,757,060
Finished goods inventory 384,588 1,179,800 2,875,683 5,690,191 8,950,532 13,903,427 21,415,148 32,030,798 46,249,987 61,853,845
Equipment spare part inventory 18,907 66,917 171,570 355,163 585,254 951,911 1,540,168 2,413,235 3,647,796 5,113,790 -
Raw material inventory 666,465 2,359,633 6,052,022 12,532,799 20,660,120 33,617,168 54,414,882 85,298,746 128,995,985 180,925,843 -
Total Current Assets 2,185,372 3,263,347 8,427,940 18,604,582 33,353,222 75,004,374 112,714,587 181,432,678 281,107,459 423,687,041 600,468,051
Fixed assets
Land 10,000,000 10,000,000 10,000,000 11,157,625 13,588,638 16,141,201 20,161,488 24,382,789 31,770,066 42,629,364 52,402,731
Building/Infrastructure 22,742,192 21,605,082 20,467,972 23,612,430 31,252,533 38,892,636 51,489,188 64,085,740 87,611,263 122,612,205 151,588,551
Machinery & equipment 4,555,625 4,100,063 3,644,500 8,462,643 18,554,491 28,092,600 43,154,257 57,300,167 83,946,010 123,043,709 152,247,231
Furniture & fixtures 2,010,000 1,809,000 1,608,000 1,563,279 1,674,838 1,769,988 2,028,820 2,260,516 2,862,630 3,833,740 4,511,648
Office vehicles 4,697,875 3,758,300 2,818,725 1,879,150 939,575 7,565,975 6,052,780 4,539,585 3,026,390 1,513,195 -
Office equipment 3,852,500 3,082,000 2,311,500 1,629,558 1,027,319 397,184 610,776 778,234 1,123,304 1,638,670 1,942,010
Total Fixed Assets 47,858,192 44,354,444 40,850,697 48,304,686 67,037,394 92,859,583 123,497,308 153,347,031 210,339,664 295,270,882 362,692,171
Intangible assets
Pre-operation costs 2,462,000 1,969,600 1,477,200 984,800 492,400 - - - - - -
Legal, licensing, & training costs 700,000 630,000 560,000 490,000 420,000 350,000 280,000 210,000 140,000 70,000 -
Total Intangible Assets 3,162,000 2,599,600 2,037,200 1,474,800 912,400 350,000 280,000 210,000 140,000 70,000 -
TOTAL ASSETS 53,205,563 50,217,392 51,315,838 68,384,067 101,303,016 168,213,957 236,491,895 334,989,709 491,587,123 719,027,923 963,160,222
Current liabilities
Accounts payable 575,329 1,832,644 4,349,742 8,350,039 13,175,924 20,548,910 31,757,361 47,503,927 68,144,123 77,408,357
Short term debt - 15,528,242 30,269,399 32,430,081 - - - - - - -
Other liabilities
Total Current Liabilities - 16,103,571 32,102,043 36,779,823 8,350,039 13,175,924 20,548,910 31,757,361 47,503,927 68,144,123 77,408,357
Other liabilities
Deferred tax - - - 1,720,133 3,658,220 5,533,764 8,579,428 11,785,347 17,330,712 25,256,474
Long term debt (Project Loan) - - - - - - - - - - -
Long term debt (Working Capital Loan) - - - - - - - - - - -
Total Long Term Liabilities - - - - 1,720,133 3,658,220 5,533,764 8,579,428 11,785,347 17,330,712 25,256,474
Shareholders' equity
Paid-up capital 53,205,563 53,205,563 53,205,563 64,163,298 87,174,542 118,745,693 136,470,034 151,762,559 178,807,649 211,739,858 211,739,858
Retained earnings (19,091,742) (33,991,768) (32,559,054) 4,058,302 32,634,121 73,939,188 142,890,362 253,490,200 421,813,231 648,755,534
Total Equity 53,205,563 34,113,821 19,213,795 31,604,245 91,232,844 151,379,813 210,409,222 294,652,921 432,297,849 633,553,088 860,495,392
TOTAL CAPITAL AND LIABILITIES 53,205,563 50,217,392 51,315,838 68,384,067 101,303,016 168,213,957 236,491,895 334,989,709 491,587,123 719,027,923 963,160,222
Liabilities & Shareholders' Equity
Assets

Pre-Feasibility Study Olive Oil Extraction Units
February 2017 28
13.3 Cash Flow Statement
Calculations SMEDA
Cash Flow Statement Amount in PKR
Year 0 Year 1 Year 2 Year 3 Year 4 Year 5 Year 6 Year 7 Year 8 Year 9 Year 10
Operating activities
Net profit (19,091,742) (14,900,026) 1,432,715 36,617,356 61,209,939 115,244,254 211,841,536 364,090,039 590,136,261 875,697,838
Add: depreciation expense 3,503,747 3,503,747 3,503,747 4,278,536 5,905,591 7,417,120 10,107,864 12,933,144 17,859,674 25,090,514
amortization of pre-operating costs 492,400 492,400 492,400 492,400 492,400 - - - - -
amortization of training costs 70,000 70,000 70,000 70,000 70,000 70,000 70,000 70,000 70,000 70,000
Deferred income tax - - - 1,720,133 1,938,087 1,875,544 3,045,664 3,205,920 5,545,365 7,925,761
Accounts receivable (452,209) (572,339) (1,816,389) (3,420,090) (4,893,233) (7,036,789) (11,233,813) (17,149,334) (24,669,000) (31,513,864)
Finished goods inventory (384,588) (795,213) (1,695,882) (2,814,508) (3,260,341) (4,952,894) (7,511,721) (10,615,651) (14,219,189) (15,603,858)
Equipment inventory (18,907) (48,011) (104,653) (183,593) (230,091) (366,657) (588,257) (873,067) (1,234,562) (1,465,994) 5,113,790
Raw material inventory (666,465) (1,693,168) (3,692,389) (6,480,776) (8,127,321) (12,957,048) (20,797,714) (30,883,865) (43,697,238) (51,929,858) 180,925,843
Accounts payable 575,329 1,257,315 2,517,098 4,000,298 4,825,885 7,372,985 11,208,451 15,746,566 20,640,196 9,264,234
Cash provided by operations (685,372) (17,028,242) (14,741,158) (2,160,682) 32,586,711 52,964,624 98,604,250 185,771,049 323,348,884 541,967,455 1,056,970,259
Financing activities
Short term debt principal repayment - (15,528,242) (30,269,399) (32,430,081) - - - - - -
Issuance of shares 53,205,563 - - 10,957,735 23,011,244 31,571,150 17,724,342 15,292,525 27,045,090 32,932,209 -
Purchase of (treasury) shares
Cash provided by / (used for) financing activities 53,205,563 - (15,528,242) (19,311,664) (9,418,837) 31,571,150 17,724,342 15,292,525 27,045,090 32,932,209 -
Investing activities
Capital expenditure (51,020,192) - - (10,957,735) (23,011,244) (31,727,781) (38,054,845) (39,957,587) (69,925,777) (102,790,892) (92,511,803)
Acquisitions
Cash (used for) / provided by investing activities (51,020,192) - - (10,957,735) (23,011,244) (31,727,781) (38,054,845) (39,957,587) (69,925,777) (102,790,892) (92,511,803)
NET CASH 1,500,000 (17,028,242) (30,269,399) (32,430,081) 156,630 52,807,993 78,273,747 161,105,987 280,468,197 472,108,771 964,458,456

Pre-Feasibility Study Olive Oil Extraction Units
February 2017 29
13.4 Expected Yield of Olive Fruit (Year Wise)
Estimated
Production
Expected Yield
Tons
Tree Age
(1 Year)
Tree Age
(2 Year)
Tree Age
(3 Year)
Tree Age
(4 Year)
Tree Age
(5 Year)
Tree Age
(6 Year)
Tree Age
(7 Year)
Tree Age
(8 Year)
Tree Age
(9 Year)
Tree Age
(10 Year)
Tree Age
(11 Year)
Tree Age
(12 Year)
Tree Age
(13 Year)
Tree Age
(14 Year)
Tree Age
(15 Year)
Tree Age
(16 Year)
Current 6.15 - - - - - 6,152 - -
Year 1 189.07 - - - - - 173,688 15,380 - -
Year 2 606.96 - - - - - 141,980 434,220 30,760 - -
Year 3 1,411.51 - - - - - 141,980 354,950 868,440 46,140 - -
Year 4 2,650.28 - - - - - 236,632 354,950 709,900 1,302,660 46,140 - -
Year 5 3,961.23 - - - - - 246,098 591,580 709,900 1,064,850 1,302,660 46,140 - -
Year 6 5,843.91 - - - - - 567,000 615,245 1,183,160 1,064,850 1,064,850 1,302,660 46,140 - -
Year 7 8,576.23 - - - - - 675,000 1,417,500 1,230,490 1,774,740 1,064,850 1,064,850 1,302,660 46,140 - -
Year 8 12,188.48 - - - - - 567,000 1,687,500 2,835,000 1,845,735 1,774,740 1,064,850 1,064,850 1,302,660 46,140 - -
Year 9 16,710.98 - - - - - 567,000 1,417,500 3,375,000 4,252,500 1,845,735 1,774,740 1,064,850 1,064,850 1,302,660 46,140 -
Year 10 21,248.86 - - - - - 567,000 1,417,500 2,835,000 5,062,500 4,252,500 1,845,735 1,774,740 1,064,850 1,064,850 1,302,660 61,520
13.5 Processing Facilities Requirement
Processing Facilities Requirement Initial Year Year 1 Year 2 Year 3 Year 4 Year 5 Year 6 Year 7 Year 8 Year 9 Year 10
Expected Available Fruit (Tons) 189.07 606.96 1,411.51 2,650.28 3,961.23 5,843.91 8,576.23 12,188.48 16,710.98 21,248.86
Processed by this Facility (Tons) for Oil 75.63 242.78 564.60 1,060.11 1,584.49 2,337.56 3,430.49 4,875.39 6,684.39 8,499.54
Facilities According to Capacity (accumulated) 1 1 1 2 4 6 9 12 17 24 30
Facilities Required (Year Wise) 1 - - 1 2 2 3 3 5 7 6
13.6 Projected Capital Expenditure
Capital Expenditure Capital Cost
Growth Rate
Accumulated
(PKR) Initial Year Year 1 Year 2 Year 3 Year 4 Year 5 Year 6 Year 7 Year 8 Year 9 Year 10
Land 5% 52,402,731 10,000,000 - - 1,157,625 2,431,013 2,552,563 4,020,287 4,221,301 7,387,277 10,859,298 9,773,368
Building/Infrastructure 5% 179,572,029 22,742,192 - - 4,281,567 8,991,291 9,440,856 14,869,347 15,612,815 27,322,426 40,163,966 36,147,570
Machinery & equipment 5% 197,726,568 4,555,625 - - 5,273,705 11,074,781 11,628,520 18,314,920 19,230,666 33,653,665 49,470,887 44,523,799
Furniture & fixtures 5% 7,734,369 2,010,000 - - 156,279 328,187 344,596 542,739 569,876 997,282 1,466,005 1,319,405
Office vehicles 10% 12,263,850 4,697,875 - - - - 7,565,975 - - - - -
Office equipment 5% 7,096,309 3,852,500 - - 88,558 185,972 195,271 307,552 322,930 565,127 830,736 747,663
Pre-operating costs 2,462,000 2,462,000 - - - - - - - - - -
Training costs 700,000 700,000 - - - - - - - - - -
Total Capital Costs 459,957,856 51,020,192 - - 10,957,735 23,011,244 31,727,781 38,054,845 39,957,587 69,925,777 102,790,892 92,511,803

Pre-Feasibility Study Olive Oil Extraction Units
February 2017 30
13.7 Projected Revenue
Description Basis Year 1 Year 2 Year 3 Year 4 Year 5 Year 6 Year 7 Year 8 Year 9 Year 10
Expected Fruit Available for Processing (Tons) 189.07 606.96 1,411.51 2,650.28 3,961.23 5,843.91 8,576.23 12,188.48 16,710.98 21,248.86
Processed by these Facilities for Oil (Tons) 40% 75.63 242.78 564.60 1,060.11 1,584.49 2,337.56 3,430.49 4,875.39 6,684.39 8,499.54
Olive Oil to be Extracted (Liters) 15,125 48,557 112,921 212,023 316,898 467,512 686,098 975,078 1,336,878 1,699,908
Revenue CalculationProduction
Percentage
0.5 Liter Packing 50% 15,125 48,557 112,921 212,023 316,898 467,512 686,098 975,078 1,336,878 1,699,908
1.0 Liter Packing 40% 6,050 19,423 45,168 84,809 126,759 187,005 274,439 390,031 534,751 679,963
4.0 Liter Packing 10% 378 1,214 2,823 5,301 7,922 11,688 17,152 24,377 33,422 42,498
Total No. of Bottles / Packing 21,554 69,193 160,912 302,132 451,580 666,205 977,690 1,389,486 1,905,051 2,422,369
Sale Price per Bottle / PackingGrowth in
Sale Price
0.5 Liter Packing 10% 375 413 454 499 549 604 664 731 804 884
1.0 Liter Packing 10% 650 715 787 865 952 1,047 1,152 1,267 1,393 1,533
4.0 Liter Packing 10% 2,100 2,310 2,541 2,795 3,075 3,382 3,720 4,092 4,502 4,952
Revenue from Olive Oil
0.5 Liter Packing 5,672,040 20,029,680 51,237,813 105,825,760 173,989,017 282,350,023 455,799,438 712,556,690 1,074,643,770 1,503,110,658
1.0 Liter Packing 3,932,614 13,887,245 35,524,884 73,372,527 120,632,385 195,762,683 316,020,944 494,039,305 745,086,347 1,042,156,723
4.0 Liter Packing 794,086 2,804,155 7,173,294 14,815,606 24,358,462 39,529,003 63,811,921 99,757,937 150,450,128 210,435,492
Revenue from Sale of Olive Oil Packing (A) 10,398,740 36,721,080 93,935,991 194,013,894 318,979,865 517,641,709 835,632,303 1,306,353,931 1,970,180,246 2,755,702,872
Revenue from Olive Cake (Waste) Basis
Olive Cake to be Sold (Kgs) 80% 60,501.76 194,227.20 451,683.20 848,090.24 1,267,592.96 1,870,049.60 2,744,393.60 3,900,312.00 5,347,512.00 6,799,633.60
Sale Price per Kg of Olive Cake 10% 10.00 11.00 12.10 13.31 14.64 16.11 17.72 19.49 21.44 23.58
Revenue from Sale of Olive Cake (B) 605,018 2,136,499 5,465,367 11,288,081 18,558,829 30,117,336 48,618,607 76,006,047 114,628,669 160,331,803
Total Revenue in PKR (A+B) 11,003,758 38,857,579 99,401,357 205,301,975 337,538,694 547,759,045 884,250,909 1,382,359,978 2,084,808,915 2,916,034,676

Pre-Feasibility Study Olive Oil Extraction Units
February 2017 31
13.8 Projected Cost of Goods Sold
Description Basis Year 1 Year 2 Year 3 Year 4 Year 5 Year 6 Year 7 Year 8 Year 9 Year 10
Facilities Required according to Capacity (accumulated) 1 1 2 4 6 9 12 17 24 30
Expected Fruit Available for Processing (Tons) 189.07 606.96 1,411.51 2,650.28 3,961.23 5,843.91 8,576.23 12,188.48 16,710.98 21,248.86
Processed by these Facilities for Oil (Tons) 40% 75.63 242.78 564.60 1,060.11 1,584.49 2,337.56 3,430.49 4,875.39 6,684.39 8,499.54
Raw Material Cost / UnitGrowth in
Cost
Olive Fruit Purchase Price (PKR/Ton) 5% 95,000 99,750 104,738 109,974 115,473 121,247 127,309 133,675 140,358 147,376
Transportation Cost - Freight in (PKR/Ton) 5% 5,000 5,250 5,513 5,788 6,078 6,381 6,700 7,036 7,387 7,757
Daily Wages - Seasonal (PKR/Ton) 10% 750 825 908 998 1,098 1,208 1,329 1,462 1,608 1,768
Packing Cost (PKR/Packing)
0.5 Liter Packing 5% 12.50 13.13 13.78 14.47 15.19 15.95 16.75 17.59 18.47 19.39
1.0 Liter Packing 5% 25.00 26.25 27.56 28.94 30.39 31.91 33.50 35.18 36.94 38.78
4.0 Liter Packing 5% 100.00 105.00 110.25 115.76 121.55 127.63 134.01 140.71 147.75 155.13
Per Processing Facility Human Resource Cost (PKR) 10% 684,000 752,400 827,640 910,404 1,001,444 1,101,589 1,211,748 1,332,922 1,466,215 1,612,836
Cost of Goods Sold (Year Wise)
Olive Fruit Cost 7,184,584 24,217,704 59,135,211 116,585,243 182,966,101 283,421,792 436,732,801 651,715,516 938,209,397 1,252,630,036
Transportation Cost - Freight in 378,136 1,274,616 3,112,380 6,136,065 9,629,795 14,916,936 22,985,937 34,300,817 49,379,442 65,927,897
Daily Wages - Seasonal 56,720 200,297 512,378 1,058,258 1,739,890 2,823,500 4,557,994 7,125,567 10,746,438 15,031,107
Packing Cost 378,136 1,274,616 3,112,380 6,136,065 9,629,795 14,916,936 22,985,937 34,300,817 49,379,442 65,927,897
Processing Facilities Human Resource Cost 684,000 752,400 1,655,280 3,641,616 6,008,666 9,914,300 14,540,973 22,659,682 35,189,154 48,385,087
Total HR and Raw Material Cost (PKR) 8,681,576 27,719,633 67,527,629 133,557,247 209,974,247 325,993,464 501,803,641 750,102,399 1,082,903,873 1,447,902,023
Pre-Feasibility Study Olive Oil Extraction Units
February 2017 32
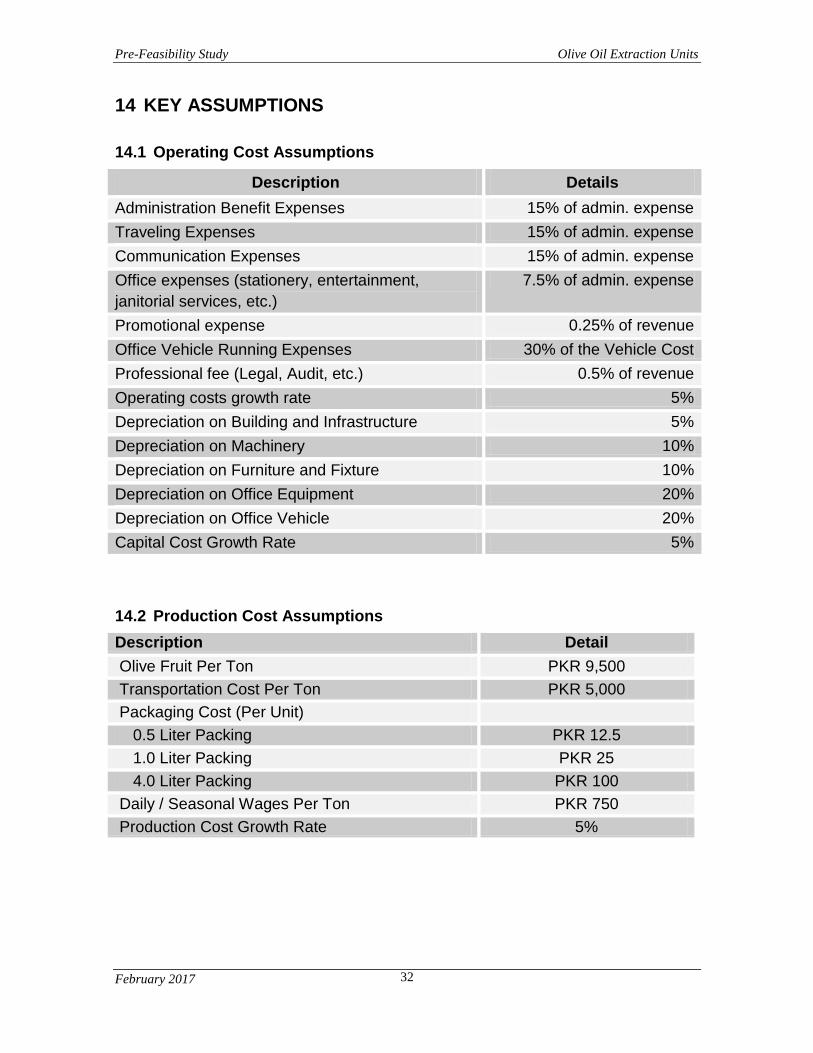
14 KEY ASSUMPTIONS
14.1 Operating Cost Assumptions
Description Details
Administration Benefit Expenses 15% of admin. expense
Traveling Expenses 15% of admin. expense
Communication Expenses 15% of admin. expense
Office expenses (stationery, entertainment,
janitorial services, etc.)
7.5% of admin. expense
Promotional expense 0.25% of revenue
Office Vehicle Running Expenses 30% of the Vehicle Cost
Professional fee (Legal, Audit, etc.) 0.5% of revenue
Operating costs growth rate 5%
Depreciation on Building and Infrastructure 5%
Depreciation on Machinery 10%
Depreciation on Furniture and Fixture 10%
Depreciation on Office Equipment 20%
Depreciation on Office Vehicle 20%
Capital Cost Growth Rate 5%
14.2 Production Cost Assumptions
Description Detail
Olive Fruit Per Ton PKR 9,500
Transportation Cost Per Ton PKR 5,000
Packaging Cost (Per Unit)
0.5 Liter Packing PKR 12.5
1.0 Liter Packing PKR 25
4.0 Liter Packing PKR 100
Daily / Seasonal Wages Per Ton PKR 750
Production Cost Growth Rate 5%

Pre-Feasibility Study Olive Oil Extraction Units
February 2017 33
14.3 Revenue Assumptions
Description Detail
0.5 Liter Packing PKR 375
1.0 Liter Packing PKR 650
4.0 Liter Packing PKR 2,100
Growth in Sales Price 10%
Days Operational / Year for Head Office 330
Days Operational / Year for Processing Facilities 60
Hours Operational / Day for Processing Facility 24
Operational Hours of the Season for Processing Facility 1,440
14.4 Cash Flow Assumptions
Description Detail
Accounts receivable cycle (in days) 15
Accounts payable cycle (in days) 20
Raw material inventory (in days) 30
Finished goods inventory (in days) 15
14.5 Olive Trees Yield
Life of Olive Tree Expected Yield
(Kgs/Plant)
Year 1 ~5 -
Year 6 2.00
Year 7 5.00
Year 8 10.00
Year 9 ~16 15.00
Year 17 ~25 20.00

Pre-Feasibility Study Olive Oil Extraction Units
February 2017 34
15 SENSITIVITY ANALYSIS
Sensitivity analysis determines how much the output is expected to change due to
change in a variable. It refers to an analysis of how each of the input variables in a
capital budgeting decision (such as discount rate, cash flows growth rate, tax rate,
raw material cost, sale price, etc.) affect the net present value, IRR, payback,
breakeven or any other output. In other words, sensitivity analysis finds out how
sensitive an output is to any change in an input while keeping other inputs
constant.
For the sake of this Pre-feasibility study, sensitivity analysis for change in raw
material cost and sale price is tested in the following sections, to see the projected
outcomes so that appropriate decisions or actions could be taken before investing
in this project.
15.1 Raw Material Cost Sensitivity Analysis
The following sensitivity analysis is done with the assumption that all other factors
will be constant except Raw Material Cost (Olive Fruit). The results are given in
the table below;
Changes in Cost
Raw Material (Olive Fruit) Price (Rs. /
Kg)
Breakeven (Quantity)
NPV (PKR) IRR (%age) Pay Back (Years)
-20% 76 371 Tons 429,481,089 49% 5.48
-15% 81 406 Tons 392,561,296 47% 5.78
-10% 86 448 Tons 355,641,504 44% 6.07
-5% 90 500 Tons 318,721,712 42% 6.28
0% 95 565 Tons 281,801,919 39% 6.53
5% 100 649 Tons 238,349,951 36% 6.94
10% 105 763 Tons 194,533,030 33% 7.25
15% 109 926 Tons 150,716,108 30% 7.62
20% 114 1,178 Tons 101,372,005 27% 8.09

Pre-Feasibility Study Olive Oil Extraction Units
February 2017 35

Pre-Feasibility Study Olive Oil Extraction Units
February 2017 36
The above table and graphs show that if the raw material (olive fruit) cost decreses
by 5% upto 20%, on avaerage, project IRR, NPV and Payback will improve by 6%,
11% and 4% respectively. On the other hand if the raw material cost increases by
the same rate, there will be a decrease in IRR and NPV by 9% and 22%
respectively whereas Payback will be increased by 6%. If the raw material cost
increases by 20% from its current cost, the project needs to process 1,178 tons of
olive fruit in order to achieve its breakeven, otherwise, there is a chance that cash
flows would be negative for next 5 years which means that project has to arrange
additional funds in shape of equity or debt financing.
Hence, it is better to procure the raw material on cheaper prices in order to
achieve sustainable profitibility from the project.
Pre-Feasibility Study Olive Oil Extraction Units
February 2017 37
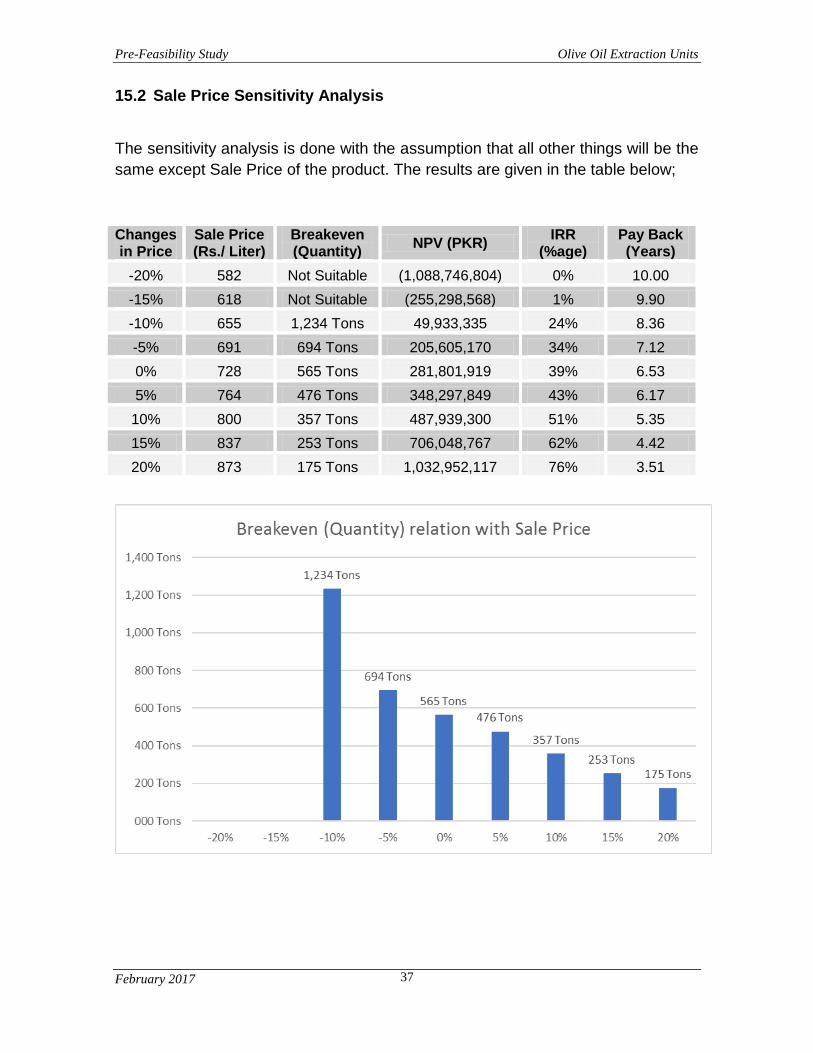
15.2 Sale Price Sensitivity Analysis
The sensitivity analysis is done with the assumption that all other things will be the
same except Sale Price of the product. The results are given in the table below;
Changes in Price
Sale Price (Rs./ Liter)
Breakeven (Quantity)
NPV (PKR) IRR
(%age) Pay Back (Years)
-20% 582 Not Suitable (1,088,746,804) 0% 10.00
-15% 618 Not Suitable (255,298,568) 1% 9.90
-10% 655 1,234 Tons 49,933,335 24% 8.36
-5% 691 694 Tons 205,605,170 34% 7.12
0% 728 565 Tons 281,801,919 39% 6.53
5% 764 476 Tons 348,297,849 43% 6.17
10% 800 357 Tons 487,939,300 51% 5.35
15% 837 253 Tons 706,048,767 62% 4.42
20% 873 175 Tons 1,032,952,117 76% 3.51

Pre-Feasibility Study Olive Oil Extraction Units
February 2017 38
The above table and graphs show that if the sale price of the olive oil decreses to
15%, the project NPV will be negative and payback will also be too high. Therfore,
it is better to ensure the quality of olive oil in order to be competitive in the market,
hence enabling to keep the sale price constant. On the other hand, if the sale price
is increased, it will be good for the project. Under the ideal circumstances, if the
price increases by 20%, IRR will be 76% and the project will return its whole
investment in just 3.51 years.