practical rnapractical rna-seq...
TRANSCRIPT
Practical RNA Seq analysisPractical RNA-Seq analysis
BaRC Hot Topics – February 2014
George W. Bell, Ph.D.http://jura.wi.mit.edu/bio/education/hot_topics/
Why do RNA Seq?Why do RNA-Seq?
• RNA-Seq includes experiments to– Profile abundance of mRNA and other RNAs– Identify alternated spliced transcript isoforms– Identify "differentially expressed" genesy y p g– Identify variants in transcribed regions of genome
2
Today's outlineToday s outline
• Experimental design• Quality control• Sequence preparation
Included in hands-on exercisesq p p
• Mapping spliced reads• Counting gene levels• Counting gene levels• Normalization and identifying "differentially
d"expressed" genes• Creating figures and summaries
3
Hands on exercisesHands-on exercises
• All data is in /nfs/BaRC_Public/Hot_Topics/RNAseq_Feb2014
• Create directories on tak• Link to data files on BaRC_Public
• See handout for series of commands (step 0)
• Commands can be copied from filepRNA-seq_Feb_2014.commands.txt
4
Experimental designExperimental designReplication is essential• Replication is essential.
• With the combination of high numbers of reads per sample g p pand multiplexing, the number of Illumina lanes can be much fewer than number of samples.
• Lots of details to think about:– Has someone already done an experiment like this?– Total RNA or poly(A) RNA orTotal RNA or poly(A) RNA or …– Number of samples?– Read length?– Paired or unpaired reads?Paired or unpaired reads?– Number of reads?– What reference genome to use?– Stranded or unstranded?– Stranded or unstranded?– What reference transcriptome to use?
5
Experimental designExperimental design
• Lots of data typically cannot make up for a poor yp y p pexperiment.
• Look out for bias and confounding.
• Short-read sequencing requires an effectively designed experiment.
6
Design of sample experimentDesign of sample experiment
• How does "gene expression" (really: transcript levels) differ between European and Africans?
• European samples (n=2) Montgomery et al., 2010
– 37nt paired-end reads
• African samples (n=2) Pickrell et al., 2010
46nt single end reads– 46nt single-end reads
• Sample data contains about 10% of total readsp
• What is good and bad about this design?
7
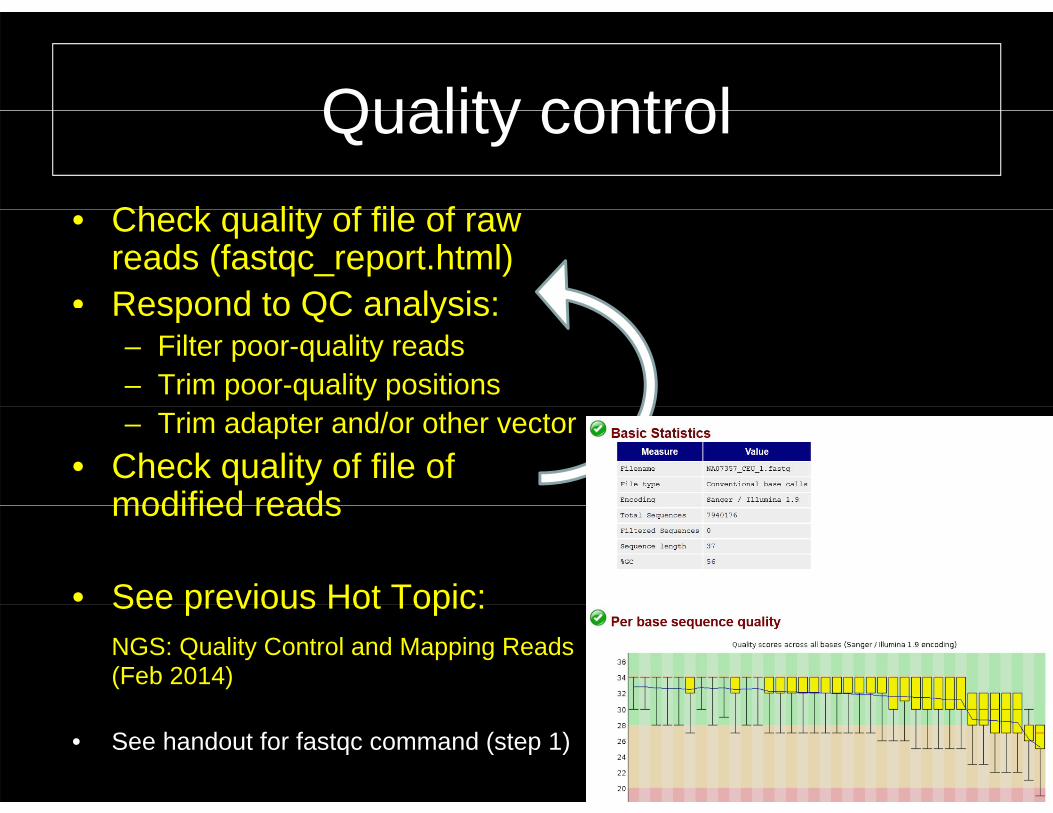
Quality controlQuality controlCh k lit f fil f• Check quality of file of raw reads (fastqc_report.html)
• Respond to QC analysis:Respond to QC analysis:– Filter poor-quality reads – Trim poor-quality positions– Trim adapter and/or other vector
• Check quality of file of modified readsmodified reads
• See previous Hot Topic:See previous Hot Topic:NGS: Quality Control and Mapping Reads (Feb 2014)
• See handout for fastqc command (step 1) 8
Responding to quality issuesResponding to quality issuesM th d 1• Method 1: – Keep all reads as is
M ibl– Map as many as possible
M th d 2• Method 2:– Drop all poor-quality reads
Trim poor quality bases– Trim poor-quality bases– Map only good-quality bases
• Which makes more sense for your experiment?
9
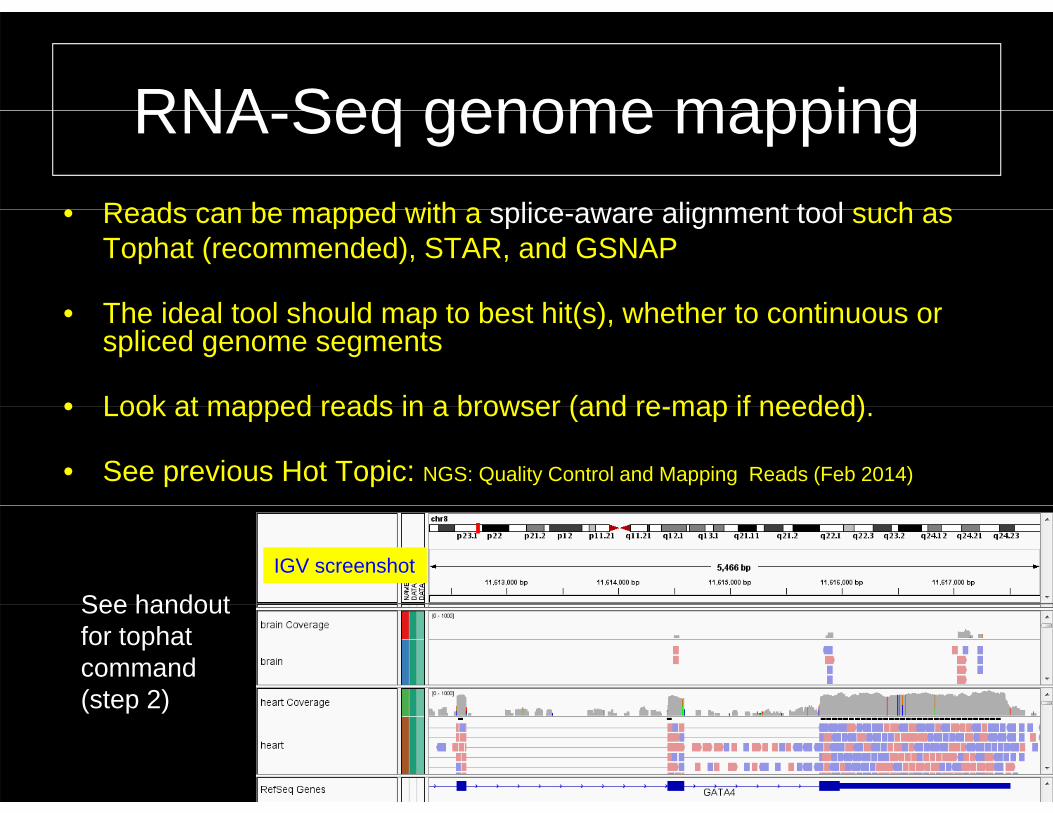
RNA Seq genome mappingRNA-Seq genome mapping• Reads can be mapped with a splice aware alignment tool such as• Reads can be mapped with a splice-aware alignment tool such as
Tophat (recommended), STAR, and GSNAP
The ideal tool should map to best hit(s) whether to continuous or• The ideal tool should map to best hit(s), whether to continuous or spliced genome segments
• Look at mapped reads in a browser (and re map if needed)• Look at mapped reads in a browser (and re-map if needed).
• See previous Hot Topic: NGS: Quality Control and Mapping Reads (Feb 2014)
See handoutIGV screenshot
See handout for tophatcommand (step 2)
10
(step 2)
Mapping considerationsMapping considerations
• Type of quality score encoding?yp q y g• Use all or just canonical chromosomes?• Include known splice junctions (in GTF file)?• Include known splice junctions (in GTF file)?• Look for novel splice junctions?• How short of a sub-read should map to an exon
boundary?• How long are your introns?
11
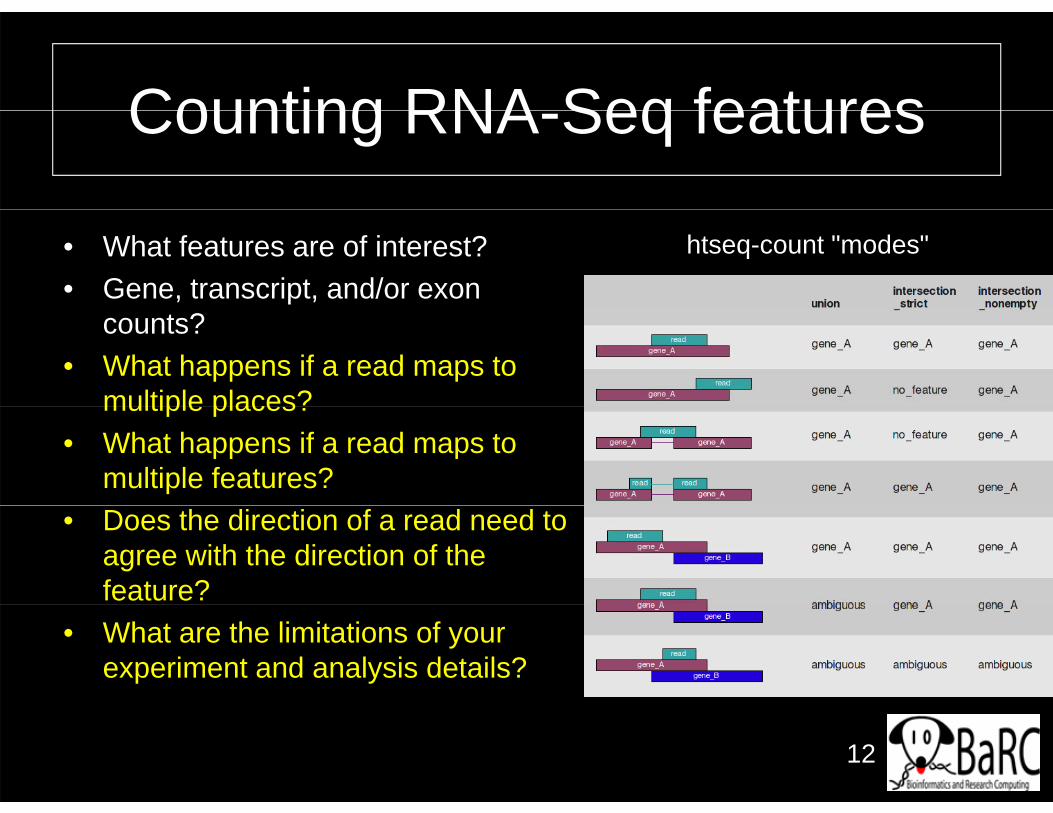
Counting RNA Seq featuresCounting RNA-Seq features
• What features are of interest?• Gene, transcript, and/or exon
htseq-count "modes""
counts?• What happens if a read maps to
multiple places?multiple places?• What happens if a read maps to
multiple features?• Does the direction of a read need to
agree with the direction of the feature?
• What are the limitations of your experiment and analysis details?
12
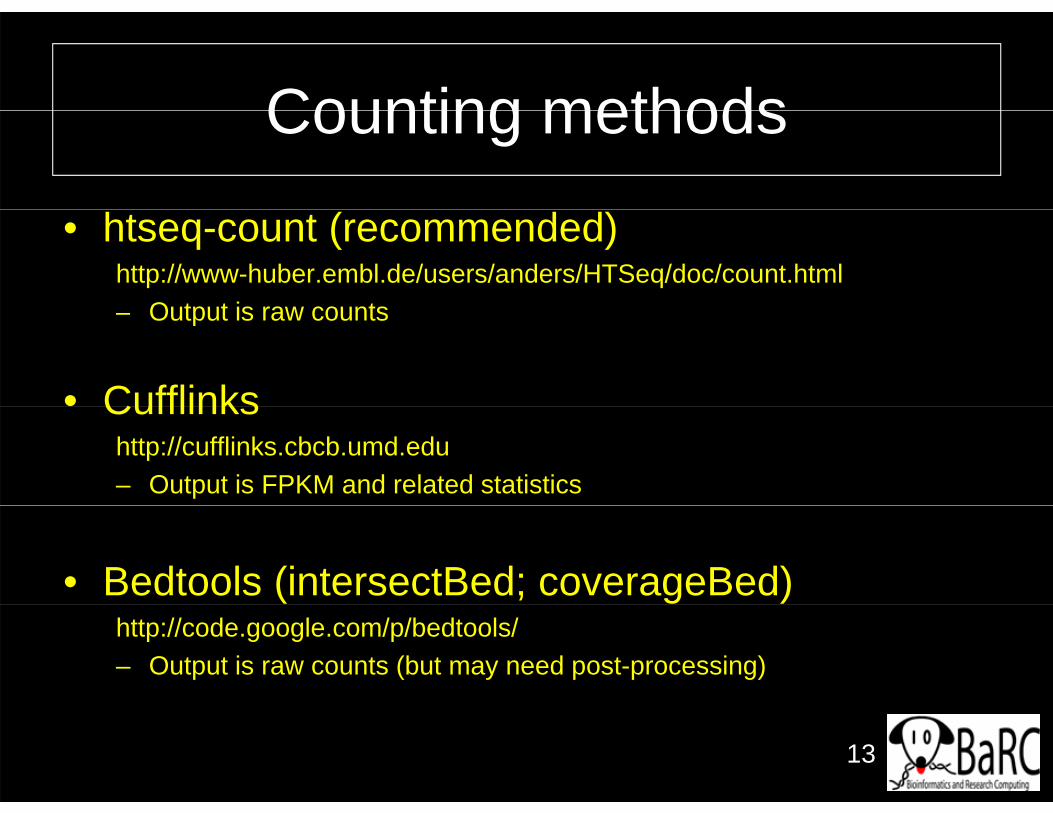
Counting methodsCounting methods
• htseq-count (recommended)http://www-huber.embl.de/users/anders/HTSeq/doc/count.html
Output is raw counts– Output is raw counts
• CufflinksCufflinks http://cufflinks.cbcb.umd.edu– Output is FPKM and related statistics
• Bedtools (intersectBed; coverageBed)http://code.google.com/p/bedtools/– Output is raw counts (but may need post-processing)
13
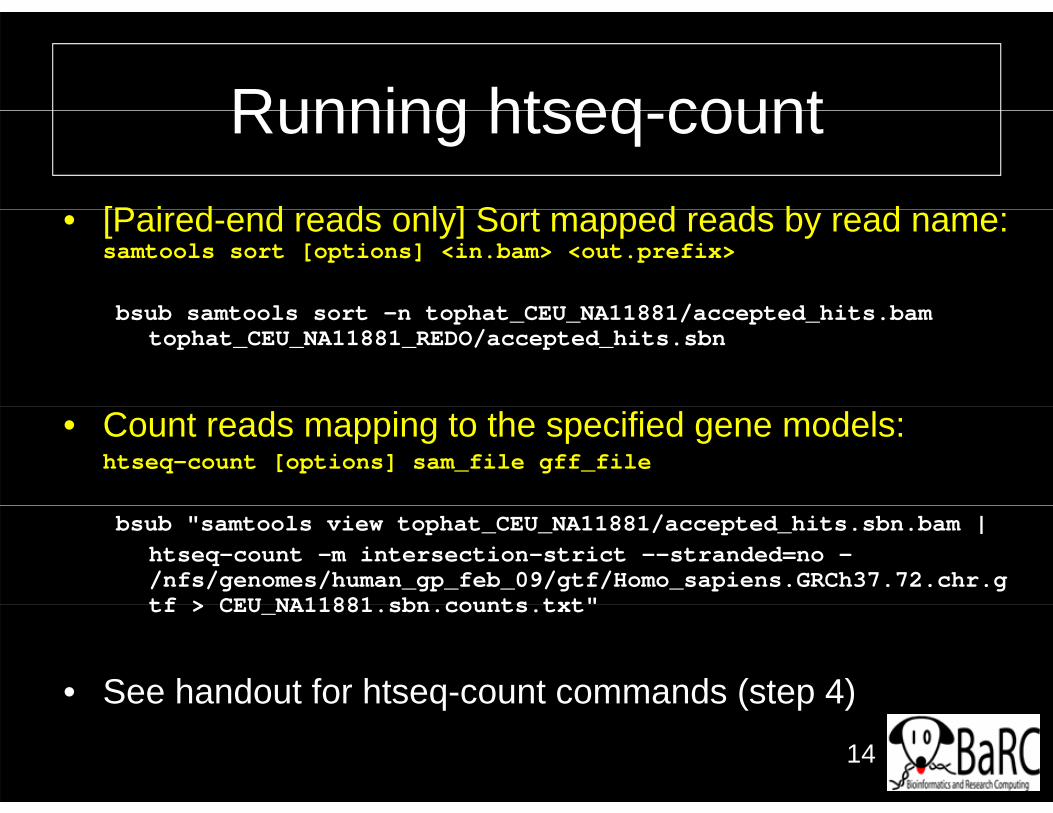
Running htseq countRunning htseq-count[P i d d d l ] S t d d b d• [Paired-end reads only] Sort mapped reads by read name: samtools sort [options] <in.bam> <out.prefix>
b b t l t t h t CEU NA11881/ t d hit bbsub samtools sort –n tophat_CEU_NA11881/accepted_hits.bam tophat_CEU_NA11881_REDO/accepted_hits.sbn
• Count reads mapping to the specified gene models: htseq-count [options] sam_file gff_file
bsub "samtools view tophat_CEU_NA11881/accepted_hits.sbn.bam | htseq-count -m intersection-strict --stranded=no -/nfs/genomes/human_gp_feb_09/gtf/Homo_sapiens.GRCh37.72.chr.gtf > CEU NA11881 sbn counts txt"tf > CEU_NA11881.sbn.counts.txt
• See handout for htseq-count commands (step 4)See handout for htseq count commands (step 4)
14
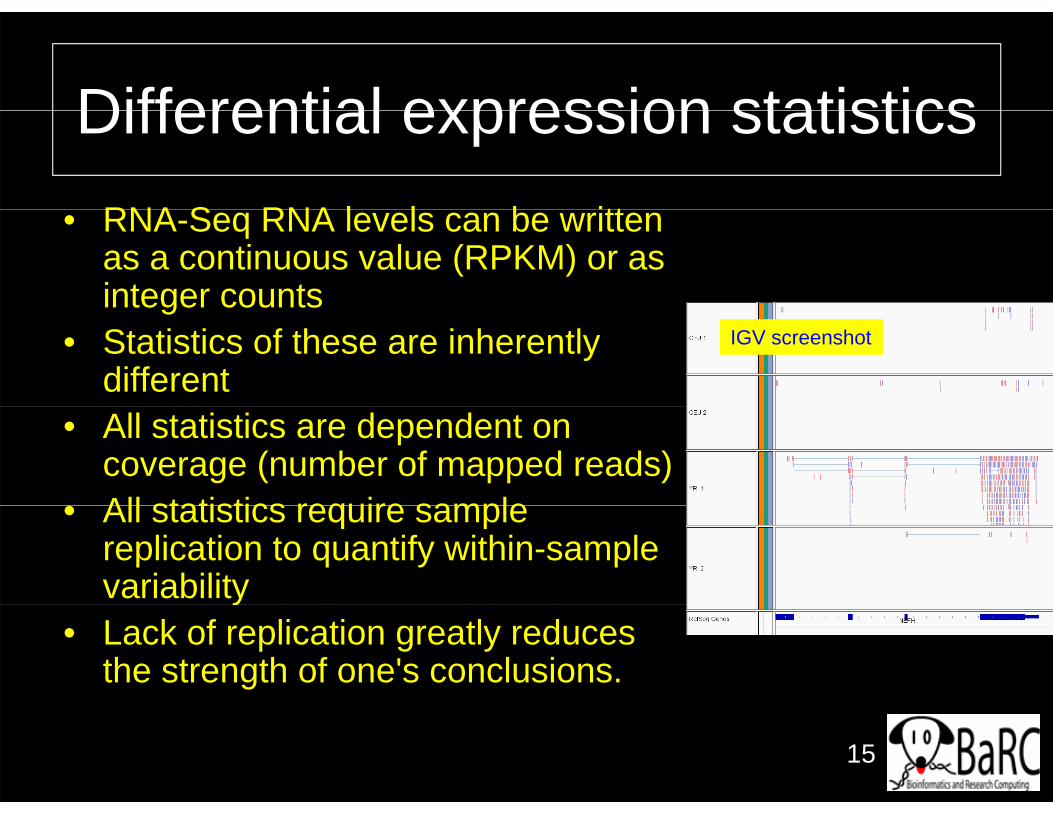
Differential expression statisticsDifferential expression statisticsRNA S RNA l l b itt• RNA-Seq RNA levels can be written as a continuous value (RPKM) or as integer countsg
• Statistics of these are inherently different
IGV screenshot
• All statistics are dependent on coverage (number of mapped reads)All statistics require sample• All statistics require sample replication to quantify within-sample variabilityy
• Lack of replication greatly reduces the strength of one's conclusions.
15
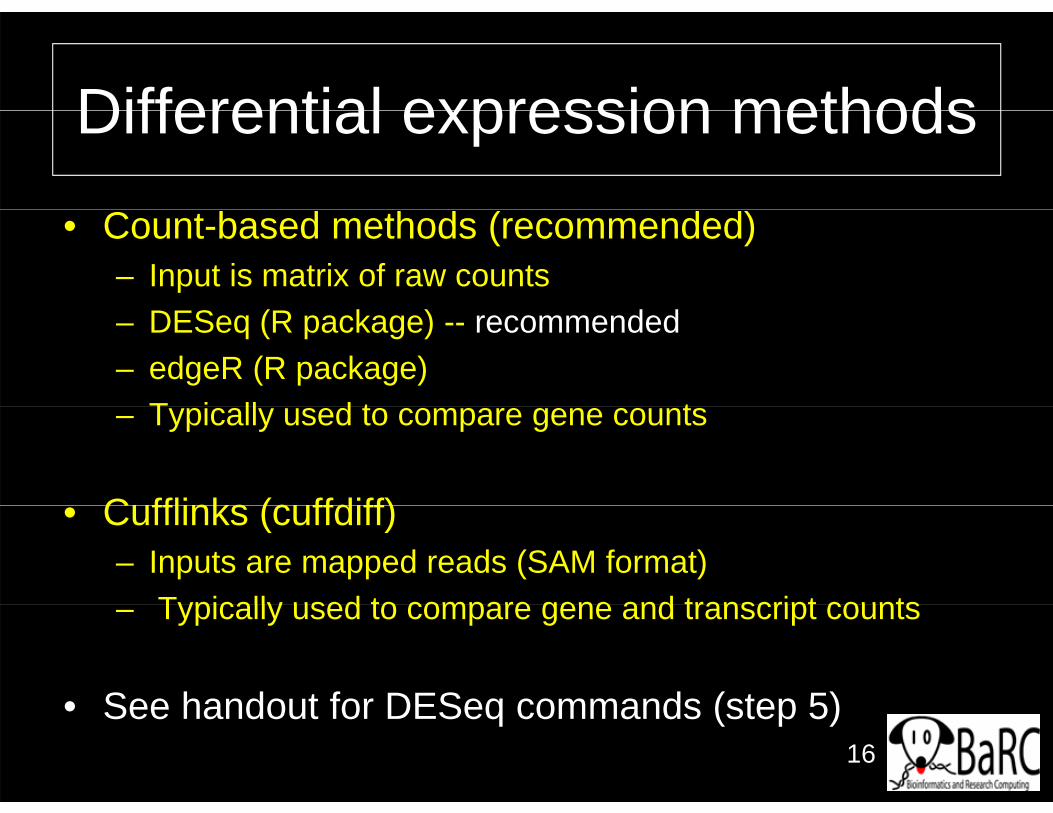
Differential expression methodsDifferential expression methods• Count-based methods (recommended)
– Input is matrix of raw counts– DESeq (R package) -- recommended– edgeR (R package)
T i ll d t t– Typically used to compare gene counts
Cufflinks (cuffdiff)• Cufflinks (cuffdiff)– Inputs are mapped reads (SAM format)
Typically used to compare gene and transcript counts– Typically used to compare gene and transcript counts
• See handout for DESeq commands (step 5)• See handout for DESeq commands (step 5)16
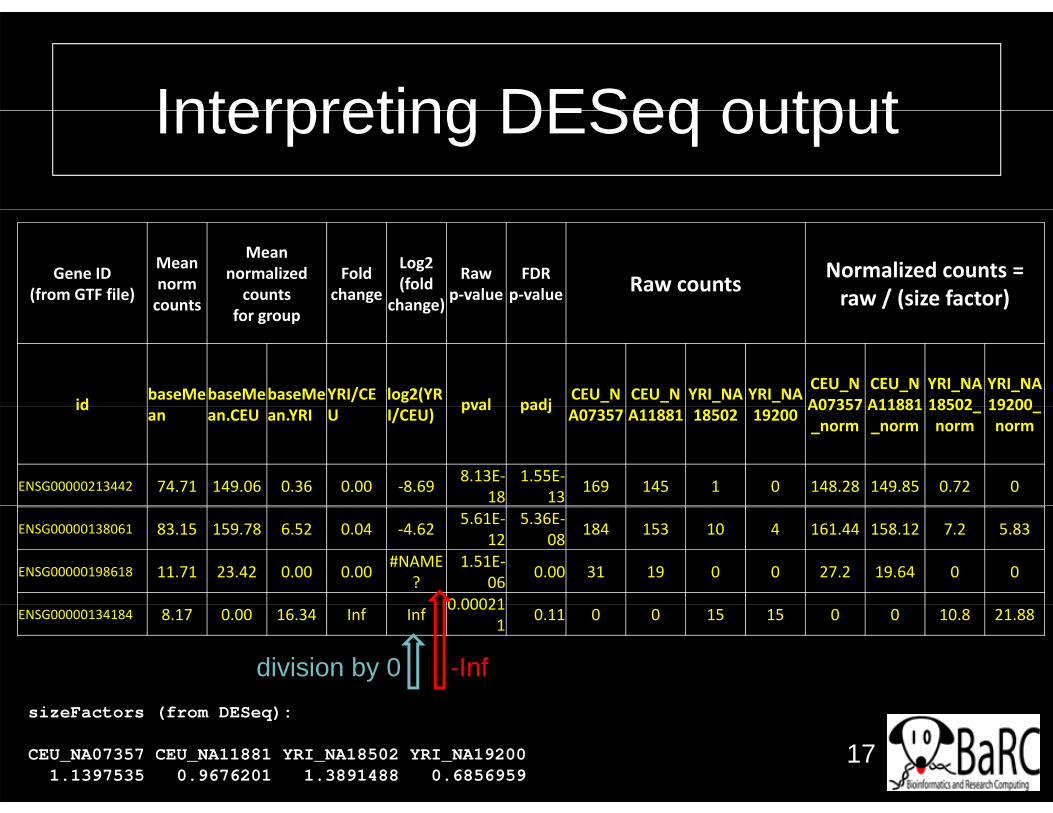
Interpreting DESeq outputInterpreting DESeq output
Gene ID(from GTF file)
Mean normcounts
Mean normalized counts
Fold change
Log2 (fold
change)
Raw p‐value
FDR p‐value Raw counts Normalized counts =
raw / (size factor)counts for group change) / ( )
id baseMebaseMebaseMeYRI/CE log2(YR pval padj CEU_N CEU_N YRI_NA YRI_NA CEU_NA07357
CEU_NA11881
YRI_NA18502
YRI_NA19200id an an.CEU an.YRI U I/CEU) pval padj A07357 A11881 18502 19200 A07357
_normA11881_norm
18502_norm
19200_norm
ENSG00000213442 74.71 149.06 0.36 0.00 ‐8.69 8.13E‐18
1.55E‐13 169 145 1 0 148.28 149.85 0.72 0
ENSG00000138061 83.15 159.78 6.52 0.04 ‐4.62 5.61E‐12
5.36E‐08 184 153 10 4 161.44 158.12 7.2 5.83
ENSG00000198618 11.71 23.42 0.00 0.00 #NAME?
1.51E‐06 0.00 31 19 0 0 27.2 19.64 0 0
0 00021ENSG00000134184 8.17 0.00 16.34 Inf Inf 0.00021
1 0.11 0 0 15 15 0 0 10.8 21.88
division by 0 -Inf
17
sizeFactors (from DESeq):
CEU_NA07357 CEU_NA11881 YRI_NA18502 YRI_NA192001.1397535 0.9676201 1.3891488 0.6856959
Differential expression issuesDifferential expression issuesGi th t t ti ti• Given that statistics are – based on complex models
i fl d b l bi l– influenced by even more complex biologyThe p-values may not be accurate but can be very
effective at ranking geneseffective at ranking genes
• Statistics don't work very well when one sample• Statistics don t work very well when one sample has no counts.
• You have to choose appropriate thresholds.
18
Presenting resultsPresenting results• What do you want to show?
• All microarray-type figures are possible
• All-gene scatterplots can be helpful to– See level and fold-change ranges
Id tif ibl th h ld– Identify sensible thresholds– Hint at data or analysis problems
• Heatmaps are useful if many conditions are being compared but only for p y g p ygene subsets
• Output normalized read counts with same method used for DE statistics
• Whenever one gene is especially important, look at the mapped reads in a genome browser
19
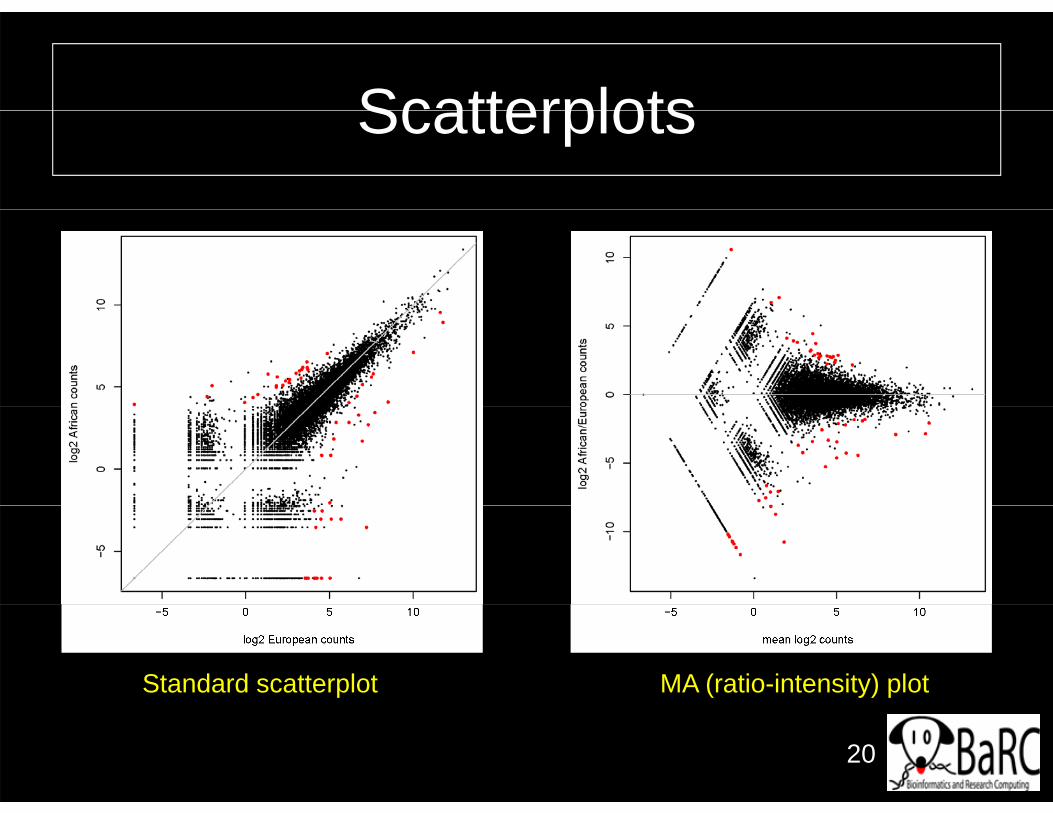
ScatterplotsScatterplots
Standard scatterplot MA (ratio-intensity) plot
20
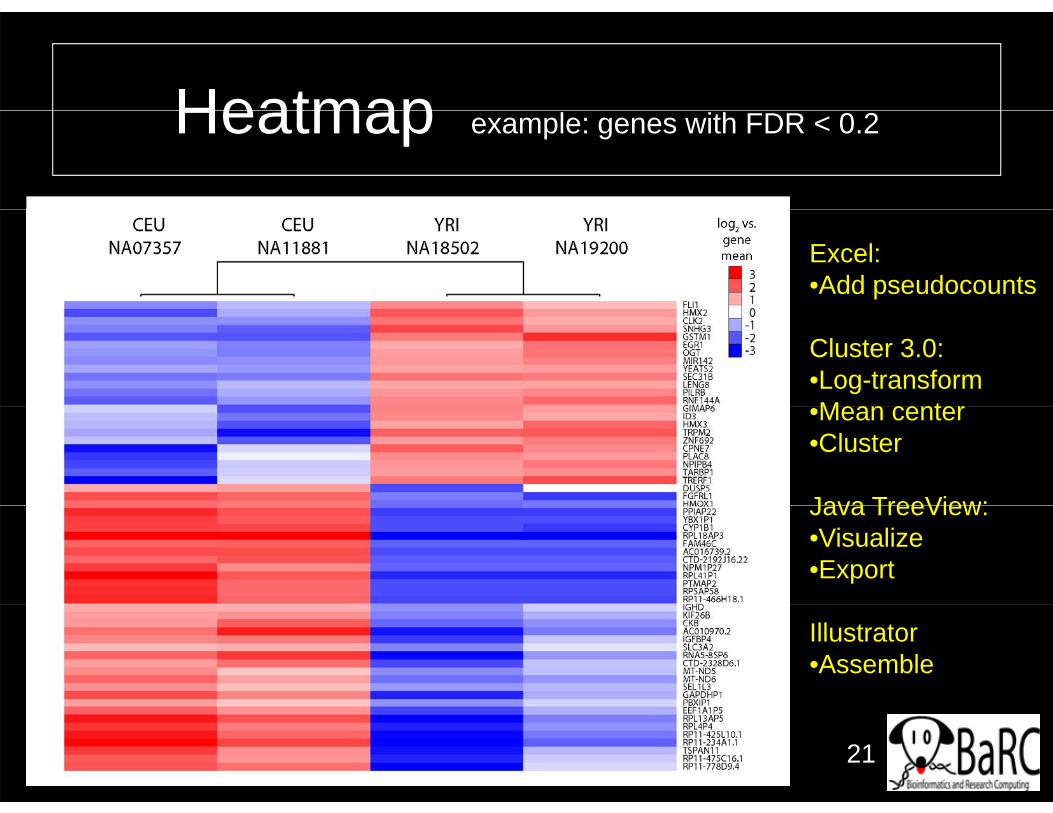
HeatmapHeatmap example: genes with FDR < 0.2
Excel:•Add pseudocounts
Cluster 3.0:•Log-transformMean center•Mean center
•Cluster
Java TreeView:Java TreeView:•Visualize•Export
Illustrator•Assemble
21
SummarySummary
• Experimental designQ alit control (fastqc)• Quality control (fastqc)
• Sequence preparationM i li d d (t h t)• Mapping spliced reads (tophat)
• Counting gene levels (htseq-count)N li ti d id tif i "diff ti ll• Normalization and identifying "differentially expressed" genes (DESeq R package)
• Creating figures and summaries• Creating figures and summaries• Keep your commands and rationales for them!
22
ResourcesResources
• Previous Hot Topics (http://jura.wi.mit.edu/bio/education/hot_topics/)
• An introduction to R and Bioconductor: A BaRCShort Course
• BaRC SOPs (http://barcwiki.wi.mit.edu/wiki/SOPs)a C SO s ( p )
• Galaxy (Whitehead mirror)• Online software manuals• Online software manuals
23