practical 3 creating your map layouts using the print ... · practical 3 creating your map layouts...
TRANSCRIPT
www.thiswormyworld.org
Practical 3
Creating your map layouts using
the print composer in QGIS
Modern Tools for NTDs Control Programmes July 2017
www.thiswormyworld.org | 2
Aim of practical
This third and final practical aims to familiarize the trainees with the Print
Composer, the tool that QGIS includes to create map layouts. We will be creating
thematic maps with the outcomes of the Practical 2.
Key learning skills
In this practical you will:
• Create a new map composition with the Print Composer
• Learn basic features in a map composition
• Manage several map compositions with the Composer Manager
• Export map layouts to different image formats
This work is licensed under a Creative Commons Attribution-NonCommercial-NoDerivs 3.0 Unported
License. This means that users are free to copy and share this material with others. Requests for
creating new derivatives should be sent to Jorge Cano Ortega ([email protected]).
Modern Tools for NTDs Control Programmes July 2017
www.thiswormyworld.org | 3
Practical 3
1. Creating Thematic Map Layouts
Suppose that the government wishes to track the progress of the LF programme in
reporting and managing morbidity cases at the district level and you have been asked
to produce a map to inform this process.
The three steps to create a map are:
1. Get the data displayed in QGIS exactly as required in the map
2. Create the actual map to be exported / printed
3. Export or print the map
Choose a disease outcome you are interested in. We will produce a document with
a map showing aggregated data (choropleth), for instance lymphedema prevalence
(by 100,000 inhabitants) at district level. Finally, we will create a map composition
which also includes the prevalence of hydrocele by district.
1.1. Introduction to Print Composer
In order to share our data, we must produce maps and export to other formats for
printing. After you have arranged your layers to create a good map layout in your
viewer, you will use the Print Composer tool in QGIS to format your maps and
include multiple elements in a single layout.
Opening the Print Composer provides you with a blank canvas to which you can add
the current QGIS map canvas, legend, scale bar, images, basic shapes, arrows and
text.
Legend, scale bar and title are features which should always be included in a map
composition. The compass arrow can be omitted as the QGIS map canvas is always
oriented with the north at the top.
• Open the map project we created in the Practical 2 by selecting it from list of
recent projects. This list of projects appears when you open QGIS 2.18.9. This
new option is only available from the latest QGIS 2.18.9 versions.
• Open Print Composer by selecting File>New Print Composer in the drop-down
menus or select the button corresponding to New Print Composer in the tool bar
.
Modern Tools for NTDs Control Programmes July 2017
www.thiswormyworld.org | 4
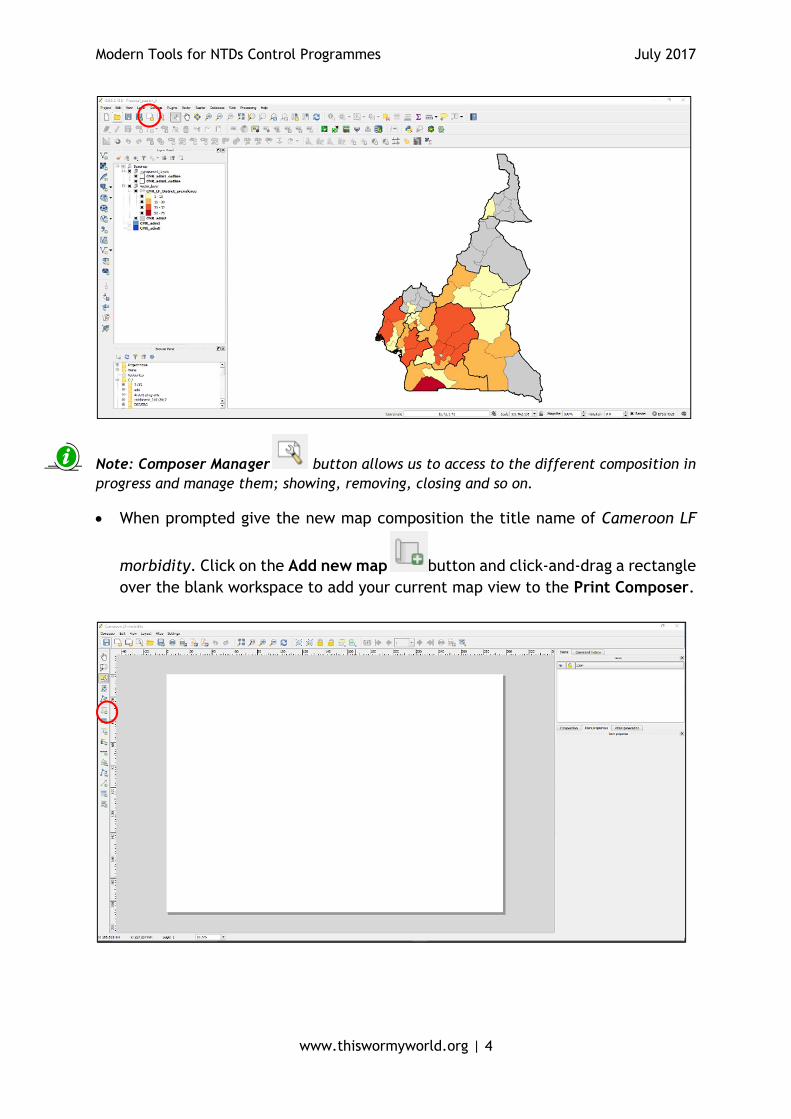
Note: Composer Manager button allows us to access to the different composition in
progress and manage them; showing, removing, closing and so on.
• When prompted give the new map composition the title name of Cameroon LF
morbidity. Click on the Add new map button and click-and-drag a rectangle
over the blank workspace to add your current map view to the Print Composer.
Modern Tools for NTDs Control Programmes July 2017
www.thiswormyworld.org | 5
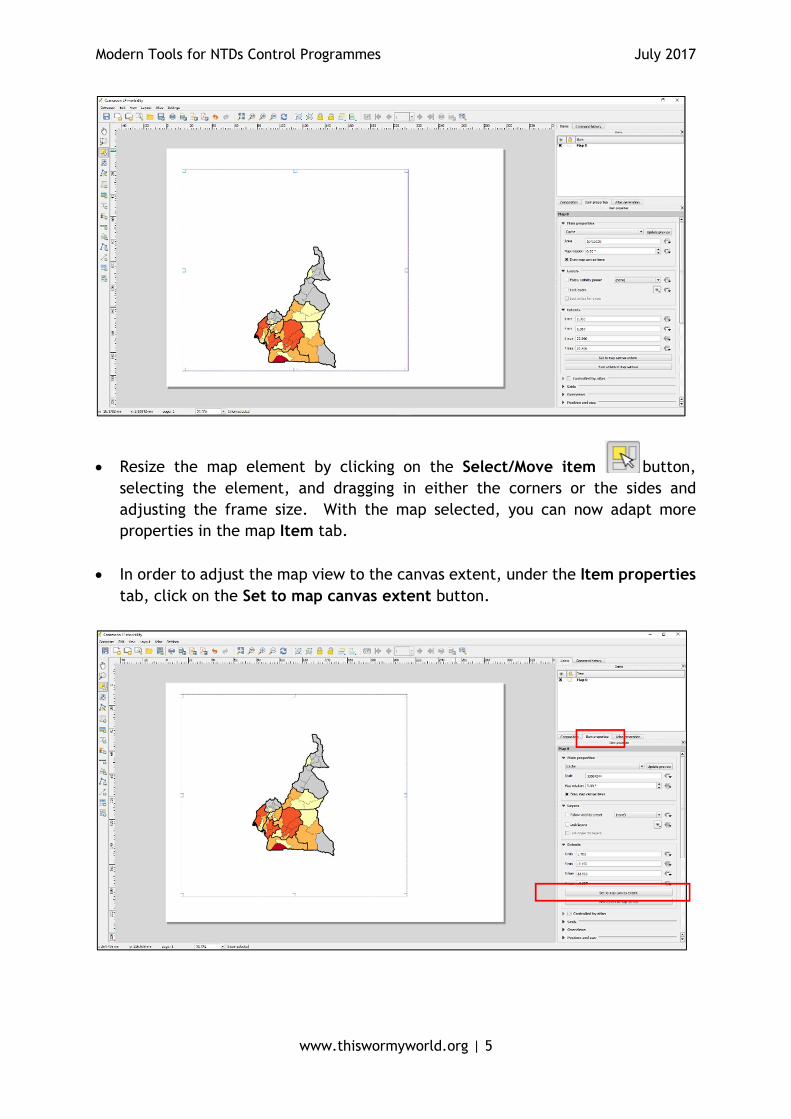
• Resize the map element by clicking on the Select/Move item button,
selecting the element, and dragging in either the corners or the sides and
adjusting the frame size. With the map selected, you can now adapt more
properties in the map Item tab.
• In order to adjust the map view to the canvas extent, under the Item properties
tab, click on the Set to map canvas extent button.

Modern Tools for NTDs Control Programmes July 2017
www.thiswormyworld.org | 6
• To move layers within the map element select the map element, click the Move
item content and move the layers within the map element frame with the
left mouse button.
• If you want to zoom in/out to/from a certain area of the country, hold down the
“Ctrl” key in your keyboard while scrolling up or down with the mouse wheel.
• To add a frame around the map view, make sure that the Frame option is ticked
on under Item properties tab. To lock the element position within the print
composer canvas. select the lock option underneath the Item tab. You can also
go to the Item Properties tab and enable the option Lock layers for map item.
This will fix this map layer.
Modern Tools for NTDs Control Programmes July 2017
www.thiswormyworld.org | 7
Adding a Scale Bar
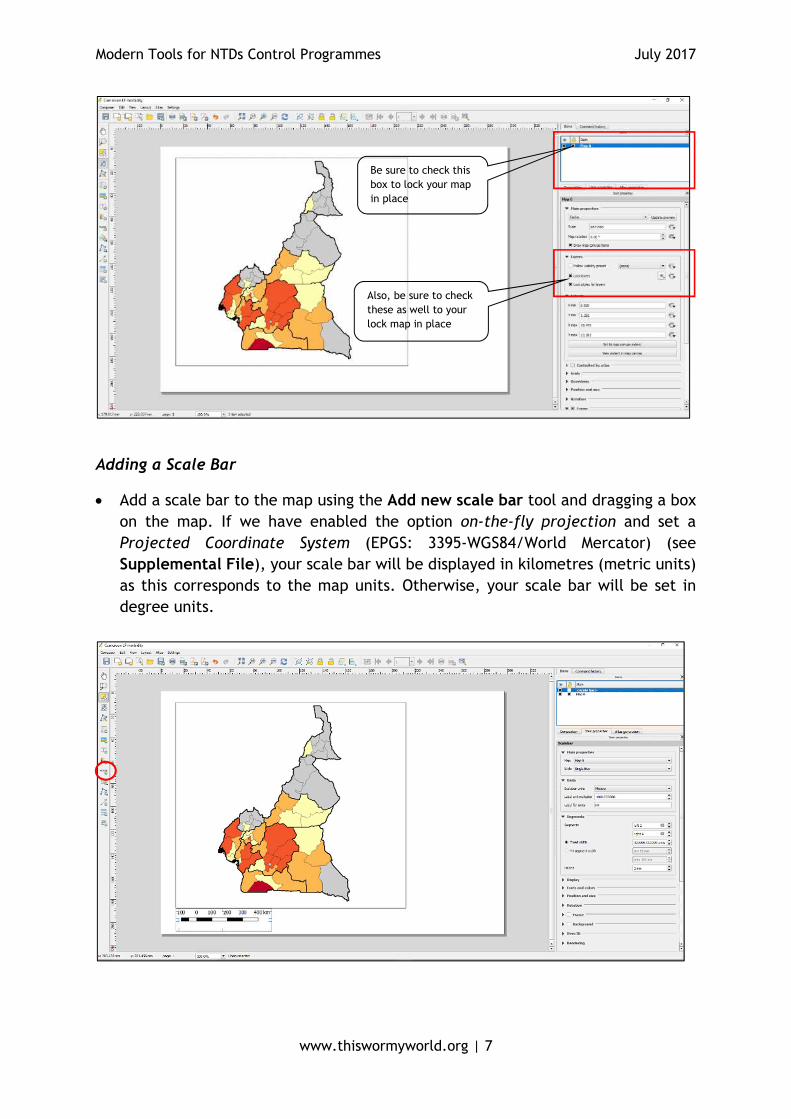
• Add a scale bar to the map using the Add new scale bar tool and dragging a box
on the map. If we have enabled the option on-the-fly projection and set a
Projected Coordinate System (EPGS: 3395-WGS84/World Mercator) (see
Supplemental File), your scale bar will be displayed in kilometres (metric units)
as this corresponds to the map units. Otherwise, your scale bar will be set in
degree units.
Be sure to check this
box to lock your map
in place
Also, be sure to check
these as well to your
lock map in place
Modern Tools for NTDs Control Programmes July 2017
www.thiswormyworld.org | 8
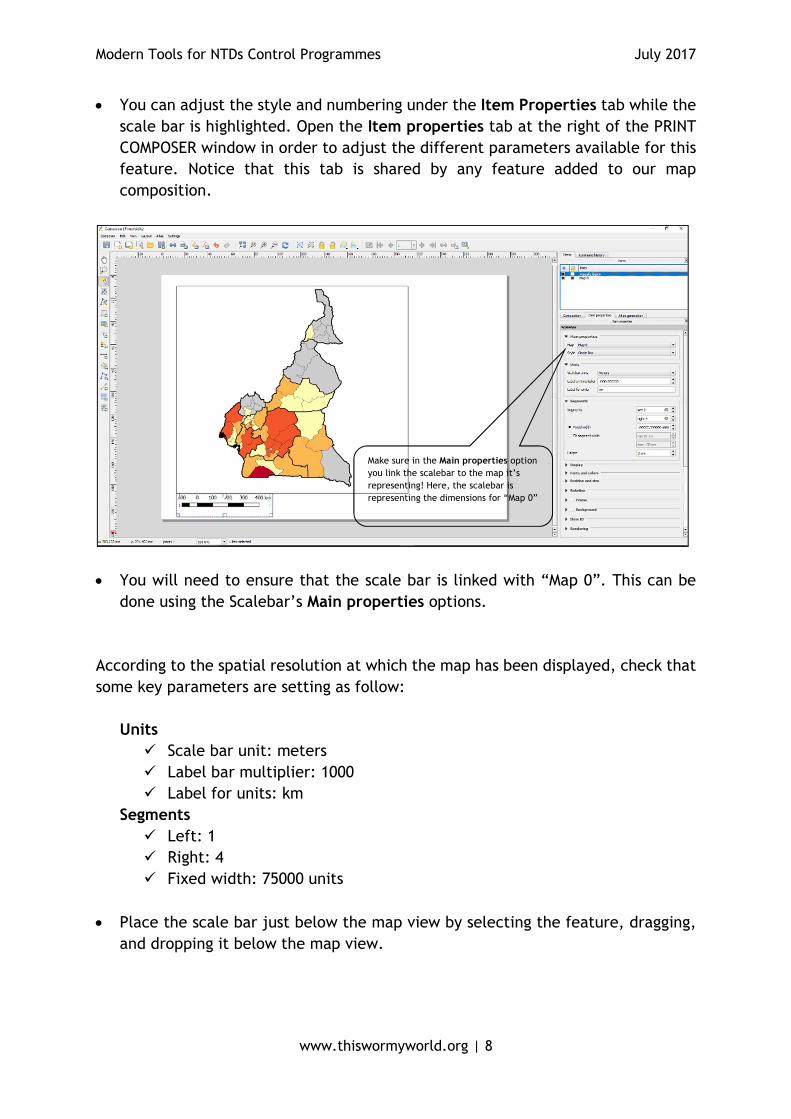
• You can adjust the style and numbering under the Item Properties tab while the
scale bar is highlighted. Open the Item properties tab at the right of the PRINT
COMPOSER window in order to adjust the different parameters available for this
feature. Notice that this tab is shared by any feature added to our map
composition.
• You will need to ensure that the scale bar is linked with “Map 0”. This can be
done using the Scalebar’s Main properties options.
According to the spatial resolution at which the map has been displayed, check that
some key parameters are setting as follow:
Units
� Scale bar unit: meters
� Label bar multiplier: 1000
� Label for units: km
Segments
� Left: 1
� Right: 4
� Fixed width: 75000 units
• Place the scale bar just below the map view by selecting the feature, dragging,
and dropping it below the map view.
Make sure in the Main properties option
you link the scalebar to the map it’s
representing! Here, the scalebar is
representing the dimensions for “Map 0”
Modern Tools for NTDs Control Programmes July 2017
www.thiswormyworld.org | 9
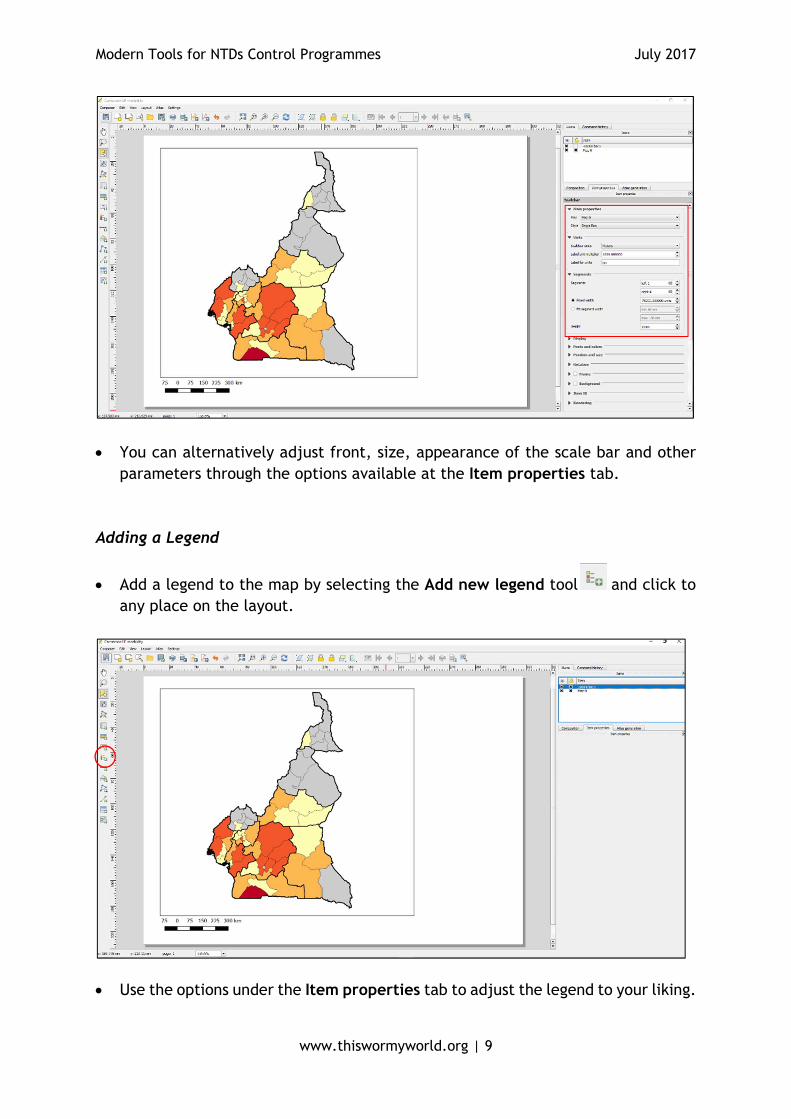
• You can alternatively adjust front, size, appearance of the scale bar and other
parameters through the options available at the Item properties tab.
Adding a Legend
• Add a legend to the map by selecting the Add new legend tool and click to
any place on the layout.
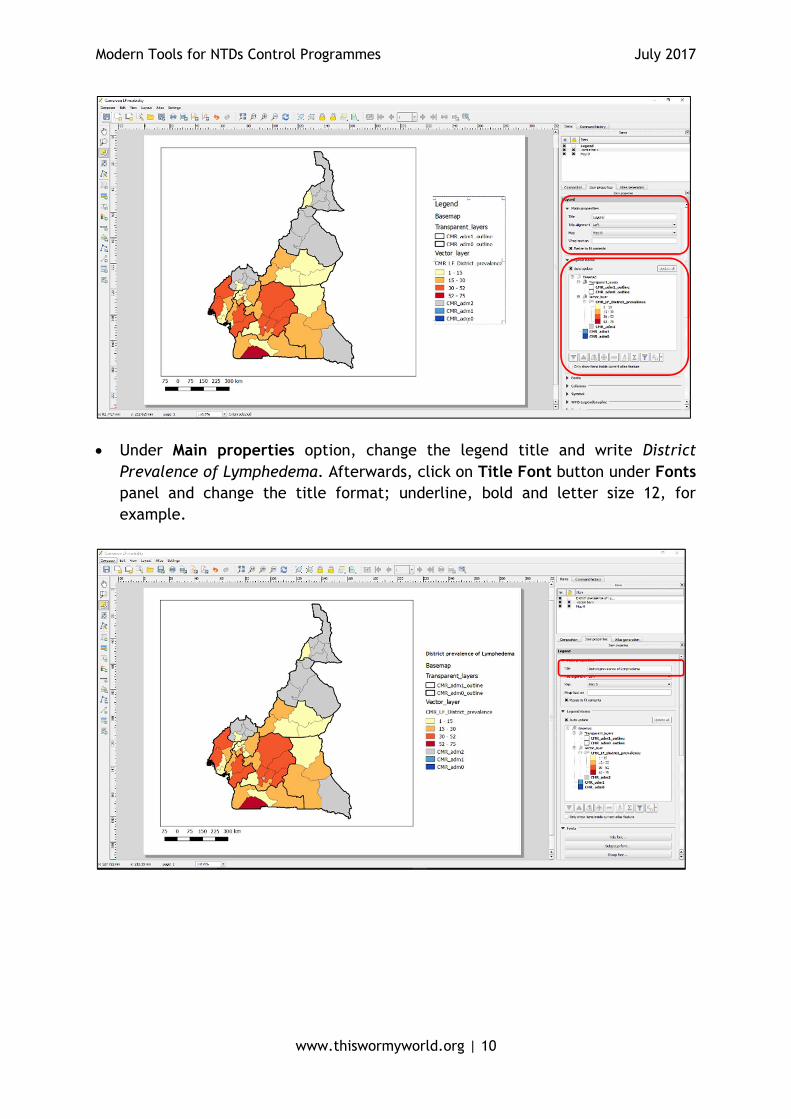
• Use the options under the Item properties tab to adjust the legend to your liking.
Modern Tools for NTDs Control Programmes July 2017
www.thiswormyworld.org | 10
• Under Main properties option, change the legend title and write District
Prevalence of Lymphedema. Afterwards, click on Title Font button under Fonts
panel and change the title format; underline, bold and letter size 12, for
example.
Modern Tools for NTDs Control Programmes July 2017
www.thiswormyworld.org | 11
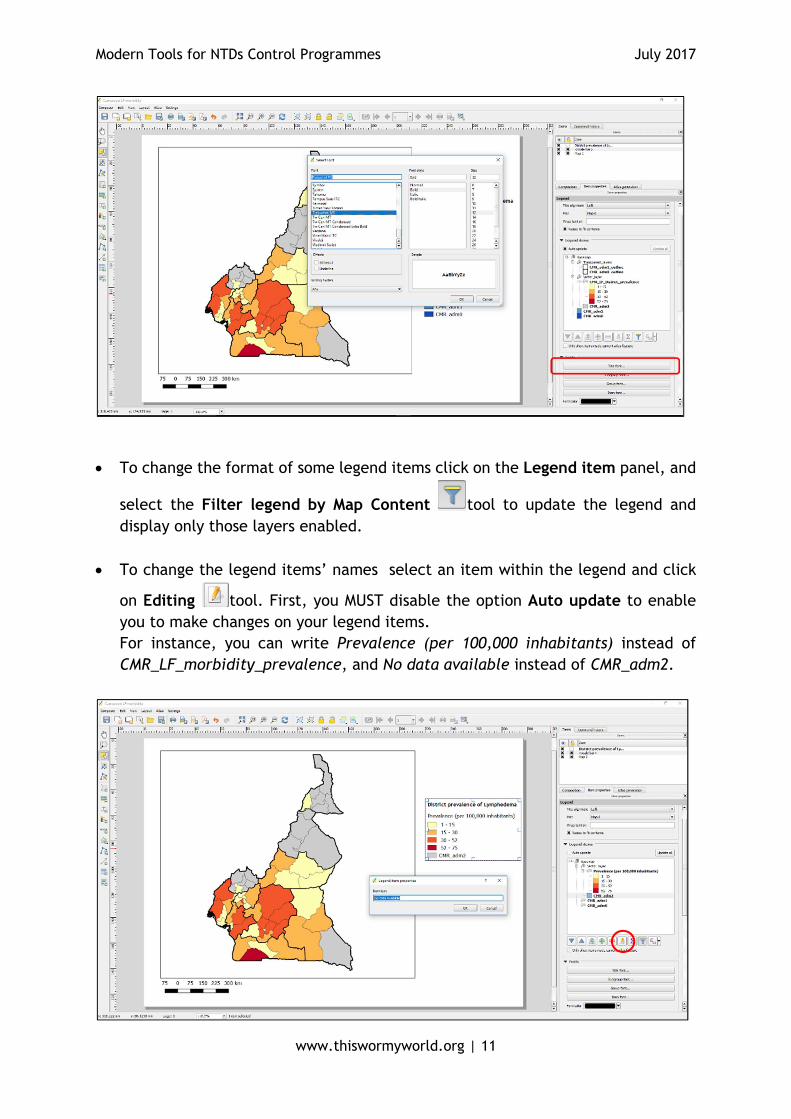
• To change the format of some legend items click on the Legend item panel, and
select the Filter legend by Map Content tool to update the legend and
display only those layers enabled.
• To change the legend items’ names select an item within the legend and click
on Editing tool. First, you MUST disable the option Auto update to enable
you to make changes on your legend items.
For instance, you can write Prevalence (per 100,000 inhabitants) instead of
CMR_LF_morbidity_prevalence, and No data available instead of CMR_adm2.
Modern Tools for NTDs Control Programmes July 2017
www.thiswormyworld.org | 12
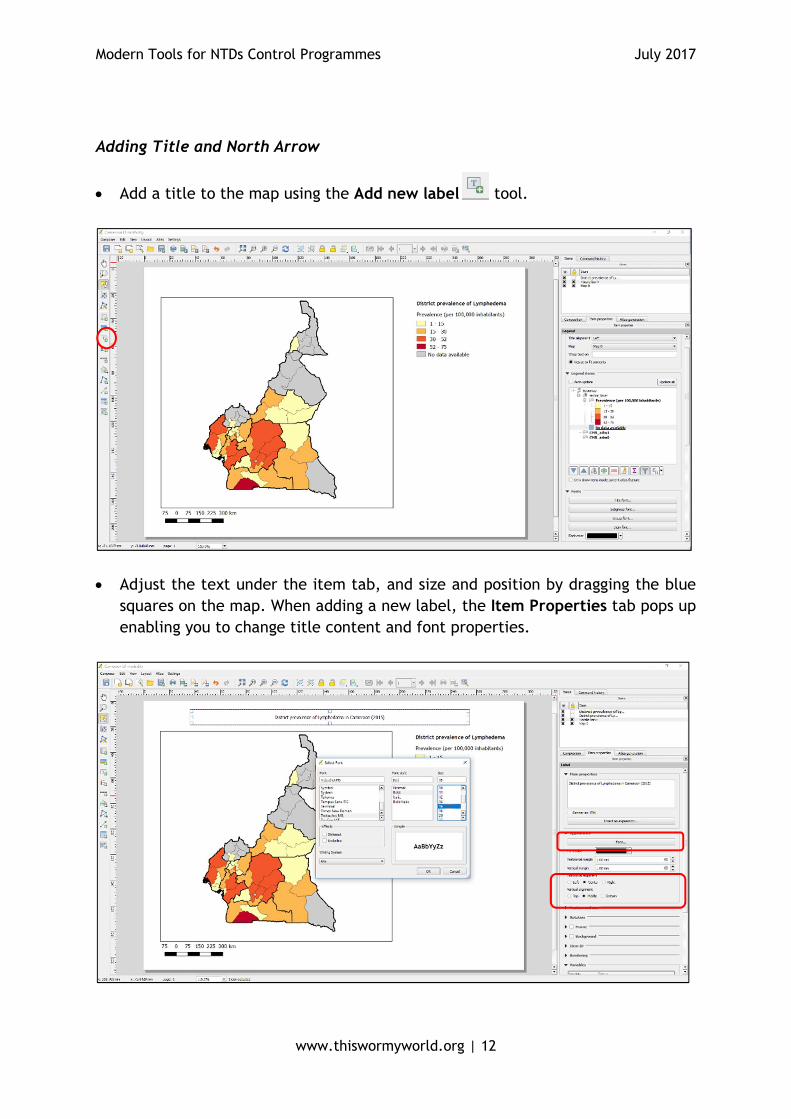
Adding Title and North Arrow
• Add a title to the map using the Add new label tool.
• Adjust the text under the item tab, and size and position by dragging the blue
squares on the map. When adding a new label, the Item Properties tab pops up
enabling you to change title content and font properties.
Modern Tools for NTDs Control Programmes July 2017
www.thiswormyworld.org | 13
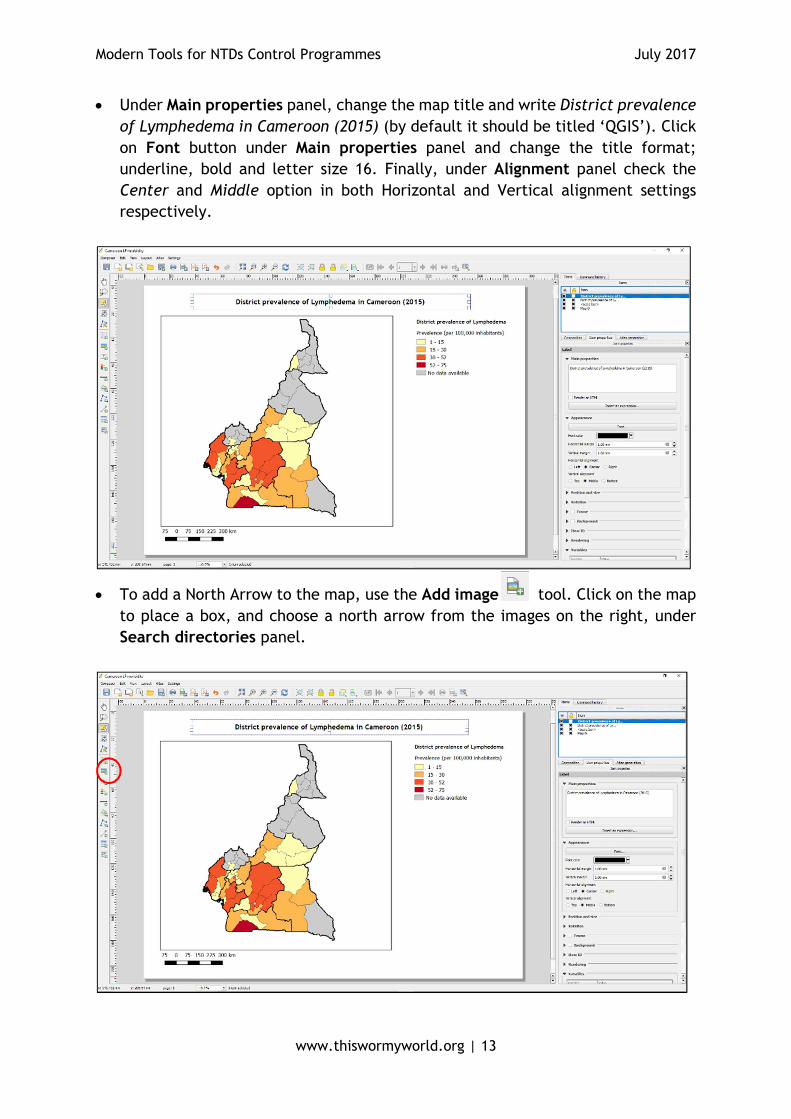
• Under Main properties panel, change the map title and write District prevalence
of Lymphedema in Cameroon (2015) (by default it should be titled ‘QGIS’). Click
on Font button under Main properties panel and change the title format;
underline, bold and letter size 16. Finally, under Alignment panel check the
Center and Middle option in both Horizontal and Vertical alignment settings
respectively.
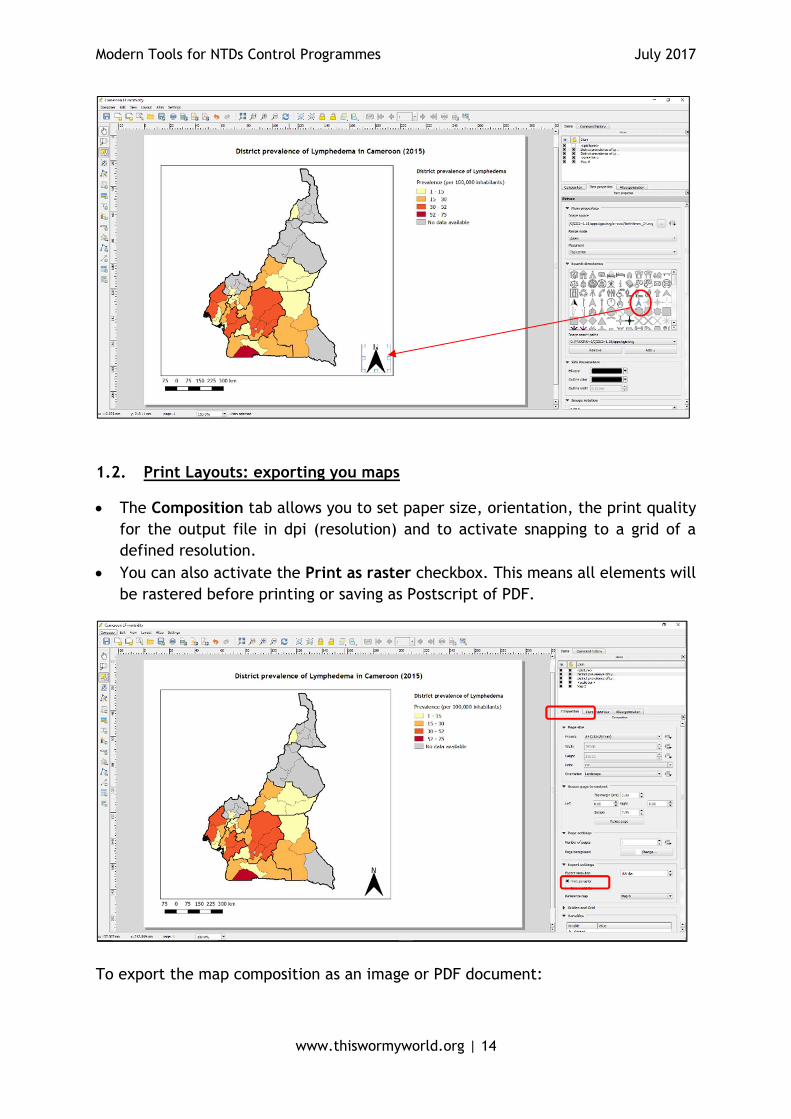
• To add a North Arrow to the map, use the Add image tool. Click on the map
to place a box, and choose a north arrow from the images on the right, under
Search directories panel.
Modern Tools for NTDs Control Programmes July 2017
www.thiswormyworld.org | 14
1.2. Print Layouts: exporting you maps
• The Composition tab allows you to set paper size, orientation, the print quality
for the output file in dpi (resolution) and to activate snapping to a grid of a
defined resolution.
• You can also activate the Print as raster checkbox. This means all elements will
be rastered before printing or saving as Postscript of PDF.
To export the map composition as an image or PDF document:
Modern Tools for NTDs Control Programmes July 2017
www.thiswormyworld.org | 15
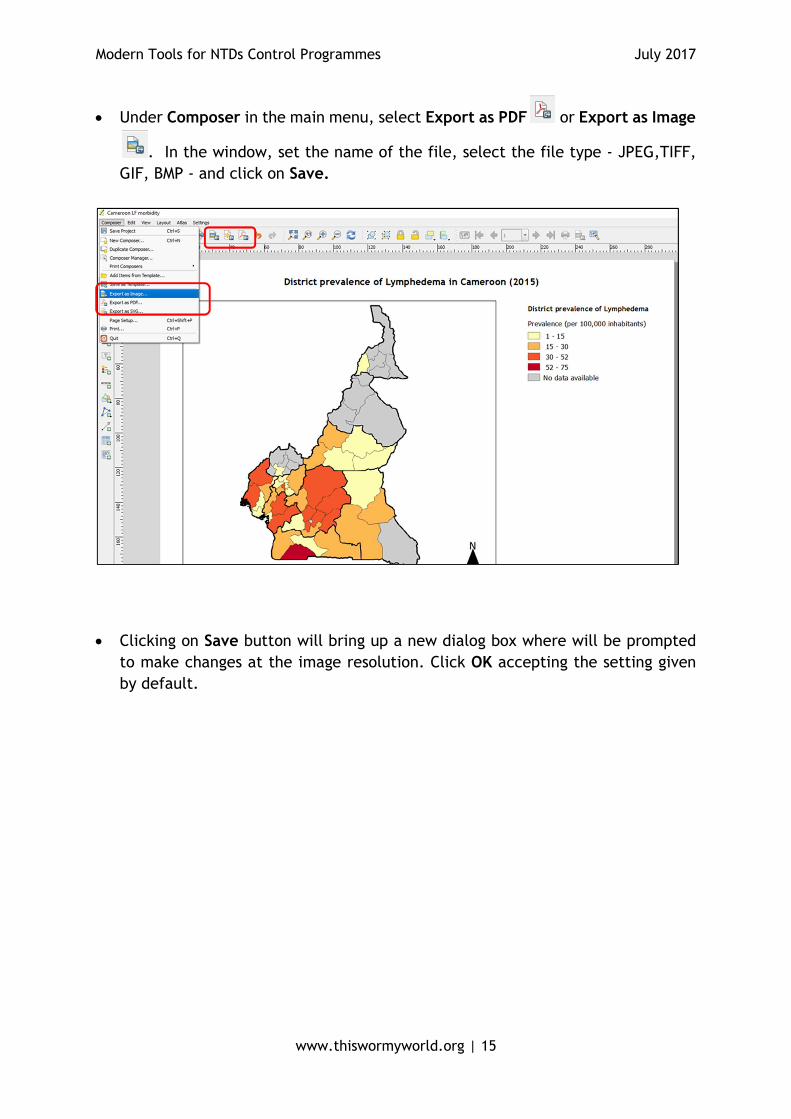
• Under Composer in the main menu, select Export as PDF or Export as Image
. In the window, set the name of the file, select the file type - JPEG,TIFF,
GIF, BMP - and click on Save.
• Clicking on Save button will bring up a new dialog box where will be prompted
to make changes at the image resolution. Click OK accepting the setting given
by default.

Modern Tools for NTDs Control Programmes July 2017
www.thiswormyworld.org | 16
1.3. Multiple maps in one view
You can add multiple map views or legends or scale bars in the Print Composer
canvas. Each element has its own properties and in the case of the map, its own
extent. Delete or the backspace key will remove an element from the composer
canvas.
• Resize the map view by dragging in either corner and adjusting the frame size to
make enough room in the canvas to include a new map view. To do that, you will
have to unlock the map display (‘Map 0’).
Modern Tools for NTDs Control Programmes July 2017
www.thiswormyworld.org | 17
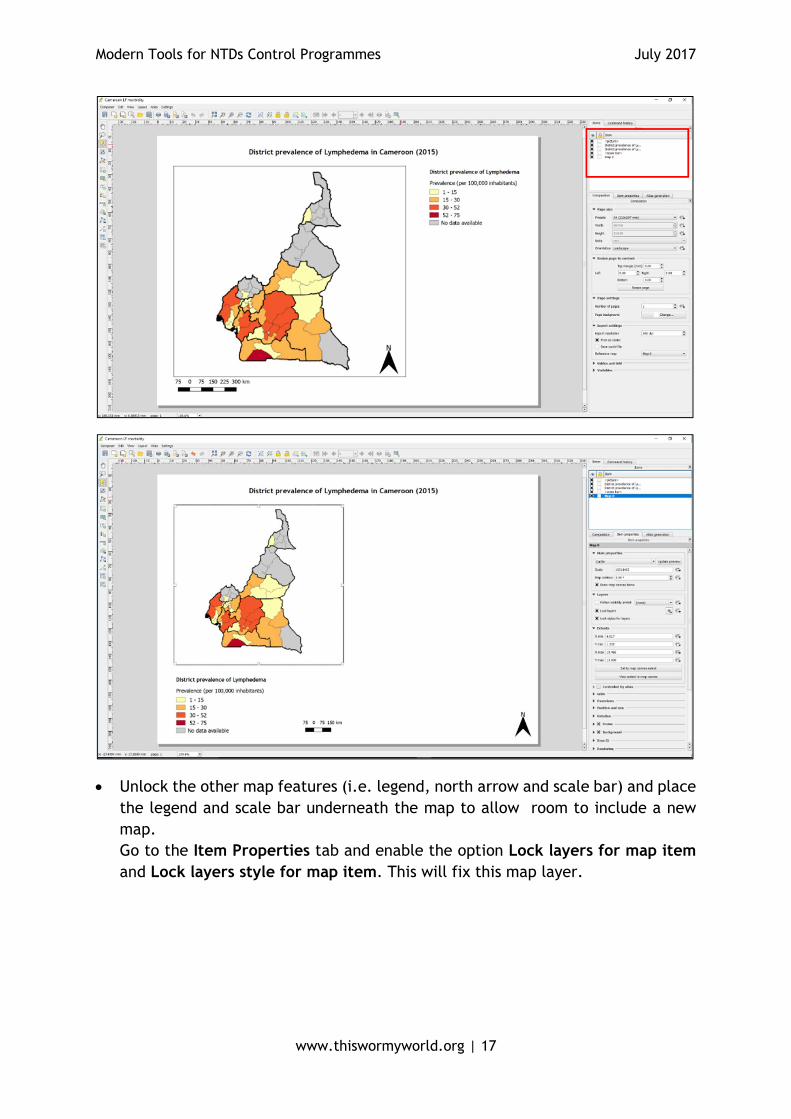
• Unlock the other map features (i.e. legend, north arrow and scale bar) and place
the legend and scale bar underneath the map to allow room to include a new
map.
Go to the Item Properties tab and enable the option Lock layers for map item
and Lock layers style for map item. This will fix this map layer.
Modern Tools for NTDs Control Programmes July 2017
www.thiswormyworld.org | 18
]
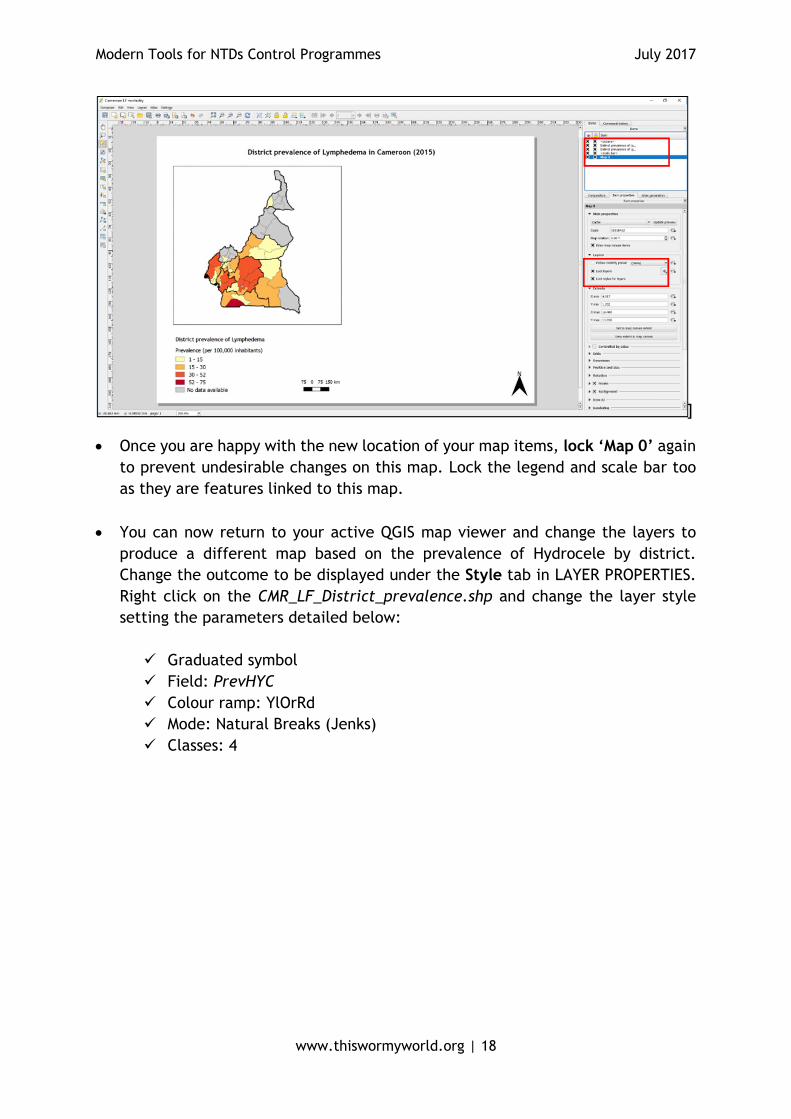
• Once you are happy with the new location of your map items, lock ‘Map 0’ again
to prevent undesirable changes on this map. Lock the legend and scale bar too
as they are features linked to this map.
• You can now return to your active QGIS map viewer and change the layers to
produce a different map based on the prevalence of Hydrocele by district.
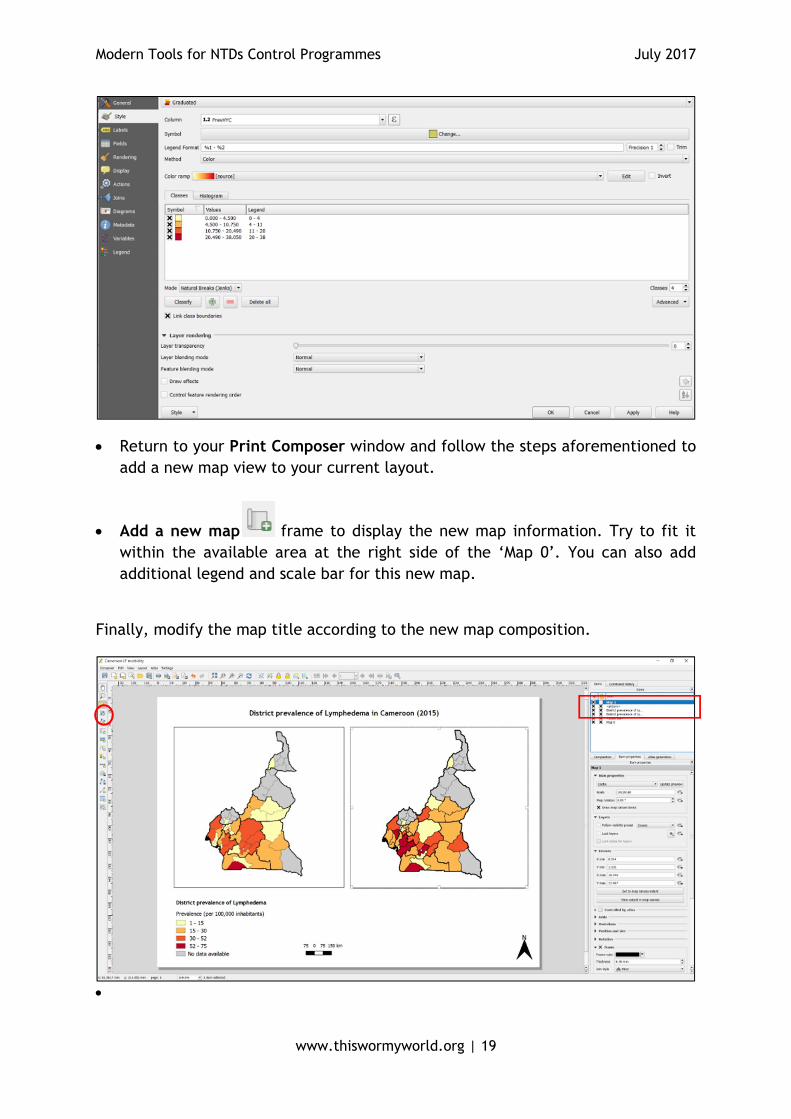
Change the outcome to be displayed under the Style tab in LAYER PROPERTIES.
Right click on the CMR_LF_District_prevalence.shp and change the layer style
setting the parameters detailed below:
� Graduated symbol
� Field: PrevHYC
� Colour ramp: YlOrRd
� Mode: Natural Breaks (Jenks)
� Classes: 4
Modern Tools for NTDs Control Programmes July 2017
www.thiswormyworld.org | 19
• Return to your Print Composer window and follow the steps aforementioned to
add a new map view to your current layout.
• Add a new map frame to display the new map information. Try to fit it
within the available area at the right side of the ‘Map 0’. You can also add
additional legend and scale bar for this new map.
Finally, modify the map title according to the new map composition.
•
Modern Tools for NTDs Control Programmes July 2017
www.thiswormyworld.org | 20
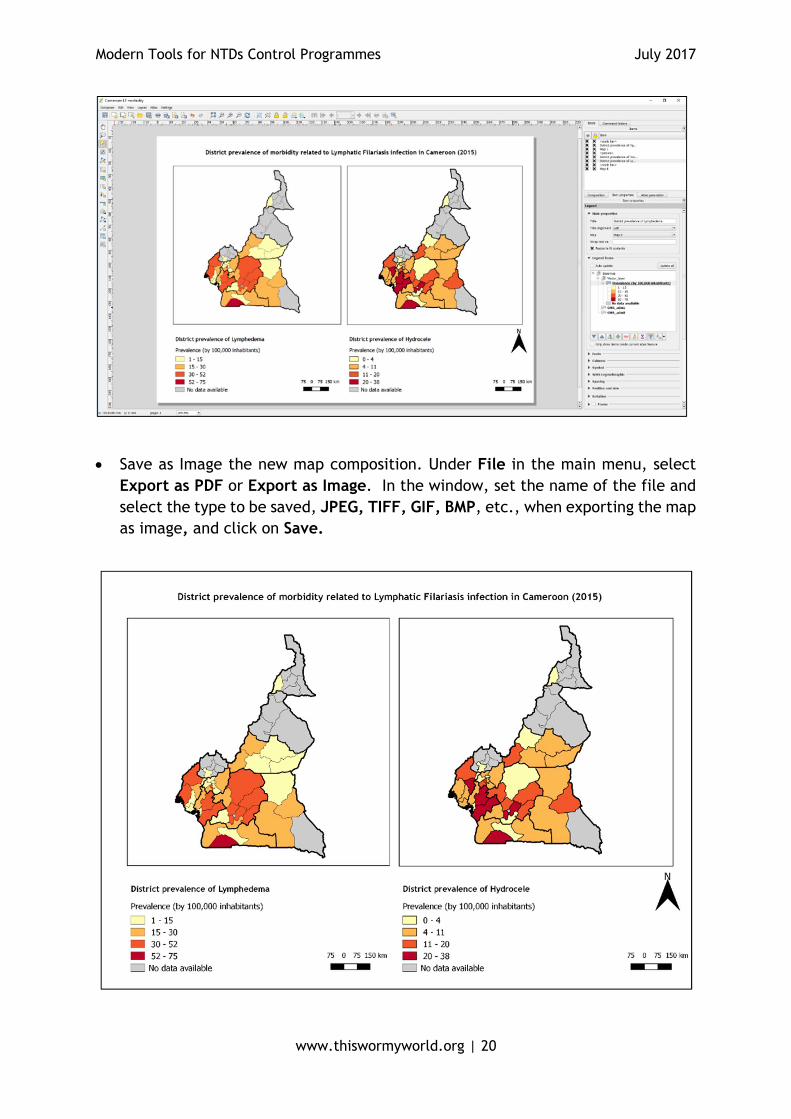
• Save as Image the new map composition. Under File in the main menu, select
Export as PDF or Export as Image. In the window, set the name of the file and
select the type to be saved, JPEG, TIFF, GIF, BMP, etc., when exporting the map
as image, and click on Save.