praca dyplomowa inżynierskakopel/inz/2019.01_inz_zielinska.pdf · praca dyplomowa – inżynierska...
TRANSCRIPT

Wydział Informatyki i Zarządzania
kierunek studiów: informatyka
Praca dyplomowa – inżynierska
IMPLEMENTACJA WTYCZKI
VIRTUAL STUDIO TECHNOLOGY
Adrianna Zielińska
słowa kluczowe:
przetwarzanie sygnału
Virtual Studio Technology
filtr cyfrowy
Celem pracy jest zaprojektowanie i implementacja wtyczki audio zgodnej ze
standardem Virtual Studio Technology. Tematem pracy jest korektor
parametryczny z analizą widma dźwięku. Praca opisuje zasady przetwarzania
sygnału wykorzystane w pracy, proces projektowania, implementacji
i testowania wtyczki, napotkane problemy i ich rozwiązania.
opiekun
pracy
dyplomowej
.................................................. ....................... ....................... Tytuł/stopień naukowy/imię i nazwisko ocena podpis
Ostateczna ocena za pracę dyplomową
Przewodniczący
Komisji egzaminu
dyplomowego
..................................................
Tytuł/stopień naukowy/imię i nazwisko
....................... ....................... ocena podpis
Do celów archiwalnych pracę dyplomową zakwalifikowano do:*
a) kategorii A (akta wieczyste)
b) kategorii BE 50 (po 50 latach podlegające ekspertyzie) * niepotrzebne skreślić
pieczątka wydziałowa
Wrocław
2018

2
3
Streszczenie
Szybki rozwój technologii w ostatnich dekadach oraz wzrost mocy obliczeniowej
komputerów sprawiły, że te urządzenia stały się obecne w niemal każdej dziedzinie życia
łącznie z muzyką. Komputery mają możliwość zastąpić studia nagrań a dedykowane
komponenty przetwarzające sygnał mogą być użyte zamiast specjalistycznego, drogiego
sprzętu audio. Takie komponenty są nazywane wtyczkami audio. W pracy tej zostało
opisane działanie wtyczek, ich wykorzystanie, funkcje, rodzaje i standardy. Praca ta skupia
się na dwóch głównych operacjach przetwarzania sygnału – filtrowaniu i analizie
spektrum. Została w niej opisana wykorzystana teoria związana z tymi operacjami i ich
zastosowanie ich we wtyczkach audio.
Artefaktem tej pracy jest wtyczka audio zgodna ze standardem Virtual Studio
Technology. Celem implementacji wtyczki było wykorzystanie teoretycznej wiedzy
dotyczącej przetwarzania sygnałów w praktyce. Wtyczka ta składa się z dwóch części –
korektora parametrycznego i analizatora widma dźwięku. W pracy tej został opisany cały
proces projektowania, implementacji, testowania, napotkane problemy i ich rozwiązania.
Praca wskazuje potencjalną grupę użytkowników wtyczki, przedstawia praktyczne
zastosowanie oraz jego rezultaty.
Abstract
Fast technological development in recent decades and significant growth of computing
power made computers inseparable part of almost every aspect of life including music.
Computers are able to replace the recording studios, special signal processing components
can be used instead of expensive audio equipment. These components are called audio
plug-ins. This work will explain the characteristic of audio plug-ins, their standards, usage
and types. The work focuses on two main signal processing operations – filtering and
spectrum analysis, explains the theory behind them and the usage of these operations in
audio plug-ins.
The artefact of the work is audio plug-in compatible with Virtual Studio Technology
standard. It was developed to deal with the digital signal processing principles in practice.
The plug-in consists of two parts - parametric equalizer and spectrum analyser. This work
describes whole process of designing the spectrum processing component, the stages of
implementation process, encountered problems and their solutions. The potential users
will be named and described. The work will also introduce the reader testing results and
the practical usage of the plug-in.
4
Table of Contents 1. Introduction ............................................................................................................. 6
1.1. Audio plug-in ....................................................................................................... 6
1.2. Virtual Studio Technology ................................................................................... 6
1.3. Alternative plug-in formats .................................................................................. 7
1.4. Aim of the thesis and motivations ....................................................................... 8
2. Signal processing .................................................................................................... 9
2.1. Digital signal processing ...................................................................................... 9
2.2. Filters ................................................................................................................. 10
2.3. Filters in equalization ......................................................................................... 11
2.4. Frequency domain .............................................................................................. 13
2.5. Windowing functions ......................................................................................... 14
3. Design ................................................................................................................... 15
3.1. Requirements ..................................................................................................... 15
3.1.1. Context of use......................................................................................... 15
3.1.2. Functional and non-functional requirements.......................................... 16
3.2. Class Diagram .................................................................................................... 17
3.3. Graphical user interface design .......................................................................... 19
4. Implementation ..................................................................................................... 22
4.1. Tools .................................................................................................................. 22
4.2. Used classes and structs ..................................................................................... 23
4.3. Problems and solutions ...................................................................................... 24
4.3.1. Stereo processing ........................................................................................ 24
4.3.2. Saving and restoring parameters’ values .................................................... 25
4.3.3 Displaying spectrum of a current signal ...................................................... 25
4.3.4. Logarithmic scale ........................................................................................ 25
4.3.5. Buffering samples ....................................................................................... 25
4.3.6. Filter class ................................................................................................... 26
4.3.7. Filter coefficients ........................................................................................ 26
4.3.8. Filter type selection ..................................................................................... 26
4.3.9. User interface design ................................................................................... 26
4.4. Design patterns ................................................................................................... 28
5. Testing and practical usage ................................................................................... 28
5.1. Compatibility tests ............................................................................................. 28
5.2. Performance tests ............................................................................................... 29
5.3. Usability tests ..................................................................................................... 30
5.4. Practical usage ................................................................................................... 31

5
6. Summary ............................................................................................................... 33
6.1. Further development possibilities ...................................................................... 34
Bibliography ................................................................................................................. 35
List of Figures ............................................................................................................... 36
Attachments .................................................................................................................. 37
Attachment A. Results for different parameters of the filters .................................. 37
Attachment B. Results for different windowing functions used in FFT algorithm . 40
6
1. Introduction
Fast technological development in 20th and 21st century made computers inseparable
part of almost every aspect of human life and, by extension, the music production.
Significant growth of computing power enabled using these devices for real time digital
signal processing which requires great amount of resources. Computers are being used
during the whole process of music production: for measuring, recording, mixing, editing,
mastering and streaming. Thanks to the rapid technological development and its
application in music, producers can rely on high-performance computer-based systems in
their work. Working with audio plug-ins provides recording engineers and musicians with
access to virtual versions of equipment that might be otherwise too expensive or difficult to
use.
This chapter gives an overview of what is the audio plug-in, how it may be used, what
are the plug-in types, describes the Virtual Studio Technology standard and presents
alternative plug-in formats. There are also pointed the motivations and aim of this thesis.
1.1. Audio plug-in
An audio plug-in is not an independent application but a component responsible for
processing the signal. Plug-ins run within a host application to provide additional
functionality. The role of a host application is to deal with audio streams, both input (to be
processed by the plugin’s code) and output. The host application is in most cases a
software used for recording, producing and editing audio files called digital audio
workstation (DAW). The audio plug-ins created in Steinberg’s Virtual Studio Technology
standard are referred to as VST plug-ins.
Plenty of audio plug-ins are being used by audio engineers during the music
production process. The most popular are equalizers, delays, synthesisers, reverberations,
root mean square meters and dynamic range compressors. VST audio plug-ins can be
divided into two main groups : virtual instruments – VSTi and effects – VSTfx. The former
are a software emulation of real musical instruments and can be easily used to generate
music with no need to play this instrument in physical way. The latter allows to shape the
audio signal in a desirable way [1]. There are also other types of plug-ins including
spectrum analysers, noise generators or signal meters. Audio plug-ins are not only the
software emulation of existing audio equipment. Increasing popularity of this technology
and the significant growth of personal computers’ performance over the last decades
resulted in inventing new types of sound processing tools that has never been used before.
1.2. Virtual Studio Technology
Virtual studio technology is a digital interface standard that is used to connect and
integrate software effect plugins and synthesizers with recording systems and audio
editors. It enables a software emulation of various sound recording equipment and real
musical instruments using digital signal processing. The use of Virtual Studio Technology
system’s possibilities allows a complete recording studio with all its content and even its
acoustic ambient to be created inside a single computer.

7
Virtual Studio Technology interface specification and software development kit were
introduced by the Steinberg Media Technology GmbH in 1996. Until then, all the audio
effects used in music production were only external hardware devices. First Virtual Studio
Technology effect plug-ins (VSTfx) were included in Cubase 3.02, the digital audio
workstation software released by the Steinberg company. The Virtual Studio Technology
interface specification was updated to version 2.0 by Steinberg company in 1999. One of
the most significant additions was the ability for plugins to receive MIDI data. This
resulted in the introduction of Virtual Studio Technology Instrument (VSTi) format
plugins like synthesisers [2]. In 2008 the audio industry received the next major revision of
Steinberg’s Virtual Studio Technology. What distinguishes the 3rd update of this standard
from older versions are among others: completely rewritten code base providing numerous
new features, improved performance, 64-bit processing, multiple dynamic I/Os, audio
inputs for VSTi and also multiple MIDI inputs and outputs [3]. The VST standard updated
to 3rd version is referred to as VST3 and called an important milestone in audio
technology.
Virtual Studio Technology is the world’s leading and most widely supported standard
for all kinds of audio plug-ins and virtual instruments. What is significant, VST is an open
standard. It results in a steady growth of its possibilities and applications - new virtual
instruments and plug-ins including effects and meters are constantly being developed by
Steinberg and other companies.
1.3. Alternative plug-in formats
Steinberg’s Virtual Studio Technology was the first standard for audio effect plug-ins
and virtual instruments, however it is not the only one available right now. In the audio
technology exists following standards for developing plug-ins:
• Audio Unit (AU) - developed by the Apple company for macOS use only. AU is a
part of the operating system so it provides low latency and system-level support for the
interface. There are some DAWs dedicated for macOS users that hosts only AU format
plug-ins.
• Real Time AudioSuite (RTAS) – developed to be hosted only in Pro Tools digital
audio workstation software. The format enables to create 32-bit plug-ins what makes it to
be used only up to Pro Tools version 10. Neither source code nor programming
documentation for RTAS are available to the general public.
• Avid Audio Extension (AAX) - developed by Avid to replace the RTAS with the
same features but as the extension to 64-bit version. AAX is also format not available to
use for general public and can be used only in Pro Tools DAWs.
• MOTU Audio System (MAS) - developed by MOTU for its own DAW software
(Digital Performer). This is probably the less used format.
• Virtual Studio Technology (VST/VST3) – described above in details. The format was
not dedicated for any specific operating system or software so for the time being, only
plugins under the VST format will be compatible with different operating systems and
DAWs. VST is an open standard.
8
While implementing an audio plug-in it is essential to consider available standards. In
my work, I decided to choose the Steinberg’s Virtual Studio Technology standard. The
main argument for my decision is the fact, that VST interface standard enables to develop
plug-ins that are compatible with different operating systems – Windows, Linux as well as
Apple’s macOS. VST is also the most widely implemented format in the audio industry
and is supported by numerous DAWs, including the most popular ones (e.g. Ableton Live,
FL Studio). In conclusion, the audio plug-in implemented in VST standard is much more
likely to be applied than one in other format. Last but not least, Virtual Studio Technology
is an open standard making it free for developers to implement and use this standard. The
documentation is also available to the public.
1.4. Aim of the thesis and motivations
Aim of this thesis is to design and implement a digital audio signal processing software
component called an audio plug-in. This plug-in can be used by music producers,
musicians and sound engineers in their work. The other important motivation behind this
work was to learn the principles of digital audio signal processing and use them in practice.
It was achieved by implementing the plug-in containing two common applications of
signal processing – filtering and equalization.
There are plenty of audio plug-in types available, with different uses, features and
purposes. I decided to implement the equalizer and spectrum analyser audio plug-in.
Equalizer enables to set the right proportions for frequencies in the mix while spectrum
analysis depicts what are the frequency components and their amplitudes in the audio
signal. In other words, spectrum analyser shows frequency components in the sound and
effects of applied equalization. It helps the audio engineer, musician, music producer to
balance their recording in terms of frequencies in more aware and controlled way. I
decided to merge equalizer and spectrum analyser in one audio plug-ins because they are
complementary to one another. Furthermore, equalizing is used during producing almost
every audio recording so this kind of plug-in is very likely to be applied during the real
working process.
There are two main types of signal equalizers – graphic and parametric. Parametric
ones allow the user to control three main parameters for a certain frequency band. Graphic
ones usually provide line with marked points to adjust a given frequency by moving that
points. The latter are easier to use, however do not allow very complex and deliberate
operations and they are more complex to implement. This is the reason for my plug-in to
be a parametric equalizer instead of graphic one
As there exists plenty of audio plug-in formats I had to decide which one to choose.
Considering both the advantages and disadvantages of all those formats, the best option
appeared to be the Virtual Studio Technology standard by Steinberg. Firstly, VST plug-ins
might be used either by Windows, Linux or macOS users. Secondly, this format that can be
hosted in different digital audio workstation applications, it is not dedicated only for
specific one. These features make my VST plug-in to reach a wide potential audience.
Steinberg’s VST is also one of the most popular plug-in standard.

9
This thesis contains six paragraphs. First one introduces the background of the
work, describes what is an audio plug-in and how it is used. This paragraph introduces also
motivations behind implementing the VST equalizer with spectrum analyser and gives an
overview of available plug-in standards. Second chapter presents the theoretical
foundations of signal processing necessary to understand and implement the signal
processing component. The next paragraph covers the design issues including context of
use, functional and non-functional requirements, diagrams and user interface design.
Fourth part of the thesis describes the process of implementation presents applied
technologies and methods, encountered problems and their solutions. Next chapter shows
how the artefact was tested and what were the results. The last, sixth chapter sums up
everything that was described before, states the conclusions and shows potential further
development possibilities.
2. Signal processing
Anything which carries information is a signal. In technical context a signal is a real or
complex valued function of one or more real variables. Signals exist in almost every field
of science and engineering including also computer science and music.
We distinguish 2 main types of signals:
• Continuous-time signals - defined at every point of the domain from beginning to
end. The values of this signals are real numbers. Analog signal are continuous-time
signals.
• Discrete-time signals – defined only at points occurring in some non-zero period,
with values form continuous or discrete range. A subset of discrete signals that can
take only a finite set of values are digital signals.
The term signal processing refers to manipulating the signal in some way. It might be
analysing, synthesizing, sampling, filtering, transforming, enhancing, etc. Any process that
produces an output signal in response to an input signal is called a system.
2.1. Digital signal processing
Digital signals are often signals taken from continuous ones through the process of
digital-to-analog conversion. In terms of digital signal processing a digital signal is a
discrete-time signal with both time and amplitude represented by discrete values. [4]
Continuous-time signals are converted to discrete-time through sampling, which
means taking samples from the analog one in some defined non-zero period of time. The
signal can be properly sampled only by following the rules of the Shannon – Nyquist
sampling theorem. It indicates that a continuous signal can be properly sampled, only if it
does not contain frequency components above one-half of the sampling rate. The other
stage of converting analog signal to digital is quantization which means mapping its values
from continuous range to a finite set.

10
Digital signal processing refers to the process when some operations are applied on a
digital signal. It became popular and commonly used because of very high performance
and numerous possibilities in comparison with analog processing. One of the most
common operations on the digital signal are filtering and converting it to the spectral
representation [4]. The further paragraphs describe these two aspects of signal processing.
2.2. Filters
In the context of audio signal processing by the term filters we understand a group of
devices or processes that removes unwanted components from a signal or enhances chosen
ones. Two main uses for filters are signal separation and signal restoration. When a signal
has been contaminated with interference, noise, or other signals, the separation is used.
Signal restoration is needed when we deal with a signal that has been distorted [5].
When trying to classify filters, we are able to find numerous aspects that can be the
determinants for classification. Among of many categories the filters may be divided into
are:
• Linear or non-linear
• Time-invariant or time-variant
• Analog or digital
• Infinite impulse response (IIR) or finite impulse response (FIR)
In my work, I will focus on IIR filters which can be also classified as digital, linear and
time-invariant. The advantages of this group of filters are far more faster computationally
than FIR while processing digital signal.
Systems that deal with discrete-time signals performing filtering mathematical
operations on them are referred to as digital filters. They derives from analog ones and are
very important part of digital signal processing. In comparison to analog filters, digital
processing can achieve far more better performance. The possibilities of digital filtering
was one of the key reasons that DSP has become widely used [5].
Linear systems must meet the conditions of two mathematical properties : additivity
and homogeneity [6]. Additivity means that signals added at the input produce signals that
are added at the output. In homogenous systems every change in the input signal's
amplitude make the output signal's amplitude change in a corresponding way.
The system is time-invariant when its effect does not depend on time of application. In
other words, processing the signal in this system is a function of parameters and this
parameters are independent of time.
One of the most important parameter describing a signal processing system is its
impulse response. It means the signal that exits the system when an impulse (delta
function) I is set as an input. The term impulse response refers to the appearance of the
filter in the time domain. The impulse responses of recursive filters are composed of
sinusoids which amplitude decays exponentially what makes their impulse responses
infinitely long. Infinite impulse response filters are recursive filters using not only input
values but also values from previous output to calculate current output. This filters are
described by a set of recursion coefficients.
11
2.3. Filters in equalization
In audio signal processing filters most often act in frequency domain. Selected bands
of frequencies may be weakened, strengthened or completely removed if unwanted. It can
be achieved using appropriate types of filters. This property causes them to be used in the
equalization process. Equalization in the context of audio signal processing means shaping
the signal in a desirable way by adjusting the balance between its frequency components.
Equalizers are used in various forms in the transmission of audio signal from recording to
listeners.[7]
Depending on a frequency response, linear filters can be assigned to following
groups:
• Low-pass (LP) - provides stopping higher frequencies than given cut-off frequency
and passing lower
• High-pass (HP) - provides stopping lower frequencies than given cut-off frequency
and passing higher
• Band-pass (BP) – provides passing the frequency band in a specified range and
stopping other frequencies
• Band-stop (BS) - provides stopping the frequency band in a specified range and
passing other frequencies
• Low-shelf (LS) – provides attenuation or gain for frequencies that are lower than a
given frequency with no change for higher
• High-shelf (HS) - provides attenuation or gain for frequencies that are higher than a
given frequency with no change for lower
• Notch – provides rejecting only one specified frequency(cut off frequency) with
passing others
• Peak - provides gain or attenuation at a specific centre frequency
Figure 2.1 shows the frequency response characteristics of the eight types of described
filters.

12
Figure 2.1 Frequency responses of different types of filters
(schema based on [8])

13
There are other attributes of filters that are important in context of equalization and
audible effects. These are the following parameters:
• Transition band - the band of frequencies between a band that is being changed and
the band that is not (e.g. between stop band and pass band)
• Roll-off– the steepness of attenuation or gain of frequency in the transition band
• Quality – defines the width of a transition band. Bigger quality value means wider
bandwidth, smaller means more narrow bandwidth.
[9]
These parameters are presented in figure 2.2.
Figure 2.2 Filter parameters – roll-off, transition band, cut-off frequency
(schema based on [8])
The right choice of number of filters, their types (low-pass, high-pass, peak, etc) and
parameters (cut-off frequency, bandwidth, roll-off etc.) are key to build an equalizer that
satisfy certain users’ requirements.
2.4. Frequency domain
The signal can be represented both in time domain and frequency domain. Time
domain depicts what happened with signal during some period of time and what was its
amplitude then. On the contrary, the frequency domain shows the frequency, phase, and
amplitude of frequency components occurring in the given signal. This type of
representation is called spectrum.
Audio signal conveys information describing a certain sound. The sound is
composed of one or more vibrations. Audio signal is formed from sinusoids with the
frequency and amplitude corresponding to parameters of these oscillations. This is the
reason why representing it in a frequency domain is incredibly useful. One of the main
reasons for using this domain representation of a signal is to simplify the analysis.
To obtain a representation of analysed signal in the frequency domain it is
necessary to decompose it into sinusoids. To achieve it the Fourier transform is used. The
term Fourier transform associates the frequency domain representation to a function of

14
time by splitting the waveform into sum of sinusoids of different frequencies. This
mathematical operation can be also used in reverse order. The Fourier transform has many
types dependent on signals that are being decomposed. The one that deals with discrete
signals and can be applied in digital signal processing is called Discrete Fourier transform
(DFT).
The main drawback of calculating DFT of a signal applying the definition is the
computational complexity. For a n size data the complexity of DFT equals to O(n2) which
is actually a big number of operations in the context of real-time processing. However, this
computational complexity may be significantly reduced to O(n log(n)) by using the
algorithm called fast Fourier transform (FFT) instead of evaluating DFT definition directly.
The first step of FFT is decomposing an N point time domain signal into N time domain
signals each composed of a single point. Finding the frequency spectra of every 1 point
time domain signals is the next step. The last operation is merging the frequency spectra in
the reverse order than the decomposition. [10]
2.5. Windowing functions
The fast Fourier transform algorithm assumes that it operates on a finite set of data
equals to one period of a measured periodic signal. This condition is also fulfilled for
integer number of periods. Although, the processed signal is not always that long which is
interpreted as discontinuities in the analysed signal. FFT algorithm applied on a signal like
this results in the unwanted effect called spectrum leakage – occurrence of additional
frequency components not present in the original signal. The term leakage refers to side-
lobe characteristic of sin(x)/x.
Figure 2.3 Windowing function
(schema based on [10])
The spectral leakage effect can not be completely avoided, however it may be reduced
by applying a technique called windowing function. This mathematical operation is based
on multiplying the data by a finite-length window function what diminishes the impact of
15
discontinuities [10].The application of window function on a signal is presented in figure
2.3. Different window functions with different frequency response characteristics are
available. One of the most common are the following window functions:
• Rectangular – it is the most simple window function based on replacing some
samples with 0 value. It has the narrowest main lobe. Unfortunately, the side lobes for
the rectangular window drops very slowly what is insufficient solution for reducing
spectral leakage.
• Hamming - it is the window with sinusoidal shape which edges does not reach 0
value. Due to this property Hamming window has very low first side lobe level, but
after the first side lobe, remaining side lobes decay relatively slowly. Its main lobe is
also relatively wide.
• Hann – (also called Hanning) it is the window with sinusoidal shape with edges
reaching 0 eliminating all discontinuities. The Hann window is effective in reducing
the level of side lobes but its main lobe can be twice as wide as in rectangular window.
• Blackman-Harris - is a good general-purpose window, having medium side lobe
rejection in and a moderately wide main lobe.
3. Design
This chapter describes the process of designing the plug-in. It presents the context
of use for my work, functional and non-functional requirements for the project. There is
also a class diagram used to provide code structure, name classes, their methods and
attributes. The last part of the chapter presents graphic user interface design. The subject
of work that design process refers to is the equalizer with spectrum analysis audio plug-in.
3.1. Requirements
This paragraph presents the context of use for my plug-in, where it will be used, who
will be the potential users and what kind of their tasks the plug-in will help achieve. There
are also pointed functional and non-functional requirements for the signal processing
component that is the subject of this work.
3.1.1. Context of use
My work was started from analysing the environment, the context of use for my
project, possible users and their needs. The reason was that a product based on deep
environmental analysis is much more likely to be used in a real life than one that is based
on developer’s guesses and believes.
16
Environment:
Nowadays, music production process is done using computers and digital audio
workstation applications. The heart of these programs are plug-ins (effect, virtual
instruments, meters , analysers and others). The plug-in are applied while recording,
editing, mixing and mastering the music pieces.
Users:
As the artefact of my work is an audio plug-in, the target audience is not hard to
predict. This kind of signal processing components are used by musicians, audio
producers, sound engineers, etc. during their work.
User’s tasks:
Recording devices are not always excellent in terms of quality. It makes recorded
sound to have a few unpleasant elements while listening or even to be distorted.
Furthermore, sound engineers sometimes want to enhance or attenuate some audible
features of the music piece they are working with. As this aspect pertains to the frequencies
that this signal consists of, spectrum analysis is very important. By analysing the
spectrum, music producer is able to see what frequency components contains audio signal
what helps him or her to decide what would be the best way to shape the sound. Moreover,
the results of using the equalization are also reflected by the changes of spectrum.
Equalization and spectrum analysing are complementary processes.
3.1.2. Functional and non-functional requirements
Taking into consideration the possible users’ suggestions as well as the result of
environmental analysis, the implemented plug-ins were designed to meet following
requirements:
Functional requirements:
• Shaping the frequency components in audio signal in desired way
• Using four filters to shape the audio signal
• Selecting filter type to shape lower frequencies (low pass, low shelf, peak)
• Selecting filter type to shape higher frequencies (high pass, high shelf, peak)
• Attenuating or boosting frequency components of a signal in a region of a given
centre frequency
• Setting frequency parameter for each filter
• Setting quality parameter for each filter
• Setting gain parameter for each filter
• Visualize shaping effects by showing signal in frequency domain (spectrum)
• Selecting windowing function used in spectrum analysis
17
Non-functional requirements:
• Ability to work on different operating systems (Windows, macOS, Linux)
• Ability to be hosted in different host applications (DAWs)
• CPU usage 0.2% - 0.4 %
• Minimal latency for signal processing
• No distortion or other audible artefacts while changing parameters
• Intuitive user interface
3.2. Class Diagram
The figure below presents the UML class diagram of equalizer with spectrum analyser
audio plug-in. The diagram contains only the most important classes, their methods and
attributes to make it more convenient to read. The classes with no attributes presented are
classes provided by the used framework. The key elements in the implementation of plug-
in are Eq_Spectrum_AudioProcessorresponsible for processing the signal and
Eq_Spectrum_AudioProcessorEditor that is in charge of rendering, displaying the graphic
interface content, handling slider parameters’ changes an buttons’ on clicks. As the plug-in
consists of two parts – equalizer and spectrum analyser, their processing responsibilities
was divided into separate, dedicated classes. The SpectrumComponent class handles
displaying graphical representation of current signal’s spectrum. Figure 3.1 presents the
class diagram for my work created using the Visual Paradigm tool.

18
Figure 3.1 UML class diagram
19
3.3. Graphical user interface design
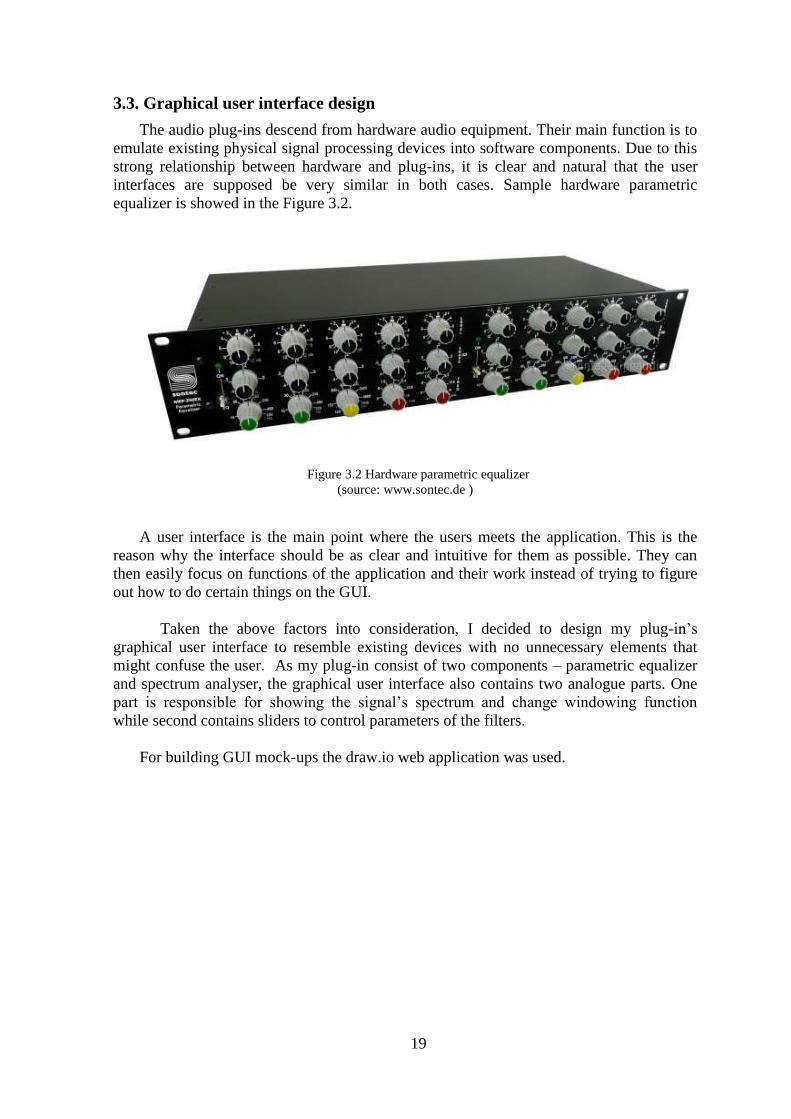
The audio plug-ins descend from hardware audio equipment. Their main function is to
emulate existing physical signal processing devices into software components. Due to this
strong relationship between hardware and plug-ins, it is clear and natural that the user
interfaces are supposed be very similar in both cases. Sample hardware parametric
equalizer is showed in the Figure 3.2.
Figure 3.2 Hardware parametric equalizer
(source: www.sontec.de )
A user interface is the main point where the users meets the application. This is the
reason why the interface should be as clear and intuitive for them as possible. They can
then easily focus on functions of the application and their work instead of trying to figure
out how to do certain things on the GUI.
Taken the above factors into consideration, I decided to design my plug-in’s
graphical user interface to resemble existing devices with no unnecessary elements that
might confuse the user. As my plug-in consist of two components – parametric equalizer
and spectrum analyser, the graphical user interface also contains two analogue parts. One
part is responsible for showing the signal’s spectrum and change windowing function
while second contains sliders to control parameters of the filters.
For building GUI mock-ups the draw.io web application was used.
20
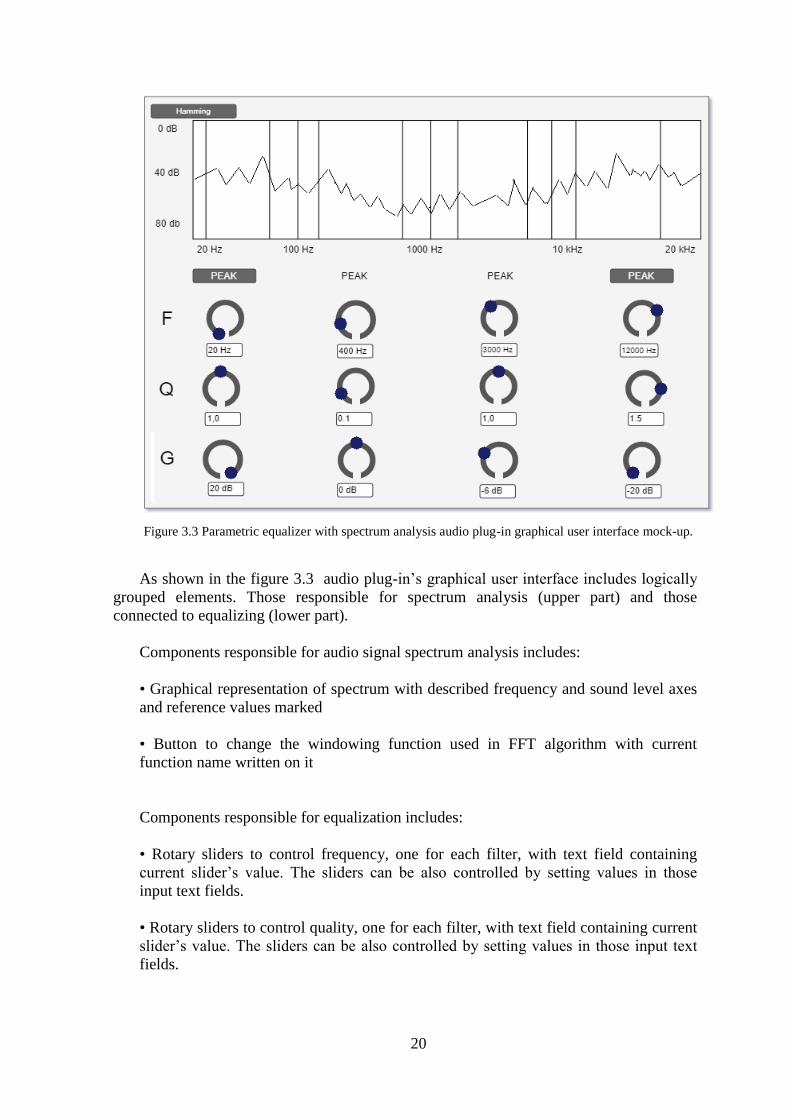
Figure 3.3 Parametric equalizer with spectrum analysis audio plug-in graphical user interface mock-up.
As shown in the figure 3.3 audio plug-in’s graphical user interface includes logically
grouped elements. Those responsible for spectrum analysis (upper part) and those
connected to equalizing (lower part).
Components responsible for audio signal spectrum analysis includes:
• Graphical representation of spectrum with described frequency and sound level axes
and reference values marked
• Button to change the windowing function used in FFT algorithm with current
function name written on it
Components responsible for equalization includes:
• Rotary sliders to control frequency, one for each filter, with text field containing
current slider’s value. The sliders can be also controlled by setting values in those
input text fields.
• Rotary sliders to control quality, one for each filter, with text field containing current
slider’s value. The sliders can be also controlled by setting values in those input text
fields.
21
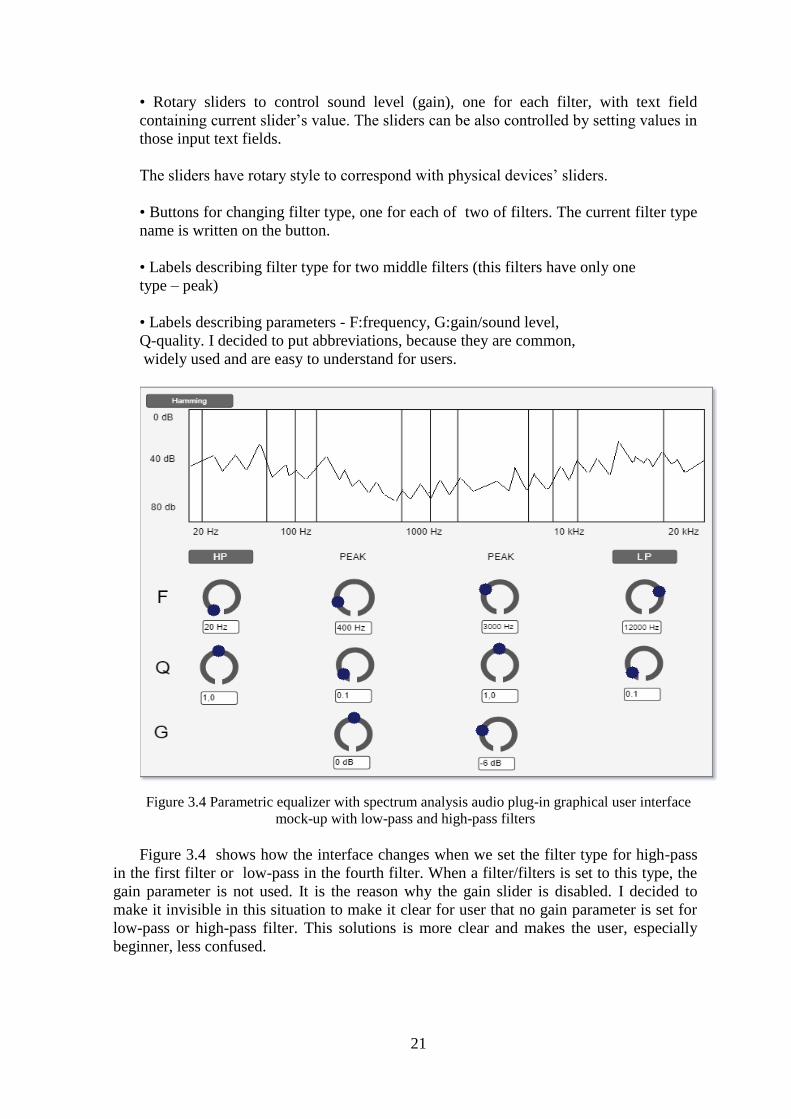
• Rotary sliders to control sound level (gain), one for each filter, with text field
containing current slider’s value. The sliders can be also controlled by setting values in
those input text fields.
The sliders have rotary style to correspond with physical devices’ sliders.
• Buttons for changing filter type, one for each of two of filters. The current filter type
name is written on the button.
• Labels describing filter type for two middle filters (this filters have only one
type – peak)
• Labels describing parameters - F:frequency, G:gain/sound level,
Q-quality. I decided to put abbreviations, because they are common,
widely used and are easy to understand for users.
Figure 3.4 Parametric equalizer with spectrum analysis audio plug-in graphical user interface
mock-up with low-pass and high-pass filters
Figure 3.4 shows how the interface changes when we set the filter type for high-pass
in the first filter or low-pass in the fourth filter. When a filter/filters is set to this type, the
gain parameter is not used. It is the reason why the gain slider is disabled. I decided to
make it invisible in this situation to make it clear for user that no gain parameter is set for
low-pass or high-pass filter. This solutions is more clear and makes the user, especially
beginner, less confused.

22
Figure 3.5 Parametric equalizer with spectrum analysis audio plug-in graphical user interface mock-up
with low-shelf and high-shelf filters
Figure 3.5 shows how the interface changes when we set the filter type for low-shelf in
the first filter or high-shelf in the fourth filter. As all parameters are set for peak, low-shelf
and high- shelf filter, all sliders then are visible.
4. Implementation
This chapter describes the process of the plug-in implementation. It presents used
tools and technologies with justification for the choice. There are listed classes, structs and
design patterns that were used in the work. The significant part of this chapter describes
implementation problems encountered while this process and points applied solutions for
these problems.
4.1. Tools
The following tools and technologies were used in my work to implement an audio
plug-in:
• JUCE 5.3 framework – the C++ framework for developing cross-platform audio
applications. It provides useful libraries for digital audio signal processing and building a
graphical user interface. [1]

23
• Projucer IDE – an IDE for creating and managing projects made with JUCE
framework
• Microsoft Visual Studio 2017– used for building the plug-in. Visual C++ is one of
the compilers supported by JUCE framework.
• VST3 SDK - Steinberg’s SDK for developing Virtual Studio Technology audio
plug-ins
• C++ programming language
The reason for choosing the JUCE framework was the fact that it is very useful tool to
implement cross-platform plug-ins because it generates the necessary APIs compatible
with Virtual Studio Technology standard. The pure VST SDK is complex and may be
difficult to use in its native form. JUCE noticeably reduces the complexity of dealing with
the Steinberg’s SDK and provides methods for the right way of application behaviour
during all the stages of its lifecycle. Apart from that, the framework includes also
numerous features simplifying GUI design and passing values between plug-in’s
components. This tool is also free of charge. JUCE does not contain its own compiler so it
has to be used with an external program providing one. Being recommended and supported
by JUCE’s authors for Windows use, Microsoft’s Visual Studio 2017 with Visual C++
compiler as this seemed to be the best option in my project.
4.2. Used classes and structs
The JUCE framework provides developers with useful classes and structs. The
following were used in my work to implement the audio plug-in:
• AudioProcessor - Base class for plug-ins and audio processing classes. It is used by
plug-in hosting code as a wrapper around the instance of a plugin that is loaded.
• AudioProcessorEditor - Base class for the components that act as the graphical user
interface for an AudioProcessor.
• Button - A base class for the buttons containing all the logic for button behaviours
such as enabling/disabling, on-click behaviour, etc.
• Colour – A class representing the colour.
• Component – Is a base class for all objects that are responsible for graphical user
interface.
• Decibels - The class containing static methods for dealing with values in decibel
unit such as gainToDecibels() and decibelsToGain().
• FFT – The class performing the Fast Fourier Transform.

24
• Graphics - Is used for drawing images or components, a graphics context. When
same of the Component objects needs painting, a Graphics context is being passed to the
Component::paint() method, then the component's content is painted.
• IIRCoefficients - A set of filter coefficients for IIRFilter objects. Used to set type
and parameters of an Infinite Impulse Response filter.
• IIRFilter – A processing class that can perform IIR filtering operations on the audio
signal
• Slider - A slider class used to control the changes of a value.
• Timer – Repeatedly makes callbacks to a virtual method at the specified interval of
time. Timer’s timerCallback() method is called every defined period of time.
• WindowingFunction - A class providing many windowing functions for use in
spectrum analysers and filter design.
• XmlElement - Used to build the tree of elements that represents an XML document.
Provides methods to parse xml document or convert the element into xml document.
[11]
4.3. Problems and solutions
This subchapter describes problems encountered during the implementation process
and shows how they were solved. Most of these problems were result of the lack of
knowledge in digital signal processing and JUCE framework. One problem referred to the
interface design. The stated issues required finding proper, well-thought approach,
however, all of them were successfully solved.
4.3.1. Stereo processing
To enable stereo sound processing as well as mono, there were certain solutions
that had to be applied in the implementation of my project. First of all, in context of stereo
processing, there are two input and output channels. Each of this channels must be
processed separately. In this plug-in that was filtering process that required processing for
each channel. Moreover, in this case, elements processing both channels must have the
same parameters.
To solve this problem, I separated user’s perspective from implementation details.
This was achieved by creating two instances of filter per one logical filter. There are two
instances of filter, one per each channel because of the number of channels in stereo – first
processes right channel while second independently processes left. When the signal is
mono, only one filter is applied. As regards the same parameters, when user sets them for
certain logical filter, two filters associated with it are being set to that parameters. As a
result, user gets the stereo result with no need to work with each channel separately. My
plug-in contains four logical filters which gives in total eight instances of infinite impulse
response (IIR) filter, coupled into pairs.
25
4.3.2. Saving and restoring parameters’ values
The next problem that was necessary to deal with in my work, was to keep
parameters set by user in the plug-in. The values was obliged to be saved after changing
plug-in windows, closing plug-in management window or closing the host application and
restored afterwards. To solve this problem, I decided to save parameter’s values to xml file
while closing application and restore them from this file while opening. The xml file is
created for every working instance of the plug-in. In my solution, methods from
XmlElement class are used. The following values are being saved and restored:
- frequency value of each filter
- gain value of each filter
- quality value of each filter
- type of each filters
- windowing function
Another problem was the fact, that when restoring parameters there were no objects
that this values might be assigned. It results from the lifecycle of the plug-in. As a solution,
there were created auxiliary variables for every parameter holding its value. When objects
are already created, those values are assigned to attributes of the objects.
4.3.3 Displaying spectrum of a current signal
One on the most important issues pertaining to analysing spectrum was to paint the
spectrum of a current signal on the screen. The solution was to use Timer class. The
EqSpectrumProcessorEditor class inherits form Timer class and overrides timerCallback()
and setTimer(int timeInMs) methods. The timerCallback() method is called every 30 ms
(interval set in setTimer method) what results in repainting the SpectrumComponent
element. The FFT of current samples stored in a buffer is transformed to the graphical form
and displayed on the interface.
4.3.4. Logarithmic scale
Next problem pertaining to spectrum analysis deals with scaling the axes and value
range selection. The best possible way was to make it compatible with human hearing
which is not linear but logarithmical in terms of both frequency and amplitude. To solve
this problem, logarithmic scale was applied for the spectrum axes. The amplitude axis
shows gain values in decibel units, to convert linear gain values to decibel scale
gainToDecibels() method from Decibels class was used. To transform the frequency axis,
it was needed to convert values from FFT algorithm from linear to logarithmic scale.
Scaling was achieved by a function converting linear value from 0-1 range (after
normalizing frequency range to 0-1) to logarithmic equivalent. The range of frequency axis
corresponds with Fourier transform properties and includes values 0 to sample rate / 2 .
The axis was narrowed down to 20Hz – 20 000Hz because of the human hearing
capabilities.
4.3.5. Buffering samples
To calculate the Fourier transform of a signal, the FFT algorithm must operate on
some section of this signal. The number of samples is dependent on chosen FFT size. To
hold the samples needed to calculate next frame of spectrum a buffer was necessary.
Moreover, the samples was required to be put and taken from that buffer in the same order
to retain the continuity of the signal. To solve this problem, the buffer with FIFO queue
26
method was applied. The length of this buffer is fixed and set for the FFT size. When the
sample is being processed, it is placed in the FIFO buffer. Once the buffer is filled
completely with samples, the Fourier transform is calculated and the buffer is cleared to
write new samples into it.
4.3.6. Filter class
There are many kinds of digital audio signal filters like FIR filters, IIR filters. As
one of the key element in my plug-in is the filtering process and at the same time there is
required minimal latency in processing, the right kind of filter should have been selected.
To solve this problem, the Filter class inherited from JUCE’s IIRFilter class was
implemented. The reason for choosing the Infinite Impulse Response filter was the fact,
that even though its roll-off is not that sharp as FIR filter, the signal processing with IIR
filter has far more better computational performance than the other filters.
4.3.7. Filter coefficients
The filtering capabilities of a filter are determined by its coefficients. The
coefficients affect filter parameters including type, order, frequency, quality and gain. To
solve the problem concerning calculating appropriate set of coefficients for a filter,
dedicated methods from IIRCoefficient class were used. This solution provides setting
correct parameters for infinite impulse response filters with specified type, frequency, gain
and quality with no need to solve complicated filtering mathematical equations.
4.3.8. Filter type selection
While shaping the sound, it is common for sound engineers and musicians to pay
particular attention to low and high frequencies, to cut or boost them. The most frequently
used are low-pass and high-pass filters, but shelving filters are also used in some cases. It
was reasonable to enable wide range of possibilities included in my plug-in with keeping
consistency at the same time. To solve this problem I decided to allow the user to change
type of two filters - one for lower frequencies and second for higher. The filter dealing
with lower frequencies can have high-pass(in other words cutting lower frequencies), low-
shelf or peak mode. The filter dealing with higher frequencies can have low-pass(in other
words cutting higher frequencies), high-shelf or peak mode. Moreover, for low-pass and
high-pass filters there is no gain parameter used, so the slider controlling this value
becomes invisible while choosing one of that modes. This solution was introduced in aim
to adjust to users’ diversified needs.
To change the filter type, dedicated buttons were created – one for lower and one for
higher frequencies. When the button is clicked by the user, type of this filter is being
changed for the next type. The example may be as following: when the current type is
peak, button click makes the type low-pass and the next click high-shelf, and after another
click the type returns to peak. The current type of the filter is written on the button so that
the user knows it.
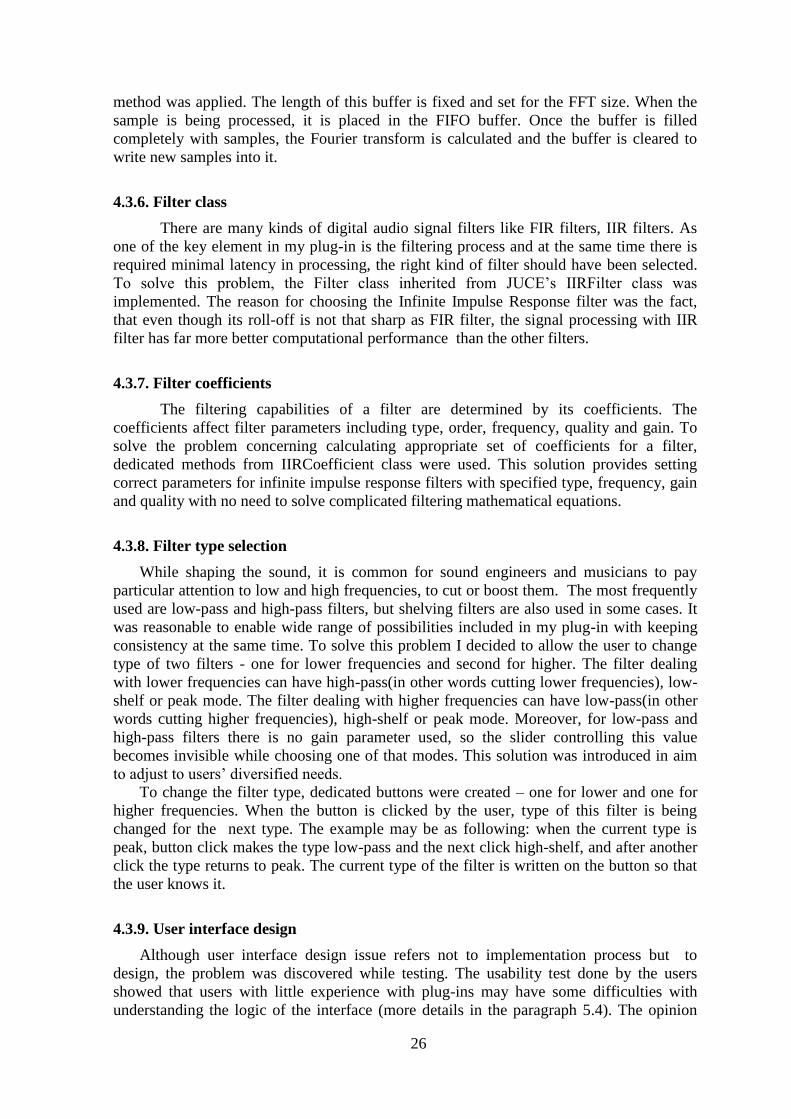
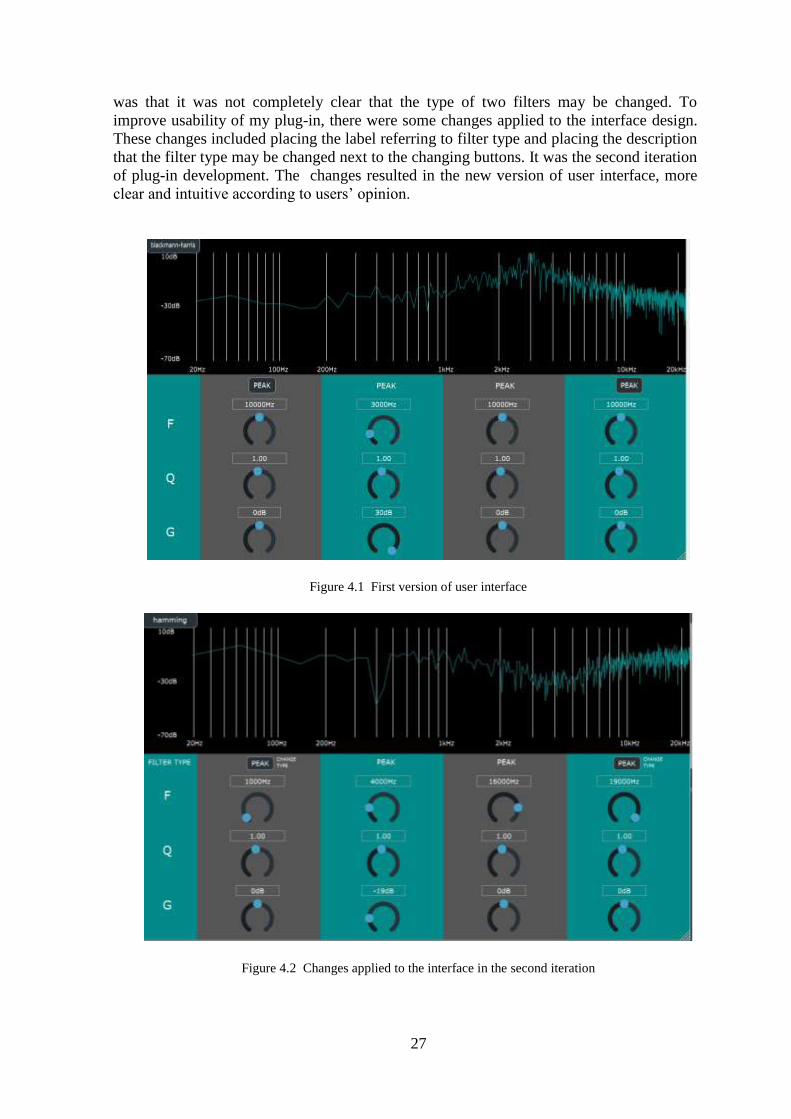
4.3.9. User interface design
Although user interface design issue refers not to implementation process but to
design, the problem was discovered while testing. The usability test done by the users
showed that users with little experience with plug-ins may have some difficulties with
understanding the logic of the interface (more details in the paragraph 5.4). The opinion
27
was that it was not completely clear that the type of two filters may be changed. To
improve usability of my plug-in, there were some changes applied to the interface design.
These changes included placing the label referring to filter type and placing the description
that the filter type may be changed next to the changing buttons. It was the second iteration
of plug-in development. The changes resulted in the new version of user interface, more
clear and intuitive according to users’ opinion.
Figure 4.1 First version of user interface
Figure 4.2 Changes applied to the interface in the second iteration
28
The figure 4.1 shows the first version, 4.2 demonstrates the improved version with
added label and description.
4.4. Design patterns
The design patterns are reusable solutions to the commonly occurring problems. In my
work I used some reusable solutions for certain problems. Although they are very
common, these solutions are patters according to the definition of pattern term.
The solutions are following:
• Slider – the method of controlling values. Solves the problem of choosing value
from certain range. Slider is used instead of only text box with range validation. It is very
useful way to control parameter’s value. Moreover, rotary sliders are also universal
solution used in interfaces of hardware audio devices including parametric equalizers to
control parameters.
• Logarithmic scale – a scale where values are distributed logarithmically. This is the
common reusable solution for the frequency and gain values representation. Linear scale
does not suit human hearing capabilities well. Logarithmic scale solves the problem
because human hearing is logarithmic bot in sound frequency and amplitude aspects.
• FIFO queue – the solution for buffering and processing the values following the
sequence. FIFO solves the problem and remains the order of vales by putting the value at
the begging of the buffer and withdrawing from the end. In my work FIFO buffer is used to
store signal samples.
5. Testing and practical usage
This chapter describes how the artefact of my work was tested and discusses the
results. There is also presented how the plug-in works inside the DAW host, what are the
possibilities and results of filtering and changing the windowing function.
5.1. Compatibility tests
The implemented plug-in is available in following formats:
• VST
• VST3
Implemented equalizer with spectrum analysis can be hosted in many different Digital
Audio Workstation applications. My plug-in was tested with DAW applications including:
• REAPER
• Ableton Live
• FL Studio
• Audacity
• Logic Pro
• Cubase
• Nuendo
• Samplidude
29
The plug-in’s behaviour was the same in all of these host applications. The DAWs
selected for testing purposes listed above are not all possible hosts for implemented plug-in
but the most common ones. It means, the created plug-in is able to be applied in majority
of the most popular DAWs.
The plug-in was also tested using different operating systems:
• Windows
• macOS
• Linux
There were no differences in behaviour noticed while using the plug-in on these
operating systems.
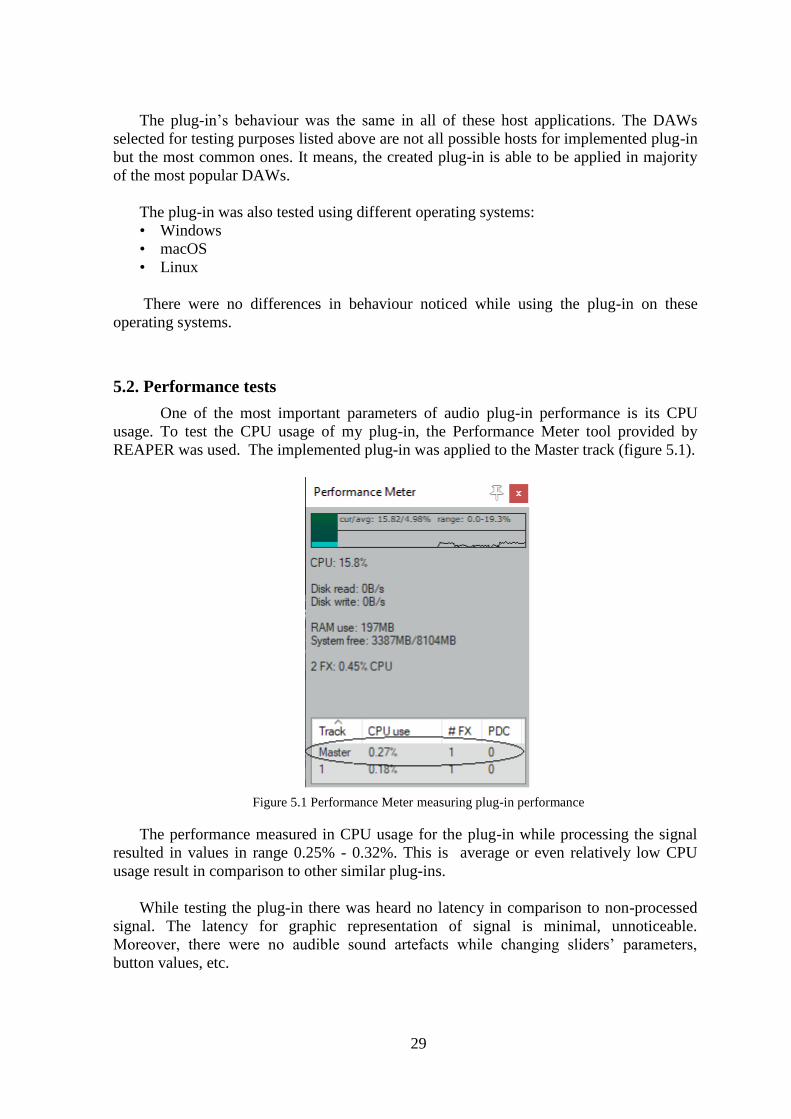
5.2. Performance tests
One of the most important parameters of audio plug-in performance is its CPU
usage. To test the CPU usage of my plug-in, the Performance Meter tool provided by
REAPER was used. The implemented plug-in was applied to the Master track (figure 5.1).
Figure 5.1 Performance Meter measuring plug-in performance
The performance measured in CPU usage for the plug-in while processing the signal
resulted in values in range 0.25% - 0.32%. This is average or even relatively low CPU
usage result in comparison to other similar plug-ins.
While testing the plug-in there was heard no latency in comparison to non-processed
signal. The latency for graphic representation of signal is minimal, unnoticeable.
Moreover, there were no audible sound artefacts while changing sliders’ parameters,
button values, etc.

30
5.3. Usability tests
During this stage of testing, the usability aspects of implemented plug-in were tested.
The process of testing was done by a group of possible end-users. The number of the
people in this group was 5. They were asked to use the plug-in in their work environment,
answer prepared questions and give suggestions if they noticed some problems or other
possible solutions. The testing covered aspects of plug-in overall usability, layout and user
interface elements, intuitiveness, ease to understand, ease to complete intendent tasks,
workflow, overall structure. The asked questions were based on Nielsen’s usability
heuristics.
The results were as following:
• Do you always know what is the current state of the equalizer and spectrum
analyser? Yes: 5 No:0
• Do you think that the plug-in interface matches the interface of hardware audio
devices (software component matches the real world) ? Yes:5 No:0
• Did you have any problems with understanding the interface? Yes:4 No:1
• Did you have any problems with understanding the plug-in functions? Yes:1 No:4
• Do you always know how to undo unwanted move (parameter change etc.)?
Yes:5 No:0
• Do you think that interface design is clear and consistent? Yes:5 No:0
• Did you completed intended tasks easily? Yes:5 No:0
• Are you going to use this plug-in in the future? Yes: 5 No: 0
As the survey results and tester’s opinion showed, the overall usability of the plug-in
was rated as successful. One of the users had problems with understanding the interface at
the first contact with the application. That user suggested, that it was not completely clear
that the type of two filters may be changed. But after a while of using the plug-in he
learned this function. To solve the problem and make the interface more clear and
understandable, proper actions were taken. These actions meant changing the design of the
interface for better usability. It is described in subchapter 4.3.9. After applying the
changes, the interface was described as more intuitive by the users. Moreover, all of the
users said, that they will use my plug-in in the future.
31
5.4. Practical usage
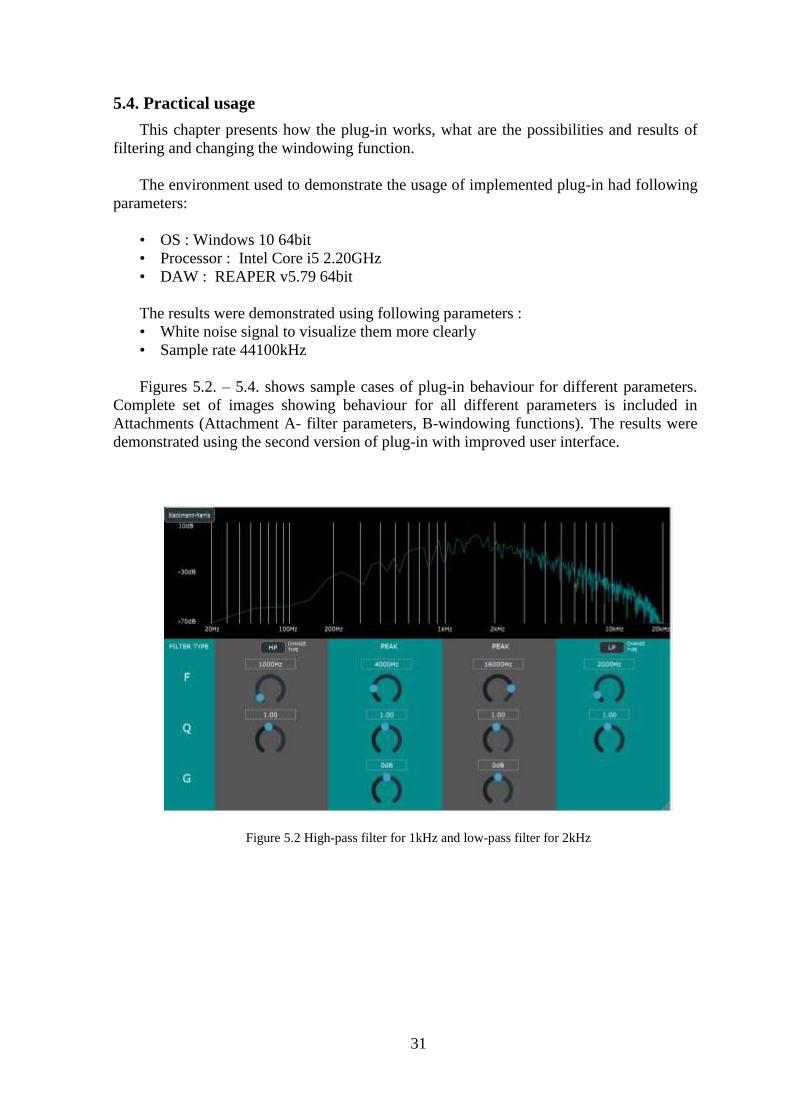
This chapter presents how the plug-in works, what are the possibilities and results of
filtering and changing the windowing function.
The environment used to demonstrate the usage of implemented plug-in had following
parameters:
• OS : Windows 10 64bit
• Processor : Intel Core i5 2.20GHz
• DAW : REAPER v5.79 64bit
The results were demonstrated using following parameters :
• White noise signal to visualize them more clearly
• Sample rate 44100kHz
Figures 5.2. – 5.4. shows sample cases of plug-in behaviour for different parameters.
Complete set of images showing behaviour for all different parameters is included in
Attachments (Attachment A- filter parameters, B-windowing functions). The results were
demonstrated using the second version of plug-in with improved user interface.
Figure 5.2 High-pass filter for 1kHz and low-pass filter for 2kHz
32
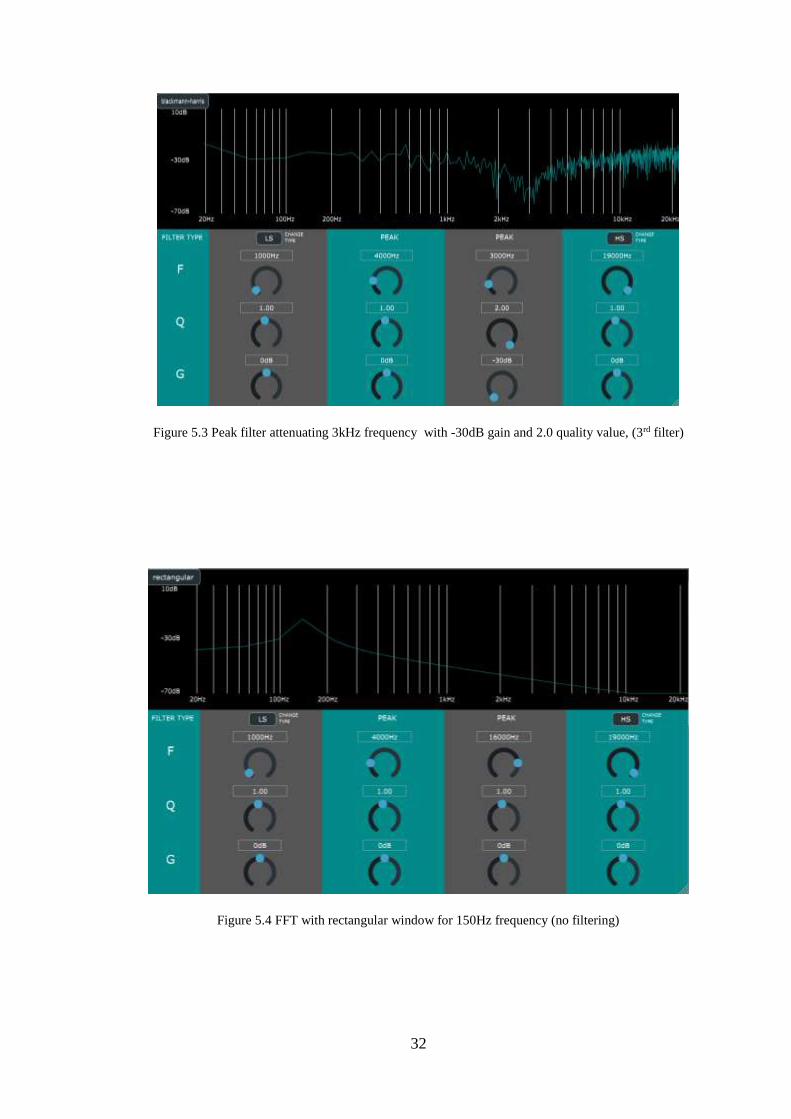
Figure 5.3 Peak filter attenuating 3kHz frequency with -30dB gain and 2.0 quality value, (3rd filter)
Figure 5.4 FFT with rectangular window for 150Hz frequency (no filtering)
33
6. Summary
The goals of the application that was the subject of this thesis including application
design, implementation and testing were successfully completed.
The artefact of my work – the equalizer with spectrum analyser audio plug-in meets
the functional and non-functional requirements stated during design process:
• Enables shaping the frequency components in audio signal in desired way
• Allows using four filters to shape the audio signal
• Allows selecting filter type to shape lower frequencies (low pass, low shelf, peak)
• Allows selecting filter type to shape higher frequencies (high pass, high shelf, peak)
• Allows attenuating or boosting frequency components of a signal in a region of a
given centre frequency
• Enables setting frequency parameter for each filter
• Enables setting quality parameter for each filter
• Enables setting gain parameter for each filter
• Enables visualizing shaping effects by showing signal in frequency domain
(spectrum)
• Allows selecting windowing function used in spectrum analysis
• Can be used on different operation systems (Windows, macOS, Linux)
• Can be hosted in different host applications (DAWs)
• Provides CPU usage 0.25% - 0.32 %
• Provides minimal latency for signal processing
• Has clear user interface
• Has no distortion or other audible artefacts while changing parameters
Most the problems encountered during the implementation process were caused by the
lack of experience in signal processing, plug-in development and JUCE framework.
However all of them were successfully solved. This resulted in gaining more knowledge
and programming skills. Moreover, learning the Visual Studio Technology Standard and
experience in JUCE framework gave me an overview and possibilities to develop audio
plug-ins in the most widely used technologies in this field.
One of the problems referred to user interface design. Some elements were not clear
enough for the users with little experience with plug-ins. To improve the usability, the
changes in the interface were applied which solved the problem.
One of the most meaningful motivations for choosing this subject of an engineer’s
thesis was to learn the rules and principles of digital signal processing and use this
knowledge in practice. This goals was achieved by designing and implementing the audio
plug-in. The most important applications of digital audio signal processing are filtering
operations and sound signal analysis – my plug-in consisted both of them. The users that
were testing the artefact agreed that combining these two functionalities in one plug-in is
useful and helps them in aware use of equalizer.

34
6.1. Further development possibilities
Although the implemented plug-in is fully functional solutions there may be
pointed some further development possibilities. As my plug-in is the parametric equalizer,
the obvious possibility is adding the graphical equalizer feature. It means adding a
dedicated graphical module allowing the user to drag the specified points on the spectrum
line and as a result change filters’ parameters. The values will automatically adjust to the
shape of the line. It is common solution used in equalizer plug-ins.
35
Bibliography
[1] Steinberg. 3rd Party Developer,
http://www.steinberg.net/en/company/developer.html , (accessed 14.10.2018)
[2] Tanev G., Bozinovski A., Virtual Studio Technology and its application in music
production, ICT Innovations 2013, 2013, pp. 231-241
[3] Steinberg. VST3: New Standard for Virtual Studio Technology,
https://www.steinberg.net/en/company/technologies/vst3.html, (accessed 17.10.2018)
[4] Antoniou A., Digital Signal Processing. Signals, Systems and Filters., New York,
The McGraw-Hill Companies, 2006
[5] Smith S. W., The Scientist and Engineer's Guide to Digital Signal Processing,
California Technical Publishing, 1999
[6] Narcowich F., Linear Filters, Texsas A&M University,
www.math.tamu.edu/~fnarc/, (accessed 20.10.2018)
[7] Zöler U., Digital Audio Signal Processing, Chichester, John Willey & Sons, 1997
[8] Case A. “Mix Smart: Pro Audio Tips For Your Multitrack Mix”, Focal Press, 2011
[9] Siemens PLM Software, Introduction to Filters: FIR versus IIR,
https://community.plm.automation.siemens.com/t5/Testing-Knowledge-
Base/Introduction-to-Filters-FIR-versus-IIR, , (accessed 18.10.2018)
[10] Brigham O., The Fast Fourier Transform and its Applications, Prentice-Hall Inc.,
1988
[11] JUCE, documentation, https://juce.com/learn/documentation,
(accessed 20.11.2018)

36
List of Figures
Figure 2.1 Frequency responses of different types of filters (schema based
on [8])……………………………………………………………………………p.12
Figure 2.2 Filter parameters (schema based on [8])…………………………………… p.13
Figure 2.3 Windowing function (schema based on [7])…………………………………p.14
Figure 3.1 UML class diagram…………………………………………………………..p.18
Figure 3.2 Hardware parametric equalizer (source: www.sontec.de )…………………..p.19
Figure 3.3 Parametric equalizer with spectrum analysis audio plug-in graphical user
interface mock-up……………………………………………………………p.20
Figure 3.4 Parametric equalizer with spectrum analysis audio plug-in graphical user
interface mock-up with low-pass and high-pass filters……………………...p.21
Figure 3.5 Parametric equalizer with spectrum analysis audio plug-in graphical user
interface mock-up with low-shelf and high-shelf filters ……………………p.22
Figure 4.1 First version of user interface……………………………………………….p.27
Figure 4.2 Changes applied to the interface in the second iteration ………………….. p.27
Figure 5.1 Performance Meter measuring plug-in performance………………………...p.29
Figure 5.2 High-pass filter for 1kHz and low-pass filter for 2kHz ……………………..p.31
Figure 5.3 Peak filter attenuating 3kHz frequency with -30dB gain and 2.0 quality value,
(3rd filter) ……………………………………………………………………….p.32
Figure 5.4 FFT with rectangular window for 150Hz frequency (no filtering) . ………...p.32
Figure A.1. White noise spectrum with no equalization parameters set ………..………p.37
Figure A.2. High-pass filter for 1kHz and low-pass filter for 2kHz ………….………...p.37
Figure A.3. Low-shelf filter for 500Hz and high-shelf filter for 4kHz, gain -25dB (1st and
4th filter) ……………………………………………………………………p.38
Figure A.4. Peak filter boosting 3kHz frequency with 30dB gain and 1.0 quality value,
(3rd filter) …………………………………………………………………….p.38
Figure A.5. Peak filter attenuating 3kHz frequency with -30dB gain and 2.0 quality value
(3rd filter) …………………………………………………………………... p.39
Figure A.6. Peak filter attenuating 3kHz frequency with -30dB gain and 0.5 quality
value ………………………………………………………………………….p.39
Figure B.1. FFT with rectangular window for 150Hz frequency
(no filtering) ………………………………………………………………..…...p.40
Figure B.2. FFT with Blackmann-Harris window for 150Hz frequency
(no filtering) ………………………………………………………….………....p.40
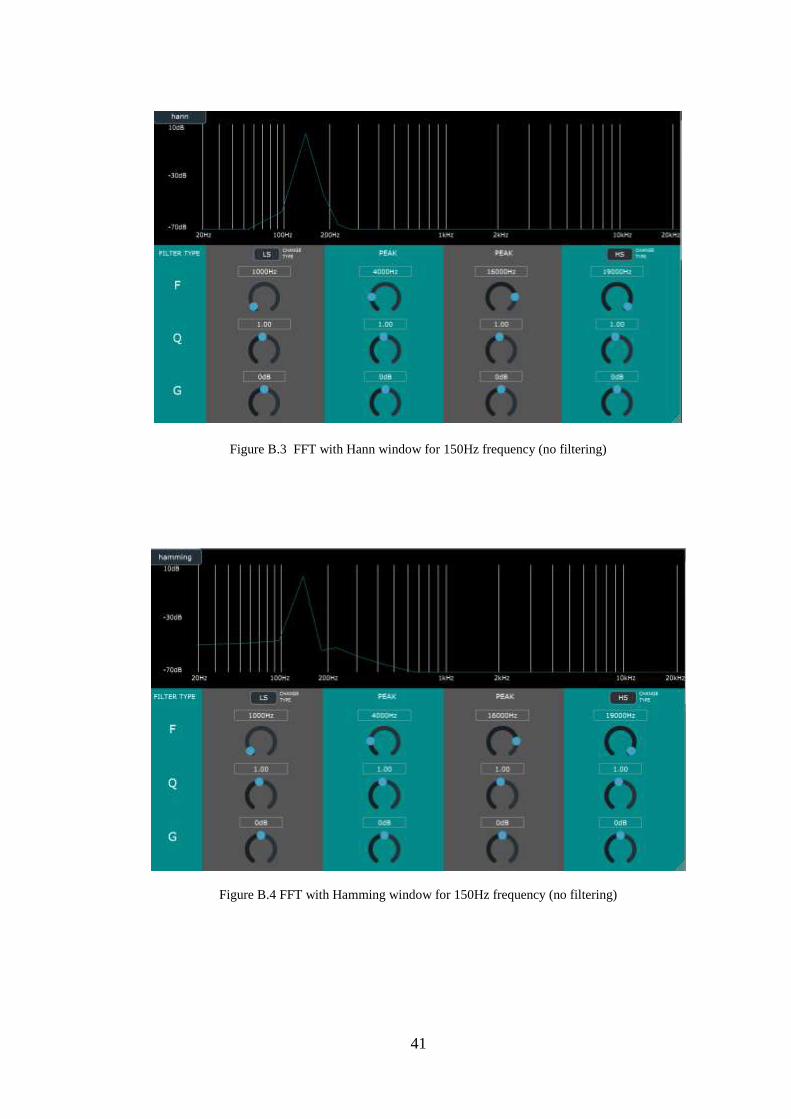
Figure B.3. FFT with Hann window for 150Hz frequency (no filtering) ………………p.41
Figure B.4. FFT with Hamming window for 150Hz frequency (no filtering) ………….p.41
37
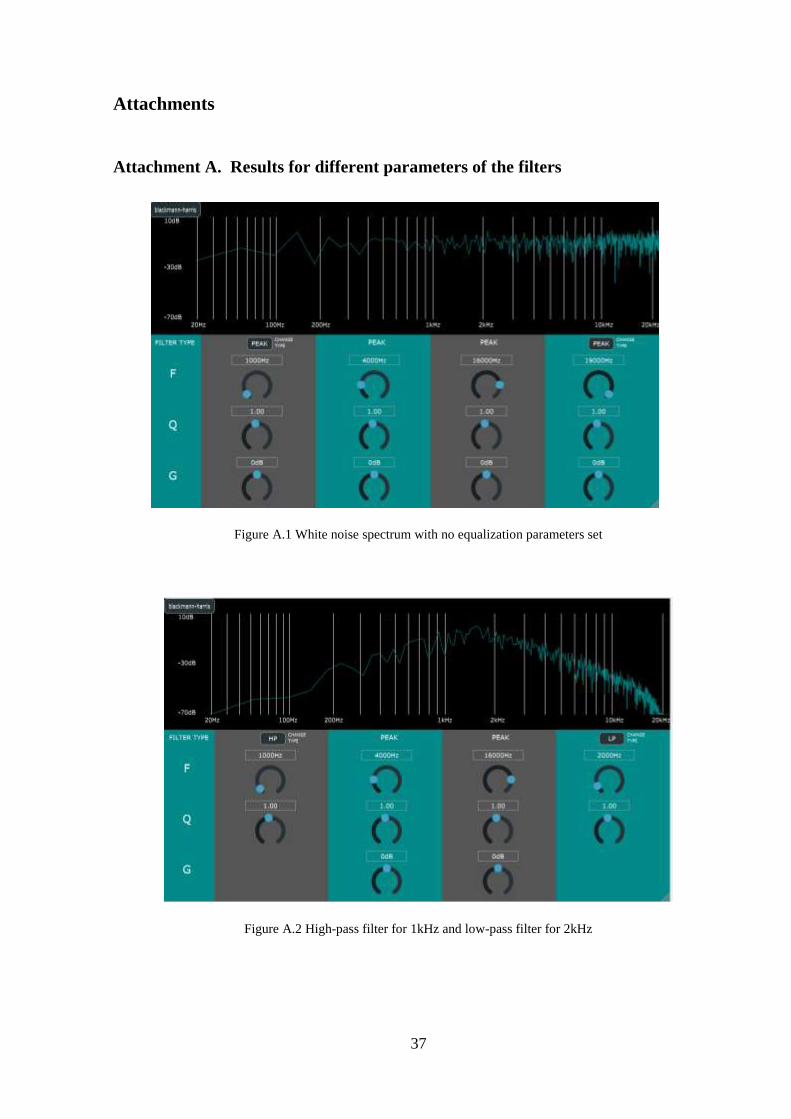
Attachments
Attachment A. Results for different parameters of the filters
Figure A.1 White noise spectrum with no equalization parameters set
Figure A.2 High-pass filter for 1kHz and low-pass filter for 2kHz
38
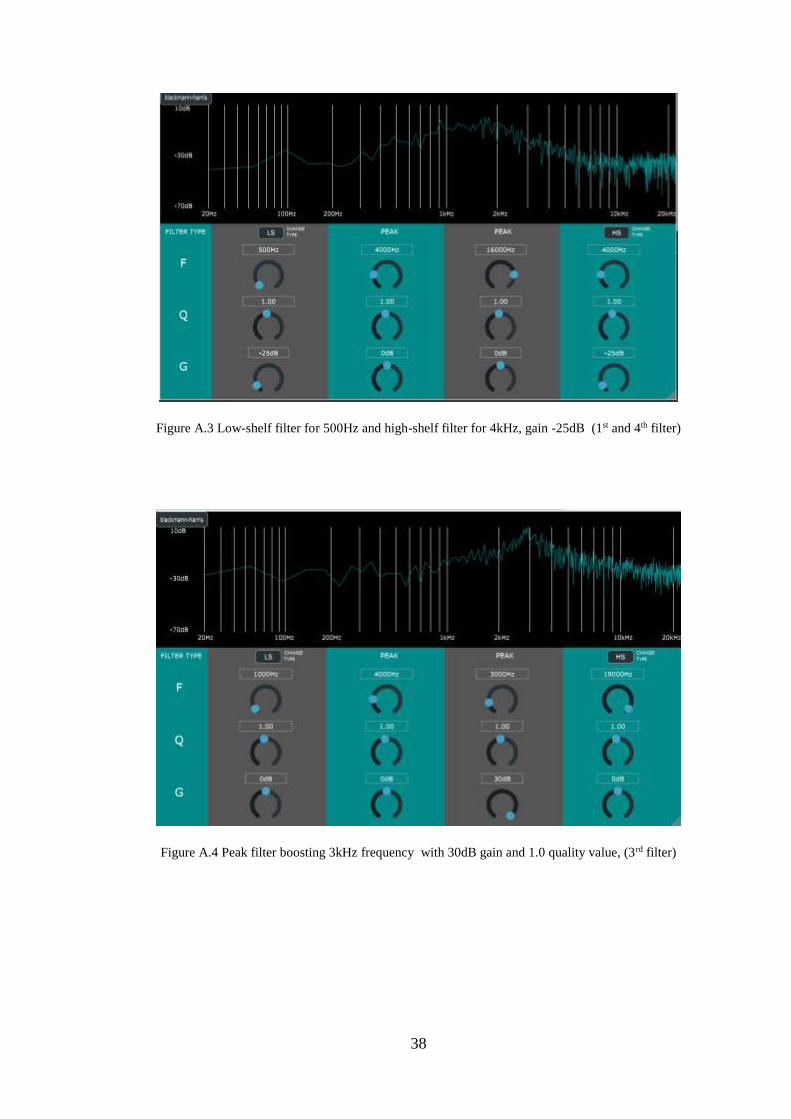
Figure A.3 Low-shelf filter for 500Hz and high-shelf filter for 4kHz, gain -25dB (1st and 4th filter)
Figure A.4 Peak filter boosting 3kHz frequency with 30dB gain and 1.0 quality value, (3rd filter)
39
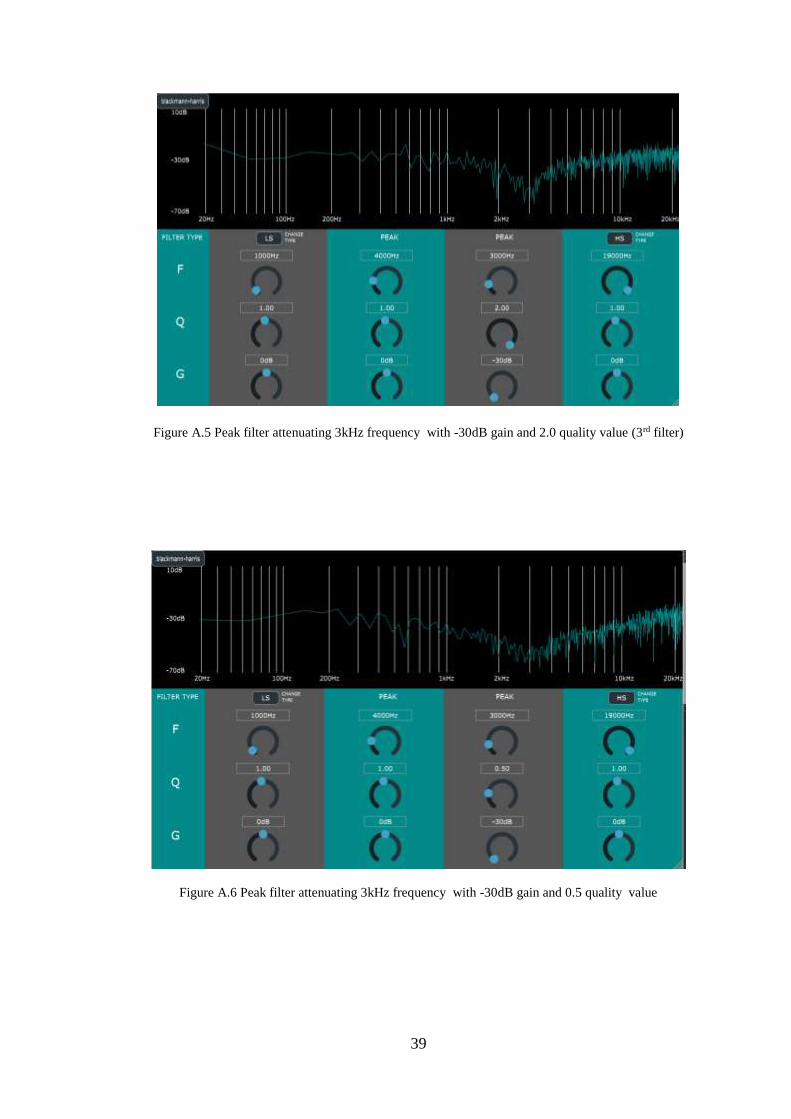
Figure A.5 Peak filter attenuating 3kHz frequency with -30dB gain and 2.0 quality value (3rd filter)
Figure A.6 Peak filter attenuating 3kHz frequency with -30dB gain and 0.5 quality value
40
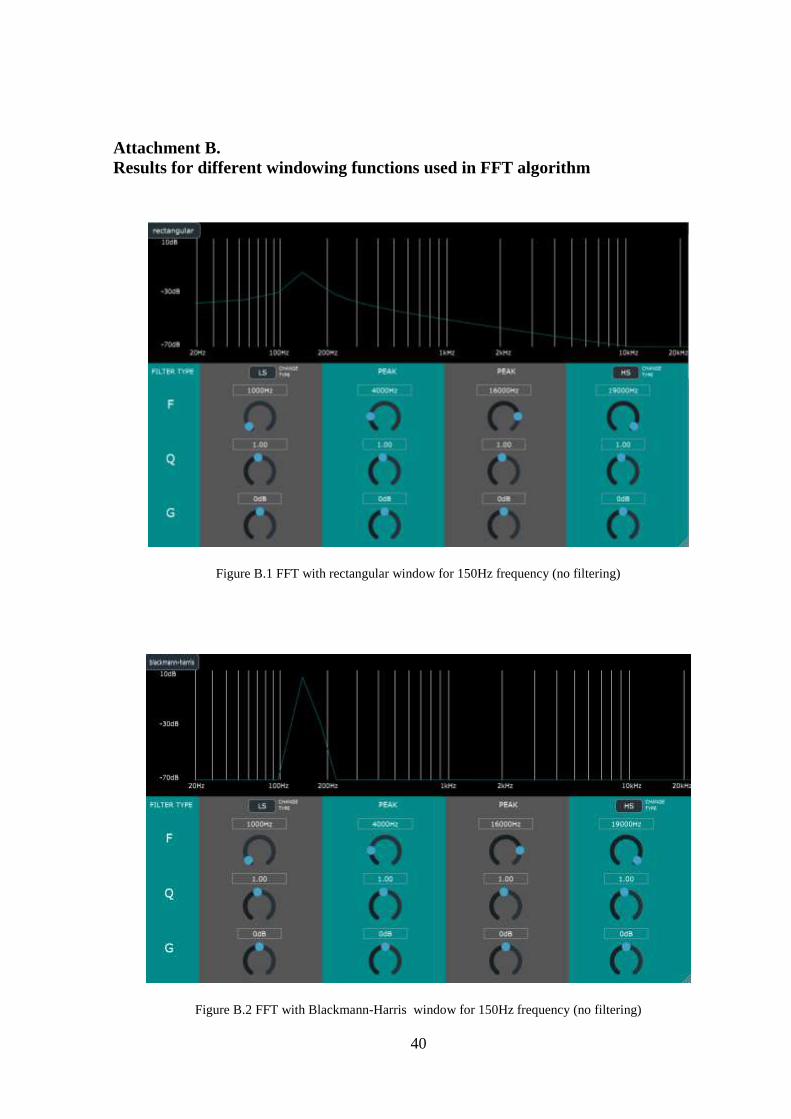
Attachment B.
Results for different windowing functions used in FFT algorithm
Figure B.1 FFT with rectangular window for 150Hz frequency (no filtering)
Figure B.2 FFT with Blackmann-Harris window for 150Hz frequency (no filtering)
41
Figure B.3 FFT with Hann window for 150Hz frequency (no filtering)
Figure B.4 FFT with Hamming window for 150Hz frequency (no filtering)