pr-948 robust water-management strategies for the ... · pdf file8/4/2015 ·...
TRANSCRIPT

Technical Memorandum
Robust Water-Management Strategies for the California Central Valley
Technical Analysis for the California Water Plan Update 2013
UPDATED: February 2014
Topic: Data and Analytical Tools Robust Water-Management Strategies for The California Central Valley
California Water Plan Update 2013 Vol 4 Reference Guide Page 1

ii
This page left blank intentionally.
Topic: Data and Analytical Tools Robust Water-Management Strategies for The California Central Valley
California Water Plan Update 2013 Vol 4 Reference Guide Page 2

iii
This Document Prepared by:
David Groves, PhD The RAND Corporation
Policy Researcher
Evan Bloom The RAND Corporation
Research Assistant
Edmundo Molina-Perez The RAND Corporation
Research Assistant
Brian Joyce Stockholm Environment Institute
Senior Scientist
Topic: Data and Analytical Tools Robust Water-Management Strategies for The California Central Valley
California Water Plan Update 2013 Vol 4 Reference Guide Page 3

iv
Abstract
California faces significant challenges in ensuring that its water resources successfully meet diverse needs across the state in the coming decades. The California Water Plan has been developing new data and tools to evaluate management conditions and new strategies under climate variability and change. This report describes a technical analysis of the Central Valley water management approach performed for the California Water Plan Update 2013. This analysis uses Robust Decision Making to identify key future vulnerabilities of the current management approach to urban and agricultural reliability, groundwater storage, and environmental flows in the Central Valley. It next evaluates how response packages, comprised of different management strategies, might reduce these vulnerabilities. Lastly, it presents key trade-offs among the different response packages in terms of their cost and their ability to reduce vulnerabilities. The analysis finds that the agricultural sector in the San Joaquin River hydrologic region and the urban and agricultural sectors in the Tulare Lake hydrologic region are particularly vulnerable to many plausible future climate and growth projections. Groundwater levels and environmental flows are also vulnerable. Increases in efficiency, groundwater conjunctive use, and reuse can significantly reduce these vulnerabilities. The implementation of new environmental flow and groundwater targets improves outcomes relative to flows and groundwater, but decreases the reliability of water supplies for urban and agricultural use. It also shows that even with significant diversification and investment in water use efficiency, recycled municipal water, and conjunctive management, some vulnerability to future growth and climate change still remains. Consideration of additional strategies, such as new surface storage, and other combinations of strategies (i.e., response packages) might reveal more cost-effective approaches for each region. The study uses a high-level planning model of the Central Valley. As such, it is designed to support discussions about future water management strategies rather than develop recommendations for specific options.
Topic: Data and Analytical Tools Robust Water-Management Strategies for The California Central Valley
California Water Plan Update 2013 Vol 4 Reference Guide Page 4
v
Contents
Abstract .......................................................................................................................................... ivFigures........................................................................................................................................... viiTables ............................................................................................................................................. ixSummary ......................................................................................................................................... x
How Would Current Water Management in the Central Valley Perform Under Different Plausible Futures? ............................................................................................................................................. xi
What Are the Vulnerabilities of the Current Management Approach? .................................................. xiiHow Would Response Packages Reduce the Vulnerabilities of the Current Water Management
Approach? ....................................................................................................................................... xivHow Much More Resilient Would the Central Valley Be to a Changing Climate with the
Implementation of Response Packages? ......................................................................................... xviWhat Are the Trade-Offs Between Vulnerability Reduction and Cost? .............................................. xviiHow Does This Analysis Inform the California Water Plan? ............................................................. xviiiLimitations and Future Directions ......................................................................................................... xix
Acknowledgments........................................................................................................................ xxiAbbreviations .............................................................................................................................. xxii1. Introduction ................................................................................................................................. 1
The California Water Plan’s Vulnerability and Response Package Analysis .......................................... 2How This Document Is Organized ........................................................................................................... 4
2. An Overview of Robust Decision Making for Water Planning .................................................. 5Structuring Decisions ........................................................................................................................... 8Simulation of Many Futures ................................................................................................................. 8Vulnerability Analysis .......................................................................................................................... 9Trade-Off Analysis ............................................................................................................................... 9
3. Scope of the Vulnerability and Response Package Analysis .................................................... 11Key Planning Questions ......................................................................................................................... 11Uncertainties ........................................................................................................................................... 12
Climate Conditions ............................................................................................................................. 12Growth Scenarios ............................................................................................................................... 15Uncertain Futures ............................................................................................................................... 17
Performance Metrics .............................................................................................................................. 18Urban and Agricultural Supply Reliability......................................................................................... 19Change in Groundwater Storage ........................................................................................................ 22Instream Flow Requirement and Environmental Flow Target Reliability ......................................... 23Defining Vulnerabilities ..................................................................................................................... 25
Management Strategies and Response Packages .................................................................................... 26Management Strategies ...................................................................................................................... 26
Topic: Data and Analytical Tools Robust Water-Management Strategies for The California Central Valley
California Water Plan Update 2013 Vol 4 Reference Guide Page 5

vi
Response Packages ............................................................................................................................. 29Costs of Implementing Response Packages ....................................................................................... 32
Relationships .......................................................................................................................................... 334. Results: Vulnerability of the Current Management Approach ................................................. 36
How Would Current Water Management in the Central Valley Perform Under Different Plausible Futures? ............................................................................................................................................ 36
Urban and Agricultural Demand, Supply, and Reliability ................................................................. 36What Are the Vulnerabilities of the Current Management Approach? .................................................. 39
Characteristics of Vulnerabilities ....................................................................................................... 405. Results: Mitigating Vulnerabilities Through Response Packages ............................................ 46
How Would Response Packages Reduce the Vulnerabilities of the Current Management Approach? . 46How Much More Resilient Would the Central Valley Be to a Changing Climate with the
Implementation of Response Packages? .......................................................................................... 52What Are the Trade-Offs Between Vulnerability Reduction and Cost? ................................................ 54
6. Discussion ................................................................................................................................. 59How Does This Analysis Inform the California Water Plan? ................................................................ 59Limitations of the Analysis .................................................................................................................... 60Future Directions .................................................................................................................................... 61
References ..................................................................................................................................... 62
Topic: Data and Analytical Tools Robust Water-Management Strategies for The California Central Valley
California Water Plan Update 2013 Vol 4 Reference Guide Page 6

vii
Figures
Figure S.1. Range of Urban and Agricultural Reliability Results Across 198 Futures ................. xiFigure S.2. Summary of Key Performance Metrics Across 198 Futures with the Current Water
Management Approach ........................................................................................................ xiiiFigure S.3. Change in Urban and Agricultural Reliability from Currently Planned Management
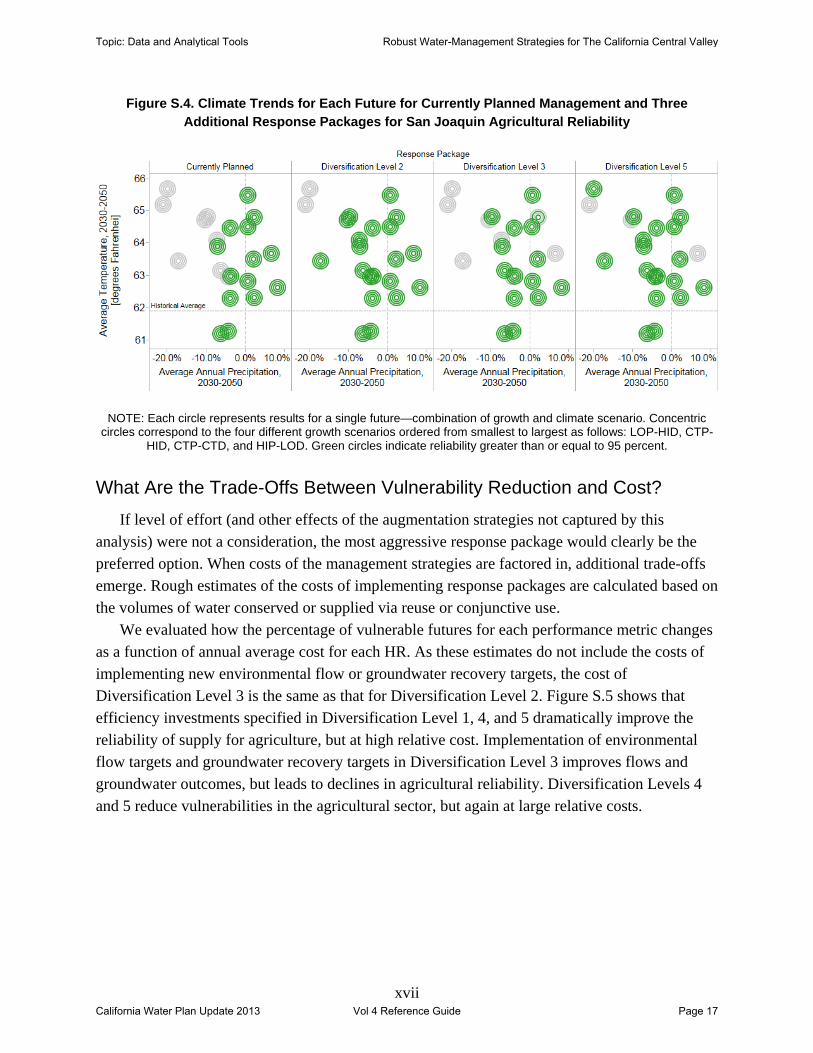
to Response Package 2, then to Response Package 3, and then to Response Package 5 ...... xvFigure S.4. Climate Trends for Each Future for Currently Planned Management and Three
Additional Response Packages for San Joaquin Agricultural Reliability ........................... xviiFigure S.5. Trade-Off Curves of Number of Vulnerable Futures Versus Cost for Different
Metrics Across Response Packages for the San Joaquin River Hydrologic Region ......... xviiiFigure 1.1. Map of California Indicating the Central Valley Watershed ........................................ 3Figure 2.1. Emerging Adaptive making Decisionmaking Framework for Long-Term Water
Planning and Management ...................................................................................................... 6Figure 2.2. Iterative Steps of an RDM Analysis ............................................................................. 8Figure 3.1. Temperature and Precipitation Characterizations for Climate Projections ................ 15Figure 3.2. Change in Urban Footprint and Irrigated Land Area for Nine Land Use Scenarios .. 17Figure 3.3. Single Simulation of Urban Supply, Demand, and Unmet Demand for the San
Joaquin River Hydrologic Region ........................................................................................ 20Figure 3.4. Single Simulation of Agricultural Supply, Demand, and Unmet Demand for the San
Joaquin River Hydrologic Region ........................................................................................ 21Figure 3.5. Agricultural Supply Reliability for Two Futures in the San Joaquin River Hydrologic
Region ................................................................................................................................... 22Figure 3.6. Change in November Groundwater Storage Over Time for Two Simulations for the
San Joaquin River Hydrologic Region ................................................................................. 23Figure 3.7. Locations of Instream Flow Requirements and Environmental Flow Targets
Evaluated............................................................................................................................... 24Figure 3.8. Simulation of Monthly Instream Flows and Reliability in Meeting an Instream Flow
Requirement for 10-year period ............................................................................................ 25Figure 3.9. Select Calibration Results for the WEAP Central Valley Model ............................... 35Figure 4.1. Range of Urban and Agricultural Reliability Results Across 198 Futures ................ 37Figure 4.2. Urban and Agricultural Supply Reliability for Three Hydrologic Regions for
Currently Planned Management ........................................................................................... 37Figure 4.3. Range of Groundwater Storage Changes Across 198 Futures ................................... 38Figure 4.4. Range of Instream Flow Requirement Reliability Across 198 Futures ...................... 39Figure 4.5. Summary of Key Performance Metrics Across 198 Futures with the Current Water
Management Approach ......................................................................................................... 40
Topic: Data and Analytical Tools Robust Water-Management Strategies for The California Central Valley
California Water Plan Update 2013 Vol 4 Reference Guide Page 7

viii
Figure 4.6. Climate Trends (Temperature Trends and Changes in Precipitation) for Each Future for San Joaquin River Agriculture with Hot and Dry Composite Scenario Indicated .......... 43
Figure 4.7 Climate Trends (Temperature Trends and Changes in Precipitation) for Each Future for the Tulare Lake Urban Sector for High Population-Low Density Growth Scenario, with Drier Than Historical with Expansive Growth Composite Scenario Indicated .................... 44
Figure 4.8 Climate Trends (Temperature Trends and Changes in Precipitation) for Each Future for Tulare Lake Agriculture with Anything But Wet Scenario ............................................ 45
Figure 5.1. Change in Urban and Agricultural Reliability from Currently Planned Management to Response Package 1, then to Response Package 2, and then to Response Package 3 .......... 47
Figure 5.2. Change in Urban and Agricultural Reliability from Response Package 3 to Response Package 4, and then to Response Package 5 ......................................................................... 48
Figure 5.3. Percent of Vulnerable Futures for Each Response Package for the Sacramento River Hydrologic Region ................................................................................................................ 49
Figure 5.4. Percent of Vulnerable Futures for Each Response Package for the San Joaquin River Hydrologic Region ................................................................................................................ 50
Figure 5.5. Range of Reliability for Three Environmental Flow Targets Across 88 Futures for Currently Planned Management and Diversification Level 3 ............................................... 51
Figure 5.6. Percent of Vulnerable Futures for Each Response Package for Tulare Lake Hydrologic Region ................................................................................................................ 51
Figure 5.7. Climate Trends for Each Future for Currently Planned Management and Three Additional Response Packages for San Joaquin Agricultural Reliability ............................. 52
Figure 5.8. Climate Trends for Each Future for Currently Planned Management and Three Additional Response Packages for Tulare Lake Urban Reliability ...................................... 53
Figure 5.9. Climate Trends for Each Future for Currently Planned Management and Three Additional Response Packages for Tulare Lake Agricultural Reliability ............................. 53
Figure 5.10. Trade-Off Curves of Percentage of Vulnerable Futures Versus Cost For Different Metrics Across Response Packages for the Sacramento River Hydrologic Region ............. 55
Figure 5.11. Trade-Off Curves of Number of Vulnerable Futures Versus Cost for Different Metrics Across Response Packages for the San Joaquin River Hydrologic Region ............ 56
Figure 5.12. Trade-Off Curves of Number of Vulnerable Futures Versus Cost for Different Metrics Across Response Packages for Tulare Lake Hydrologic Region ............................ 57
Topic: Data and Analytical Tools Robust Water-Management Strategies for The California Central Valley
California Water Plan Update 2013 Vol 4 Reference Guide Page 8

ix
Tables
Table 3.1. XLRM Matrix Summarizing the Scope of the RDM Analysis ................................... 12Table 3.2. Growth Scenarios for the Urban Sector for the Central Valley ................................... 16Table 3.3. Growth Scenarios for the Agricultural Sector for the Central Valley ......................... 17Table 3.4. Performance Metrics .................................................................................................... 18Table 3.5. Representation of Unmet Environmental Flow Objectives in the Analysis ................ 24Table 3.6. Water-Management Strategies That Could Be Simulated by the WEAP Model ........ 27Table 3.7. Summary of Current Planned Management Approach and Response Packages ......... 30Table 3.8. Implementation Cost Estimates for Management Strategies ....................................... 33Table 4.1. Composite Scenarios Identified for the San Joaquin River Agricultural, Tulare Lake
Urban, and Tulare Lake Agricultural Sectors ....................................................................... 42Table 5.1. Percentage of Futures Vulnerable for Each Decision-Relevant Composite Scenario by
Response Package for 88 Futures ......................................................................................... 58
Topic: Data and Analytical Tools Robust Water-Management Strategies for The California Central Valley
California Water Plan Update 2013 Vol 4 Reference Guide Page 9
x
Summary
California faces significant challenges in ensuring that its water resources successfully meet diverse needs across the state in the coming decades. Escalating needs due to population and economic growth, agricultural irrigation requirements that shift to higher value permanent crops, and growing desires to dedicate more water to the environment will put a strain on a system that is near or exceeds capacity. These challenges are exacerbated by potential declines in the available water supply due to natural variability and climatic changes.
This report describes a technical analysis of the Central Valley water management conditions performed for the California Water Plan (CWP) Update 2013. This analysis uses Robust Decision Making (RDM) to identify key future vulnerabilities of the current management approach to urban and agricultural reliability, groundwater storage, and environmental flows in the Central Valley. It next evaluates how response packages, comprised of different management strategies, might reduce these vulnerabilities. Lastly, it presents key trade-offs among the different response packages in terms of their cost and their ability to reduce vulnerabilities.
This analysis is intended to identify high-level long-term vulnerabilities of the Central Valley water-management system and then evaluate how different combinations of management strategies could reduce these vulnerabilities. It is not intended to inform specific investment or management decisions. Instead, it seeks to provide a quantitative understanding of the range of future conditions, the severity of future challenges, and a rough estimate of how some strategies could improve future outcomes. The specific planning questions addressed include:
How would current water management in the Central Valley perform under different plausible futures?
What are the vulnerabilities of the current management approach? How would response packages reduce the vulnerabilities of the current management
approach? How much more resilient would the Central Valley be to a changing climate with the
implementation of response packages? What are the trade-offs between vulnerability reduction and cost? How does this analysis inform the CWP? We present results separately for each of the three Central Valley hydrologic regions
(HRs)—Sacramento River, San Joaquin River, and Tulare Lake.
Topic: Data and Analytical Tools Robust Water-Management Strategies for The California Central Valley
California Water Plan Update 2013 Vol 4 Reference Guide Page 10

xi
How Would Current Water Management in the Central Valley Perform Under Different Plausible Futures?
We first evaluate how the current management system and approach would perform across 198 different futures reflecting changes in climate and urban growth using a water management model of the Central Valley—the WEAP Central Valley Model.
Figure S.1 shows the range of urban and agricultural reliability in the Sacramento River, San Joaquin River, and Tulare Lake HRs. In the figure, each symbol indicates the reliability for one of the 198 simulations. The vertical lines indicate the median of each distribution, and the shaded areas indicate the results that fall within the middle half of the distribution (between the 25th and 75th percentiles). The figure clearly shows that the supply of water for both the urban and agricultural sectors in the Sacramento River HR and urban sector for the San Joaquin River HR are projected to remain highly reliable across the futures evaluated. Reliability of the supply of water for the agricultural sector in the San Joaquin River HR and the urban sector in the Tulare Lake HR is lower. For the agricultural sector in the Tulare Lake HR, reliability is broadly lower. In some futures, reliability falls below 50 percent.
Figure S.1. Range of Urban and Agricultural Reliability Results Across 198 Futures
The analysis also considered how groundwater storage would change in each of the three HRs for the 198 futures. In the Sacramento River HR, more than half the futures lead to increases in groundwater levels. This is driven by climate scenarios that are wetter than historical averages and projected reductions in agricultural water use as some farmland is converted to urban use. Groundwater in the San Joaquin River HR shows slight increases over the 45-year
Topic: Data and Analytical Tools Robust Water-Management Strategies for The California Central Valley
California Water Plan Update 2013 Vol 4 Reference Guide Page 11
xii
simulation period for most of the futures. In the Tulare Lake HR, in contrast, most futures lead to groundwater declines, with about one-half being greater than 10 percent.
Lastly, the analysis considered unmet environmental objectives in terms of five instream flow requirements (IFRs) that are specified to be currently required and four environmental flow targets (EFTs) that are required only as a management strategy response. The analysis shows that reliability would be low for several of these objectives across all plausible futures.
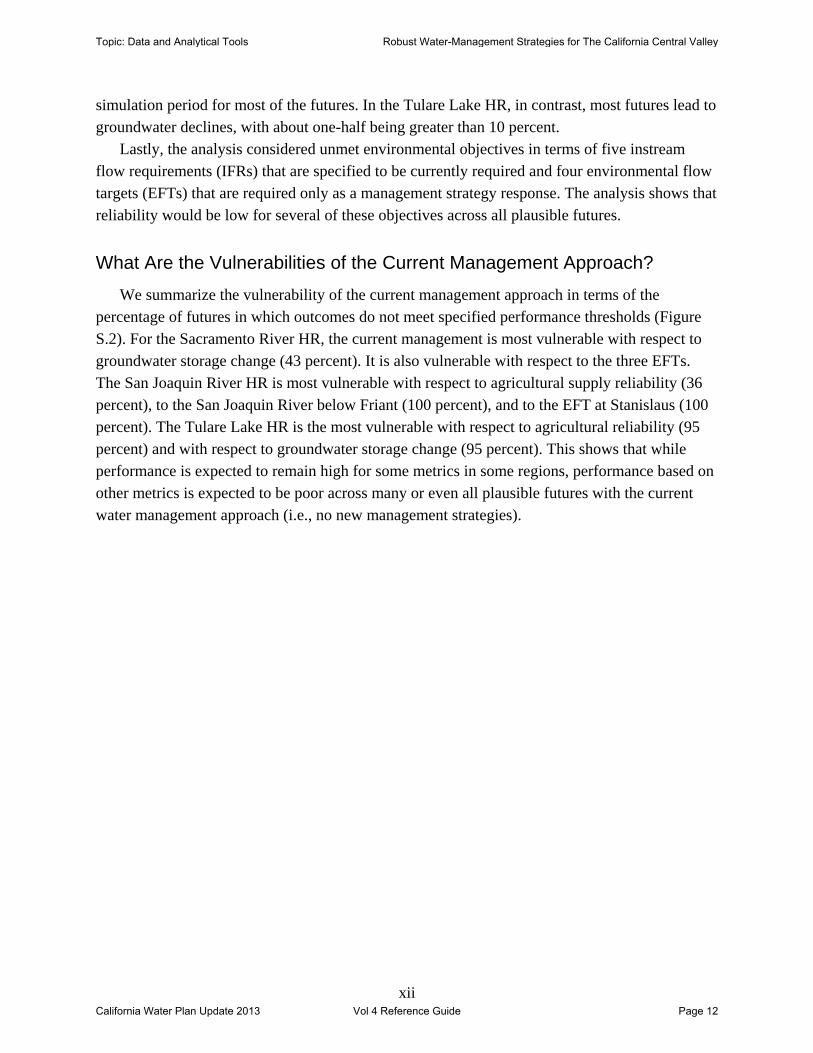
What Are the Vulnerabilities of the Current Management Approach?
We summarize the vulnerability of the current management approach in terms of the percentage of futures in which outcomes do not meet specified performance thresholds (Figure S.2). For the Sacramento River HR, the current management is most vulnerable with respect to groundwater storage change (43 percent). It is also vulnerable with respect to the three EFTs. The San Joaquin River HR is most vulnerable with respect to agricultural supply reliability (36 percent), to the San Joaquin River below Friant (100 percent), and to the EFT at Stanislaus (100 percent). The Tulare Lake HR is the most vulnerable with respect to agricultural reliability (95 percent) and with respect to groundwater storage change (95 percent). This shows that while performance is expected to remain high for some metrics in some regions, performance based on other metrics is expected to be poor across many or even all plausible futures with the current water management approach (i.e., no new management strategies).
Topic: Data and Analytical Tools Robust Water-Management Strategies for The California Central Valley
California Water Plan Update 2013 Vol 4 Reference Guide Page 12

xiii
Figure S.2. Summary of Key Performance Metrics Across 198 Futures with the Current Water Management Approach
NOTES: Numbers and color indicate the percentage of 198 futures in which the currently planned management approach is vulnerable. The urban and agricultural sectors are vulnerable if they are less than 95-percent reliable.
Groundwater change is vulnerable if it is negative. IFR and EFT metrics are vulnerable if they are less than 95-percent reliable.
We next conduct a statistical analysis of the simulation results to understand which external conditions lead to vulnerabilities. Specifically, we define decision-relevant composite scenarios that lead the current management approach to perform poorly with respect to the San Joaquin River agricultural sector and Tulare Lake urban and agricultural sectors. The composite scenario for the San Joaquin River agricultural sector is defined solely by temperature trend and average annual precipitation, and it is named Hot and Dry. For the Tulare Lake HR urban sector, the growth scenario is also important, and it is named Drier than Historical with Higher than Current Trends Growth. The composite scenario for the Tulare Lake agricultural sector is only defined by precipitation, and it is called Anything But Wet. These composite scenarios are useful to planners as they describe the future conditions most relevant to planners’ decisions—if they come to pass, alternative management may be more appropriate. This information can also help to guide the development of response packages and to define signposts—conditions to monitor over time that would trigger additional strategies.
Topic: Data and Analytical Tools Robust Water-Management Strategies for The California Central Valley
California Water Plan Update 2013 Vol 4 Reference Guide Page 13

xiv
How Would Response Packages Reduce the Vulnerabilities of the Current Water Management Approach?
We next evaluated how the implementation of different response packages, comprised of different water management strategies, could improve outcomes and reduce vulnerabilities by simulating the system with each response package across 88 futures—four growth scenarios and 22 climate scenarios. The response packages are designed to incrementally increase diversification in terms of the implementation of water management strategies. The first two diversification levels add strategies that can be implemented locally, such as urban and agricultural water use efficiency, and that require some regional coordination and infrastructure investment, such as conjunctive water management and recycled municipal water. Diversification levels 3–5 all include additional strategies designed to meet new EFTs, increase water use efficiency, and lead to the recovery of the region’s groundwater basins. The fidelity of the water management model used for this study, in terms of operations and representation of other ecosystem and beneficial-use performance metrics, precluded the analysis from including additional surface storage or Bay Delta–specific options or strategies. (Additional surface storage strategies were developed and modeled, and it was determined that the WEAP Central Valley Model could not yet represent the benefits or effects of these strategies on the Central Valley system with sufficient accuracy.) However, such options may be complementary to those strategies considered in the response package analysis below.
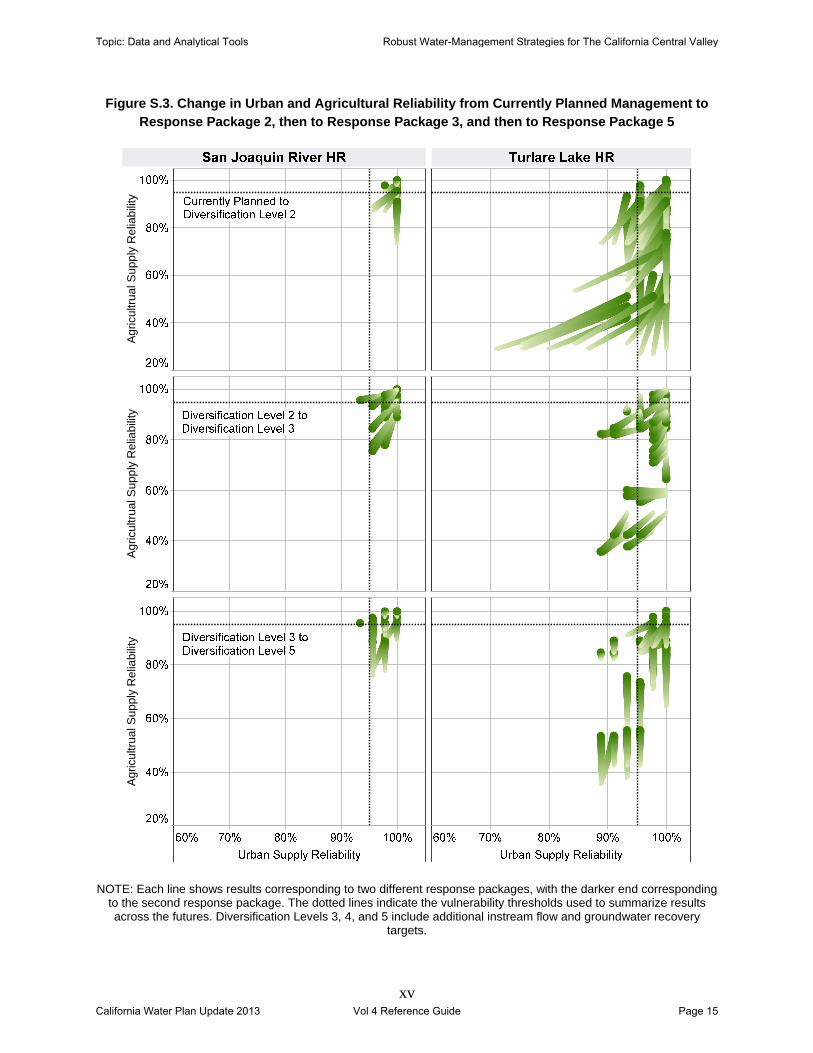
Figure S.3 shows how urban and agricultural reliability outcomes in the San Joaquin River and Tulare Lake HRs would change due to the implementation of some of the response packages. Each line represents a pair of results for each future. The narrower, lighter ends mark the results for the first response package and the thicker, darker ends mark the results for the second response package. The dashed lines mark the 95-percent reliability vulnerability threshold, which indicate areas of vulnerability (i.e. low reliability). Results for the Sacramento River HR are not shown here, as urban and agricultural reliability is generally high for the Currently Planned Management and other response packages.
Topic: Data and Analytical Tools Robust Water-Management Strategies for The California Central Valley
California Water Plan Update 2013 Vol 4 Reference Guide Page 14
xv
Figure S.3. Change in Urban and Agricultural Reliability from Currently Planned Management to Response Package 2, then to Response Package 3, and then to Response Package 5
NOTE: Each line shows results corresponding to two different response packages, with the darker end corresponding to the second response package. The dotted lines indicate the vulnerability thresholds used to summarize results across the futures. Diversification Levels 3, 4, and 5 include additional instream flow and groundwater recovery
targets.
Agr
icul
trua
l Sup
ply
Rel
iabi
lity
Agr
icul
trua
l Sup
ply
Rel
iabi
lity
Agr
icul
trua
l Sup
ply
Rel
iabi
lity
Topic: Data and Analytical Tools Robust Water-Management Strategies for The California Central Valley
California Water Plan Update 2013 Vol 4 Reference Guide Page 15

xvi
The figure shows that across all response package comparisons, bigger changes are observed in the Tulare Lake HR than the San Joaquin River HR, reflecting lower current reliability in the Tulare Lake HR. The efficiency increases included in Diversification Level 2 significantly improve reliability in both the urban and agricultural sectors in the Tulare Lake HR (top rows, right column of Figure S.3). The additional environmental and groundwater flow targets in Diversification Level 3, however, reverse some of these improvements and lead to lower reliability for many futures (middle row of Figure S.3). Concurrent improvements are seen in groundwater storage and environmental flows with Diversification Level 3. The bottom row of Figure S.3 shows that the additional efficiency and conjunctive management in Diversification Level 5 once again improve reliability across both sectors close to the levels achieved with Diversification Level 3.
How Much More Resilient Would the Central Valley Be to a Changing Climate with the Implementation of Response Packages?
Reducing the range of future conditions to which water management is vulnerable can also be broadly viewed in terms of increasing the amount of system resilience. Specifically, the implementation of response packages will influence the resilience of the Central Valley water management system to a changing climate. Figures S.4 illustrates this effect by showing the vulnerability results in terms of temperature and precipitation for the reliability of water for agriculture from the San Joaquin River across several response packages for 88 futures. The green highlights those futures in which reliability is high. The figure shows, for example, how the implementation of the strategies in Diversification Level 2 increases the range of climate conditions in which reliability is high for the San Joaquin River agricultural sector. Resilience to climate conditions extends to all but the warmest and driest two climate projections. Implementation of Diversification Level 3, however, reduces the range of climate conditions to which the sector is resilient. The additional strategies in Diversification Level 5 again increase resilience to more extreme climatic changes.
Topic: Data and Analytical Tools Robust Water-Management Strategies for The California Central Valley
California Water Plan Update 2013 Vol 4 Reference Guide Page 16
xvii
Figure S.4. Climate Trends for Each Future for Currently Planned Management and Three Additional Response Packages for San Joaquin Agricultural Reliability
NOTE: Each circle represents results for a single future—combination of growth and climate scenario. Concentric circles correspond to the four different growth scenarios ordered from smallest to largest as follows: LOP-HID, CTP-
HID, CTP-CTD, and HIP-LOD. Green circles indicate reliability greater than or equal to 95 percent.
What Are the Trade-Offs Between Vulnerability Reduction and Cost?
If level of effort (and other effects of the augmentation strategies not captured by this analysis) were not a consideration, the most aggressive response package would clearly be the preferred option. When costs of the management strategies are factored in, additional trade-offs emerge. Rough estimates of the costs of implementing response packages are calculated based on the volumes of water conserved or supplied via reuse or conjunctive use.
We evaluated how the percentage of vulnerable futures for each performance metric changes as a function of annual average cost for each HR. As these estimates do not include the costs of implementing new environmental flow or groundwater recovery targets, the cost of Diversification Level 3 is the same as that for Diversification Level 2. Figure S.5 shows that efficiency investments specified in Diversification Level 1, 4, and 5 dramatically improve the reliability of supply for agriculture, but at high relative cost. Implementation of environmental flow targets and groundwater recovery targets in Diversification Level 3 improves flows and groundwater outcomes, but leads to declines in agricultural reliability. Diversification Levels 4 and 5 reduce vulnerabilities in the agricultural sector, but again at large relative costs.
Topic: Data and Analytical Tools Robust Water-Management Strategies for The California Central Valley
California Water Plan Update 2013 Vol 4 Reference Guide Page 17

xviii
Figure S.5. Trade-Off Curves of Number of Vulnerable Futures Versus Cost for Different Metrics Across Response Packages for the San Joaquin River Hydrologic Region
How Does This Analysis Inform the California Water Plan?
This analysis showcases a new methodological approach for evaluating future vulnerabilities and promising management strategies for the CWP. The RDM analysis identifies a variety of vulnerabilities of the current management approach across the Central Valley and across management sectors and resources.
The analysis suggests that a few simple conditions, defined by future precipitation, temperature, and urban growth patterns, can characterize the situations in which the current management approach would not meet the regions’ goals. In particular, it finds that the agricultural sectors in the San Joaquin River HR and urban sector in the Tulare Lake HR are vulnerable to future climate conditions that are warmer and drier than what has been experienced historically. Use of the identified decision-relevant scenarios—Hot and Dry, Drier than Historical with Higher than Current Trends Growth, and Anything But Wet—can help reduce the complexity of the uncertain future and focus dialogue around the conditions that matter to water management. For example, rather than trying to develop a consensus over the likelihoods of all 88 futures, stakeholders and decisionmakers can focus on considering the likelihood of either being in or out of the three composite-scenarios. Specifically, the identified scenario for the Tulare Lake urban sector simplifies the climate change debate to a single concern—might the
Topic: Data and Analytical Tools Robust Water-Management Strategies for The California Central Valley
California Water Plan Update 2013 Vol 4 Reference Guide Page 18

xix
future be drier than in the recent historical past? In the case of the Tulare Lake agricultural sector, the Anything But Wet scenario suggests that the extent of climate change is only relevant to how much investment in adaptation to make, not the need for adaptation.
The analysis also provides a preliminary look at different strategies for reducing vulnerabilities. The results clearly show that increases in urban and agricultural water use efficiency, groundwater conjunctive water management, and recycled municipal water can reduce many of the vulnerabilities. The implementation of additional environmental flow and groundwater recovery targets, while effective in improving performance and environmental and groundwater benefits in these areas, requires additional investments in water use efficiency (or other strategies not evaluated) to maintain or improve agricultural and urban supply reliability. It also shows that even with significant diversification and investment in efficiency, municipal water recycling, and conjunctive water management, some vulnerability to future growth and climate change still exists. Consideration of additional strategies, such as surface storage and other combinations of strategies (i.e., response packages) might reveal more cost-effective approaches for each region.
Limitations and Future Directions
While this analysis provides a first-of-its-kind look at water-management vulnerabilities and response packages in the Central Valley of California, it represents only a preliminary examination of investment choices facing the California water-management community.
Several important limitations result from the available modeling tools and data. The WEAP Central Valley Model usefully represents the hydrology and management of the Central Valley, but necessarily makes important simplifications. Not all major water management strategies are included. For example, additional surface storage strategies were not included in the final analysis. The approach for estimating costs of management strategies was also rough and represented just a first cut evaluation. The WEAP model also does not represent some of the important dynamics or ecology of the Bay Delta. Lastly, the treatment of future climate uncertainty is limited by the use of 12 downscaled global climate model simulations and ten other variants based on historical climate. These projections likely underrepresent climate variability.
Future analyses could address an expanded array of water-management challenges and strategies, exploiting the iterative nature of RDM. Specifically, it could include representation of additional water management strategies such as surface storage and Bay-Delta conveyance. It could also evaluate a larger set of futures to span a wider range of plausible future conditions, including climate. The WEAP Central Valley Model could also be developed to report on a larger set of performance metrics, including ecological conditions and exports to Southern California.
Topic: Data and Analytical Tools Robust Water-Management Strategies for The California Central Valley
California Water Plan Update 2013 Vol 4 Reference Guide Page 19
xx
In conclusion, the analysis presented in this report begins to frame decisions about how much water-management diversification is needed around tradeoffs between reductions in different types of vulnerabilities and cost. It is not possible to predict with certainty what conditions California will encounter. However, understanding how much investment is required to address ranges of plausible conditions is a useful contribution to water-management planning discussions.
Topic: Data and Analytical Tools Robust Water-Management Strategies for The California Central Valley
California Water Plan Update 2013 Vol 4 Reference Guide Page 20
xxi
Acknowledgments
We would like to thank Rich Juricich, Mohammad Rayej, and Kamyar Guivetchi of the California Department of Water Resources for their guidance and support of this work. We benefited from the discussions and thoughtful comments received during several workshops with members of the California Statewide Water Analysis Network and other DWR staff. We would like to thank David Purkey of the Stockholm Environment Institute and Andy Draper of MWH for guidance and assistance with the development and refinement of the water-management model used in this study. This work also benefited from collaborations with Mike Tansey of the U.S. Bureau of Reclamation and the consulting team that developed the Central Valley Project Integrated Resource Plan. We would also like to thank RAND’s Dr. James Pita and Dr. Robert Wilby of Loughborough University, UK for their helpful reviews. Finally, we would like to thank Keith Crane, director of the RAND Environment, Energy, and Economic Development Program, for his guidance throughout the effort.
Topic: Data and Analytical Tools Robust Water-Management Strategies for The California Central Valley
California Water Plan Update 2013 Vol 4 Reference Guide Page 21

xxii
Abbreviations
AF acre-foot
CALFED California Bay-Delta Program
CMIP3 Coupled Model Intercomparison Project Phase 3 CNRM-CM3 Centre National de Recherches Météorologiques third coupled global
climate model CTD current trends density (growth scenario) CTP current trends population (growth scenario) CWP California Water Plan DWR California Department of Water Resources ERP Ecosystem Restoration Program EFT environmental flow target GCM atmosphere-ocean general circulation model GFDL-CM21 Geophysical Fluid Dynamics Laboratory Coupled Climate Model 2.1 HID high density (growth scenario) HIP high population (growth scenario) HR hydrologic region IFR instream flow requirement ISM indexed sequential method LOD low density (growth scenario) LOP low population (growth scenario) MAF million acre-feet MF multifamily (households) Miroc32med University of Tokyo Center for Climate System Research, National
Institute for Environmental Studies, and Frontier Research Center for Global Change (Japan) MIROC3.2 medium-resolution global climate model
MPI-ECHAM5 Max Planck Institute ECHAM5 general circulation model NCAR-CCSM3 National Center for Atmospheric Research Community Climate
System Model, version 3.0 NCAR-PCM1 National Center for Atmospheric Research Parallel Climate Model
Effort, version 1 RDM Robust Decision Making SCU Santa Clara University SEI Stockholm Environment Institute
Topic: Data and Analytical Tools Robust Water-Management Strategies for The California Central Valley
California Water Plan Update 2013 Vol 4 Reference Guide Page 22

xxiii
SF single-family (households) SOD South of Delta SWAN Statewide Water Analysis Network TAF thousand acre-feet WCRP World Climate Research Programme WEAP Water Evaluation And Planning WEAP Central
Valley Model a model for the Central Valley developed within the WEAP modeling
environment WMM water management model XLRM matrix of RDM elements—uncertainties, levers (or decisions),
relationships (or models), and performance metrics
Topic: Data and Analytical Tools Robust Water-Management Strategies for The California Central Valley
California Water Plan Update 2013 Vol 4 Reference Guide Page 23

1
1. Introduction
California faces significant challenges to ensuring that its water resources successfully meet diverse needs across the state in the coming decades. Escalating needs due to population and economic growth, potentially increasing agricultural irrigation requirements, and growing desires to dedicate more water to the environment will put a strain on a system that is near or exceeds capacity. These challenges are exacerbated by potential declines in the available water supply due to natural variability and climatic changes (California Department of Water Resources [DWR], 2009; Hanek and Lund, 2011).
How these long-term changes will unfold and affect California’s water system is highly uncertain. It is unlikely that all future water needs can be met at all times. Addressing the future uncertainty and diversity of needs requires a planning approach that is flexible and can support deliberations for different approaches, rather than a single prescription for how to move forward.
Prior research has analyzed the uncertainties associated with climate change and its impact on the operational reliability of California’s water system. Brekke et al. (2009), for example, characterized the operational risk that climate change poses for the California’s Central Valley Project (CVP) and the State Water Project (SWP) systems. The study surveyed available global climate models simulations and estimated for each future period of interest a probability density function that describes the spread of changes in precipitation and temperature. Das et al. (2013) analyzed the flooding conditions simulated when driven with climate conditions derived from 16 global climate models for the western slopes of the Northern and Southern Sierra Nevada in California. Their results indicate that climate change will increase significantly the probability of flooding in the Sierra Nevada.
Other research has focused not only on characterizing the risk associated with climate change, but also on analyzing the effectiveness of adaptation measures. Joyce et al. (2011) find that climate changes consistent with global climate models will likely reduce water supply reliability for water users in the Central Valley. Adaptation measures, such as improvements of irrigation technologies and shifts in cropping patterns towards higher valued crops, may reduce this pressure, but they are unlikely to completely offset shortages brought by climate change. Syme et al. (2012) evaluated the impacts of climate change on Northern California’s water resource system and compare the performance of two management approaches. Their results suggest that the historic management approach is not capable of coping with the more drastic changes in temperature and precipitation associated with climate change, while adaptive management can increase reliability. Finally, Thompson et al. (2012) investigated the potential negative impact that changes in water temperature and precipitation can have on the spring-run Chinook salmon species in Butter Creek, California. The study considers various individual
Topic: Data and Analytical Tools Robust Water-Management Strategies for The California Central Valley
California Water Plan Update 2013 Vol 4 Reference Guide Page 24

2
adaptation measures for protecting this salmon species, but concludes that none of these measures will be enough to mitigate the negative impacts brought by climate change.
Our study expands previous research on California’s water system in three main ways. First, in contrast with previous research that focuses specifically in one region or in one water sector, the analysis presented in this report considers all three hydrologic regions in the Central Valley (Sacramento River, San Joaquin River, and Tulare Lake), and three different sectors (urban, agricultural, and environmental). This study also looks more deeply into the uncertainty associated with the futures of California’s water system as it takes into account both future climate and land use changes. Rather than predicting outcomes probabilistically, it identifies the relevant vulnerabilities of the system and key decision-relevant scenarios. Lastly, this study builds on the prior evaluation of individual strategies by evaluating portfolios of individual strategies—or response packages—that can be implemented to mitigate the identified vulnerabilities.
The California Water Plan’s Vulnerability and Response Package Analysis
Through the past several iterations of the California Water Plan (CWP)—Updates 2005 and 2009—DWR has supported the development of new tools and data to support a systematic evaluation of future California water-management conditions under uncertainty and the performance of alternative management strategies out to 2050. For the CWP Update 2013 (DWR, 2013a), these new capabilities have been applied to an analysis focused on the Central Valley—the Sacramento River, San Joaquin River, and Tulare Lake hydrologic regions (HRs) (Figure 1.1).1 The Central Valley is the source region for the vast majority of the state’s annual precipitation. Its two major river systems drain runoff through the Sacramento - San Joaquin Delta and San Francisco Bay—a critically important natural ecosystem and the central hub of the complex California water-management system that delivers water to the southern portion of the valley and to Southern California.
The objective of this analysis is to identify, for the Sacramento River, San Joaquin River, and Tulare Lake HRs, how reliable urban and agricultural supply and met environmental flow requirements would be across a wide-range of plausible futures. This analysis uses a water management and planning model for the Central Valley developed within the Water Evaluation and Planning (WEAP) modeling environment (WEAP Central Valley) (Joyce, Purkey, Yates, Groves, and Draper, 2010; Joyce et al., 2011). WEAP Central Valley simulates how the water-management system could evolve over time in response to future scenarios and resource-management strategies. It computes a wide range of outputs, such as urban and agricultural
1 A small portion of the North Coast hydrologic region is included in the model domain because of conveyance of surplus flows from the Trinity River.
Topic: Data and Analytical Tools Robust Water-Management Strategies for The California Central Valley
California Water Plan Update 2013 Vol 4 Reference Guide Page 25

3
reliability, in-stream flows, and groundwater levels. This model is used to assess how well a response package, made up of specific resource-management strategies, would perform in the future.
Figure 1.1. Map of California Indicating the Central Valley Watershed
SOURCE: DWR (2013a).
This analysis uses Robust Decision Making (RDM), a quantitative decisionmaking approach, to identify and characterize the vulnerabilities of the currently planned management approach and then to develop and compare robust water-management response packages that can ameliorate the vulnerabilities identified (Groves and Lempert, 2007; Lempert and Collins, 2007; Lempert, Popper, and Bankes, 2003). RDM is an appropriate methodology to apply to the CWP because it provides a systematic analytic approach for evaluating different water-management responses under uncertainty. It is designed to facilitate stakeholder interaction and consensus-building around near-term actions, which will prove resilient across a broad range of plausible but unknowable future conditions.
This report documents the vulnerability and response package analysis that is summarized in Volume 1, Chapter Five of the California Water Plan Update 2013 (DWR, 2013a). The analysis
Topic: Data and Analytical Tools Robust Water-Management Strategies for The California Central Valley
California Water Plan Update 2013 Vol 4 Reference Guide Page 26
4
was performed during 2012 and 2013 and was vetted with DWR staff and technical experts through a series of workshops and presentations to DWR’s Statewide Water Analysis Network (SWAN),2 and to stakeholders through regional workshops and meetings in each of the three HRs. The analysis builds on a previous proof-of-concept analysis developed during 2010 and 2011 (Groves and Bloom, 2013). The proof-of-concept analysis used a less-developed model of the Sacramento River and San Joaquin River HRs, and evaluated more notional water-management strategies and response packages. This CWP Update 2013 analysis, in contrast, encompasses the entire Central Valley, including the Tulare Lake HR; evaluates a more comprehensive set of management strategies and response packages; and includes a more extensive RDM analysis. While the results presented in this report and the CWP represent an important step forward in analysis of future water-management conditions and options for addressing key challenges, it is not intended to inform specific investment decisions.
How This Document Is Organized
This document is organized into six chapters. Chapter Two reviews the RDM methodology applied in the report. Chapter Three describes the scope of the CWP Update 2013 analysis and details the data and assumptions used. Chapter Four presents the results for the vulnerability assessment of the current management approach. Chapter Five presents an analysis of management strategies and response packages. In Chapter Six, we discuss our conclusions and some proposed extensions.
2 SWAN serves as the voluntary technical advisory group for the CWP and is made up of technical experts from local, state, and federal agencies; universities; nongovernmental organizations; and consulting firms.
Topic: Data and Analytical Tools Robust Water-Management Strategies for The California Central Valley
California Water Plan Update 2013 Vol 4 Reference Guide Page 27

5
2. An Overview of Robust Decision Making for Water Planning
Traditionally, water utilities and agencies have developed long-term plans by making single forecasts of future management conditions and then constructing strategies to best manage these predicted conditions. These predictions have been based on historical records of hydrologic conditions and best-estimate forecasts of other important factors, such as demand, regulatory conditions, and the likely increases in new supply from investments. Given increasing recognition that the past is no longer a good predictor of future climate (Milly et al., 2008) and of the large uncertainty in most planning factors (Groves, Davis, Wilkinson, and Lempert, 2008), agencies are increasingly looking to develop adaptive strategies to address climate change and other uncertainties in their planning (e.g., Metropolitan Water District [2010]).
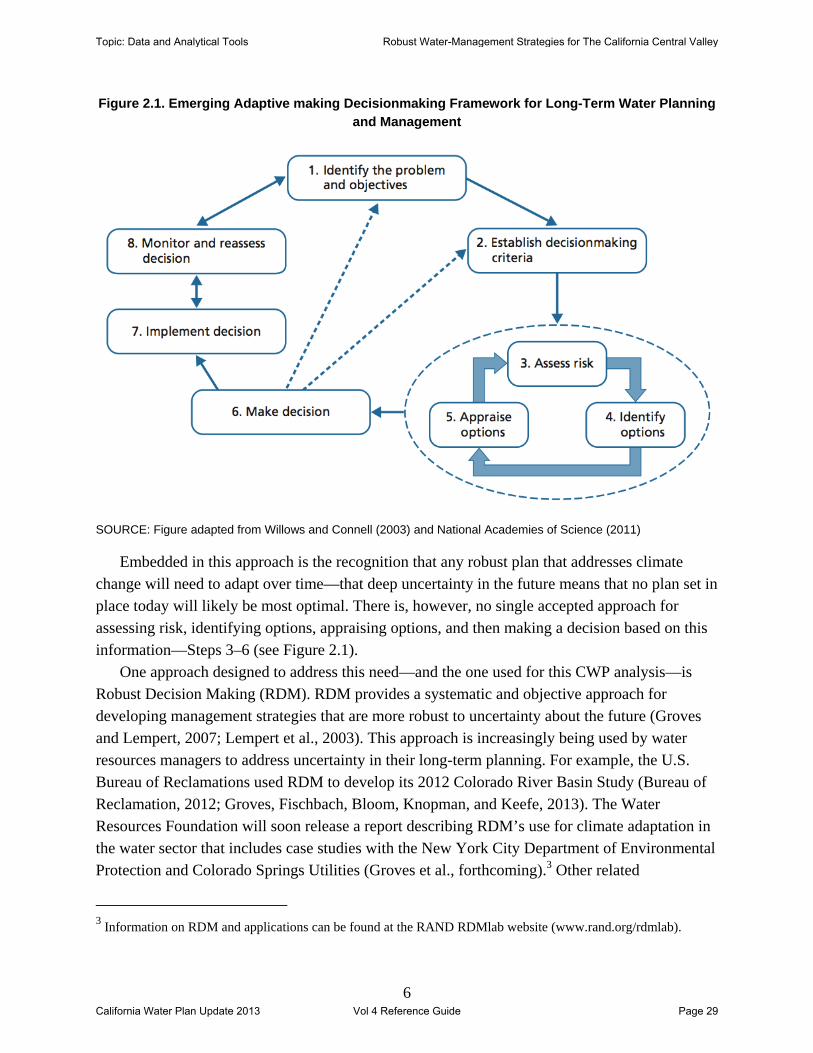
Willows and Connell (2003) proposed an iterative risk management approach which was adapted by the National Academies of Science (2011) and presented as framework for addressing climate change in long-term natural resource plans. It describes a series of iterative steps in which risks and options are evaluated, near-term decisions are made and implemented, and conditions are monitored to help refine those plans over time (Figure 2.1). This framework recognizes the importance of iterating, both in making management decisions (perform Steps 1 to 6, and back to 1) and in implementing successful strategies (perform Steps 6 to 8, and back to 1).
Topic: Data and Analytical Tools Robust Water-Management Strategies for The California Central Valley
California Water Plan Update 2013 Vol 4 Reference Guide Page 28
6
Figure 2.1. Emerging Adaptive making Decisionmaking Framework for Long-Term Water Planning and Management
SOURCE: Figure adapted from Willows and Connell (2003) and National Academies of Science (2011)
Embedded in this approach is the recognition that any robust plan that addresses climate change will need to adapt over time—that deep uncertainty in the future means that no plan set in place today will likely be most optimal. There is, however, no single accepted approach for assessing risk, identifying options, appraising options, and then making a decision based on this information—Steps 3–6 (see Figure 2.1).
One approach designed to address this need—and the one used for this CWP analysis—is Robust Decision Making (RDM). RDM provides a systematic and objective approach for developing management strategies that are more robust to uncertainty about the future (Groves and Lempert, 2007; Lempert et al., 2003). This approach is increasingly being used by water resources managers to address uncertainty in their long-term planning. For example, the U.S. Bureau of Reclamations used RDM to develop its 2012 Colorado River Basin Study (Bureau of Reclamation, 2012; Groves, Fischbach, Bloom, Knopman, and Keefe, 2013). The Water Resources Foundation will soon release a report describing RDM’s use for climate adaptation in the water sector that includes case studies with the New York City Department of Environmental Protection and Colorado Springs Utilities (Groves et al., forthcoming).3 Other related
3 Information on RDM and applications can be found at the RAND RDMlab website (www.rand.org/rdmlab).
Topic: Data and Analytical Tools Robust Water-Management Strategies for The California Central Valley
California Water Plan Update 2013 Vol 4 Reference Guide Page 29

7
methodologies have been used in other water planning contexts. For example, Climate Decision Scaling (Brown, Ghile, Laverty, and Li, 2012) is similar to RDM but explores system performance under synthetic climate sequences constructed to more broadly sample plausible climate conditions than are reflected in global climate model projections. Another related methodology, Info-Gap (Ben-Haim, 2006), explores uncertainty systematically relative to a central tendency estimate. It has also been applied to water resources planning problems (Korteling et al., 2012).
When applied to water supply planning, RDM helps water managers iteratively identify and evaluate robust strategies—those that perform well in terms of management objectives over a wide range of plausible futures but that may perform less well under an assumption that one future may be most likely to occur. Trading off optimality for adequacy across many possible conditions is referred to as “satisficing” (Simon, 1956).
Often, the robust strategies identified using RDM are adaptive (as opposed to static), meaning that they are designed to evolve over time in response to new information. RDM helps decisionmakers identify strategies—including both near-term and deferred decisions or investments—that are shown through the analysis to be effective over a wide range of plausible future conditions. RDM also can be used to facilitate group decisionmaking in contentious situations where parties to the decision have strong disagreements about assumptions and values (Groves and Lempert, 2007; Lempert and Popper, 2005).
The engine that makes RDM run is a sophisticated set of statistical and software tools embedded in a process of participatory stakeholder engagement. RDM helps resource managers develop adaptive strategies by iteratively evaluating the performance of proposed options against a wide array of plausible futures, systematically identifying the key vulnerabilities of those strategies,4 and using this information to suggest responses to the vulnerabilities identified (Lempert and Collins, 2007; Lempert et al., 2003; Means, Laugier, Daw, Kaatz, and Waage, 2010). Successive iterations develop and refine strategies that are increasingly robust. Final decisions among strategies are made by considering a few robust choices and weighing their remaining vulnerabilities.
RDM follows an iterative and interactive series of steps consistent with the “deliberation with analysis” decision-support process described by the National Research Council (2009). As shown in Figure 2.2, the process shares many similarities with the Willows and Connell framework and can be used to implement Steps 1–6.
4 The approach to identifying key vulnerabilities uses statistical “scenario discovery” algorithms (Bryant and Lempert, 2010; Groves and Lempert, 2007). The terms “scenario discovery” and “vulnerability analysis” are synonymous.
Topic: Data and Analytical Tools Robust Water-Management Strategies for The California Central Valley
California Water Plan Update 2013 Vol 4 Reference Guide Page 30

8
Figure 2.2. Iterative Steps of an RDM Analysis
NOTE: Adapted from Lempert, Popper, et al. (2013).
Structuring Decisions
The first step in RDM is a pure deliberation step—one in which the participants to the decisions that need to be made work together to define the key parameters of the decisions. This involves defining the policy questions and structuring the decision analysis to address them in the next step. RDM often uses a framework called “XLRM” to support the decision structuring activity, where “X” stands for the uncertain factors that are used to define plausible uncertain futures; “L” stands for management strategies (or levers) that are under consideration; “R” is the relationships among these elements that are reflected in the planning models; and “M” consists of the performance metrics that are used to evaluate and compare management strategies (Lempert et al., 2003). In water planning applications, XLRM provides the information needed to organize the simulation modeling that captures the response of the water-management system to external conditions related to, for example, future climate, economics, regulatory requirements, and demand projections. The end result of this step is the development of decision-framing information, which is passed along to the next step.
Simulation of Many Futures
Attempting to predict the unpredictable often just leads to bias and gridlock and does not bring managers closer to understanding the merits of their strategy or strategies. A key difference between RDM and the typical predict-then-act decision analysis approach is that RDM seeks to evaluate the broadest range of plausible future outcomes without an initial focus on their likelihood. Instead, Step 2 evaluates the current management approach and alternative strategies
Topic: Data and Analytical Tools Robust Water-Management Strategies for The California Central Valley
California Water Plan Update 2013 Vol 4 Reference Guide Page 31

9
under an expansive set of plausible assumptions about future conditions. This step generates a large database of cases—inputs defining different plausible future conditions and management strategies, coupled with the model-simulated results for outcomes of interest. Using simulating models to define outcomes under a broad range of assumptions about the future is increasingly considered best practice in climate change planning and decision support (Lempert, Kalra, Peyraud, Mao, 2013; National Academies of Science, 2011).
Vulnerability Analysis
In Step 3, analysts and decisionmakers “mine” the database of simulation results (or cases), using visualizations and vulnerability analysis to explore the results and identify the key combinations of future conditions where one or more candidate strategies might not meet planning objectives. This analysis provides concise descriptions of the combinations of future conditions—what are called “decision-relevant scenarios”—that would make a strategy vulnerable to not meeting its objectives. Such decision-relevant scenarios focus decisionmakers’ attention on the uncertain future conditions most important to the challenges they face and help facilitate discussions about the best ways to respond to those challenges (Bryant and Lempert, 2010; Groves and Lempert, 2007).
Importantly, this step does not address which of these conditions are more or less likely to occur. There remains substantial uncertainty and disagreement regarding how supply and demand conditions in California will change over time, for example, and the uncertainty is sufficiently deep that it is difficult to estimate the probability of each set of outcomes occurring. Of course, the probability of different outcomes remains an important factor when considering different investment decisions, but consideration of probabilities is deferred until alternative strategies have been defined and compared.
Such vulnerability analysis is instead a discovery process for decisionmakers and a key feature of RDM. It is most useful in situations in which some combinations of uncertain factors are significantly more important than others in determining whether a strategy meets its goals. In such situations, the analysis can help decisionmakers recognize those combinations of uncertainties that require their attention and those they can more safely ignore. This information can be useful in itself—shown by the downward, outbound arrow from Step 3 in Figure 2.2—or it can be useful in helping to generate new, more robust strategies to mitigate vulnerabilities—depicted by the iterative arrow that returns to Step 1.
Trade-Off Analysis
RDM is used to do more than just make decisionmakers aware of the vulnerabilities of a strategy or strategies. Instead, the information on potential vulnerabilities is used as the foundation for evaluating potential modifications to a proposed strategy that might reduce these vulnerabilities (Step 4). RDM supports this step through the use of interactive visualizations that help decisionmakers and stakeholders see how the system would perform in different futures—
Topic: Data and Analytical Tools Robust Water-Management Strategies for The California Central Valley
California Water Plan Update 2013 Vol 4 Reference Guide Page 32

10
particularly those within the vulnerable conditions—under the proposed or augmented strategy. This information can be paired with additional information about costs and other impacts of strategies, so that meaningful deliberations over different strategies can occur.
At this point—when deliberating about key trade-offs among different strategies—the decisionmakers and stakeholders can bring in their assumptions regarding the likelihoods of the vulnerable conditions. For example, if the vulnerable conditions are deemed very unlikely, then the reduction in the corresponding vulnerabilities may not be worth the cost or effort. On the other hand, the vulnerable conditions identified may be viewed as plausible or very likely, lending support for a strategy designed to reduce these vulnerabilities. Finally, if there is substantial disagreement about the likelihood, the strategy can be modified to improve adaptivity—that is, to monitor key inputs to the vulnerable conditions and defer or trigger some choices based on observable outcomes over time.
Based on this trade-off analysis, decisionmakers may decide on a robust strategy (the outward arrow in Figure 2.2), or at least some elements of a robust strategy and begin implementation. They may also decide that no strategy under consideration is sufficiently robust and return to the decision-structuring step (the arrow back to Step 1 in Figure 2.2), this time with deeper insight into the strengths and weaknesses of the strategies initially considered.
Topic: Data and Analytical Tools Robust Water-Management Strategies for The California Central Valley
California Water Plan Update 2013 Vol 4 Reference Guide Page 33
11
3. Scope of the Vulnerability and Response Package Analysis
This chapter lays out the scope of the vulnerability and response package analysis. First, it presents a series of questions that the analysis was designed to address. Next, it describes the key relationships, uncertainties, performance metrics, and management strategies evaluated. Chapters Four and Five present the results.
Key Planning Questions
This analysis is intended to identify high-level long-term vulnerabilities of the current Central Valley water-management approach to the urban and agricultural sectors and environmental flows, and then to evaluate how different combinations of management strategies could reduce these vulnerabilities over the next four decades. It is not intended to inform specific investment or management decisions. Instead, it seeks to provide a quantitative understanding of the range of future conditions, the severity of future challenges, and a rough estimate of how some strategies could improve future outcomes.
The specific planning questions that are addressed by the analysis follow the four steps of RDM depicted in Figure 2.2:
How would current water management in the Central Valley perform under different plausible futures (Steps 1 and 2)?
What are the vulnerabilities of the current management approach (Step 3)? How would response packages reduce the vulnerabilities of the current management
approach (Step 1 and 2)? How much more resilient would the Central Valley be to a changing climate with the
implementation of response packages (Steps 3)? What are the trade-offs between vulnerability reduction and cost (Step 4)? How does this analysis inform the CWP (Step 4)?
The following sections describe the scope of the analysis using the XLRM framework (Lempert et al., 2003). The XLRM framework helps organize information relevant to an RDM analysis by clearly distinguishing among the uncertain factors (X) that are used to develop uncertain futures; the water-management strategies, or levers (L), that make up the response packages; the relationships (R) among these elements that are reflected in the planning models; and the performance metrics (M) that are used to evaluate and compare response packages (Table 3.1). The subsequent sections elaborate on each element of the XLRM framework.
Topic: Data and Analytical Tools Robust Water-Management Strategies for The California Central Valley
California Water Plan Update 2013 Vol 4 Reference Guide Page 34

12
Table 3.1. XLRM Matrix Summarizing the Scope of the RDM Analysis
Uncertainties or Scenario Factors (X) Management Strategies and Response Packages (L)
Land-use scenarios, which describe changes in population urban density and water-use factors irrigated agricultural land area and multi-
cropping
Climate sequences, which describe changes in temperature and precipitation
Currently planned management Response packages comprised of: urban water-use efficiency agricultural water-use efficiency recycled municipal water conjunctive management and groundwater storage environmental flow targets (EFTs) groundwater recovery targets
Relationships or System Model (R) Performance Metrics (M)
WEAP Central Valley Model (Sacramento River, San Joaquin River, and Tulare Lake HRs)
Urban supply reliability Agricultural supply reliability Groundwater levels Instream flow requirements (IFR) reliability EFT reliability Annual average costs for implementing response packages
Uncertainties
The analysis considers two key uncertainties: (1) future climate conditions and (2) growth scenarios pertaining to demographics and land-use patterns.
Climate Conditions
Plausible future climatic conditions are represented by a set of monthly temperature and precipitation sequences applied to geographically disaggregated catchment areas in the water management model described below. Some sequences are based on projections of temperature and precipitation from global climate models (atmosphere-ocean general circulation models [GCMs]). Others are based on historical observations and are designed to test the effects of drought conditions experienced in the recent past at different times in the future. The DWR Climate Change Technical Advisory Group provided guidance about which specific sequences to evaluate that would reflect a wide range of plausible climatic conditions.
It is important to note that the projections of climate included in this analysis do not necessarily span all plausible conditions. Future climate projections were derived from a relatively small set of climate models (six), which in some cases share similar assumptions (Masson and Knutti, 2011), likely limiting the range of plausible future conditions reflected. A recent study, for example, evaluated a single climate model many times using the same atmospheric and ocean forcing but with slight perturbations of initial conditions (Deser, Knutti, Solomon, and Phillips, 2012). The simulations show a wide range of future temperature and precipitation conditions over the extratropical regions, such as California. Global climate model projections may also not capture the plausible range of climate variability as seen in historical and paleoclimatic climate reconstructions (Meehl et al., 2007). As these limitations exist to some
Topic: Data and Analytical Tools Robust Water-Management Strategies for The California Central Valley
California Water Plan Update 2013 Vol 4 Reference Guide Page 35

13
extent with any chosen set of climate projections, this analysis uses the projections to identify performance thresholds, which will be less sensitive to the comprehensiveness of the set of climate projections evaluated.
Climate Change Scenarios
This analysis uses projections of monthly temperature and precipitation derived from six GCMs, each evaluated against two global emissions scenarios, as specified by the Governor’s Climate Action Team (Maurer and Hidalgo, 2008). The GCMs used were
Centre National de Recherches Météorologiques third coupled global climate model (CNRM-CM3) (France)
Geophysical Fluid Dynamics Laboratory Coupled Climate Model 2.1 (GFDL-CM21) (United States)
University of Tokyo Center for Climate System Research, National Institute for Environmental Studies, and Frontier Research Center for Global Change MIROC3.2 medium-resolution global climate model (Miroc32med) (Japan)
Max Planck Institute ECHAM5 general circulation model (MPI-ECHAM5) (Germany) National Center for Atmospheric Research Community Climate System Model,
version 3.0 (NCAR-CCSM3) (United States) National Center for Atmospheric Research Parallel Climate Model Effort, version 1
(NCAR-PCM1) (United States).
The two emissions scenarios used were the A2 and B1 scenarios:
“The A2 SRES global emissions scenario represents a heterogeneous world with respect to demographics, economic growth, resource use and energy systems, and cultural factors. There is a de-emphasis on globalization, reflected in heterogeneity of economic growth rates and rates and directions of technological change. These and other factors imply continued growth throughout the 21st century of global [greenhouse gas] emissions. By contrast, B1 is a “global sustainability” scenario. Worldwide, environmental protection and quality and human development emerge as key priorities, and there is an increase in international cooperation to address them as well as to convergence in other dimensions. Neither scenario entails explicit climate mitigation policies. The A2 and B1 global emission scenarios were selected to bracket the potential range of emissions and the availability of outputs from global climate models” (California Climate Action Team, 2010).
Projections of monthly temperature and climate from the GCMs are too coarse (100 kilometers on a side or greater) to use directly with a water management model (Brekke, Thrasher, Maurer, and Pruitt, 2013). This study, therefore, uses a dataset of bias corrected, spatially downscaled projections jointly developed by Lawrence Livermore National Laboratory; the U.S. Department of the Interior, Bureau of Reclamation; and Santa Clara University (SCU) (2013). These data were derived from the World Climate Research Programme's (WCRP) Coupled Model Intercomparison Project Phase 3 (CMIP3) multi-model dataset, and include data
Topic: Data and Analytical Tools Robust Water-Management Strategies for The California Central Valley
California Water Plan Update 2013 Vol 4 Reference Guide Page 36

14
from 112 global climate simulations of 16 global models evaluated for three global emissions scenarios. The projections are available from 1950 to 2099.
Historical Climate Conditions with Extended Drought
Historical climate conditions are based on the most recent 46-years included in a gridded historical dataset from 1946 to 2005 (Maurer et al., 2002).5 These sequences include the drought conditions experienced from 1976–1977 and from 1987–1992. To simulate a severe three-year drought, data for 1978 is replaced with a repeat of the 1977 drought-year conditions. A simplified indexed-sequential method (Kendall and Dracup, 1991) approach is used to develop five future sequences of climate based on the historical record with different future drought timing. For one sequence, the first year of the historical record (1960) is assigned to the first year of the simulation—2005. The second sequence assigns the 10th year of the historical record (1970) to the first year of the simulation (2005) and loops the first historical year to follow the last historical year to ensure a continuous 46-year sequence of climate data. Three other sequences are created with offsets of 20, 30, and 40 years, respectively.
Historical Climate Conditions with Extended Drought and Warming
To evaluate the impact of a moderate warming trend on system performance, monthly warming trends equal to the average monthly trends from the 12 GCM-derived sequences were added to each monthly temperature value for the five sequences using historical climate conditions with extended drought.
Figure 3.1 shows the average temperature and percentage deviation from historical baseline precipitation levels from 2030–2050 for the 22 climate sequences used in this analysis. The solid lines show the historical baseline values (1961–2005) and the dashed lines indicate the standard deviation of 21-year rolling average historical temperature and precipitation deviation values for comparison.
All GCM-derived sequences include temperature increases greater than 1 standard deviation above the historical baseline temperature. In contrast, the GCM-derived sequences exhibit a wide range of precipitation variation. Eight of the 12 GCM-derived sequences exhibit precipitation declines greater than 1 standard deviation below the historical baseline. Only two sequences exhibits precipitation increases greater than 1 standard deviation above the historical baseline. The sequences based on historical climate data show only modest changes in precipitation.
Note that while the climate projections included in this collection do vary from one another in terms of temperature and precipitation trends, they may not reflect all plausible future climate conditions. As shown in subsequent chapters, the analysis used these scenarios to identify
5 Most up-to-date data are available at: http://www.engr.scu.edu/~emaurer/data.shtml.
Topic: Data and Analytical Tools Robust Water-Management Strategies for The California Central Valley
California Water Plan Update 2013 Vol 4 Reference Guide Page 37

15
climate thresholds and patterns of management changes rather than in a probabilistic assessment of future outcomes.
Figure 3.1. Temperature and Precipitation Characterizations for Climate Projections
NOTE: The standard deviations (dashed lines) are calculated based on 21-year running averages of historical temperature and precipitation to be comparable to the 21-year average results for each climate projection (symbols).
Growth Scenarios
Nine different plausible growth scenarios are developed based on projections of population and urban growth density changes. Changes in population growth lead to changes in housing stock and reductions in agricultural irrigated area, and changes in urban density lead to different urban and agricultural footprints. Three population scenarios are estimated: (1) higher than current trends population growth (HIP), (2) population growth consistent with current trends (CTP), and (3) lower than current trends population growth (LOP). Three density scenarios are estimated: (1) high-density urban growth (HID), (2) growth consistent with current trends (CTD), and (3) low-density growth (LOD). The UPlan urban growth model uses parameters developed to reflect these projections to estimate the urban and agricultural land footprint of each of the nine scenarios (see http://ice.ucdavis.edu/project/uplan for information on the UPlan model). The Statewide Agricultural Production (SWAP) model was then used to develop estimates of cropping patterns over time (Howitt, MacEwan, Medellín-Azuara, and Lund, 2010).
Topic: Data and Analytical Tools Robust Water-Management Strategies for The California Central Valley
California Water Plan Update 2013 Vol 4 Reference Guide Page 38

16
The WEAP model simulates the effect of these growth scenarios on the water-management model described below by adjusting the following parameters:
Projections of the number of urban water users by sector (SF homes, MF homes, commercial employees, industrial employees, and total population for public sector use)
Water use rate elasticity factors (e.g., income, household size, water price) Water use rate reductions due to naturally occurring conservation6 Irrigated land area: Acreages of land irrigated, by crop and planning area, were set to be
consistent with each scenario description.
Tables 3.2 and 3.3 provide statistics for the urban and agricultural sectors for each of the nine growth scenarios. Figure 3.2 depicts urban land increases and corresponding irrigation land decreases for the nine growth scenarios.
Table 3.2. Growth Scenarios for the Urban Sector for the Central Valley
Scenario 2050
Population (millions)
Population Change
(millions) 2006a to 2050
Development Density
2050 Urban Footprint
(million acres)
Urban Footprint Increase
(million acres) 2006b to 2050
LOP-HID 10.88c 3.82 High 1.98 0.38
LOP-CTD 10.88 3.82 Current Trends 2.04 0.44
LOP-LOD 10.88 3.82 Low 2.10 0.49
CTP-HID 12.52d 5.47 High 2.24 0.63
CTP-CTD 12.52 5.47 Current Trends 2.32 0.71
CTP-LOD 12.52 5.47 Low 2.40 0.79
HIP-HID 16.18e 9.12 High 2.53 0.93
HIP-CTD 16.18 9.12 Current Trends 2.67 1.07
HIP-LOD 16.18 9.12 Low 2.81 1.21
Source: DWR, 2013b. a 2006 population was 7.06 million. b 2006 urban footprint was 1.6 million acres. c Values modified by DWR from the Public Policy Institute of California. d Values provided by the California Department of Finance. e Values modified by DWR from the Public Policy Institute of California.
6 Naturally occurring conservation is the improved efficiency of water use that occurs over time that is not attributable to conservation or efficiency programs or incentives.
Topic: Data and Analytical Tools Robust Water-Management Strategies for The California Central Valley
California Water Plan Update 2013 Vol 4 Reference Guide Page 39
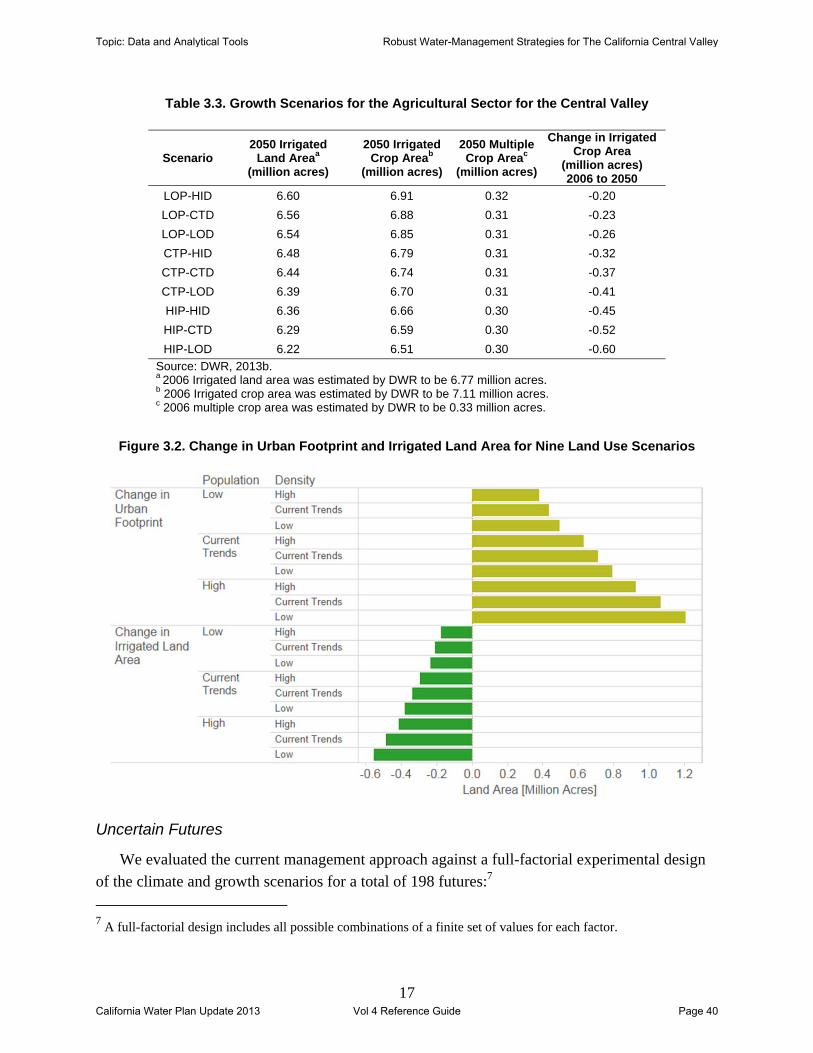
17
Table 3.3. Growth Scenarios for the Agricultural Sector for the Central Valley
Scenario 2050 Irrigated
Land Areaa (million acres)
2050 Irrigated Crop Areab
(million acres)
2050 Multiple Crop Areac
(million acres)
Change in Irrigated Crop Area
(million acres) 2006 to 2050
LOP-HID 6.60 6.91 0.32 -0.20
LOP-CTD 6.56 6.88 0.31 -0.23
LOP-LOD 6.54 6.85 0.31 -0.26
CTP-HID 6.48 6.79 0.31 -0.32
CTP-CTD 6.44 6.74 0.31 -0.37
CTP-LOD 6.39 6.70 0.31 -0.41
HIP-HID 6.36 6.66 0.30 -0.45
HIP-CTD 6.29 6.59 0.30 -0.52
HIP-LOD 6.22 6.51 0.30 -0.60
Source: DWR, 2013b. a 2006 Irrigated land area was estimated by DWR to be 6.77 million acres. b 2006 Irrigated crop area was estimated by DWR to be 7.11 million acres. c 2006 multiple crop area was estimated by DWR to be 0.33 million acres.
Figure 3.2. Change in Urban Footprint and Irrigated Land Area for Nine Land Use Scenarios
Uncertain Futures
We evaluated the current management approach against a full-factorial experimental design of the climate and growth scenarios for a total of 198 futures:7
7 A full-factorial design includes all possible combinations of a finite set of values for each factor.
Topic: Data and Analytical Tools Robust Water-Management Strategies for The California Central Valley
California Water Plan Update 2013 Vol 4 Reference Guide Page 40
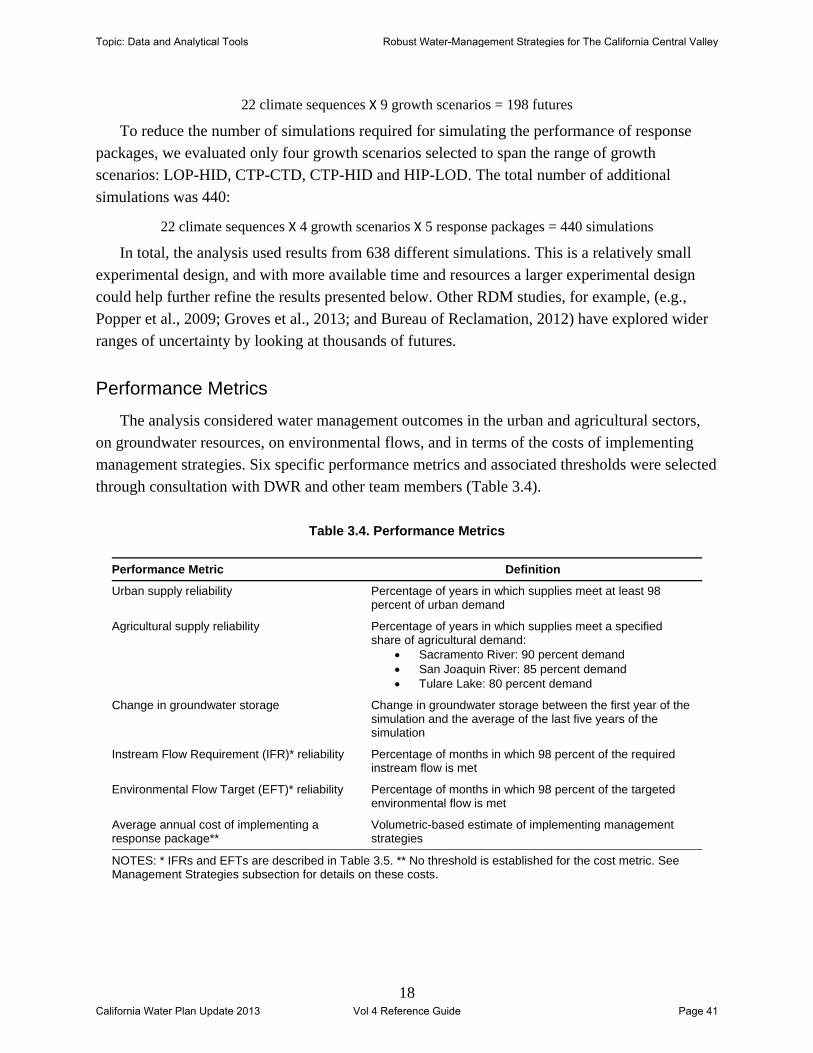
18
22 climate sequences X 9 growth scenarios = 198 futures
To reduce the number of simulations required for simulating the performance of response packages, we evaluated only four growth scenarios selected to span the range of growth scenarios: LOP-HID, CTP-CTD, CTP-HID and HIP-LOD. The total number of additional simulations was 440:
22 climate sequences X 4 growth scenarios X 5 response packages = 440 simulations
In total, the analysis used results from 638 different simulations. This is a relatively small experimental design, and with more available time and resources a larger experimental design could help further refine the results presented below. Other RDM studies, for example, (e.g., Popper et al., 2009; Groves et al., 2013; and Bureau of Reclamation, 2012) have explored wider ranges of uncertainty by looking at thousands of futures.
Performance Metrics
The analysis considered water management outcomes in the urban and agricultural sectors, on groundwater resources, on environmental flows, and in terms of the costs of implementing management strategies. Six specific performance metrics and associated thresholds were selected through consultation with DWR and other team members (Table 3.4).
Table 3.4. Performance Metrics
Performance Metric Definition
Urban supply reliability Percentage of years in which supplies meet at least 98 percent of urban demand
Agricultural supply reliability Percentage of years in which supplies meet a specified share of agricultural demand:
Sacramento River: 90 percent demand San Joaquin River: 85 percent demand Tulare Lake: 80 percent demand
Change in groundwater storage Change in groundwater storage between the first year of the simulation and the average of the last five years of the simulation
Instream Flow Requirement (IFR)* reliability Percentage of months in which 98 percent of the required instream flow is met
Environmental Flow Target (EFT)* reliability Percentage of months in which 98 percent of the targeted environmental flow is met
Average annual cost of implementing a response package**
Volumetric-based estimate of implementing management strategies
NOTES: * IFRs and EFTs are described in Table 3.5. ** No threshold is established for the cost metric. See Management Strategies subsection for details on these costs.
Topic: Data and Analytical Tools Robust Water-Management Strategies for The California Central Valley
California Water Plan Update 2013 Vol 4 Reference Guide Page 41
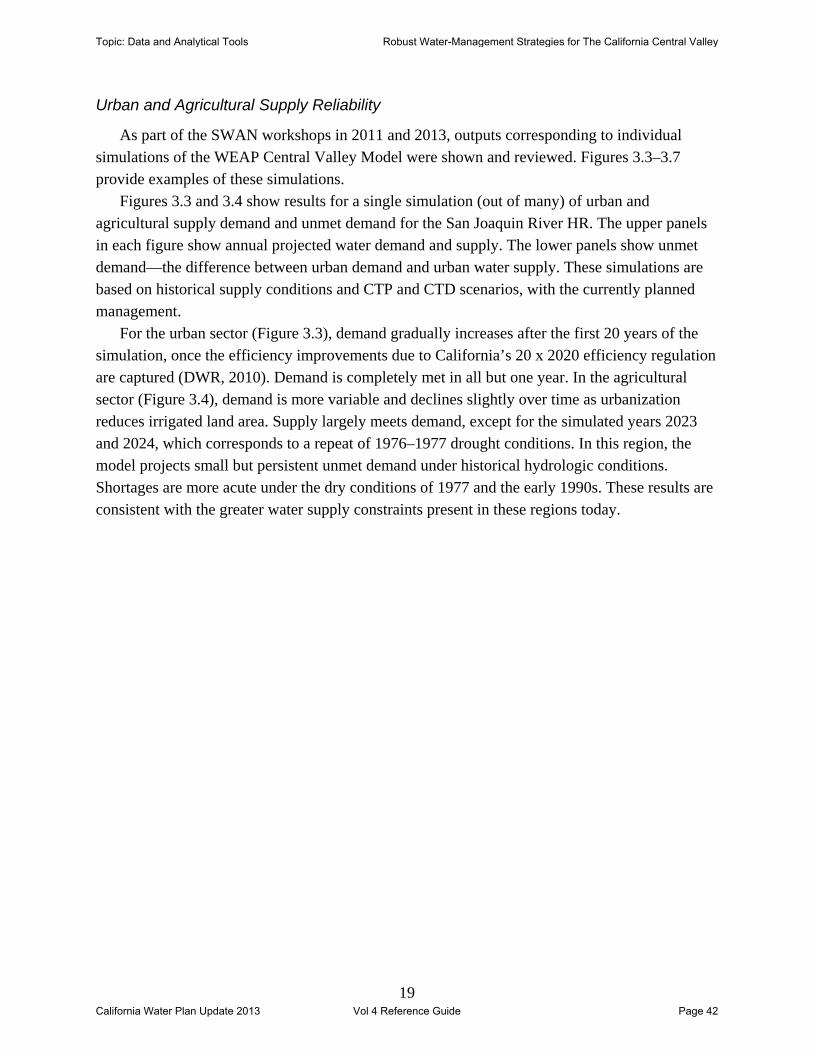
19
Urban and Agricultural Supply Reliability
As part of the SWAN workshops in 2011 and 2013, outputs corresponding to individual simulations of the WEAP Central Valley Model were shown and reviewed. Figures 3.3–3.7 provide examples of these simulations.
Figures 3.3 and 3.4 show results for a single simulation (out of many) of urban and agricultural supply demand and unmet demand for the San Joaquin River HR. The upper panels in each figure show annual projected water demand and supply. The lower panels show unmet demand—the difference between urban demand and urban water supply. These simulations are based on historical supply conditions and CTP and CTD scenarios, with the currently planned management.
For the urban sector (Figure 3.3), demand gradually increases after the first 20 years of the simulation, once the efficiency improvements due to California’s 20 x 2020 efficiency regulation are captured (DWR, 2010). Demand is completely met in all but one year. In the agricultural sector (Figure 3.4), demand is more variable and declines slightly over time as urbanization reduces irrigated land area. Supply largely meets demand, except for the simulated years 2023 and 2024, which corresponds to a repeat of 1976–1977 drought conditions. In this region, the model projects small but persistent unmet demand under historical hydrologic conditions. Shortages are more acute under the dry conditions of 1977 and the early 1990s. These results are consistent with the greater water supply constraints present in these regions today.
Topic: Data and Analytical Tools Robust Water-Management Strategies for The California Central Valley
California Water Plan Update 2013 Vol 4 Reference Guide Page 42

20
Figure 3.3. Single Simulation of Urban Supply, Demand, and Unmet Demand for the San Joaquin River Hydrologic Region
NOTES: In the upper part of the figure, the black line indicates demand, and vertical bars indicate annual supply (top) and annual unmet demand (bottom). This simulation is for historical climate and CTP-CTD land use scenario.
Topic: Data and Analytical Tools Robust Water-Management Strategies for The California Central Valley
California Water Plan Update 2013 Vol 4 Reference Guide Page 43
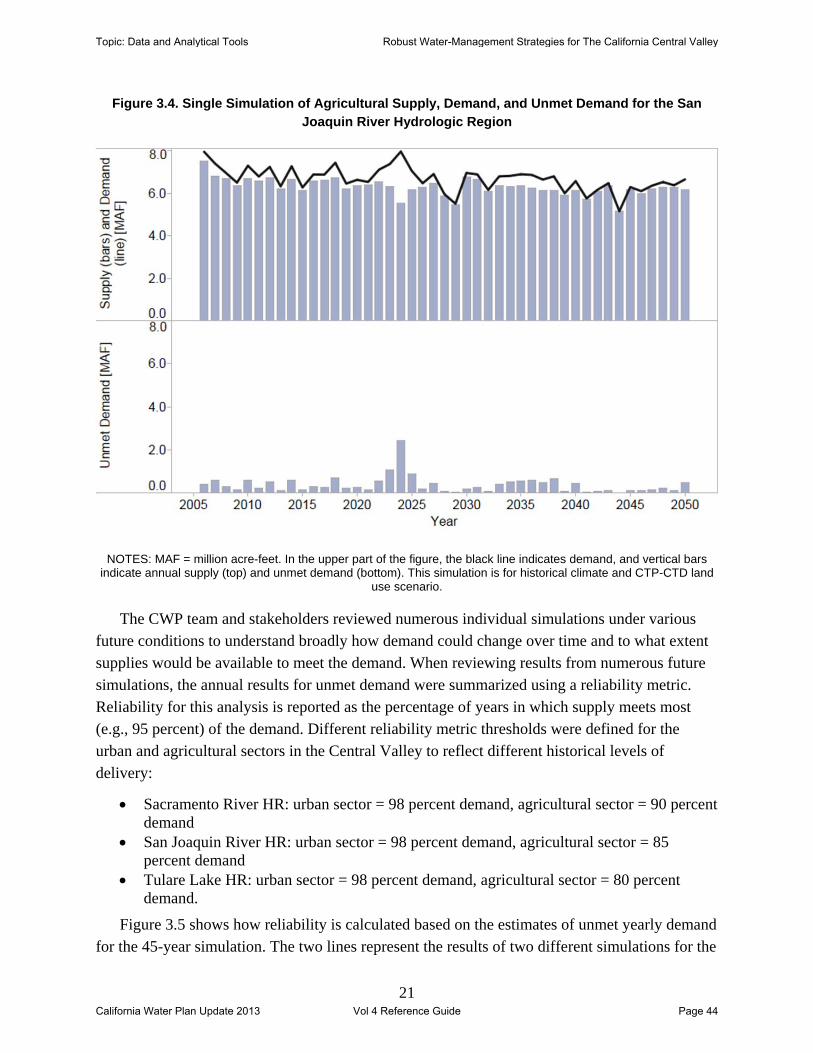
21
Figure 3.4. Single Simulation of Agricultural Supply, Demand, and Unmet Demand for the San Joaquin River Hydrologic Region
NOTES: MAF = million acre-feet. In the upper part of the figure, the black line indicates demand, and vertical bars indicate annual supply (top) and unmet demand (bottom). This simulation is for historical climate and CTP-CTD land
use scenario.
The CWP team and stakeholders reviewed numerous individual simulations under various future conditions to understand broadly how demand could change over time and to what extent supplies would be available to meet the demand. When reviewing results from numerous future simulations, the annual results for unmet demand were summarized using a reliability metric. Reliability for this analysis is reported as the percentage of years in which supply meets most (e.g., 95 percent) of the demand. Different reliability metric thresholds were defined for the urban and agricultural sectors in the Central Valley to reflect different historical levels of delivery:
Sacramento River HR: urban sector = 98 percent demand, agricultural sector = 90 percent demand
San Joaquin River HR: urban sector = 98 percent demand, agricultural sector = 85 percent demand
Tulare Lake HR: urban sector = 98 percent demand, agricultural sector = 80 percent demand.
Figure 3.5 shows how reliability is calculated based on the estimates of unmet yearly demand for the 45-year simulation. The two lines represent the results of two different simulations for the
Topic: Data and Analytical Tools Robust Water-Management Strategies for The California Central Valley
California Water Plan Update 2013 Vol 4 Reference Guide Page 44

22
San Joaquin River HR. Each line depicts the relationship between agricultural reliablity and agricultural demand met. For example, when the reliability metric threshold is close to 100 percent demand as indicated in the y-axis (i.e., years in which supply is reliable are those that meet 100 percent of agricultural demand), then the number of years in which this threshold is met (i.e., agricultural reliability) is close to zero, as indicated in the x-axis. Using these curves we can compare the performance of the two runs shown in the plot.
In this example, the agricultual reliability metric threshold is set to 85 percent demand, indicated by the horizontal reference line. For the simulation represented by the grey line, the percentage of years in which at least 85 percent of agricultural demand is met is 98 percent—thus, reliability is 98 percent. For the run represented by the blue line, reliability is lower—75 percent.
Figure 3.5. Agricultural Supply Reliability for Two Futures in the San Joaquin River Hydrologic Region
Change in Groundwater Storage
Figure 3.6 shows an example of simulated groundwater storage levels for the San Joaquin River HR for two different runs. Both cases show substantial interannual variability. The future represented by the blue line shows a broader dip late in the simulation. The difference between the average groundwater storage amount for the last five years of the simulation (shown by dashed lines in Figure 3.6) and the first year of simulation is used to summarize groundwater outcomes in the analysis.
Topic: Data and Analytical Tools Robust Water-Management Strategies for The California Central Valley
California Water Plan Update 2013 Vol 4 Reference Guide Page 45
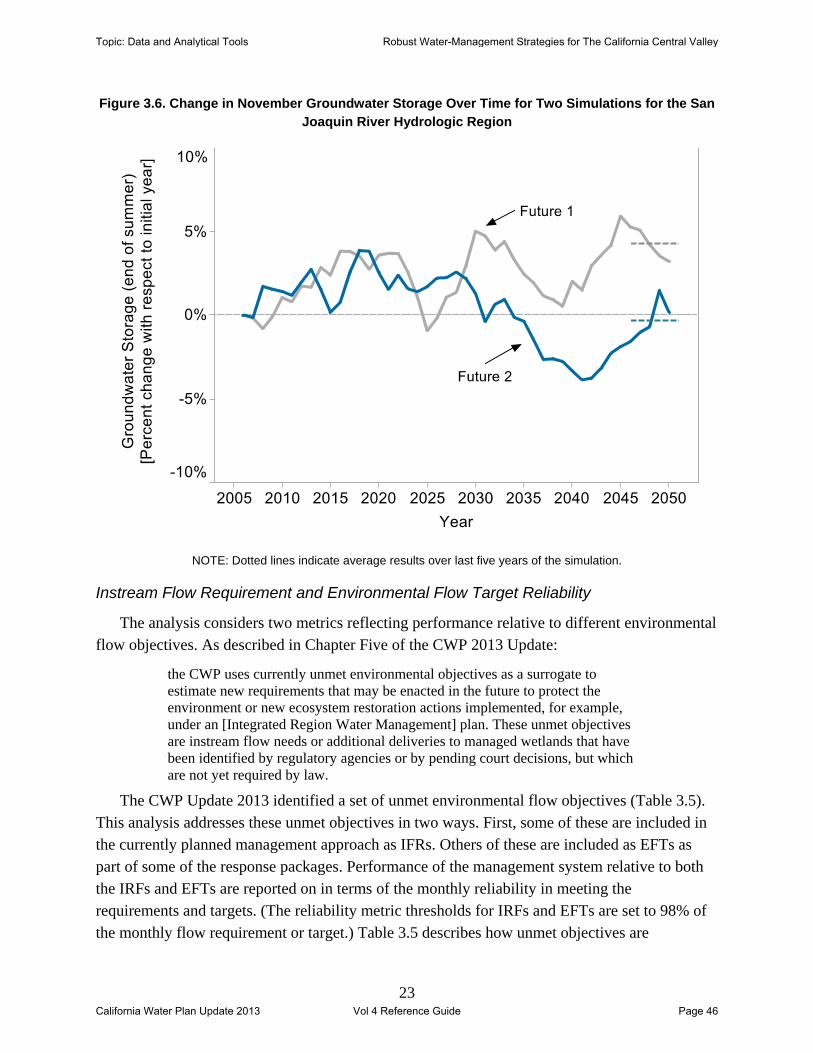
23
Figure 3.6. Change in November Groundwater Storage Over Time for Two Simulations for the San Joaquin River Hydrologic Region
NOTE: Dotted lines indicate average results over last five years of the simulation.
Instream Flow Requirement and Environmental Flow Target Reliability
The analysis considers two metrics reflecting performance relative to different environmental flow objectives. As described in Chapter Five of the CWP 2013 Update:
the CWP uses currently unmet environmental objectives as a surrogate to estimate new requirements that may be enacted in the future to protect the environment or new ecosystem restoration actions implemented, for example, under an [Integrated Region Water Management] plan. These unmet objectives are instream flow needs or additional deliveries to managed wetlands that have been identified by regulatory agencies or by pending court decisions, but which are not yet required by law.
The CWP Update 2013 identified a set of unmet environmental flow objectives (Table 3.5). This analysis addresses these unmet objectives in two ways. First, some of these are included in the currently planned management approach as IFRs. Others of these are included as EFTs as part of some of the response packages. Performance of the management system relative to both the IRFs and EFTs are reported on in terms of the monthly reliability in meeting the requirements and targets. (The reliability metric thresholds for IRFs and EFTs are set to 98% of the monthly flow requirement or target.) Table 3.5 describes how unmet objectives are
Topic: Data and Analytical Tools Robust Water-Management Strategies for The California Central Valley
California Water Plan Update 2013 Vol 4 Reference Guide Page 46

24
represented by IRFs and EFTs for the CWP Update 2013 analysis, and Figure 3.7 shows the rough geographic locations for each flow objective.
Table 3.5. Representation of Unmet Environmental Flow Objectives in the Analysis
Unmet Objective Instream Flow Requirement or
Environmental Flow Target WEAP Instream Flow Node
American (Nimbus) Department of Fish and Wildlife Values
IFR and EFT American River (Anadromous Fish Restoration Program 1 & 2)
Stanislaus (Goodwin) IFR and EFT Stanislaus River (Anadromous Fish Restoration Program 1 & 2)
ERP #1, Delta Flow Objective EFT ERP (1 & 2)
ERP #2, Delta Flow Objective EFT ERP (1 & 2)
ERP #4, Freeport EFT Sacramento at Freeport
Trinity below Lewiston IFR Trinity River
ERP #3 San Joaquin River at Vernalis IFR San Joaquin River at Vernalis
San Joaquin River below Friant IFR Friant
Level 4 Water Deliveries to Wildlife Refuges n/a Treated as demand node
Figure 3.7. Locations of Instream Flow Requirements and Environmental Flow Targets Evaluated
Topic: Data and Analytical Tools Robust Water-Management Strategies for The California Central Valley
California Water Plan Update 2013 Vol 4 Reference Guide Page 47
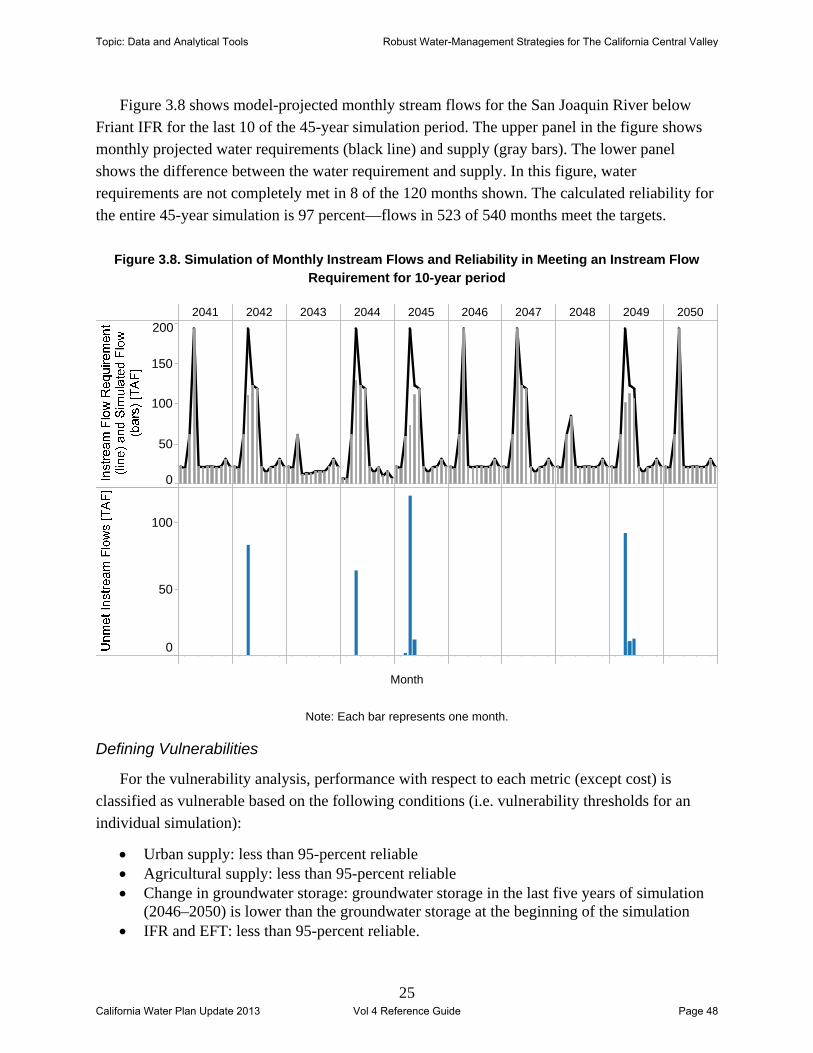
25
Figure 3.8 shows model-projected monthly stream flows for the San Joaquin River below Friant IFR for the last 10 of the 45-year simulation period. The upper panel in the figure shows monthly projected water requirements (black line) and supply (gray bars). The lower panel shows the difference between the water requirement and supply. In this figure, water requirements are not completely met in 8 of the 120 months shown. The calculated reliability for the entire 45-year simulation is 97 percent—flows in 523 of 540 months meet the targets.
Figure 3.8. Simulation of Monthly Instream Flows and Reliability in Meeting an Instream Flow Requirement for 10-year period
Note: Each bar represents one month.
Defining Vulnerabilities
For the vulnerability analysis, performance with respect to each metric (except cost) is classified as vulnerable based on the following conditions (i.e. vulnerability thresholds for an individual simulation):
Urban supply: less than 95-percent reliable Agricultural supply: less than 95-percent reliable Change in groundwater storage: groundwater storage in the last five years of simulation
(2046–2050) is lower than the groundwater storage at the beginning of the simulation IFR and EFT: less than 95-percent reliable.
2041 2042 2043 2044 2045 2046 2047 2048 2049 2050
0
50
100
150
200
0
50
100
Month
Topic: Data and Analytical Tools Robust Water-Management Strategies for The California Central Valley
California Water Plan Update 2013 Vol 4 Reference Guide Page 48
26
For a particular future, the vulnerability of each sector is considered separately. For example, a future could be vulnerable in terms of reliability of supply for urban areas and agricultural areas, but not in terms of groundwater and IFRs. In the simulation results, there are many other possible combinations of vulnerability across sectors.
Management Strategies and Response Packages
The CWP defines management strategies as specific resource-management approaches to improve water-management outcomes. Response packages are combinations of water-management strategies that could make up a comprehensive approach to addressing current and future water-management challenges. For this analysis, the CWP team selected a small set of management strategies and then modeled several response packages made up of different combinations of strategy implementations.
Management Strategies
Volume 2 of the CWP Update 2009 describes 27 different resource-management strategies for California, ranging from increased water-use efficiency to new surface storage facilities to watershed management (DWR, 2009). The WEAP Central Valley Model is capable of representing a subset of these water strategies (Table 3.6).
Topic: Data and Analytical Tools Robust Water-Management Strategies for The California Central Valley
California Water Plan Update 2013 Vol 4 Reference Guide Page 49

27
Table 3.6. Water-Management Strategies That Could Be Simulated by the WEAP Model
Strategy Type CWP Water Management Strategy
Reduce water demand Agricultural water-use efficiency* Urban water-use efficiency*
Improve operational efficiency Conveyance: delta Conveyance: regional and local System reoperation Water transfers Conjunctive management and groundwater storage*
Increase water supply Desalination: brackish and seawater Precipitation enhancement Recycled municipal water* Surface storage: CALFED and state Surface storage: regional and local
Instream recovery Legal flows’ mandates* Reconnection of rivers Floodwater bypasses
Groundwater storage recovery Management of groundwater pumping limits*
NOTE: Asterisks indicate strategies evaluated in this analysis. CALFED = California Bay-Delta Program.
For this analysis, a smaller set of strategies was evaluated; focusing on those that could be
represented simply in the WEAP Central Valley model and those that were anticipated to have a significant effect on the high-level performance metrics: agricultural water-use efficiency, urban water-use efficiency, conjunctive management and groundwater storage, recycled municipal water, instream flow targets, and groundwater recovery targets. Additional surface storage strategies were developed and modeled, and it was determined that the WEAP Central Valley Model could not yet represent the benefits or effects of these strategies on the Central Valley system with sufficient accuracy.
Agricultural Water-Use Efficiency
Agricultural water use efficiency is the use and application of scientific processes to control agricultural water delivery and achieve a beneficial outcome (see DWR, 2009, Vol. 2, Chapter Two). Improvements in agricultural water use efficiency occur primarily as a result of three activities:
hardware: improving on-farm irrigation systems and water-supplier delivery systems water management: improving management of on-farm irrigation and water-supplier
delivery systems crop water consumption: reducing nonbeneficial evapotranspiration.
The WEAP Central Valley Model implements irrigation efficiency strategies through the adjustment of irrigation thresholds for soil moisture. These thresholds were calibrated based on
Topic: Data and Analytical Tools Robust Water-Management Strategies for The California Central Valley
California Water Plan Update 2013 Vol 4 Reference Guide Page 50
28
current demand conditions. To approximate a decrease in demand due to efficiency, these thresholds were adjusted to achieve specified percentage decreases in demand.8
Urban Water-Use Efficiency
Urban water-use efficiency can be achieved through a broad array of individual and local actions. California has already implemented policies to provide incentives for those actions, including the following:
standards, such as requiring urban water agencies to reduce use by 2020 funding mechanisms, such as requiring water agencies to implement urban best
management practices to be eligible for loans and grants (see DWR, 2009, Vol. 2, Chapter Three).
Urban water-use efficiency was modeled separately for indoor and outdoor urban demand for this analysis. For indoor urban demand locations, demand rates per household, employee, and capita (for public water use) were simply scaled by a specific percentage to represent the adoption of increased water-use efficiency. Levels of urban water-use efficiency were set to increase gradually over time. Outdoor water use was calculated by WEAP, using estimates of the area of irrigated landscaping, the required water use for landscaping, and the evapotranspiration requirements of the total landscape over time. Increased efficiency was modeled using the same process as for agricultural water-use efficiency.
Conjunctive Management and Groundwater Storage
Conjunctive management is the coordinated and planned use and management of surface-water and groundwater resources to maximize the availability and reliability of water supplies in a region to meet various management objectives. Operationally, this can be implemented by storing surface water in the groundwater basin when plentiful and shifting to groundwater use during periods of surface-water supply shortages (see DWR, 2009, Vol. 2, Chapter Eight).
Conjunctive management is represented in the water-management model by adding additional demand nodes that represent the monthly maximum volume of water that could be injected into representative groundwater basins. These demand nodes are connected to the main stem of the Sacramento River, the San Joaquin River, and Tulare Lake and are specified to divert water only after all urban, agricultural, environmental, and other water demands are met. All conjunctive groundwater-management sites were set in the model to become active in 2020.
8 This calibration was completed under historical climate conditions for one representative planning area in each hydrologic region. Each planning area has different acreage for each of 21 different crops; calibration was completed separately for each crop. Sensitivity testing was conducted to ensure that the calibrations were approximately accurate under other climate conditions. Levels of agricultural water-use efficiency were set in the model to increase gradually between 2010 and 2020.
Topic: Data and Analytical Tools Robust Water-Management Strategies for The California Central Valley
California Water Plan Update 2013 Vol 4 Reference Guide Page 51

29
Recycled Municipal Water
Recycled municipal water is wastewater treated for reuse for irrigation and industrial purposes (see DWR, 2009, Vol. 2, Chapter Eleven; and California Department of Water Resources, State Water Resources Control Board, California Bay-Delta Authority, California Energy Commission, California Department of Public Health, California Public Utilities Commission, and California Air Resources Board, 2010). Recycled water is modeled in WEAP by routing unconsumed urban water via wastewater treatment nodes back to outdoor urban and agricultural demand nodes within the same planning area. These wastewater treatment nodes were set to treat a specified percentage of water supplied from their source nodes. Levels of recycled municipal water were set in the model to increase gradually over time at a rate consistent with plausible development of reuse in each HR.
Environmental Flow Targets
To implement this strategy in the WEAP model, additional Environmental Flow Targets (EFTs) are added to the existing Instream Flow Requirements (IFRs) (See Performance Metrics section, above.). These targets specify monthly demand schedules that vary according to climate conditions and the specific growth scenario. The model considers a different priority for each of these two targets types. IFRs receive the highest priority among all demands, while the priorities of EFTs are below those for the IFRs and urban demands, but above those for agricultural demands.
Groundwater Recovery Targets
The groundwater recovery targets strategy is designed to reduce extractions so that groundwater levels in the Central Valley do not decline over time. Groundwater recovery targets are modeled as limits to the possible withdrawals of each groundwater node. Without this strategy in place, the model limits extraction so that groundwater storage does not fall below the lowest level during the 1970–2005 period. Implementing this strategy increases this limit with the objective of maintaining groundwater storage at 2005 levels.
Response Packages
Management response packages are each comprised of a mix of the resource management strategies described above, implemented at different levels and locations. These response packages do not represent a definitive set of alternatives; instead, they illustrate different levels of strategy diversification that could be taken to address water-management challenges. Table 3.7 describes the currently planned management approach and five response packages that were evaluated. They are designed to incrementally increase diversification. The first two diversification levels add strategies that can be implemented locally, such as water-use efficiency, and that require some regional coordination and infrastructure investment, such as conjunctive management and recycled municipal water. Diversification levels 3–5 all include
Topic: Data and Analytical Tools Robust Water-Management Strategies for The California Central Valley
California Water Plan Update 2013 Vol 4 Reference Guide Page 52
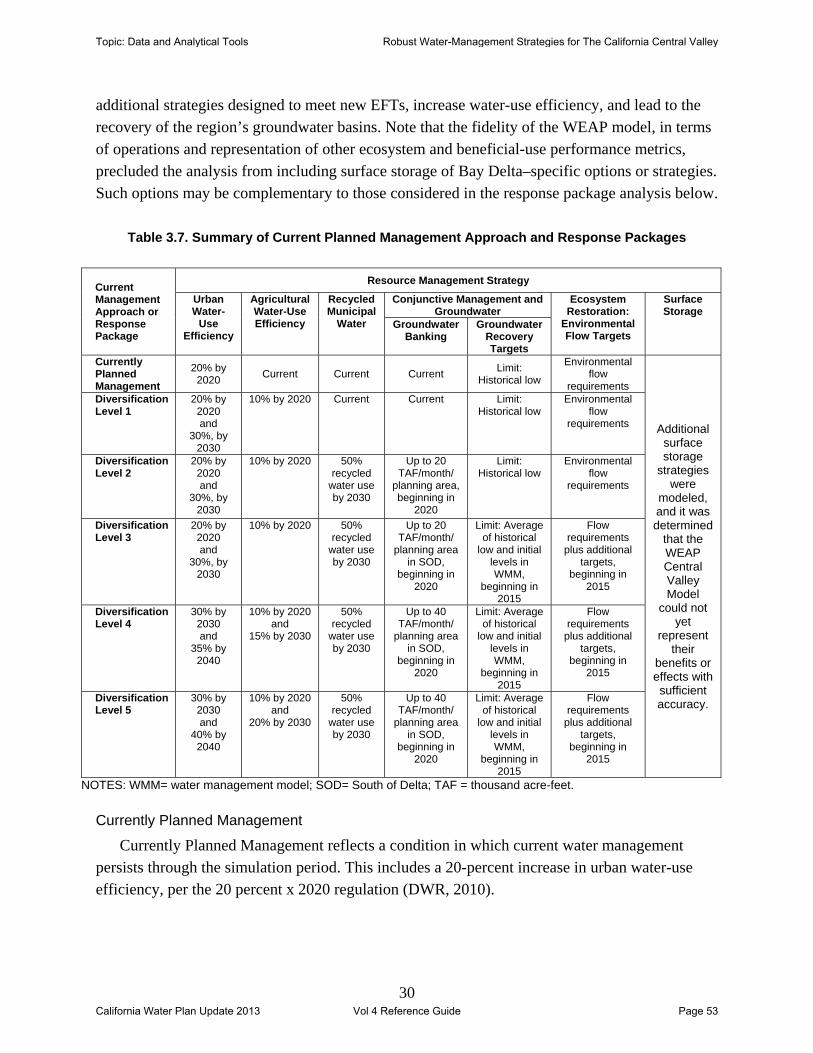
30
additional strategies designed to meet new EFTs, increase water-use efficiency, and lead to the recovery of the region’s groundwater basins. Note that the fidelity of the WEAP model, in terms of operations and representation of other ecosystem and beneficial-use performance metrics, precluded the analysis from including surface storage of Bay Delta–specific options or strategies. Such options may be complementary to those considered in the response package analysis below.
Table 3.7. Summary of Current Planned Management Approach and Response Packages
Current Management Approach or Response Package
Resource Management Strategy
Urban Water-
Use Efficiency
Agricultural Water-Use Efficiency
Recycled Municipal
Water
Conjunctive Management and Groundwater
Ecosystem Restoration:
Environmental Flow Targets
Surface Storage
Groundwater Banking
Groundwater Recovery Targets
Currently Planned Management
20% by 2020
Current Current Current Limit:
Historical low
Environmental flow
requirements
Additional surface storage
strategies were
modeled, and it was determined
that the WEAP Central Valley Model
could not yet
represent their
benefits or effects with sufficient accuracy.
Diversification Level 1
20% by 2020 and
30%, by 2030
10% by 2020 Current Current Limit: Historical low
Environmental flow
requirements
Diversification Level 2
20% by 2020 and
30%, by 2030
10% by 2020 50% recycled
water use by 2030
Up to 20 TAF/month/
planning area, beginning in
2020
Limit: Historical low
Environmental flow
requirements
Diversification Level 3
20% by 2020 and
30%, by 2030
10% by 2020 50% recycled
water use by 2030
Up to 20 TAF/month/
planning area in SOD,
beginning in 2020
Limit: Average of historical
low and initial levels in WMM,
beginning in 2015
Flow requirements
plus additional targets,
beginning in 2015
Diversification Level 4
30% by 2030 and
35% by 2040
10% by 2020 and
15% by 2030
50% recycled
water use by 2030
Up to 40 TAF/month/
planning area in SOD,
beginning in 2020
Limit: Average of historical
low and initial levels in WMM,
beginning in 2015
Flow requirements
plus additional targets,
beginning in 2015
Diversification Level 5
30% by 2030 and
40% by 2040
10% by 2020 and
20% by 2030
50% recycled
water use by 2030
Up to 40 TAF/month/
planning area in SOD,
beginning in 2020
Limit: Average of historical
low and initial levels in WMM,
beginning in 2015
Flow requirements
plus additional targets,
beginning in 2015
NOTES: WMM= water management model; SOD= South of Delta; TAF = thousand acre-feet.
Currently Planned Management
Currently Planned Management reflects a condition in which current water management persists through the simulation period. This includes a 20-percent increase in urban water-use efficiency, per the 20 percent x 2020 regulation (DWR, 2010).
Topic: Data and Analytical Tools Robust Water-Management Strategies for The California Central Valley
California Water Plan Update 2013 Vol 4 Reference Guide Page 53

31
Diversification Level 1
This response package modifies the Currently Planned Management approach by including additional water-use efficiency. In this diversification level, urban water-use efficiency increases in two steps, first, by 2020, efficiency increases by 20 percent, and second, by 2030, urban water-use efficiency increases an additional 10 percent to 30 percent above the baseline. Agricultural water-use efficiency increases 10 percent by 2020. The 30-percent increase in urban water-use efficiency is consistent with higher levels of efficiency described by the CWP Update 2009 (DWR, 2009), CALFED’s Water Use Efficiency Comprehensive Evaluation (CALFED, 2006), and the 20 × 2020 Water Conservation Plan (DWR et al., 2010). The 10-percent increase in agricultural efficiency is consistent with the average efficiency improvements described in the CWP Update 2009, the Pacific Institute’s Sustaining California Agriculture in an Uncertain Future (Cooley, Christian-Smith, Gleick, 2009), and CALFED’s Water Use Efficiency Comprehensive Evaluation (CALFED, 2006).
Diversification Level 2
This response package represents modest increases in infrastructure projects, such as conjunctive management and recycled municipal water, in addition to water-use efficiency increases considered in Diversification Level 1. In this case, by 2030 there is a 50-percent increase in recycled water use, and by 2020 there is a maximum of 20 thousand acre-feet per month (TAF/month) in each planning area in the Tulare Lake HR. The rate of increase in recycling was based on CALFED’s Water Use Efficiency Comprehensive Evaluation (CALFED, 2006). Sources for potential conjunctive management sites were based on the 1999 CALFED Conjunctive Use Site Assessment (CALFED, 1999). That study estimated recharge rates for nine potential groundwater banking sites and mapped them to eight sites within the WEAP model. The low recharge rates represent the lower bound of potential recharge described in that report.
Diversification Level 3
This response package expands the Diversification Level 2 package by including the five EFTs and the groundwater recovery targets. These targets are specified to begin in 2015, a timeframe set to be as early as possible, and remain in effect for the rest of the simulation.
Diversification Level 4
This response package includes increases in water-use efficiency and conjunctive management. In addition to the 30-percent urban water-use efficiency specified in Diversification Level 3, this diversification level specifies that, by 2040, urban water-use efficiency increases by 35 percent. Additionally, agricultural water-use efficiency is specified to increase to 15 percent by 2030. Lastly, this response package specifies that, by 2020, groundwater recharge increases to a maximum of 40 TAF/month in each planning area. The high
Topic: Data and Analytical Tools Robust Water-Management Strategies for The California Central Valley
California Water Plan Update 2013 Vol 4 Reference Guide Page 54

32
recharge rates in conjunctive management represent the upper bounds of possible recharge described in the CALFED Conjunctive Use Site Assessment report (CALFED, 1999).
Diversification Level 5
This response package represents further increases in urban and agricultural water-use efficiency. Specifically, urban water-use efficiency is specified to increase to 40 percent by 2040, and agricultural water-use efficiency is specified to increase to 20 percent by 2030.
Costs of Implementing Response Packages
For this analysis we made very rough estimates of the cost of implementing management strategies, above those in the Currently Planned Baseline, for the purposes of highlighting trade-offs between the effects of water-management strategies and the potential costs of doing so. These estimates are based on assumptions of the cost per volume of water saved through conservation, reused through a recycled municipal water program, or stored as part of a conjunctive management strategy. Volumetric water cost estimates are based on literature values from the recently completed Colorado River Basin Study (Bureau of Reclamation, 2012) and a report by Hans Johnson of the Public Policy Institute of California (Johnson, 2008). Annual strategy costs are calculated by multiplying the annual water volumes saved, conserved, or reused (as computed by the WEAP Central Valley Model for each simulation) by the unit costs. Note that costs for imposing additional environmental flow or groundwater recovery targets, such as additional studies or administration, are not included and may in some cases be substantial.
Table 3.8 shows the volumetric cost values used. Note that costs are not discounted over time. This assumption is justified as they are not being compared to monetized benefits—only to reliability metrics over time.
Topic: Data and Analytical Tools Robust Water-Management Strategies for The California Central Valley
California Water Plan Update 2013 Vol 4 Reference Guide Page 55

33
Table 3.8. Implementation Cost Estimates for Management Strategies
Current Management Approach or
Response Package
Urban Water-Use
Efficiency
Agricultural Water-Use Efficiency
Recycled Municipal
Water
Groundwater Banking
Groundwater Recovery Targets
Ecosystem Restoration
Currently Planned Management
No Additional Cost
No Additional Cost
No Additional Cost
No Additional Cost
Not included Not included
Diversification Level 1
$500 per AFa
(Bureau of Reclamation,
2012)
$150 per AFa (Bureau of
Reclamation, 2012)
$1,500 per AF
(Bureau of Reclamation,
2012)
$305 per AF (Public Policy
Institute of California,
2009)
Diversification Level 2
Diversification Level 3
Diversification Level 4
$750 per AFb (Bureau of
Reclamation, 2012)
$500 per AFb (Bureau of
Reclamation, 2012)
Diversification Level 5
NOTE: AF = acre foot. a This is the cost per AF of savings, using the Currently Planned Management as the reference level. b This is the cost per AF of savings, using Diversification Level 3 as the reference level.
Relationships
In this context, relationships refer to the interconnections among the different components of the climate and hydrologic systems, facilities, and operational rules and management strategies. The analysis uses a linked hydrologic and water-management model of the Sacramento River, San Joaquin River, and Tulare Lake HRs developed in the WEAP software package developed and maintained by the Stockholm Environment Institute (SEI) (Yates, Sieber, Purkey, and Huber-Lee, 2005; Yates, Purkey, Sieber, Huber-Lee, and Galbraith, 2005).
This model, called the WEAP Central Valley Model (Joyce et al., 2010), is a deterministic water-planning model run monthly from 2005 to 2050. It calculates a wide range of geophysical factors representing the performance of the water-management system under a specific set of assumptions about future conditions and the implementation of water-management strategies. In particular, it simulates the major water supplies and demand for the upper watershed and valley floor for each DWR planning area. The spatial resolution of the model is appropriate to (1) simulate major hydrologic flows and exchanges, and surface and groundwater storage; (2) represent major demographic and land-use trends; and (3) evaluate the effects of many water-management strategies.
The model consists of a hydrological module that simulates rainfall-runoff and baseflow processes for 25 watersheds flowing into the Central Valley and includes 86 demand nodes grouped into four broad categories: agriculture, urban, managed wetlands, and environmental
Topic: Data and Analytical Tools Robust Water-Management Strategies for The California Central Valley
California Water Plan Update 2013 Vol 4 Reference Guide Page 56
34
flow requirements. The WEAP hydrology module includes a spatial layer that subdivides each watershed into sub-catchment areas that fall within different elevation bands (at 500 meter increments) such that the model can capture snow accumulation and snow melt processes at higher elevations. Within each of these “elevation banded” sub-catchments, the area is further divided based on land-use and land-cover segments. This spatial layer is overlaid with a water management network topology of rivers, canals, reservoirs, demand centers, and aquifers. Individual catchment areas are associated with a unique weather dataset of precipitation, temperature, relative humidity, and wind speed. The WEAP Central Valley Model calculates the hydrologic response of each catchment area using a one-dimensional, quasi-physical water balance routine. The estimated runoff, infiltration, evapotranspiration, interflow, percolation, and base flow components for each catchment area are then summed to represent the lumped hydrologic response for all land-cover classes and associated river elements.
Total urban demand consists of indoor and outdoor urban demand. Indoor demand is estimated by multiplying the number of water-use entities and their associated water-use rates. The key water-use entities represented in the WEAP Central Valley Model are
single-family (SF) households multifamily (MF) households commercial employees industrial employees
Water-use rates are calculated considering factors such as income, household use rates, household size, water price, and naturally occurring conservation. Outdoor demand is estimated using the hydrology module and other factors, such as irrigated landscape area, water-use rate factors, parameters defining soil and landscape characteristics, and weather conditions. The irrigated landscape area is a function of population and urban density.
Irrigated agricultural demand is estimated using an imbedded hydrology module and is a function of the irrigated area of 21 different crop types, physical parameters defining soil and land-cover characteristics, and rain and temperature conditions. Similar to the case of urban demand, the irrigated area is also a function of the different growth scenarios that specify different patterns for population growth and for urban encroachment into agricultural lands. The model combines all of these factors to estimate the future water demand by crop.
The WEAP Central Valley Model considers specific river flow requirements for water quality, fish and wildlife, navigation, recreation, and downstream flow maintenance through specification of flow requirements associated with points on a river or diversion. These requirements are adjusted to reflect different hydrologic conditions and are satisfied in accordance with WEAP’s user-defined priority structure.
The model attempts to satisfy demand by diverting surface water and pumping groundwater according to specified preferences for different supplies and priorities of different demands. For each month, the model calculates hydrologic response for each river and groundwater object. Based on this resource quantification, water allocations are made using a linear programming
Topic: Data and Analytical Tools Robust Water-Management Strategies for The California Central Valley
California Water Plan Update 2013 Vol 4 Reference Guide Page 57

35
optimization routine that takes into account the constraints set by the characteristics of the reservoirs, the existing distribution network, the environmental regulations, and the priorities assigned to each demand node (Joyce et al., 2010).
The extent to which the model is able to meet the full water requirements depends on the availability of surface water supplies and on capacity constraints on canals and groundwater pumping. These limitations on water supply availability and conveyance reflect physical, contractual, and legal constraints and regulatory guidelines that govern system operations.
The WEAP Central Valley Model was calibrated and subsequently validated using the gridded, 0.125-degree daily climate dataset of Maurer et al. (2002) for the period 1970 through 2005. Joyce et al., (2010) documents the calibration. Figure 3.9 presents the calibration results for the two largest surface reservoirs in the model’s domain—Lake Shasta and Lake Oroville.
Figure 3.9. Select Calibration Results for the WEAP Central Valley Model
SOURCE: Joyce et al., (2010).
Topic: Data and Analytical Tools Robust Water-Management Strategies for The California Central Valley
California Water Plan Update 2013 Vol 4 Reference Guide Page 58

36
4. Results: Vulnerability of the Current Management Approach
In this chapter, we present results from the Central Valley vulnerability analysis (Steps 1–3 in Figure 2.2). In Chapter Five, we describe how management response packages could reduce the vulnerabilities described in this chapter, and highlight the key trade-offs that water managers would need to make among the different strategies (Step 4 in Figure 2.2).
How Would Current Water Management in the Central Valley Perform Under Different Plausible Futures?
We first evaluate how the current management system and approach would perform across 198 different futures (nine growth scenarios x 22 climate scenarios) using the WEAP Central Valley Model.
Urban and Agricultural Demand, Supply, and Reliability
Figure 4.1 shows the range of urban and agricultural reliability in the Sacramento River, San Joaquin River, and Tulare Lake HRs. In the figure, each symbol indicates the reliability for one of the 198 simulations. The vertical lines indicate the median of each distribution, and the shaded areas indicate the results that fall within the middle half of the distribution (between the 25th and 75th percentiles). The figure clearly shows that the supply of water to both the urban and agricultural sectors in the Sacramento River HR and urban sector for the San Joaquin River HR is projected to remain highly reliable across the futures evaluated. Reliability for the agricultural sector in the San Joaquin River HR and the urban sector in the Tulare Lake HR is lower; with about half the futures leading to less than 95 percent reliability. For the agricultural sector in the Tulare Lake HR, reliability is broadly lower, with a median result of about 71 percent reliability. In some futures, reliability falls below 50 percent.
Topic: Data and Analytical Tools Robust Water-Management Strategies for The California Central Valley
California Water Plan Update 2013 Vol 4 Reference Guide Page 59

37
Figure 4.1. Range of Urban and Agricultural Reliability Results Across 198 Futures
Figure 4.2 shows the relationships between agricultural supply reliability and urban supply reliability for the three HRs. In the Sacramento River HR, the supply of water to both sectors is highly reliable across all futures. In the San Joaquin River HR, urban reliability exceeds the 95-percent reliability vulnerability threshold for all futures, but agricultural reliability does not. In Tulare Lake, most futures lead to low agricultural reliability and many lead to low urban reliability as well.
Figure 4.2. Urban and Agricultural Supply Reliability for Three Hydrologic Regions for Currently Planned Management
NOTE: Dotted lines indicate the 95-percent reliability vulnerability thresholds for urban and agricultural sectors.
Topic: Data and Analytical Tools Robust Water-Management Strategies for The California Central Valley
California Water Plan Update 2013 Vol 4 Reference Guide Page 60
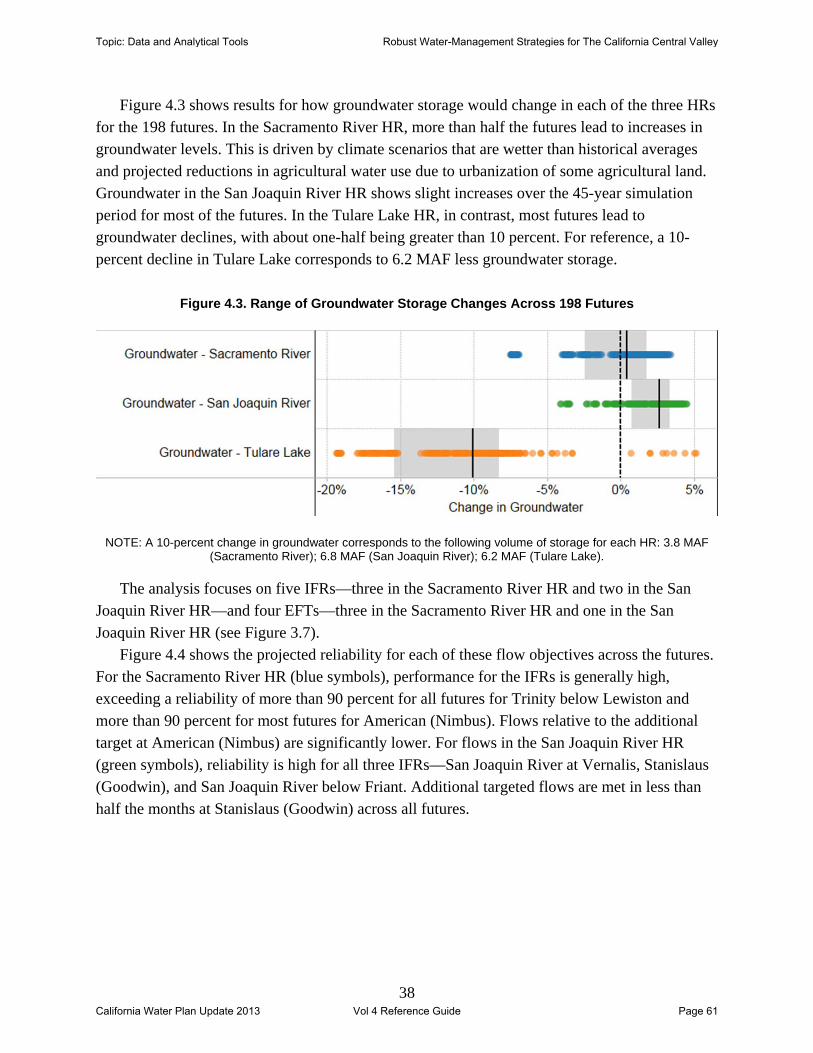
38
Figure 4.3 shows results for how groundwater storage would change in each of the three HRs for the 198 futures. In the Sacramento River HR, more than half the futures lead to increases in groundwater levels. This is driven by climate scenarios that are wetter than historical averages and projected reductions in agricultural water use due to urbanization of some agricultural land. Groundwater in the San Joaquin River HR shows slight increases over the 45-year simulation period for most of the futures. In the Tulare Lake HR, in contrast, most futures lead to groundwater declines, with about one-half being greater than 10 percent. For reference, a 10-percent decline in Tulare Lake corresponds to 6.2 MAF less groundwater storage.
Figure 4.3. Range of Groundwater Storage Changes Across 198 Futures
NOTE: A 10-percent change in groundwater corresponds to the following volume of storage for each HR: 3.8 MAF (Sacramento River); 6.8 MAF (San Joaquin River); 6.2 MAF (Tulare Lake).
The analysis focuses on five IFRs—three in the Sacramento River HR and two in the San Joaquin River HR—and four EFTs—three in the Sacramento River HR and one in the San Joaquin River HR (see Figure 3.7).
Figure 4.4 shows the projected reliability for each of these flow objectives across the futures. For the Sacramento River HR (blue symbols), performance for the IFRs is generally high, exceeding a reliability of more than 90 percent for all futures for Trinity below Lewiston and more than 90 percent for most futures for American (Nimbus). Flows relative to the additional target at American (Nimbus) are significantly lower. For flows in the San Joaquin River HR (green symbols), reliability is high for all three IFRs—San Joaquin River at Vernalis, Stanislaus (Goodwin), and San Joaquin River below Friant. Additional targeted flows are met in less than half the months at Stanislaus (Goodwin) across all futures.
Topic: Data and Analytical Tools Robust Water-Management Strategies for The California Central Valley
California Water Plan Update 2013 Vol 4 Reference Guide Page 61

39
Figure 4.4. Range of Instream Flow Requirement Reliability Across 198 Futures
NOTES: SR = Sacramento River; SJ = San Joaquin River. The color of the symbols indicates the HR—Sacramento River (blue), San Joaquin River (green).
What Are the Vulnerabilities of the Current Management Approach?
Figure 4.5 summarizes the vulnerability of the current management approach in terms of the percentage of futures in which outcomes do not meet the vulnerability thresholds, as defined in Chapter Three. For the Sacramento River HR, the current management approach is most vulnerable with respect to groundwater storage change (43 percent of futures). It is also vulnerable with respect to the three EFTs: American (100 percent of futures), ERP #1 and #2 (100 percent of futures) and ERP#4-Freeport (100 percent of futures). The San Joaquin River HR is most vulnerable with respect to agricultural supply reliability (36 percent of futures), to the San Joaquin River below Friant IFR (100 percent of futures), and to the EFT at Stanislaus (100 percent of futures). The Tulare Lake hydrologic is the most vulnerable with respect to agricultural reliability (95 percent of futures) and with respect to groundwater storage change (95 percent of futures). This shows that while performance is expected to remain high for some
0% 20% 40% 60% 80% 100%
Reliability
Trinity below Lewiston [IFR; NC]Currently ..
American (Nimbus) [IFR; SR]Currently ..
American (Nimbus) [EFT;SR]Currently ..
Ecosystem Restoration Program #1 and #2[EFT; SR]
Currently ..
Ecosystem Restoration Program #4, Freeport[EFT; SR]
Currently ..
San Joaquin River at Vernalis [IFR; SJ]Currently ..
San Joaquin River below Friant [IFR; SJ]Currently ..
Stanislaus (Goodwin) [IFR; SJ]Currently ..
Stanislaus (Goodwin) [EFT; SJ]Currently ..
Topic: Data and Analytical Tools Robust Water-Management Strategies for The California Central Valley
California Water Plan Update 2013 Vol 4 Reference Guide Page 62

40
metrics in some regions, performance based on other metrics is expected to be poor across many or even all plausible futures.
Figure 4.5. Summary of Key Performance Metrics Across 198 Futures with the Current Water Management Approach
NOTES: Numbers and color indicate the percentage of 198 futures in which the currently planned management is vulnerable. The urban and agricultural sectors are vulnerable if they are less than 95-percent reliable. Groundwater change is vulnerable if it is negative. IFR and EFT metrics are vulnerable if they are less than 95-percent reliable.
We next focused on the urban and agricultural sectors that were shown to be most vulnerable to the futures—agricultural reliability in the San Joaquin HR and urban and agricultural reliability in the Tulare Lake HR.
Characteristics of Vulnerabilities
The results shown in Figure 4.5 clearly indicate that the current management approach is vulnerable to many of the plausible future conditions described by the futures. However, not all futures lead to poor performance. We next conducted a statistical analysis of the simulation results to understand which external conditions lead to vulnerabilities. This information can be used in two ways: (1) to guide the development of response packages and (2) to define signposts—conditions to monitor over time that should trigger additional strategies.
To describe future vulnerable conditions, we first characterized the scenarios by primary driving factor. For example, for each demographic and land-use scenario, we calculated the following factors:
Topic: Data and Analytical Tools Robust Water-Management Strategies for The California Central Valley
California Water Plan Update 2013 Vol 4 Reference Guide Page 63

41
population growth rate change in irrigated land area.
For each climate scenario, we calculated the following factors:
average temperature temperature trend average annual precipitation temperature and precipitation in summer months temperature and precipitation in winter months temperature and precipitation from 2040 to 2050.
We next use scenario discovery methods (Bryant and Lempert, 2010) to define decision-relevant composite scenarios that lead the current management strategy to perform poorly with respect to the San Joaquin River agricultural sector and Tulare Lake urban and agricultural sectors (Table 4.1). The composite scenario for the San Joaquin River agricultural sector is defined solely by temperature trend and average annual precipitation, and is named Hot and Dry. For the Tulare Lake HR urban sector, the growth scenario is also important, and is named Drier than Historical with Higher than Current Trends Growth. The composite scenario for the Tulare Lake agricultural sector is only defined by precipitation and is called Anything But Wet. Figures 4.6–4.8 illustrate these scenarios.
Topic: Data and Analytical Tools Robust Water-Management Strategies for The California Central Valley
California Water Plan Update 2013 Vol 4 Reference Guide Page 64
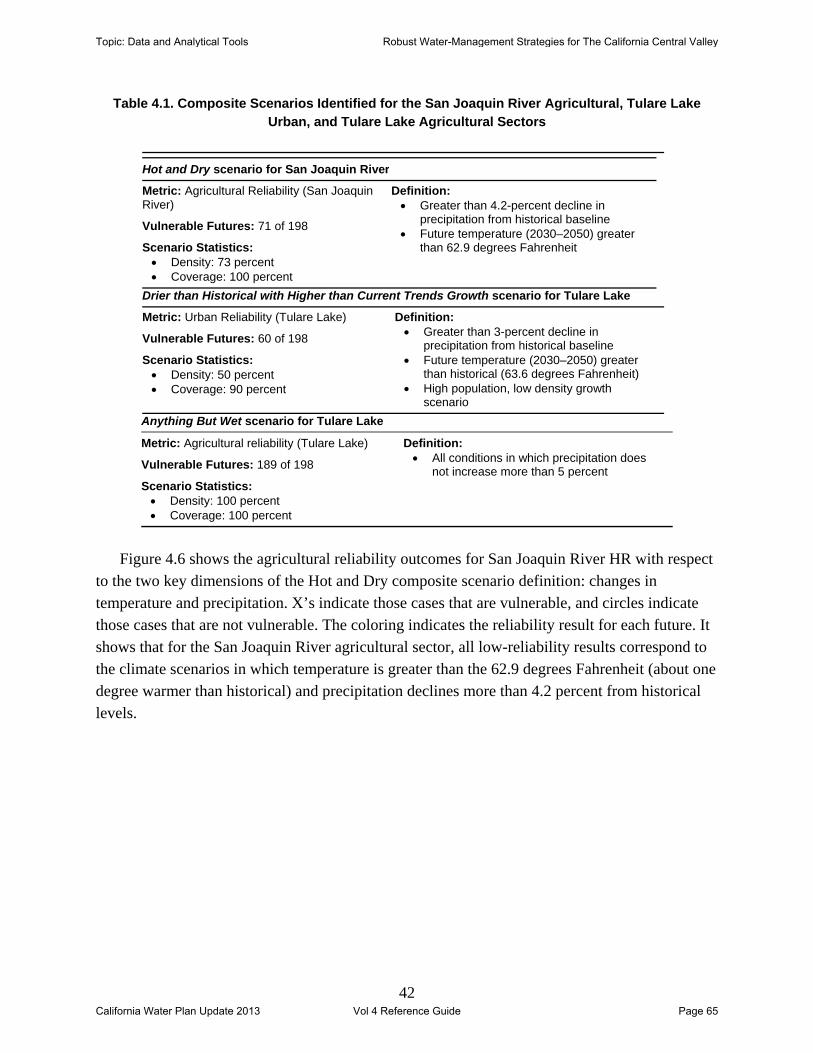
42
Table 4.1. Composite Scenarios Identified for the San Joaquin River Agricultural, Tulare Lake Urban, and Tulare Lake Agricultural Sectors
Hot and Dry scenario for San Joaquin River
Metric: Agricultural Reliability (San Joaquin River)
Definition: Greater than 4.2-percent decline in
precipitation from historical baseline Future temperature (2030–2050) greater
than 62.9 degrees Fahrenheit
Vulnerable Futures: 71 of 198
Scenario Statistics: Density: 73 percent Coverage: 100 percent
Drier than Historical with Higher than Current Trends Growth scenario for Tulare Lake
Metric: Urban Reliability (Tulare Lake) Definition: Greater than 3-percent decline in
precipitation from historical baseline Future temperature (2030–2050) greater
than historical (63.6 degrees Fahrenheit) High population, low density growth
scenario
Vulnerable Futures: 60 of 198
Scenario Statistics: Density: 50 percent Coverage: 90 percent
Anything But Wet scenario for Tulare Lake
Metric: Agricultural reliability (Tulare Lake) Definition: All conditions in which precipitation does
not increase more than 5 percent Vulnerable Futures: 189 of 198
Scenario Statistics: Density: 100 percent Coverage: 100 percent
Figure 4.6 shows the agricultural reliability outcomes for San Joaquin River HR with respect
to the two key dimensions of the Hot and Dry composite scenario definition: changes in temperature and precipitation. X’s indicate those cases that are vulnerable, and circles indicate those cases that are not vulnerable. The coloring indicates the reliability result for each future. It shows that for the San Joaquin River agricultural sector, all low-reliability results correspond to the climate scenarios in which temperature is greater than the 62.9 degrees Fahrenheit (about one degree warmer than historical) and precipitation declines more than 4.2 percent from historical levels.
Topic: Data and Analytical Tools Robust Water-Management Strategies for The California Central Valley
California Water Plan Update 2013 Vol 4 Reference Guide Page 65
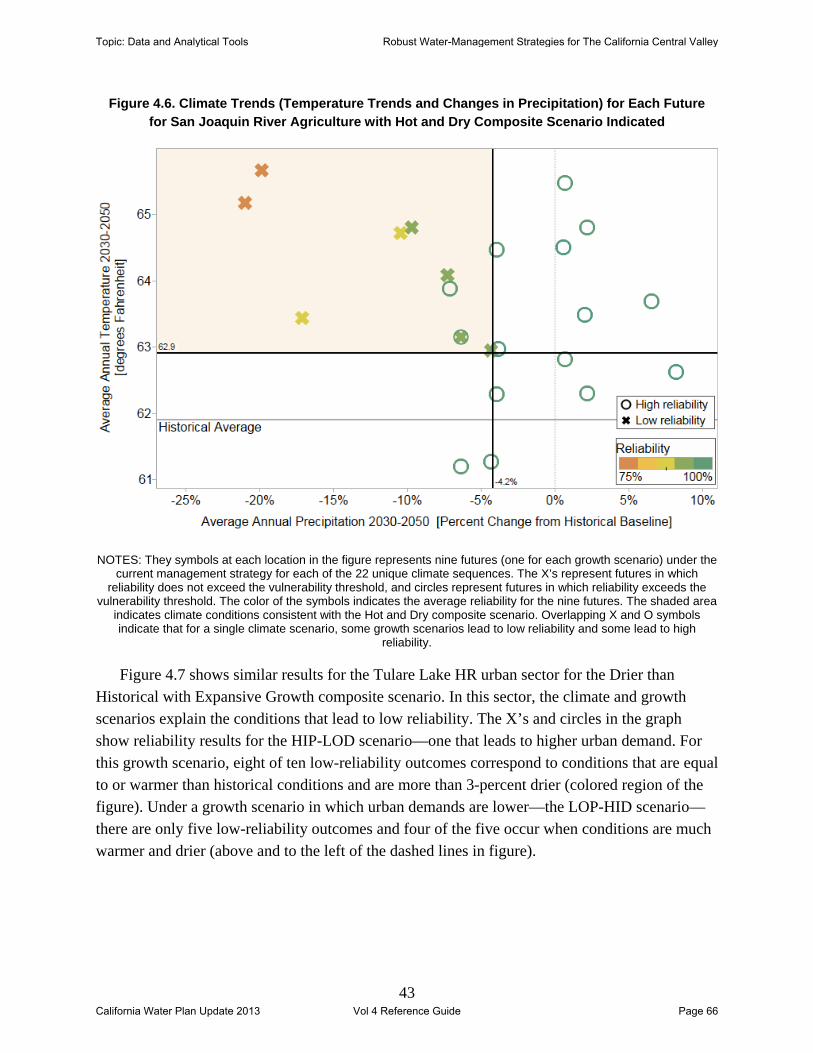
43
Figure 4.6. Climate Trends (Temperature Trends and Changes in Precipitation) for Each Future for San Joaquin River Agriculture with Hot and Dry Composite Scenario Indicated
NOTES: They symbols at each location in the figure represents nine futures (one for each growth scenario) under the current management strategy for each of the 22 unique climate sequences. The X’s represent futures in which
reliability does not exceed the vulnerability threshold, and circles represent futures in which reliability exceeds the vulnerability threshold. The color of the symbols indicates the average reliability for the nine futures. The shaded area
indicates climate conditions consistent with the Hot and Dry composite scenario. Overlapping X and O symbols indicate that for a single climate scenario, some growth scenarios lead to low reliability and some lead to high
reliability.
Figure 4.7 shows similar results for the Tulare Lake HR urban sector for the Drier than Historical with Expansive Growth composite scenario. In this sector, the climate and growth scenarios explain the conditions that lead to low reliability. The X’s and circles in the graph show reliability results for the HIP-LOD scenario—one that leads to higher urban demand. For this growth scenario, eight of ten low-reliability outcomes correspond to conditions that are equal to or warmer than historical conditions and are more than 3-percent drier (colored region of the figure). Under a growth scenario in which urban demands are lower—the LOP-HID scenario—there are only five low-reliability outcomes and four of the five occur when conditions are much warmer and drier (above and to the left of the dashed lines in figure).
Topic: Data and Analytical Tools Robust Water-Management Strategies for The California Central Valley
California Water Plan Update 2013 Vol 4 Reference Guide Page 66

44
Figure 4.7 Climate Trends (Temperature Trends and Changes in Precipitation) for Each Future for the Tulare Lake Urban Sector for High Population-Low Density Growth Scenario,
with Drier Than Historical with Expansive Growth Composite Scenario Indicated
NOTES: Each point represents one future under the current management strategy for the HIP-LOD growth scenario. The X’s represent futures in which reliability does not exceed the vulnerability threshold, and circles represent futures in which reliability exceeds the vulnerability threshold. The color of the symbols indicates their reliability. The shaded
area indicates the climate conditions consistent with the Drier Than Historical with Expansive Growth composite scenario. The dotted lines indicate the vulnerable region for the subset of futures based on the LOP-HID growth
scenario.
In the Tulare Lake HR agricultural sector, almost all futures are low reliability (i.e. less than 95 percent reliable), and the climate conditions describing the reliable conditions are all wetter than historical. Figure 4.8 shows results averaging over all nine growth scenarios. All but one climate scenario leads to low reliability, and reliability generally declines for warmer and dryer climate conditions (upper left). The warmest and driest climate conditions lead to reliability below 50 percent. These results clearly indicate that the Tulare Lake agricultural sector will likely continue to experience low supply reliability, and perhaps extreme reliability problems, without other water-management strategies.
Topic: Data and Analytical Tools Robust Water-Management Strategies for The California Central Valley
California Water Plan Update 2013 Vol 4 Reference Guide Page 67

45
Figure 4.8 Climate Trends (Temperature Trends and Changes in Precipitation) for Each Future for Tulare Lake Agriculture with Anything But Wet Scenario
NOTES: They symbols at each location in the figure represents nine futures (one for each growth scenario) under the current management strategy for each of the 22 unique climate sequences. The X’s represent futures in which
reliability does not exceed the vulnerability threshold, and circles represent futures in which reliability exceeds the vulnerability threshold. The color of the symbols indicates the average reliability for the nine futures. The shaded area
indicates the climate conditions consistent with the Anything But Wet composite scenario.
In summary, the Sacramento River HR is projected to remain highly reliable with stable groundwater storage levels in most futures evaluated—even under alternative climate change projections. For the San Joaquin River HR, however, shortages would occur in the agricultural sector under climate conditions that are modestly warmer and slightly drier than historical. For the Tulare Lake HR, however, urban reliability is below 95 percent in many futures, particularly those with warmer and drier conditions and high population growth and low land-use density. For the agricultural sector, reliability is consistently below 95 percent and can be lower than 50 percent in the hottest and driest climate scenarios.
These vulnerabilities, if unmitigated, would pose a significant challenge for the urban and agricultural sectors. Note that the analysis up to this point assumes no additional management in the region through 2050 except for efficiency through the 20 x 2020 regulation. In the next chapter, we show how implementing additional strategies can reduce these vulnerabilities.
Topic: Data and Analytical Tools Robust Water-Management Strategies for The California Central Valley
California Water Plan Update 2013 Vol 4 Reference Guide Page 68

46
5. Results: Mitigating Vulnerabilities Through Response Packages
Chapter Four analyzed how the current management approach would perform across a wide range of futures with respect to a range of performance metrics. We identified three decision-relevant scenarios that represent key vulnerabilities to the agricultural sector in the San Joaquin River and the urban and agricultural sectors in Tulare Lake. This chapter analyzes how water-management strategies implemented as a part of different response packages could reduce these vulnerabilities. It then describes the key trade-offs among these response packages in terms of reducing vulnerabilities and cost.
How Would Response Packages Reduce the Vulnerabilities of the Current Management Approach?
We evaluated how the implementation of different response packages (Table 3.5) could improve outcomes and reduce vulnerabilities by simulating the system with each response package across 88 futures—four growth scenarios and 22 climate sequences.9
Figures 5.1 and 5.2 show how outcomes would change due to the implementation of response packages representing incrementally increasing diversity of management strategies. Each line represents a pair of results for each future, as indicated in the upper left of each pair of graphs. The narrower, lighter ends mark the results for the first response package and the thicker, darker ends mark the results for the second response package. The horizontal position indicates urban supply reliability and the vertical position indicates agricultural supply reliability. The dashed lines mark the 95-percent reliability vulnerability thresholds, where areas below and to the left indicate low reliability and thus vulnerability.
Figure 5.1 shows that across all response package comparisons, bigger changes are observed in the Tulare Lake HR than the San Joaquin River HR, reflecting lower current reliability in the Tulare Lake HR. The efficiency increases included in Diversification Levels 1 and 2 significantly improve reliability in both the urban and agricultural sectors in the Tulare Lake HR (top two rows, right column of Figure 5.1). The additional environmental and groundwater flow targets in Diversification Level 3, however, reverse some of these improvements and leads to lower reliability for many futures (bottom row of Figure 5.1). As described below, concurrent improvements are seen in groundwater storage and environmental flows with Diversification Level 3.
9 For the analysis of response packages, only four scenarios were evaluated to reduce the computational requirements of the analysis—CTP-CTD, HIP-LOD, LOP-HID, and CTP-HID.
Topic: Data and Analytical Tools Robust Water-Management Strategies for The California Central Valley
California Water Plan Update 2013 Vol 4 Reference Guide Page 69

47
Figure 5.1. Change in Urban and Agricultural Reliability from Currently Planned Management to Response Package 1, then to Response Package 2, and then to Response Package 3
NOTE: Each line shows results corresponding to two different response packages, with the darker end corresponding to the second response package. The dotted lines indicate the vulnerability thresholds used to summarize the
reliability results across the futures.
Agr
icul
trua
l Sup
ply
Rel
iabi
lity
Agr
icul
trua
l Sup
ply
Rel
iabi
lity
Agr
icul
trua
l Sup
ply
Rel
iabi
lity
Topic: Data and Analytical Tools Robust Water-Management Strategies for The California Central Valley
California Water Plan Update 2013 Vol 4 Reference Guide Page 70

48
Figure 5.2 shows that the additional efficiency and conjunctive management in Diversification Levels 4 and 5 improve reliability across both sectors close to the levels achieved with Diversification Level 3.
Figure 5.2. Change in Urban and Agricultural Reliability from Response Package 3 to Response Package 4, and then to Response Package 5
NOTE: Each line shows results corresponding to two different response packages, with the darker end corresponding to the second response package. The dotted lines indicate the vulnerability thresholds used to summarize the
reliability results across the futures.
Figures 5.3, 5.4, and 5.5 summarize results for each diversification level for the key metrics for the Sacramento River, San Joaquin River, and Tulare Lake HRs, respectively. As with Figure 4.5, the number and color within each square indicates the percentage of futures that do not meet the specified vulnerability thresholds and are considered to be vulnerable futures (see Chapter Three). Therefore, cases in which there are few vulnerable futures are highlighted in green, and cases in which there are many vulnerable futures are highlighted in red. These results are based on 88 futures reflecting four growth scenarios and 22 climate sequences.
60% 70% 80% 90% 100%
Urban Supply Reliability
20%
40%
60%
80%
100%
Diversification Level 3 toDiversification Level 4
San Joaquin River HR
60% 70% 80% 90% 100%
Urban Supply Reliability
20%
40%
60%
80%
100%
Diversification Level 4 toDiversification Level 5
60% 70% 80% 90% 100%
Urban Supply Reliability
Turlare Lake HR
60% 70% 80% 90% 100%
Urban Supply Reliability
Topic: Data and Analytical Tools Robust Water-Management Strategies for The California Central Valley
California Water Plan Update 2013 Vol 4 Reference Guide Page 71

49
For the Sacramento River HR (Figure 5.3), urban supply reliability is high for all futures across all diversification levels. Agricultural reliability declines below the 95-percent reliability vulnerability threshold in about one-third of all futures when additional environmental flow and groundwater recovery targets are implemented (Diversification Level 3). Reliability in about one-half of the newly vulnerable futures improves with the implementation of strategies in Diversification Level 5. Groundwater and environmental flows show significant improvements with Diversification Level 3, except for the additional target for the American River (Nimbus).
Figure 5.3. Percent of Vulnerable Futures for Each Response Package for the Sacramento River Hydrologic Region
NOTE: Numbers and color indicate the percentage of 88 futures in which the currently planned management is vulnerable. The urban and agricultural sectors are vulnerable if they are less than 95-percent reliable. Groundwater change is vulnerable if it is negative. IFR and EFT metrics are vulnerable if they are less than 95-percent reliable.
For the San Joaquin River HR (Figure 5.4), similar patterns are seen across the performance metrics. The management strategies included in the first two diversification levels—efficiency, conjunctive use, and recycling—lead to marked improvements in the percentage of futures in which agricultural supply is reliable and groundwater storage does not decline. The addition of environmental flow and groundwater recovery targets in Diversification Level 3 leads to a bit more improvement in groundwater storage and leads to high reliability for the Stanislaus (Goodwin) EFT for all futures. These improvements in groundwater and environmental flows come at the expense of agricultural supply reliability and, to a lesser extent, urban supply
Topic: Data and Analytical Tools Robust Water-Management Strategies for The California Central Valley
California Water Plan Update 2013 Vol 4 Reference Guide Page 72
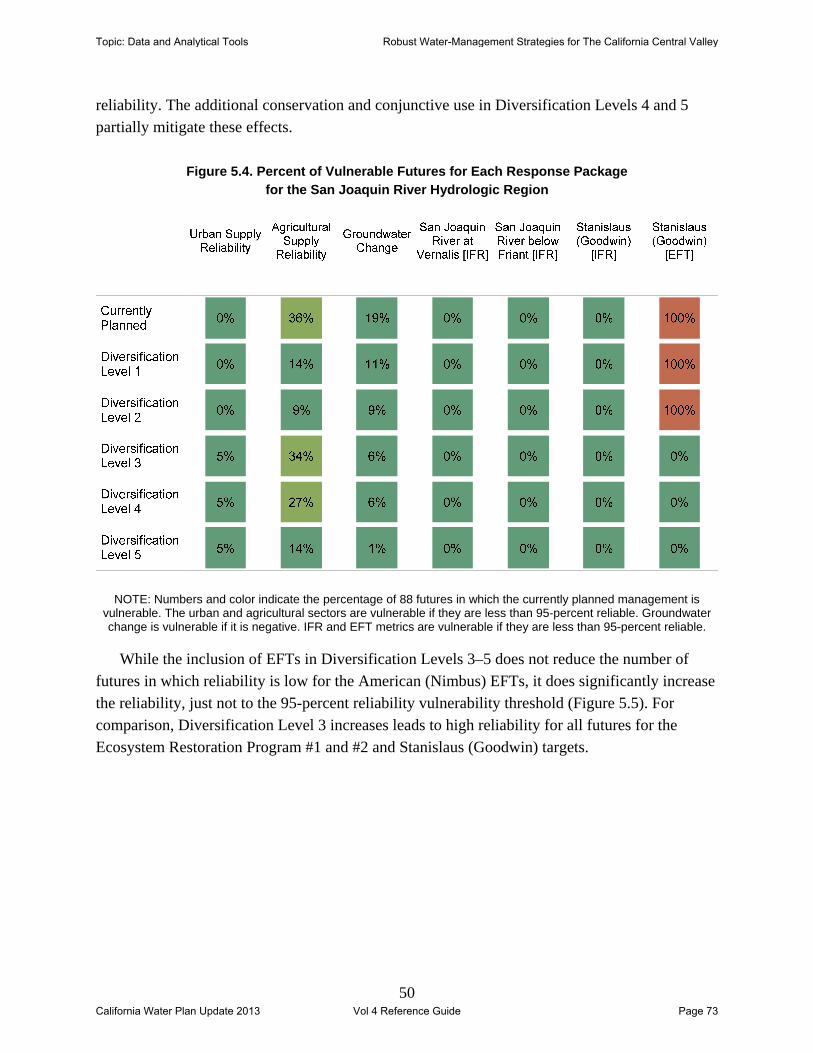
50
reliability. The additional conservation and conjunctive use in Diversification Levels 4 and 5 partially mitigate these effects.
Figure 5.4. Percent of Vulnerable Futures for Each Response Package for the San Joaquin River Hydrologic Region
NOTE: Numbers and color indicate the percentage of 88 futures in which the currently planned management is vulnerable. The urban and agricultural sectors are vulnerable if they are less than 95-percent reliable. Groundwater change is vulnerable if it is negative. IFR and EFT metrics are vulnerable if they are less than 95-percent reliable.
While the inclusion of EFTs in Diversification Levels 3–5 does not reduce the number of futures in which reliability is low for the American (Nimbus) EFTs, it does significantly increase the reliability, just not to the 95-percent reliability vulnerability threshold (Figure 5.5). For comparison, Diversification Level 3 increases leads to high reliability for all futures for the Ecosystem Restoration Program #1 and #2 and Stanislaus (Goodwin) targets.
Topic: Data and Analytical Tools Robust Water-Management Strategies for The California Central Valley
California Water Plan Update 2013 Vol 4 Reference Guide Page 73

51
Figure 5.5. Range of Reliability for Three Environmental Flow Targets Across 88 Futures for Currently Planned Management and Diversification Level 3
For the Tulare Lake HR (Figure 5.6) the trade-offs between urban and agricultural reliability and groundwater levels are also clearly evident. Improvements in urban and agricultural supply reliability are realized through Diversification Level 2. While groundwater storage improves considerably with the implementation of groundwater recovery targets and more efficiency in Diversification Levels 3–5, vulnerability in the agricultural sector remains high.
Figure 5.6. Percent of Vulnerable Futures for Each Response Package for Tulare Lake Hydrologic Region
NOTE: Numbers and color indicate the percentage of 88 futures in which the currently planned management is vulnerable. The urban and agricultural sectors are vulnerable if they are less than 95-percent reliable. Groundwater
change is vulnerable if it is negative.
30% 40% 50% 60% 70% 80% 90% 100%
Reliability
American (Nimbus) [EFT;SR]
Curr..
Div..
Ecosystem Restoration Program #1 and #2[EFT; SR]
Curr..
Div..
Stanislaus (Goodwin) [EFT; SJ]
Curr..
Div.. vulnerability threshold (95% reliability)
Response Package
Currently Planned
Diversification Level 3
Topic: Data and Analytical Tools Robust Water-Management Strategies for The California Central Valley
California Water Plan Update 2013 Vol 4 Reference Guide Page 74
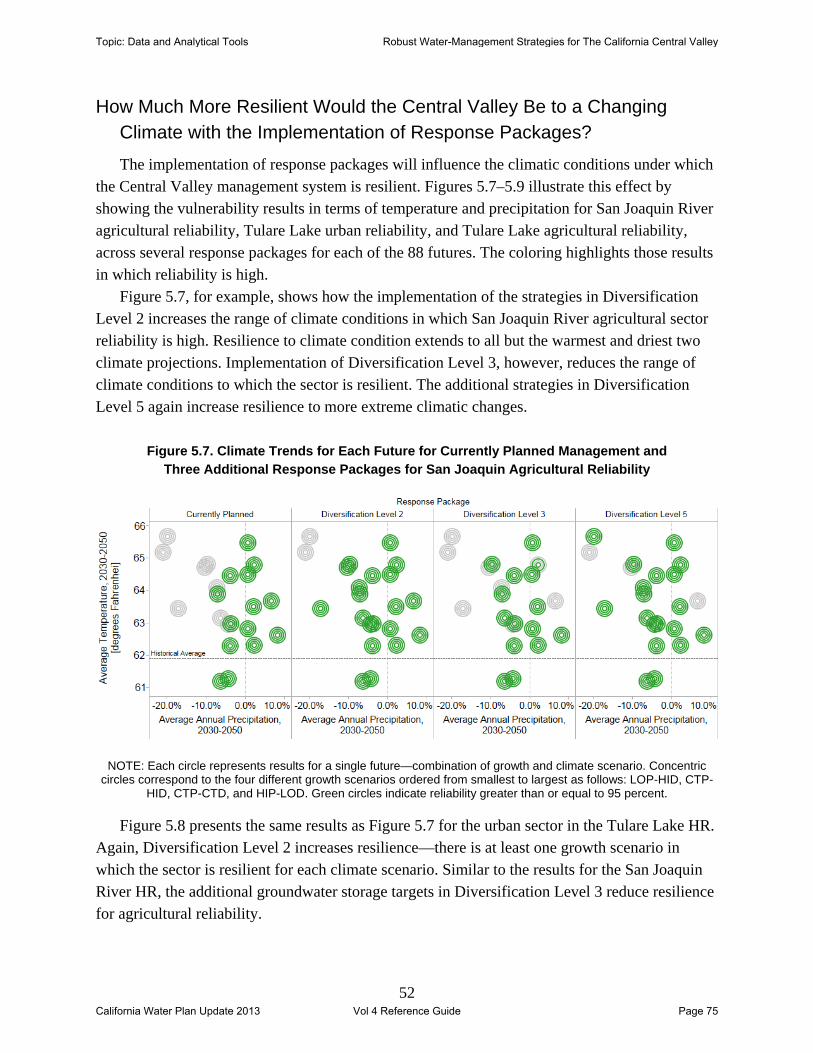
52
How Much More Resilient Would the Central Valley Be to a Changing Climate with the Implementation of Response Packages?
The implementation of response packages will influence the climatic conditions under which the Central Valley management system is resilient. Figures 5.7–5.9 illustrate this effect by showing the vulnerability results in terms of temperature and precipitation for San Joaquin River agricultural reliability, Tulare Lake urban reliability, and Tulare Lake agricultural reliability, across several response packages for each of the 88 futures. The coloring highlights those results in which reliability is high.
Figure 5.7, for example, shows how the implementation of the strategies in Diversification Level 2 increases the range of climate conditions in which San Joaquin River agricultural sector reliability is high. Resilience to climate condition extends to all but the warmest and driest two climate projections. Implementation of Diversification Level 3, however, reduces the range of climate conditions to which the sector is resilient. The additional strategies in Diversification Level 5 again increase resilience to more extreme climatic changes.
Figure 5.7. Climate Trends for Each Future for Currently Planned Management and Three Additional Response Packages for San Joaquin Agricultural Reliability
NOTE: Each circle represents results for a single future—combination of growth and climate scenario. Concentric circles correspond to the four different growth scenarios ordered from smallest to largest as follows: LOP-HID, CTP-
HID, CTP-CTD, and HIP-LOD. Green circles indicate reliability greater than or equal to 95 percent.
Figure 5.8 presents the same results as Figure 5.7 for the urban sector in the Tulare Lake HR. Again, Diversification Level 2 increases resilience—there is at least one growth scenario in which the sector is resilient for each climate scenario. Similar to the results for the San Joaquin River HR, the additional groundwater storage targets in Diversification Level 3 reduce resilience for agricultural reliability.
Topic: Data and Analytical Tools Robust Water-Management Strategies for The California Central Valley
California Water Plan Update 2013 Vol 4 Reference Guide Page 75
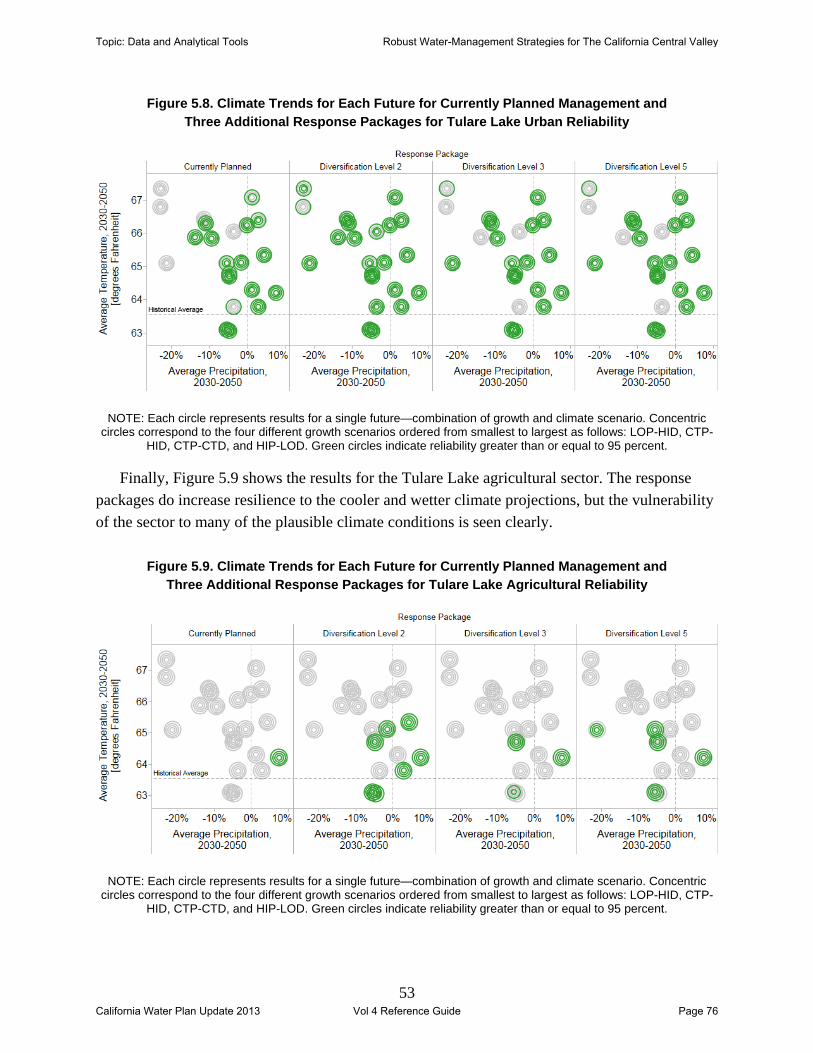
53
Figure 5.8. Climate Trends for Each Future for Currently Planned Management and Three Additional Response Packages for Tulare Lake Urban Reliability
NOTE: Each circle represents results for a single future—combination of growth and climate scenario. Concentric circles correspond to the four different growth scenarios ordered from smallest to largest as follows: LOP-HID, CTP-
HID, CTP-CTD, and HIP-LOD. Green circles indicate reliability greater than or equal to 95 percent.
Finally, Figure 5.9 shows the results for the Tulare Lake agricultural sector. The response packages do increase resilience to the cooler and wetter climate projections, but the vulnerability of the sector to many of the plausible climate conditions is seen clearly.
Figure 5.9. Climate Trends for Each Future for Currently Planned Management and Three Additional Response Packages for Tulare Lake Agricultural Reliability
NOTE: Each circle represents results for a single future—combination of growth and climate scenario. Concentric circles correspond to the four different growth scenarios ordered from smallest to largest as follows: LOP-HID, CTP-
HID, CTP-CTD, and HIP-LOD. Green circles indicate reliability greater than or equal to 95 percent.
Topic: Data and Analytical Tools Robust Water-Management Strategies for The California Central Valley
California Water Plan Update 2013 Vol 4 Reference Guide Page 76

54
What Are the Trade-Offs Between Vulnerability Reduction and Cost?
If cost (and other effects of the augmentation strategies not captured by this analysis) were not a consideration, the most aggressive response package would clearly be the preferred option. When costs of the management strategies are factored in, trade-offs emerge. Rough estimates of the costs of implementing response packages are calculated based on the volumes of water conserved or supplied via reuse or conjunctive use (see Chapter Three).
The following three figures show how the percentage of futures that are vulnerable changes for each performance metric, as a function of annual average cost for each HR. As these estimates do not include the costs of implementing new environmental flow or groundwater recovery targets, the cost of Diversification Level 3 is the same as that for Diversification Level 2. Figure 5.10 shows that the largest cost increases in the Sacramento River HR are from implementing additional urban and agricultural efficiency in Diversification Levels 1, 3, and 5. As the conjunctive management strategy does not apply to this region, cost increases between Diversification Levels 1 and 2 are slight. The largest improvements are seen in groundwater and EFT reliability. Diversification Levels 4 and 5 reduce vulnerabilities in the agricultural sector that arise after the implementation of the environmental flow and groundwater recovery targets in Diversification Level 3.
Topic: Data and Analytical Tools Robust Water-Management Strategies for The California Central Valley
California Water Plan Update 2013 Vol 4 Reference Guide Page 77

55
Figure 5.10. Trade-Off Curves of Percentage of Vulnerable Futures Versus Cost For Different Metrics Across Response Packages for the Sacramento River Hydrologic Region
NOTE: Annual costs are averaged across the entire simulation period (2006–2050).
Figure 5.11 shows similar trade-offs for the San Joaquin River as for Sacramento River, although efficiency investments specified in Diversification Level 1 dramatically improve agricultural supply reliability. The costs and benefits of the conjunctive management and recycled municipal water in Diversification Level 2 are also evident.
$0M $50M $100M $150M $200M $250M $300M
Average Annual Cost (Sacramento River HR)
0%
10%
20%
30%
40%
ERP #1 and #2 [EFT]
ERP #1 and #2 [EFT]
Groundwater Change
Agricultural Supply Reliability
Agricultural Supply Reliability
Urban Supply ReliabilityUrban Supply Reliability
Groundwater Change
Response PackageCurrently PlannedDiversification Level 1
Diversification Level 2Diversification Level 3
Diversification Level 4Diversification Level 5
Topic: Data and Analytical Tools Robust Water-Management Strategies for The California Central Valley
California Water Plan Update 2013 Vol 4 Reference Guide Page 78
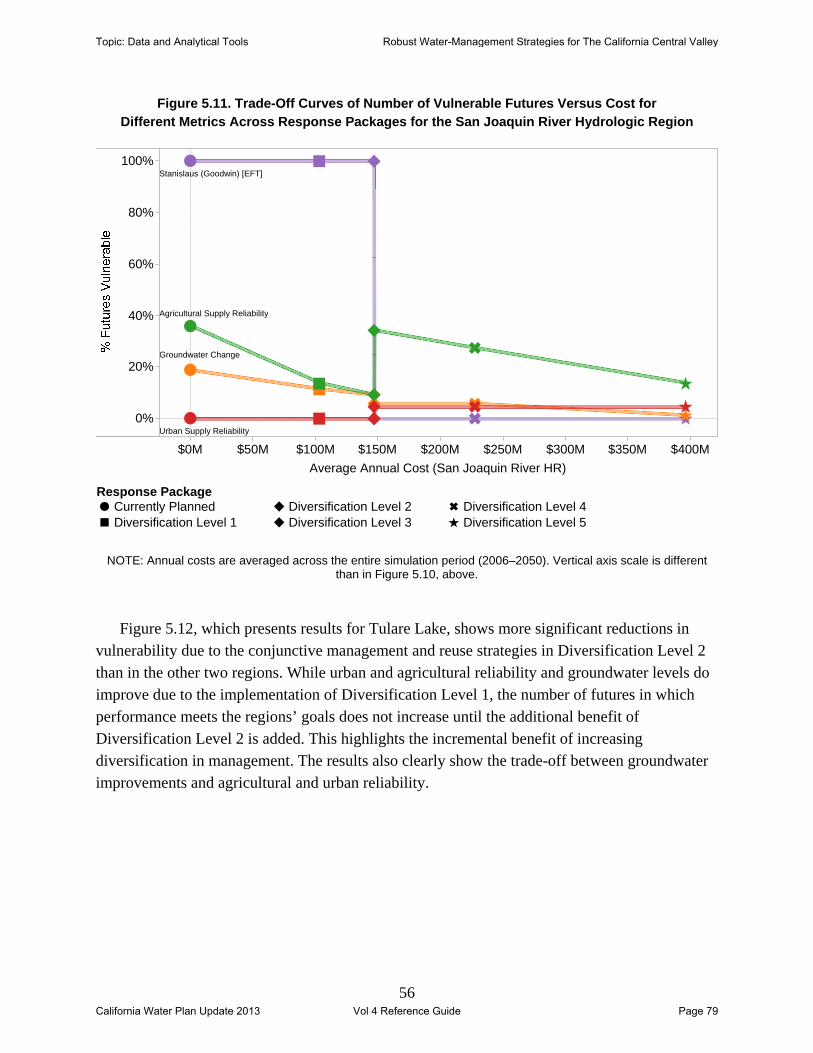
56
Figure 5.11. Trade-Off Curves of Number of Vulnerable Futures Versus Cost for Different Metrics Across Response Packages for the San Joaquin River Hydrologic Region
NOTE: Annual costs are averaged across the entire simulation period (2006–2050). Vertical axis scale is different than in Figure 5.10, above.
Figure 5.12, which presents results for Tulare Lake, shows more significant reductions in
vulnerability due to the conjunctive management and reuse strategies in Diversification Level 2 than in the other two regions. While urban and agricultural reliability and groundwater levels do improve due to the implementation of Diversification Level 1, the number of futures in which performance meets the regions’ goals does not increase until the additional benefit of Diversification Level 2 is added. This highlights the incremental benefit of increasing diversification in management. The results also clearly show the trade-off between groundwater improvements and agricultural and urban reliability.
$0M $50M $100M $150M $200M $250M $300M $350M $400M
Average Annual Cost (San Joaquin River HR)
0%
20%
40%
60%
80%
100%
Groundwater Change
Agricultural Supply Reliability
Stanislaus (Goodwin) [EFT]
Urban Supply Reliability
Response PackageCurrently PlannedDiversification Level 1
Diversification Level 2Diversification Level 3
Diversification Level 4Diversification Level 5
Topic: Data and Analytical Tools Robust Water-Management Strategies for The California Central Valley
California Water Plan Update 2013 Vol 4 Reference Guide Page 79

57
Figure 5.12. Trade-Off Curves of Number of Vulnerable Futures Versus Cost for Different Metrics Across Response Packages for Tulare Lake Hydrologic Region
NOTE: Annual costs are averaged across the entire simulation period (2006–2050). Vertical axis scale is different than in Figure 5.10, above.
Additional RDM analysis could also provide more insight. This analysis identified decision-relevant scenarios that describe key vulnerabilities. Evaluation of different response packages showed how vulnerabilities could be decreased or increased. Table 5.1 shows this in terms of the percentage of vulnerable futures that are consistent with these decision-relevant composite scenarios. This information can be combined with expectations of water managers (informed by technical experts and the scientific literature, perhaps) about the likelihoods of these decision-relevant scenarios.
Topic: Data and Analytical Tools Robust Water-Management Strategies for The California Central Valley
California Water Plan Update 2013 Vol 4 Reference Guide Page 80
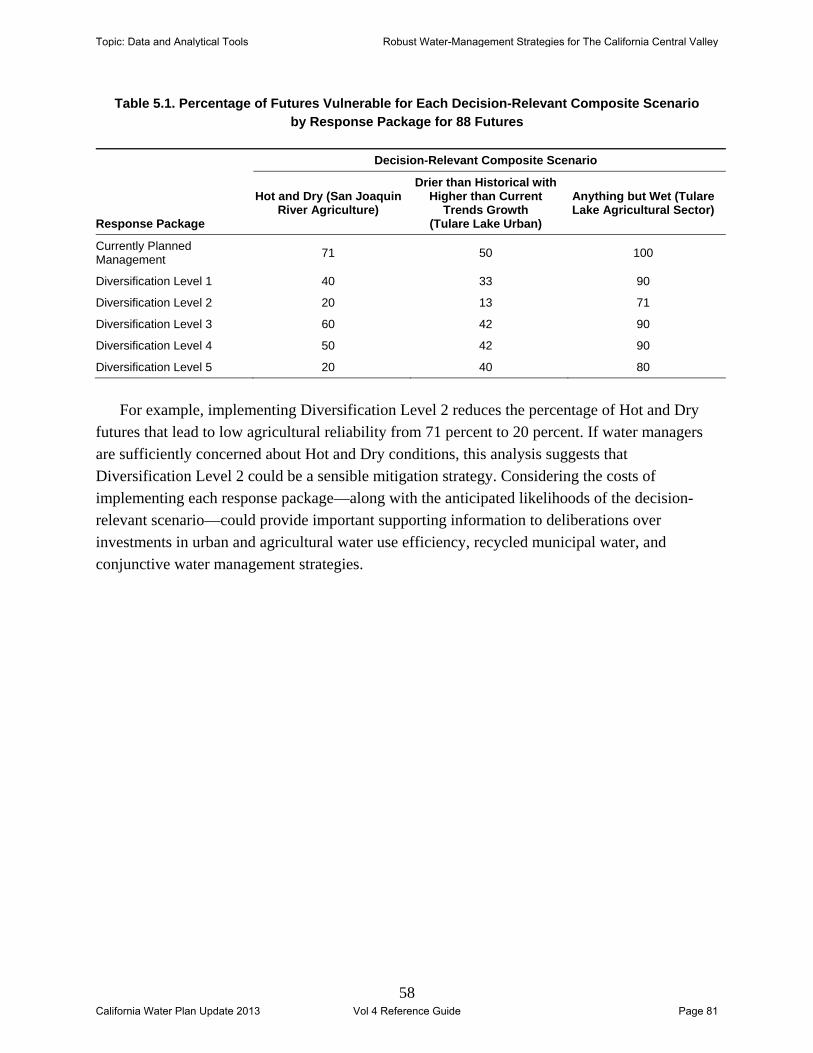
58
Table 5.1. Percentage of Futures Vulnerable for Each Decision-Relevant Composite Scenario by Response Package for 88 Futures
Response Package
Decision-Relevant Composite Scenario
Hot and Dry (San Joaquin River Agriculture)
Drier than Historical with Higher than Current
Trends Growth (Tulare Lake Urban)
Anything but Wet (Tulare Lake Agricultural Sector)
Currently Planned Management
71 50 100
Diversification Level 1 40 33 90
Diversification Level 2 20 13 71
Diversification Level 3 60 42 90
Diversification Level 4 50 42 90
Diversification Level 5 20 40 80
For example, implementing Diversification Level 2 reduces the percentage of Hot and Dry
futures that lead to low agricultural reliability from 71 percent to 20 percent. If water managers are sufficiently concerned about Hot and Dry conditions, this analysis suggests that Diversification Level 2 could be a sensible mitigation strategy. Considering the costs of implementing each response package—along with the anticipated likelihoods of the decision-relevant scenario—could provide important supporting information to deliberations over investments in urban and agricultural water use efficiency, recycled municipal water, and conjunctive water management strategies.
Topic: Data and Analytical Tools Robust Water-Management Strategies for The California Central Valley
California Water Plan Update 2013 Vol 4 Reference Guide Page 81
59
6. Discussion
How Does This Analysis Inform the California Water Plan?
This analysis showcases a new methodological approach for evaluating future vulnerabilities and management strategies for the CWP. The RDM analysis identifies a variety of vulnerabilities of the current management approach across the Central Valley and across management sectors and resources.
In particular, it finds that the agricultural sectors in the San Joaquin River HR and Tulare Lake HR and the urban sector in the Tulare Lake HR are vulnerable to future climate conditions that are warmer and drier than what has been experienced historically. These conditions are consistent with most of the 12 climate model simulations used in the analysis. The vulnerability of the Tulare Lake urban sector is exacerbated by more expansive urban growth. Furthermore, the agricultural sector in Tulare Lake is vulnerable in all conditions except those in which precipitation significantly increases over the coming decades. Groundwater and environmental flows throughout the Central Valley also degrade in many plausible future conditions.
These results largely confirm what has been reported in other studies. Unique to this work, however, are the specific climate thresholds that define decision-relevant composite scenarios. While future conditions are uncertain and there are a variety of driving factors, the analysis suggests that a few simple conditions, defined by future precipitation, temperature, and urban growth patterns, can characterize the situations in which the current management approach would not meet the regions’ goals. Use of the following composite scenarios—Hot and Dry, Drier than Historical with Higher than Current Trends Growth, and Anything But Wet—can help reduce the complexity of the uncertain future and focus dialogue around the conditions that matter to water management.
The analysis also provides a preliminary look at different mixes of management strategies (response packages) for reducing vulnerabilities. The results clearly show that increases in urban and agricultural water use efficiency, groundwater conjunctive management and recycled municipal water can reduce many of the vulnerabilities. Achieving additional environmental flow and groundwater recovery targets improved performance in these areas, but required additional investments in water use efficiency (or other strategies not evaluated) to maintain or improve agricultural and urban supply reliability. It also shows that even with significant diversification and investment in water use efficiency, recycled municipal water, and conjunctive management, some vulnerability to future growth and climate change still remains. Consideration of additional strategies, such as new surface storage, and other combinations of strategies (i.e., response packages) might reveal more cost-effective approaches for each region.
Topic: Data and Analytical Tools Robust Water-Management Strategies for The California Central Valley
California Water Plan Update 2013 Vol 4 Reference Guide Page 82
60
Finally, the analysis begins to frame up decisions about how much water-management diversification is needed, around reductions in different types of vulnerabilities and cost. It is not possible to predict with certainty what conditions California will encounter. However, understanding how much investment is required to address ranges of plausible conditions is a useful contribution to water-management planning discussions.
Limitations of the Analysis
While this analysis provides a first-of-its-kind look at water-management vulnerabilities and response packages in the Central Valley of California, it represents only a preliminary examination of investment choices facing the California water-management community. There are also several important limitations related to the modeling and data used, as well as the use of this analysis to support deliberations.
The WEAP Central Valley Model usefully represents the hydrology and management of the Central Valley, but necessarily makes important simplifications. For example, it does not model each water utility or agency as a single entity, nor does it represent all planned investments by each utility. Rather, it aggregates urban and agricultural water use and supplies up to the CWP Planning Area level. Many of the planned activities by Central Valley water agencies may also be included in the response packages. In this way, the comparison of different diversification levels to the Currently Planned Management approach is more theoretical than representative of a specific decision facing California water planners. Not all major water management strategies are included. For example, additional surface storage strategies were modeled, and it was determined that the WEAP Central Valley Model could not yet represent their benefits or effects with sufficient accuracy to include in the analysis. The approach for estimating costs of management strategies was also rough and represented just a first cut evaluation. In particular, we did not include estimates of implementing new environmental flow or groundwater recovery targets.
The WEAP model also does not represent some of the important dynamics or ecology of the Bay Delta. This limits the ability of the model to consider the effects of climate, development, sea-level rise, and other factors in the Central Valley on exports to Southern California, and this limits the performance metrics that could be evaluated in the study.
The treatment of future climate uncertainty is also limited by the use of 12 downscaled global climate model simulations and ten other variants based on historical climate. These projections likely underrepresent climate variability. Recent analyses (e.g. Desser et al. [2012]) suggest that the predictability of future climate is limited because of natural variability, and a thorough robustness analysis would likely require a more expansive set of climate scenarios than evaluated for this analysis.
The analysis also did not demonstrate all aspects of RDM. For example, it did not evaluate response packages that evolve over time, a feature likely to be very important for the successful
Topic: Data and Analytical Tools Robust Water-Management Strategies for The California Central Valley
California Water Plan Update 2013 Vol 4 Reference Guide Page 83

61
long-term management of the Central Valley. Lempert and Groves (2010) provides an example of how adaptive strategies can increase the robustness of long-term water-management plans.
The final limitation is that the development of the tools and data used in this analysis were under development for much of the planning period available for the CWP Update 2013. While available time was sufficient to perform a careful analysis, additional stakeholder outreach would be beneficial to assess the value of the final results in informing discussions about regional water management.
Future Directions
Although this analysis is restricted to the Central Valley, it provides a template for an examination of California-wide water issues. Major water policy issues that could be addressed include the merits of investment in specific initiatives being considered for a 2014 California Water Bond, such as surface storage. These tools and methods could also provide a statewide look at the relative benefits of implementing the proposed Bay-Delta water conveyance facility described in the Bay Delta Conservation Plan (DWR and Reclamation, 2013), as compared to alternatives.
To address these policy questions, the WEAP model’s treatment of the Bay Delta will need to be improved to include the effects of sea-level rise on ecological conditions and water quality in the Delta. Integrating a representation of Southern California to the WEAP Central Valley (e.g. Yates et al. [2013]) would also be required for the analysis to address intra-state benefits and tradeoffs of different levels of water management diversification.
Given the sensitive and critically important nature of these decisions, a revised RDM analysis would need to be conducted in conjunction with a comprehensive and robust stakeholder outreach process. Specific areas in which expanded stakeholder involvement would be needed included: model vetting and validation, specification of performance metrics and thresholds, evaluation of vulnerability and cost trade-offs.
Topic: Data and Analytical Tools Robust Water-Management Strategies for The California Central Valley
California Water Plan Update 2013 Vol 4 Reference Guide Page 84

62
References
Ben-Haim, Y., Info-Gap Decision Theory: Decisions under Severe Uncertainty. Academic, Oxford, 2006.
Brekke, L.D., E.P. Maurer, J.D. Anderson, M.D. Dettinger, E.S. Townsley, A. Harrison, and T. Pruitt, “Assessing Reservoir Operations Risk Under Climate Change,” Water Resources Research, Vol. 45, 2009, doi:doi:10.1029/2008WR006941.
Brekke, L. D., Thrasher, B. L., Maurer, E. P., and Pruitt, T., Downscaled CMIP3 and CMIP5 Climate and Hydrology Projections: Release of Downscaled CMIP5 Climate Projections, Comparison with preceding Information, and Summary of User Needs, Denver, CO: U.S. Department of the Interior, Bureau of Reclamation, Technical Service Center, 2013. As of January 15, 2014: http://gdo-dcp.ucllnl.org/downscaled_cmip_projections/techmemo/downscaled_climate.pdf
Brown, C., Y. Ghile, M. Laverty, and K. Li, “Decision Scaling: Linking Bottom-Up Vulnerability Analysis with Climate Projections in the Water Sector,” Water Resources Research, Vol. 48, 2012.
Bryant, B. P., and R. J. Lempert, “Thinking Inside the Box: A Participatory, Computer-Assisted Approach to Scenario Discovery,” Technological Forecasting and Social Change, Vol. 77, 2010, pp. 34–49.
Bureau of Reclamation, Colorado River Basin Water Supply and Demand Study: Study Report, Washington, D.C.: U.S. Department of the Interior, December 2012.
CALFED, Conjunctive Use Site Assessment, Sacramento, Calif.: CALFED Bay-Delta Program, December 23, 1999. As of December 17, 2013: http://www.calwater.ca.gov/Admin_Record/D-014101.pdf
CALFED, Water Use Efficiency Comprehensive Evaluation, Sacramento, Calif.: CALFED Bay-Delta Program, 2006
California Climate Action Team, 2009 Climate Action Team Biennial Report to the Governor and Legislature, Sacramento, Calif., April 2010. As of December 17, 2013: http://www.energy.ca.gov/2010publications/CAT-1000-2010-004/CAT-1000-2010-004.PDF
California Department of Water Resources, California Water Plan Update 2013, Public Review Draft, Sacramento, Calif., 2013a.
California Department of Water Resources, California Water Plan Update 2013, Vol. III: Regional Reports, Sacramento, Calif., 2013b.
Topic: Data and Analytical Tools Robust Water-Management Strategies for The California Central Valley
California Water Plan Update 2013 Vol 4 Reference Guide Page 85

63
California Department of Water Resources, California Water Plan Update 2009: Integrated Water Management, Sacramento, Calif., 2009. As of December 17, 2013: http://www.waterplan.water.ca.gov/cwpu2009/index.cfm
California Department of Water Resources, State Water Resources Control Board, California Bay-Delta Authority, California Energy Commission, California Department of Public Health, California Public Utilities Commission, and California Air Resources Board, 20×2020 Water Conservation Plan, Sacramento, Calif., 2010. As of December 17, 2013: http://www.water.ca.gov/wateruseefficiency/sb7/docs/20x2020plan.pdf
California Department of Water Resources and U.S. Bureau of Reclamation, Bay Delta Conservation Plan--Public Review Draft, 2013. As of February 1, 2013: http://baydeltaconservationplan.com/PublicReview/PublicReviewDraftBDCP.aspx
Cooley, H., J. Christian-Smith, and P. H. Gleick, Sustaining California Agriculture in an Uncertain Future, Oakland, Calif.: Pacific Institute, July 2009. As of December 17, 2013: http://www.pacinst.org/wp-content/uploads/2013/02/final6.pdf
Das, T., E.P. Maurer, D.W. Pierce, M.D. Dettinger, and D.R. Cayan, “Increases in Flood Magnitudes in California under Warming Climates,” Journal of Hydrology, Vol. 501, 2013, pp. 101–110.
Deser, C., R. Knutti, S. Solomon, and A. S. Phillips, “Communication of the Role of Natural Variability in Future North American Climate,” Nature Climate Change, Vol. 2, 2012, pp. 775–779.
DWR—See California Department of Water Resources.
Groves, D. G., and E. Bloom, Robust Water-Management Strategies for the California Water Plan Update 2013, Santa Monica, Calif.: RAND Corporation, RR-182-DWR, 2013. As of December 10, 2013: http://www.rand.org/pubs/research_reports/RR182.html
Groves, D. G., M. Davis, R. Wilkinson, and R. J. Lempert, “Planning for Climate Change in the Inland Empire,” Water Resources IMPACT, Vol. 10, 2008, pp. 14–17.
Groves, D. G., J. R. Fischbach, E. Bloom, D. Knopman, and R. Keefe, Adapting to a Changing Colorado River: Making Future Water Deliveries More Reliable Through Robust Management Strategies, Santa Monica, Calif.: RAND Corporation, RR-242-BOR, 2013. As of December 9, 2013: http://www.rand.org/pubs/research_reports/RR242.html
Groves, D. G., J. R. Fischbach, N. Kalra, E. Molina-Perez, D. N. Yates, D. R. Purkey, A. Fencl, V. Mehta, B. Wright, and G. Pyke, A Framework for Assessing Climate Change Vulnerability and Defining Robust Risk Management Strategies for Water Utilities, Denver, Colo.: Water Resources Foundation, forthcoming.
Topic: Data and Analytical Tools Robust Water-Management Strategies for The California Central Valley
California Water Plan Update 2013 Vol 4 Reference Guide Page 86

64
Groves, D. G., and R. J. Lempert, “A New Analytic Method for Finding Policy-Relevant Scenarios,” Global Environmental Change, Vol. 17, 2007, pp. 73–85.
Hanak, E., and Lund, J. R., “Adapting California’s water management to climate change.” Climatic Change, Vol. 111(1), 2011, pp. 17–44, doi:10.1007/s10584-011-0241-3.
Howitt, R. E., MacEwan, D., Medellín-Azuara, J., and Lund, J. R., “Economic Modeling of Agriculture and Water in California Using the Statewide Agricultural Production Model,” California Water Plan Update 2009, Volume 4: Reference Guide, Sacramento, Calif.: Department of Water Resources, February 2010. As of December 19, 2013: http://www.waterplan.water.ca.gov/docs/cwpu2009/0310final/v4c04a02_cwp2009.pdf
Johnson, H., “Population Projections for California Climate Change Scenarios,” California Water Plan Update 2009, Volume 4: Reference Guide, Sacramento, Calif.: Department of Water Resources, February 2008. As of December 19, 2013: http://www.waterplan.water.ca.gov/docs/cwpu2009/0310final/v4c02a13_cwp2009.pdf
Joyce, B.A., V.K. Mehta, D.R. Purkey, L.L. Dale, and M. Hanemann, “Modifying Agricultural Water Management to Adapt to Climate Change in California’s Central Valley,” Climatic Change, Vol. 109, 2011, pp. 299–316.
Joyce, B., D. Purkey, D. Yates, D. G. Groves, and A. Draper, Integrated Scenario Analysis for the 2009 California Water Plan Update, Volume 4, Sacramento, Calif.: California Department of Water Resources, February 2010. As of December 17, 2013: http://www.waterplan.water.ca.gov/docs/cwpu2009/0310final/v4c04a05_cwp2009.pdf
Kendall, D.R. and J.A. Dracup, “A Comparison of Index-Sequential and AR(1) Generated Hydrologic Sequences,” Journal of Hydrology, Vol. 122, 1991, pp. 335–352.
Korteling, B., S. Dessai, and Z. Kapelan, “Using Information-Gap Decision Theory for Water Resources Planning Under Severe Uncertainty,” Water Resources Management, Vol. 27, 2012, pp. 1149–1172.
Lawrence Livermore National Laboratory, U.S. Department of the Interior, Bureau of Reclamation, and Santa Clara University, “Downscaled CMIP3 and CMIP5 Climate and Hydrology Projections,” dataset, 2013. As of December 19, 2013: http://gdo-dcp.ucllnl.org/downscaled_cmip_projections/dcpInterface.html
Lempert, R. J., and M. T. Collins, “Managing the Risk of Uncertain Threshold Responses: Comparison of Robust, Optimum, and Precautionary Approaches,” Risk Analysis: An International Journal, Vol. 27, 2007, pp. 1009–1026.
Lempert, R. J., and D. G. Groves, “Identifying and Evaluating Robust Adaptive Policy Responses to Climate Change for Water Management Agencies in the American West,” Technological Forecasting and Social Change, Vol. 77, 2010, pp. 960–974.
Topic: Data and Analytical Tools Robust Water-Management Strategies for The California Central Valley
California Water Plan Update 2013 Vol 4 Reference Guide Page 87
65
Lempert, R. J., N. Kalra, S. Peyraud, and Z. Mao, Ensuring Robust Flood Risk Management in Ho Chi Minh City: A Robust Decision Making Demonstration, World Bank, Policy Research Working Paper 6465, May 2013.
Lempert, R. J., Popper, S. W., Groves, D. G., Kalra, N., Fischbach, J. R., Bankes, S. C., et al., Making Good Decisions Without Predictions, RAND Corporation, Santa Monica, CA, 2013, As of December 19, 2013: http://www.rand.org/pubs/research_briefs/RB9701.html
Lempert, R. J., and S. W. Popper, “High-Performance Government in an Uncertain World,” in R. Klitgaard and P. Light, eds., High Performance Government: Structure, Leadership, and Incentives, Santa Monica, Calif.: RAND Corporation, MG-256-PRGS, 2005. As of December 17, 2013: http://www.rand.org/pubs/monographs/MG256.html
Lempert, R. J., S. W. Popper, and S. C. Bankes, Shaping the Next One Hundred Years: New Methods for Quantitative, Long-Term Policy Analysis, Santa Monica, Calif.: RAND Corporation, MR-1626-RPC, 2003. As of December 17, 2013: http://www.rand.org/pubs/monograph_reports/MR1626.html
Masson, D., and Knutti, R., “Climate model genealogy,” Geophysical Research Letters, Vol. 38(8), 2011, n/a–n/a. doi:10.1029/2011GL046864.
Maurer, E. P., and H. G. Hidalgo, “Utility of Daily Vs. Monthly Large-Scale Climate Data: An Intercomparison of Two Statistical Downscaling Methods,” Hydrology and Earth System Science, Vol. 12, 2008, pp. 551–563.
Maurer, E. P., A. W. Wood, J. C. Adam, D. P. Lettenmaier, and B. Nijssen, “A Long-Term Hydrologically-Based Data Set of Land Surface Fluxes and States for the Conterminous United States,” Journal of Climate, Vol. 15, 2002, pp. 3237–3251.
Means, E., M. Laugier, J. Daw, L. Kaatz, and M. Waage, Decision Support Planning Methods: Incorporating Climate Change Uncertainties into Water Planning, San Francisco, Calif.: Water Utility Climate Alliance, 2010. As of December 17, 2013: http://www.wucaonline.org/assets/pdf/actions_whitepaper_012110.pdf
Meehl, G. A., Covey, C., Taylor, K. E., Delworth, T., Stouffer, R. J., Latif, M., McAvaney, B. , Mitchell, J. F. B., “The WCRP CMIP3 Multimodel Dataset: A New Era in Climate Change Research,” Bulletin of the American Meteorological Society, Vol. 88(9), 2007, pp. 1383–1394.
Metropolitan Water District, Integrated Resources Plan 2010 Update, Los Angeles, Calif.: The Metropolitan Water District of Southern California, 2010.
Milly, P. C. D., J. Betancourt, M. Falkenmark, R. M. Hirsch, Z. W. Kundzewicz, D. P. Lettenmaier, and R. J. Stouffer, “Stationarity Is Dead: Whither Water Management?” Science, Vol. 319, 2008, pp. 573–574.
Topic: Data and Analytical Tools Robust Water-Management Strategies for The California Central Valley
California Water Plan Update 2013 Vol 4 Reference Guide Page 88

66
National Academies of Science, Committee on America’s Climate Choices, America’s Climate Choices, Washington, D.C.: The National Academies Press, 2011. As of December 17, 2013: http://www.nap.edu/openbook.php?record_id=12781
National Research Council, Informing Decisions in a Changing Climate, Washington, D.C.: The National Academies Press, Committee on the Human Dimensions of Climate Change, Division of Behavioral and Social Sciences and Education, 2009. As of December 17, 2013: http://www.nap.edu/catalog.php?record_id=12626
Popper, S. W., C. Berrebi, J. Griffin, T. Light, E. Y. Min, and K. Crane, Natural Gas and Israel’s Energy Future: Near-Term Decisions from a Strategic Perspective, Santa Monica, Calif.: RAND Corporation, MG-927-YSNFF, 2009. As of December 17, 2013: http://www.rand.org/pubs/monographs/MG927.html
Simon, H. A., “Rational Choice and the Structure of the Environment,” Psychological Review, Vol. 63, 1956, pp. 129–138.
Syme, G., A.P. Georgakakos, H. Yao, M. Kistenmacher, K.P. Georgakakos, N.E. Graham, F.-Y. Cheng, C. Spencer, and E. Shamir, “Value of Adaptive Water Resources Management in Northern California under Climatic Variability and Change: Reservoir Management,” Journal of Hydrology, Vol. 412, 2012, pp. 34–46.
Thompson, L.C., M.I. Escobar, C.M. Mosser, D.R. Purkey, D. Yates, and P.B. Moyle, “Water Management Adaptations to Prevent Loss of Spring-Run Chinook Salmon in California under Climate Change,” Journal of Water Resources Planning and Management, Vol. 138, 2012, pp. 465–478.
U.S. Bureau of Reclamation, Colorado River Basin Water Supply and Demand Study: Study Report. U.S. Department of the Interior, 2012.
Willows, R.. and R.K. Connell, Climate Adaptation: Risk, Uncertainty and Decision-Making. Oxford, UK, 2003.
Yates, D., Averyt, K., Flores-Lopez, F., Meldrum, J., Sattler, S., Sieber, J., and Young, C, “A water resources model to explore the implications of energy alternatives in the southwestern US.,” Environmental Research Letters, Vol. 8(4), 2013, 045004. doi:10.1088/1748-9326/8/4/045004
Yates, D., D. Purkey, J. Sieber, A. Huber-Lee, and H. Galbraith, “WEAP21—A Demand-, Priority-, and Preference-Driven Water Planning Model: Part 2, Aiding Freshwater Ecosystem Service Evaluation,” Water International, Vol. 30, 2005, pp. 501–512.
Yates, D., J. Sieber, D. Purkey, and A. Huber-Lee, “WEAP21—A Demand-, Priority-, and Preference-Driven Water Planning Model: Part 1, Model Characteristics,” Water International, Vol. 30, 2005, pp. 487–500.
Topic: Data and Analytical Tools Robust Water-Management Strategies for The California Central Valley
California Water Plan Update 2013 Vol 4 Reference Guide Page 89