pqpq - molecular & cellular proteomics
TRANSCRIPT

PQPQ “Protein Quantification by Peptide Quality control”
Manual
Jenny Forshed
Acknowledgements I would like to thank my great collaborators for support on the development of this software application: Lina Hultin-Rosenberg, Henrik Johansson, Maria Pernemalm, AnnSofi Sandberg, Rui Branca and Janne Lehtiö.
Introduction PQPQ (Protein Quantification by Peptide Quality control) is a software application for curation of shotgun proteomics data. It is written by Jenny Forshed and presented in the paper Enhanced information output from shotgun proteomics data in Protein Quantification by Peptide Quality control (PQPQ). The input to PQPQ is peptide data from a shotgun proteomics experiment. The data can be from a labeled as well as a label-free experimental setup. The data output from PQPQ is quantities of proteins between samples (ratios). The quantitative output is quality assured by sorting out outlier peptides. The protein data output from PQPQ also includes a separate quantification of the different protein species found. In the results file is also noted if the peptides are too few for quantification, or if the peptide confidences are too low for quantification. In those cases the protein identity is still there, but the quantitative data is missing. The ratios are freely defined by the user. For each ratio, the standard deviation of the ratio, the probability of the ratio being one, and the number of peptides that have been included in the calculation is reported. In replicate studies, the peptide information from all the replicates is used for verification of the protein identities and quantities as well as the detection of different protein species in the experiment. The correct t-statistics, where the quantification variability and p-values are reported both within sample (between peptides), and between sample replicates are then reported in the protein output file.

The main input to PQPQ: 1. Peptide data output from ProteinPilot (Applies Biosystems), Spectrum Mill
(Agilent), Proteome Discoverer (Thermo Scientific), or manually annotated peptide data
2. A list of the valid proteins, which have a false discovery rate below a predetermined value. (optional)
3. A peptide confidence score limit which defines high quality identification.
The main output from PQPQ: 1. Cured peptide data. 2. Protein ratios based on cured peptide data including statistics between replicates
and over peptides. 3. Figures of the peptide levels and ratios coupled to each protein. In the figure as
well as in the peptide data output it can be seen which peptides that were included, excluded, or separated into several protein species.
Obtaining PQPQ PQPQ can be downloaded from forshed.se/jenny
System requirements PQPQ version 1 is developed on MATLAB R2010b.1 MATLAB is also is required for running the program. PQPQ is developed to be used on a personal computer. It is recommended to use at least a 2.8 GHz processor and 2 GB RAM. Any computer that can run MATLAB can also run PQPQ.
Installation Save and extract the files in the PQPQ.zip folder into a folder on your computer. Typically: …\MATLAB\work\pqpq
Example data One example data file is distributed with the algorithm: testData2.xlsx. It is a part of the peptide data detected from a clinical sample by MALDI. The data output is hence from Protein Pilot. The Graphical user interface is adjusted to analyze this file. You have to change the path to data folder, choose peptide data format and set the high confidence limit to e.g. 95. Then is should be ready to run.
Data Formats The peptide data file input to PQPQ can be the peptide output file from either Protein Pilot (.txt, .xlsx or .xls), Spectrum Mill (.ssv, .xlsx or .xls), or Proteome discoverer (.xlsx or .xls). It can also be a manually annotated file. The file shall be structured as one row for each peptide and shall include the columns described in Table 1. An example is shown in Figure 1.

Table 1: The required information for PQPQ from different mass spectrometry vendors’ software. Vendors’ name of the columns
Column information
Protein Pilot
Spectrum Mill & manually annotated file
Proteome Discoverer
The protein accession number(s) associated with the peptide
Accessions accession_number Protein Accessions
A value of the peptide identification confidence
Conf Score IonScore or XCorr
The peptide sequence Sequence Sequence Sequence The area of the peptide peaks, one column for each sample (e.g. iTRAQ label), At least four columns shall be included for good statistics. The columns can be given any name.
Area 11X iTRAQ_1XX 11X
The corresponding gene name(s)
Names entry_name
Protein Pilot only: for denoting peptides shared between proteins
Annotation
Proteome Discoverer only: for avoiding redundant quantification info. from two detectors (CID and HCD) in the Orbitrap
Quan Usage

Figure 1: An example of an input data file from Proteome Discoverer. This one is in .xlsx-format
Running PQPQ Start MATLAB Choose “Current Folder” as your PQPQ folder, e.g. C: \MATLAB\work\pqpq, as in Figure 2.
Figure 2: Choose your current folder. In the Command Window of MATLAB, give the command pqpq, : >> pqpq Now the graphical user interface of the program (Figure 3) will appear.

Figure 3: The graphical user interface of PQPQ. Inputs: Path to data folder: Give the full path to the folder where your peptide data is. Peptide data file name(s) (.xlsx .xls .ssv .txt) This is the name(s) of the data file in the above mentioned folder. Include the file extension. If the data is in a specific sheet in an excel file, give the excel file and comma the sheet, e.g. QTOF_Cytosol_peptideExport_25n50ppm_Repl123.xls, Repl1 In case of sample replicates, put the replicates on single rows, e.g. QTOF_Cytosol_peptideExport_25n50ppm_Repl123.xls, Repl1 QTOF_Cytosol_peptideExport_25n50ppm_Repl123.xls, Repl2 Output file name (prefix) (Must always be filled) Only the “filename” is given in this field. This is the filename that will be given your result files as prefix: filename _peptideData.mat

filename _peptideData.xls filename _proteinData.xls filename _proteinIDoverlap.tif filename _statPlot.tif Protein names (.txt) (optional) A data file including the names of the proteins that shall be calculated by PQPQ. The given data file should be in .txt-format an include the protein accession number names exactly as they are given in the peptide data input file.. If this is left empty, all proteins in the peptide file are calculated. Choose peptide data format PQPQ can read peptide summary exported from Proteome Discoverer, Protein Pilot or Spectrum Mill. Manually annotated data shall be in the same format as stated for Spectrum Mill. √ Do peptide selection The peptide data is cured and all valid peptides for each protein are selected, collected, and saved into the files: filename _peptideData.mat filename _peptideData.xls √ Separate multiple protein ID:s This will separate proteins identified as a joint identity, i.e. that wasn’t possible to separate in the database search of the MS/MS data. These identities will then be treated as several entries with the same quantitative information. This can be beneficial if replicates or several samples shall be compared. These can then be concatenated correctly after the analysis of the separate samples. If this box is un-ticked, the joint protein identities will be treated as one. √ do Normalization (to eq. median) This will normalize each sample column so that each column has the same median intensity. The normalization factors for each column are found in the protein and peptide output files. Correlation p-value The p-value limit defines the probability of getting a correlation as large as the observed value by random chance when the true correlation is zero. So, if the p-value limit is set to 0.4 (default), the risk of defining a correlation although there is no, is 40%. As a guideline, in biological studies with heterogenic samples, a p-value limit between 0.4 and 0.1 has shown to work well. How strict you shall be depends on the application. Constructed samples as in the examples in the paper can be analyzed with an even lower p-value limit. Conf. peptide score limit The Conf. peptide score limit defines the score limit for which peptides that are defined as high confident. Different software has different definitions on peptide confidence. For PQPQ, either definition can be used. The preferred score limit has to be determined outside the PQPQ software. One way is to define the limit from MAYU, 2 where the protein false discovery rate (FDR) is determined. From there the

peptide confidence limit can be determined. Another way of defining the score limit is to estimate the FDR of the peptide identification. This is done by identifying the peptide data from the MS run in a forward and reverse database. Since the reverse hits are known to be false discoveries, the FDR of the database search can be calculated.3 The limit can also be set based on recommendation from the data base search. Peptide sum intensity limit The Peptide sum intensity limit is a limit for how low the sum of the ingoing peptides is allowed to be. If the sum over samples for one peptide is below this limit, the peptide is discarded, and not used in the quantification. √ Calculate ratios Tick if you want to calculate ratios This will give the protein data output file: filename_proteinData.xls Numerator and denominator Ratios are calculated for the protein data output. The numerator and denominator for each ratio are given row by row. Both numerator and denominator can be a mean of several samples, the input is then written as “113;114;115”. √ Plot proteins This part of the program plots the information from PQPQ protein by protein. It can be useful to plot selected proteins after the PQPQ data curation. Proteins that turn out to come from more than one species can for example be studied visually by this function. An example is shown in Figure 4. The required fields for plotting only are: * path to data folder * sample names * numerator * denominator * output file name The function will then load the file peptideData_filename.mat. * view plots: The plots will be viewed as MATLAB plots and the user has to press a key to continue and the figure will then automatically be closed. This makes it possible to “scroll” through several figures. * save plots: will save the plots in tif-format in the given folder. * peptide intensities: the peptide intensities will be plotted as bars. * peptide ratios: the peptide ratios will be plotted as bars. Accession numbers The accession numbers of the proteins stat will be plotted one by one. Redundant protein names will be plotted only once. The names have to be equal to the accession numbers in the peptide data file.

Figure 4: The figure output from PQPQ which can be saved as .tif files. The upper one shows the peptide intensities, and the peptide ratios. The lower figure shows ratios related to peptide intensity. The folder name given in the “resultsFolder” field will be created in the “path to data folder”. For all the accession numbers given in the “Accession numbers” field, original quantitative data will be reported in one separate file per accession number. This file includes the peptide sequences, the calculated ratios, and the original intensity values (raw data), Figure 5. If PQPQ has detected several species of the protein, this is given too. This data is useful when investigating the reason why PQPQ has detected several species. If “save plots” is ticked, the generated plots will be saved in this folder too.
0
1
2
3
4
5
6x 10
5P69905 -xxx
all p
eptid
es, i
nten
sity
n126 n127
n128
n129
n130
n131
* * ^ ^
n126
n127
n128
n129
n130
n131
0
20
40
60
80
100
120
cure
d pe
ptid
e ra
tio d
ata
n126
/n12
6n1
27/n
126
n128
/n12
6n1
29/n
126
n130
/n12
6n1
31/n
126
A-vGAHAGEYGAEALER-5.17
A-vGAHAGEYGAEALER-5.55
A-vGAHAGEYGAEALER-2.91
A-vGAHAGEYGAEALER-3.99
A-vGAHAGEYGAEALER-3.54
A-vGAHAGEYGAEALER-3.28
A-vGAHAGEYGAEALER-3.04
A-vGAHAGEYGAEALER-2.91
A-vGAHAGEYGAEALER-2.82
n126/n126
n127/n126
n128/n126
n129/n126
n130/n126
n131/n126
0 5 10
x 105
-1
0
1
2
3
4
5
6
7n126/n126
sum of peptide intensities
log2
(pep
tide
ratio
)
0 5 10
x 105
-1
0
1
2
3
4
5
6
7n127/n126
0 5 10
x 105
-1
0
1
2
3
4
5
6
7n128/n126
o = peptide, grey = included in the quantitative calculations, black = model peptide
P69
905
-xxx
0 5 10
x 105
-1
0
1
2
3
4
5
6
7n129/n126
0 5 10
x 105
-1
0
1
2
3
4
5
6
7n130/n126
0 5 10
x 105
-1
0
1
2
3
4
5
6
7n131/n126
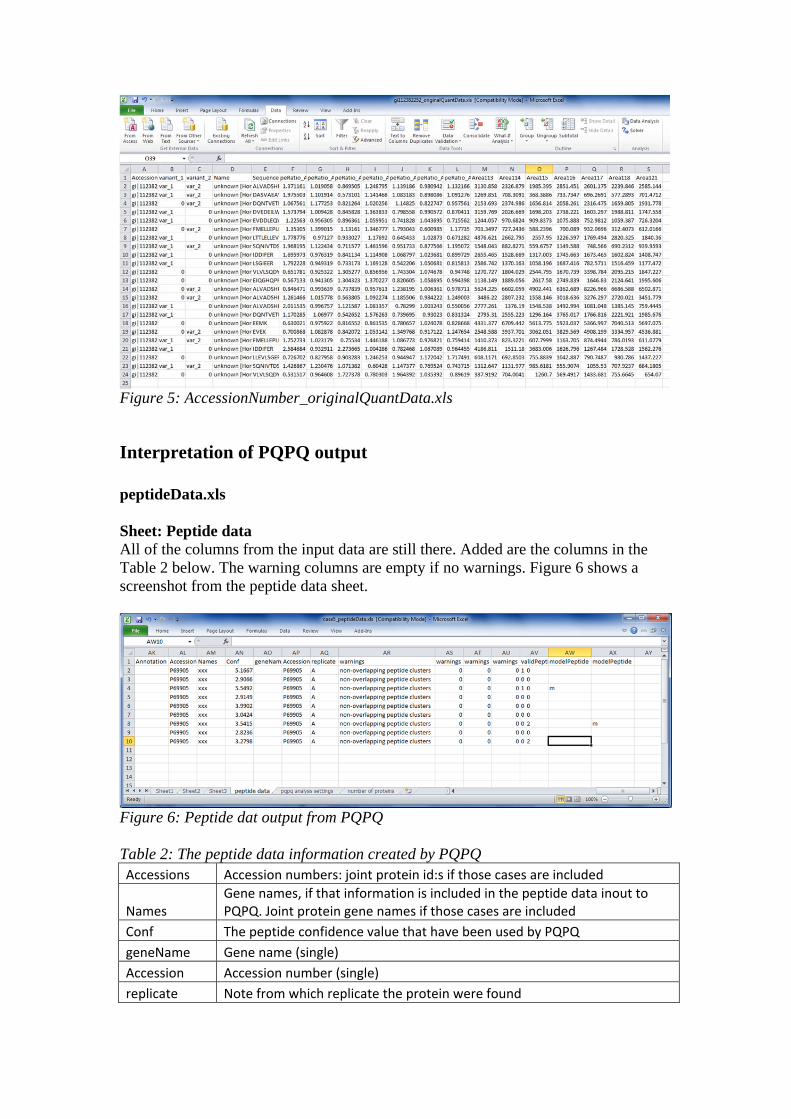
Figure 5: AccessionNumber_originalQuantData.xls
Interpretation of PQPQ output peptideData.xls Sheet: Peptide data All of the columns from the input data are still there. Added are the columns in the Table 2 below. The warning columns are empty if no warnings. Figure 6 shows a screenshot from the peptide data sheet.
Figure 6: Peptide dat output from PQPQ Table 2: The peptide data information created by PQPQ Accessions Accession numbers: joint protein id:s if those cases are included
Names Gene names, if that information is included in the peptide data inout to PQPQ. Joint protein gene names if those cases are included
Conf The peptide confidence value that have been used by PQPQ
geneName Gene name (single)
Accession Accession number (single)
replicate Note from which replicate the protein were found

warnings
‘non‐overlapping peptide clusters’ ‘overlapping peptide clusters’ If clusters among the peptide data are detected, and different protein species are suspected, this will be noted by these “warnings”.
warnings
'peptide conf too low to support protein ID or pept don t corr' The peptide confidence is below the set limit, and the peptide do not correlate with a high confident peptide, and is hence excluded from the calculations.
warnings
'protein supported by < 2 peptides' The protein identity is supported by only one protein and the protein quantities are not calculated because of that
warnings
'protein supported by > 300 peptides' The protein is supported by more than 300 peptides. Due to heavy calculations, the 300 most confident peptides are selected for protein quantification. We have estimated this to be a well enough number of peptides for defining the protein quantity.
validPeptide
This column notes with a matrix which peptides that are valid for being included in the quantification. Different columns define different protein variants. This information is used in the protein ratio calculation in the next step.
modelPeptide
M denotes the selected model peptide, one column for each cluster/specie/protein variant. This information is also used in the plots and the protein quantification.
Sheet: pqpq analysis settings The pqpq analysis settings are noted in a separate sheet. This sheet is an help to remember the PQPQ settings. Also the normalization factors from the normalization of each sample in order are given, Figure 7.

Figure 7: The sheet: pqpq analysis settings Sheet: number of proteins This sheet save the numbers of how many accessions that were imported, how many were left after eliminating redundant proteins, how many proteins we have when the multiple protein entries were separated, and so on, according to the information in the sheet. An example is seen in Figure 8. Not all notes are applicable in all PQPQ runs.
Figure 8: the “number of proteins”-sheet of the peptide data output from PQPQ

proteinData.xls The protein data output includes two sheets, “pqpq analysis settings” as described above, but now also including numerator and denominator settings. The other sheet is the protein data. This is the main output from PQPQ and includes: warnings As described in Table 2
geneName As described in Table 2
Accession
As described in Table 2. If several species of the proteins is detected by PQPQ, these will get a unique entry and quantification. The Accession will then be named Accession_VarX, where X denotes 2, 3, 4 etc. Variant 1 will have the original Accession number.
proteinRatio_XXX_YYY The ratio XXX/YYY as a mean from the by PQPQ selected peptide ratios associated to the protein.
std_XXX_YYY
The standard deviation on the protein ratio XXX/YYY calculated from the by PQPQ selected peptide ratios associated to the protein.
pVal_XXX_YYY
The probability of the protein ratio XXX/YYY being 1, based on the variation and number of ingoing peptides (selected by PQPQ)
number_of_peptides_for_quant The number of peptides selected by PQPQ to be valid for protein ratio calculation
newN A unique notation for each protein (can be useful when fusing data from different studies)
Figure 9: An example of the protein data output, protein data sheet, from PQPQ.

Technical details of PQPQ The technical details of the software application are found in the paper Enhanced information output from shotgun proteomics data in Protein Quantification by Peptide Quality control (PQPQ). Figure 10 is a simplified scheme of the main functions in the software application PQPQ.
Figure 10: A simplified scheme over the functions in pqpq
FAQ OUT OF MEMORY If the error message …”OUT OF MEMORY” appears. Try to restart MATLAB to free some memory space…
References 1. MATLAB (The MathWorks Inc., Natick, MA, 2010). 2. L. Reiter, M. Claassen, S. P. Schrimpf et al., Molecular & Cellular Proteomics 8 (11), 2405 (2009). 3. J. E. Elias and S. P. Gygi, Nature Methods 4 (3), 207 (2007).
output pqpq.m
peptideSelection.m (select valid ratios)
readAndSortPeptideData.m
readData.m
extractPeptideNotShared.m (Protein Pilot)
extractPeptidesUsed.m (Proteome Discoverer)
sortDataByProtein.m (if separate Multiple Protein ID)
eliminateLowQdata.m
plotVennDiagram.m(if replicates)
normalizeData2.m
organizeData.m
peptideData <= selectPeptideData.m selectCorrelatingPeptides2.m
calcProteinData.m (calculate ratios)
calculateRatiosN
calculateProteinRatiosN.m
proteinData replicate plots
<=
plotReplicateResults.m
plotRatioData.m (plots data)
plotPeptideData.m plots <=