powerpoint presentation · global deals peak in 2018, decline in 1h-2019 global vc, pe, and ma deal...
TRANSCRIPT

Fintech DecodedA biannual report tracking investment activity in Fintech companies
1H-2019

CONTENTS
01 GLOBAL
Global Fintech deals peak in 2018, decline in 1H-2019
Steep drop in early stage deal volume; deal activity resilient in late-stage VC
Median deal sizes continue to grow
02 AMERICAS
North America continues to witness surge in VC funding
Marginal decrease in median deal sizes
Mega deals boost funding in Lending and Payments
03 EUROPE
Fintech funding in Europe on track to reach record high in 2019
Lending, Insurance, and Business Solutions deals grow in value, but shrink in volume
Better funding activity in Payments and Financial Markets in 1H-2019 after slump in 2018
04 ASIA
VC funding deal activity drops to lowest level since 2014
Deal activity declines across stages, but most in early stage
All major Fintech verticals witness steep decline in funding

Executive Summary
Overall the VC funding activity in the Fintech sector has increased from $7.5 billion in 1H-2017 reaching
$11.1 billion in 1H-2019. Payments segment which has been the most significant contributor to Fintech
universe is showing signs of maturity as the late stage companies are attracting bulk of the funding.
Companies such as Margeta, N26 and Chime have each raised over $200 million in funding. Interestingly,
UK based start-up, Checout.com, raised $230 million in Series A funding at $2 billion post-money valuation
for expansion of Payments services in Latin America and Asia.
On the other hand, ‘financial markets’ vertical (companies focused on developing solutions for capital
market participants) has attracted majority of the funding in the early stages. Interestingly, Carta, raised
$300 million to build a stock market for private companies.
The funding activity in the technology enabled lending space has been declining Q-o-Q due to the
tightening of regulations in emerging markets such as China (world’s largest P2P lending market) where
the government has taken an initiative to crackdown P2P lending companies after the recent defaults.
However, the student lending platforms continue to attract VC funding. Companies such as SoFi and
Affirm have recently raised $500 million and $300 million respectively and are planning to offer wealth
management services to their borrowers.
Challenger banks and Neo-banks have prominently been on the investor’s radar due to their innovative
service delivery models. The funding is still at a nascent stage as regulations are shaping up. The concept
of branchless banking has sprung across the globe and we are seeing companies targeting banked and
unbanked customers offering product and service customization. These businesses are focused, providing
a step beyond the current banking system by leveraging technology to reduce operating costs, improve
service quality, and expand the customer reach.
Welcome to the first edition of Aranca’s
‘Fintech Decoded’ report, a bi-annual
publication where we highlight some major
trends in VC funding within broader
Fintech universe across key markets in
first half of 2019.
The outlook for the Fintech space
continues to be highly positive with the
rapid innovation in payments and
transformation in digital banking arena.
With increased regulatory pressure, deal
activity in first half of 2019 indicates
investors have become cautious in funding
businesses in sectors like lending and
crypto currency That said, astute investors
continue to back innovative companies
catering to targeted customer segments or
expanding into untapped geographies.
We hope you will find this edition an
interesting and informative read.

Fintech
In 1H-2019, investment
in Fintech companies
globally clocked
$38.8Bacross
688 deals

Global deals peak in 2018, decline in 1H-2019
Global VC, PE, and MA deal landscape in Fintech companies
57.4
96.8
76.2 71.1
141.0
38.8
39
1,206
1,491 1,503
1,6341,712
688
1,376
2014 2015 2016 2017 2018 2019*
Capital Invested ($B) Projected 2H19 Deal Count Projected 2019
January 01, 2014 – June 30, 2019
After a smashing 2018, which witnessed a
record number of mega deals ($100M+)
and super-size deals ($1B+), investment
activity (PE, VC, and M&A) in the global
Fintech landscape for 1H-2019 declined,
but remains higher than 2017 in terms of
the aggregate deal value. 1H-2019
registered the lowest number of deals
since 2014, yet median deal values
continue to surge, indicating a fairly strong
undercurrent for consolidation and maturity
in certain key segments
Currency in US$, unless specified
Data Source: Pitch Book, unless specified otherwise
Note: Please refer to the Methodology section at the end of the report to understand the Fintech universe and its constituents as defined
from perspective of this report as well as data analysis approach and 2019* calculation

Fintech
In 1H-2019, VC Funding
in Fintech companies
globally clocked
$11.1Bacross
603 deals

Consistent drop in deal volume; deal sizes continue
to grow
Global VC funding in Fintech companies
2.2 2.2 1.6 3.3 2.84.7
8.9
3.04.4
8.54.5
3.2 3.25.2 4.4 6.3 5.9
6.7
6.25.0 5.0 6.1
14
272 236 256 264 296 306 338 307 334 333293 306
356 332 330 347 379 396335 311 321
282
Q1 Q2 Q3 Q4 Q1 Q2 Q3 Q4 Q1 Q2 Q3 Q4 Q1 Q2 Q3 Q4 Q1 Q2 Q3 Q4 Q1 Q2
2014 2015 2016 2017 2018 2019
Capital Invested ($B) Ant Financial Deal Count
January 01, 2014 – June 30, 2019
1.5 1.81.3
2.0 2.2 2.0 2.2 1.9 2.2 2.02.5 2.2 2.1 2.5
3.2 3.03.9
4.8 4.9 4.7
3.5
5.0
Q1 Q2 Q3 Q4 Q1 Q2 Q3 Q4 Q1 Q2 Q3 Q4 Q1 Q2 Q3 Q4 Q1 Q2 Q3 Q4 Q1 Q2
2014 2015 2016 2017 2018 2019
Median Deal Size ($M)
Considering the last five quarters, the
number of VC-backed funding deals
declined for the fourth time in 2Q-2019 to
282 deals; a fall of 29% from the peak
value in Q1-2018. On the other hand,
median deal size trends continued to rise,
reaching $5.0M in 2Q-2019, more than
doubling from $2.2M just ten quarters ago.
Discounting the super-mega Ant Financial
deal, if the funding activity in terms of the
overall deal value in 1H-2019 holds for the
second half of the year, it is likely to be
another robust year for Fintech globally.
Data Source: Pitch Book, unless specified otherwise
Note: Please refer to the Methodology section at the end of the report to understand the Fintech universe and its constituents as defined
from perspective of this report as well as data analysis approach
Currency in US$, unless specified

0.81.0
1.3 1.21.6
0.5
0.5
2014 2015 2016 2017 2018 2019
3.25.6
7.7 8.210.3
3.6
3.6
2014 2015 2016 2017 2018 2019
5.3
12.6 11.7 9.7
26.0
7.1
7.1
2014 2015 2016 2017 2018 2019
426
503576 581
542504
213
2014 2015 2016 2017 2018 2019
512
366
477 482
577 648
256
2014 2015 2016 2017 2018 2019
269 268
159
194 203
246269
134
2014 2015 2016 2017 2018 2019
Steep drop in early stage; deal activity resilient in
late-stage VC
Global VC funding in Fintech companies January 01, 2014 – June 30, 2019
Decline in the angel/seed and early stage
VC funding in the 1H-2019 was too steep
to be considered a part of the usual
volatility in deal activity. Early-stage
funding activity in Fintech in 2Q-2019 has
been the lowest in the last eight quarters,
in terms of overall funding and the number
of deals. Late-stage deal activity continues
to remain strong as the number of mega
deals (>$100M) reached 26 in 1H-2019
alone, compared with 36 in entire 2018. In
fact, if this trend sustains, ignoring the Ant
Financial deal outlier, 2019 is likely to be
the best year for late-stage VC funding in
Fintech. These two trends arguably
indicate early signs of maturity. We believe
a huge untapped market potentially still
exists in Asia, particularly in India.
Capital Invested ($B) Projected 2H19 Deal Count ($M) Projected 2019
Angel/Seed Early Stage VC Later Stage VC
* * *
***
Currency in US$, unless specified
Data Source: Pitch Book, unless specified otherwise
Note: Please refer to the Methodology section at the end of the report to understand the Fintech universe and its constituents as defined
from perspective of this report as well as data analysis approach and 2019* calculation

Median deal sizes continue to grow
Global VC funding median deal size by funding stage
0.6 1.0 1.0 1.3 1.5 1.5
13.6
20.5
13.813.1
20.019.0
4.0 4.2 4.5 4.5
7.45.9
2014 2015 2016 2017 2018 2019
Angel/Seed Later Stage VC Early Stage VC
January 01, 2014 – June 30, 2019
Currency in US$, unless specified
Data Source: Pitch Book, unless specified otherwise
Note: Please refer to the Methodology section at the end of the report to understand the Fintech universe and its constituents as defined from perspective of this report as well as data analysis approach

Top 10 Global VC Funding Deals in Fintech
Top 10 VC funding deals in Fintech, Global
S.no Region Name VerticalsDeal
Size ($M)Key Investors
Post Money Valuation
($ B)
1 US SoFi Lending 500 Manhattan Venture Partners, Next Ventures 4.80
2 Germany N26 Payments 300Government of Singapore Investment Corporation,
Insight Partners3.50
3 US Affirm Lending 300 Baillie Gifford, Fidelity Management & Research 3.00
4 US Lemonade Insurance 300 OurCrowd, Annox Capital 2.10
5 US Carta Financial Markets 300 Alumni Ventures Group, Andreessen Horowitz 1.70
6 US Marqeta Payments 260 Coatue Management, Geodesic Capital 1.89
7 UK Checkout.com Payments 230 Blossom Capital, DST Global 2.00
8 US Chime Bank Payments 200 Coatue Management, Dragoneer Investment Group 1.30
9 Brazil Creditas Lending 200 SoftBank Group, Amadeus Capital Partners 0.73
10 US Divvy Business Solutions 200 New Enterprise Associates, Insight Partners 0.80
January 01, 2019 - June 30, 2019
Data Source: Pitch Book, unless specified otherwise
Note: Please refer to the Methodology section at the end of the report to understand the Fintech universe and its constituents as defined from perspective of this report as well as data analysis approach

6.1
9.68.1 7.7
13.7
6.8
6.8
2014 2015 2016 2017 2018 2019
1.4 6.810.5
7.2 6.1
1.2
14
1.2
2014 2015 2016 2017 2018 2019
1.62.4
1.7
3.8 3.5 3.0
3.0
2014 2015 2016 2017 2018 2019
831760
624675
616685
380
2014 2015 2016 2017 2018 2019
238
104
114
212 215201
238
52
2014 2015 2016 2017 2018 2019
287320
252294
363413
287
160
2014 2015 2016 2017 2018 2019
VC Funding: Europe completes strongest half year;
numbers plummet in Asia
Global VC funding (# of deals) in Fintech companiesJanuary 01, 2014 – June 30, 2019
Fintech VC funding in Europe is likely to
see the best year based on the robust deal
activity in 1H-2019. 1H-2019 witnessed
seven mega deals ($100 M+), the same as
those in the entire year in 2018. While
growth is seen across all stages, late-
stage VC funding in European Fintech
companies in the first six months of 2019
has already surpassed the entire amount
recorded in 2018, with the median deal
size reaching its highest peak. Fintech deal
activity in 1H-2019 in North America
continues to remain strong, with an
increase in late stage and a corresponding
decrease in early stage. Turmoil in China’s
P2P lending space dragged down the
overall Fintech funding in Asia to its lowest
since 2015.
Americas Asia Europe
Capital Invested ($B) Projected 2H19 Deal Count ($M) Projected 2019 Ant Financial ($B)
* * *
* * *
Currency in US$, unless specified
Data Source: Pitch Book, unless specified otherwise
Note: Please refer to the Methodology section at the end of the report to understand the Fintech universe and its constituents as defined
from perspective of this report as well as data analysis approach and 2019* calculation

In 1H-2019, VC Funding
in Fintech companies in
North America clocked
$6.5Bacross
369 dealsFintech
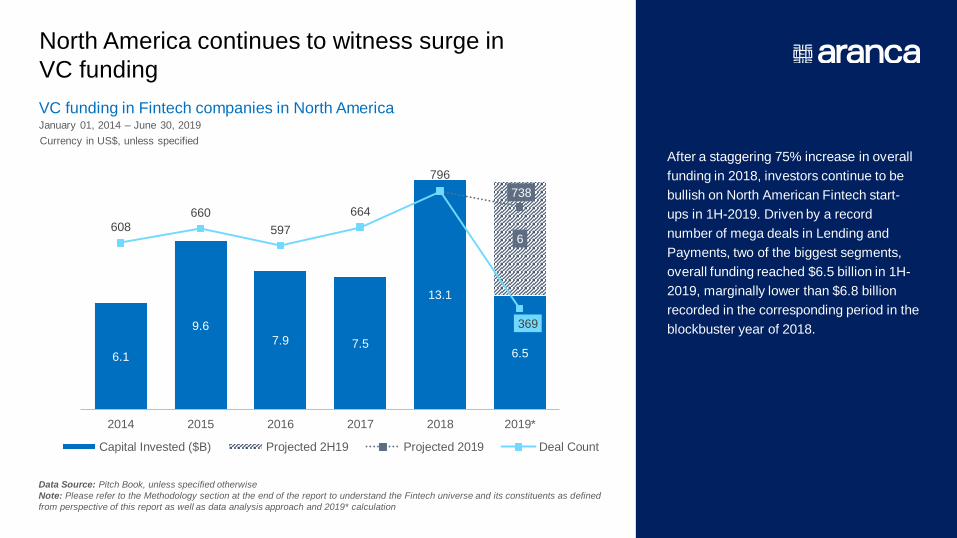
North America continues to witness surge in
VC funding
VC funding in Fintech companies in North America
6.1
9.6
7.9 7.5
13.1
6.5
6
738
608
660
597
664
796
369
2014 2015 2016 2017 2018 2019*
Capital Invested ($B) Projected 2H19 Projected 2019 Deal Count
January 01, 2014 – June 30, 2019
After a staggering 75% increase in overall
funding in 2018, investors continue to be
bullish on North American Fintech start-
ups in 1H-2019. Driven by a record
number of mega deals in Lending and
Payments, two of the biggest segments,
overall funding reached $6.5 billion in 1H-
2019, marginally lower than $6.8 billion
recorded in the corresponding period in the
blockbuster year of 2018.
Currency in US$, unless specified
Data Source: Pitch Book, unless specified otherwise
Note: Please refer to the Methodology section at the end of the report to understand the Fintech universe and its constituents as defined
from perspective of this report as well as data analysis approach and 2019* calculation
304305 320280 295 322
152
2014 2015 2016 2017 2018 2019
280
189221
202242
334
140
2014 2015 2016 2017 2018 2019
140154
114 119 115127
140
77
2014 2015 2016 2017 2018 2019
0.5 0.6 0.6 0.7
1.0
0.3
0.3
2014 2015 2016 2017 2018 2019
1.42.6 3.1 2.6
5.5
1.9
1.9
2014 2015 2016 2017 2018 2019
4.16.3
4.2 4.3
6.6
4.2
4.2
2014 2015 2016 2017 2018 2019
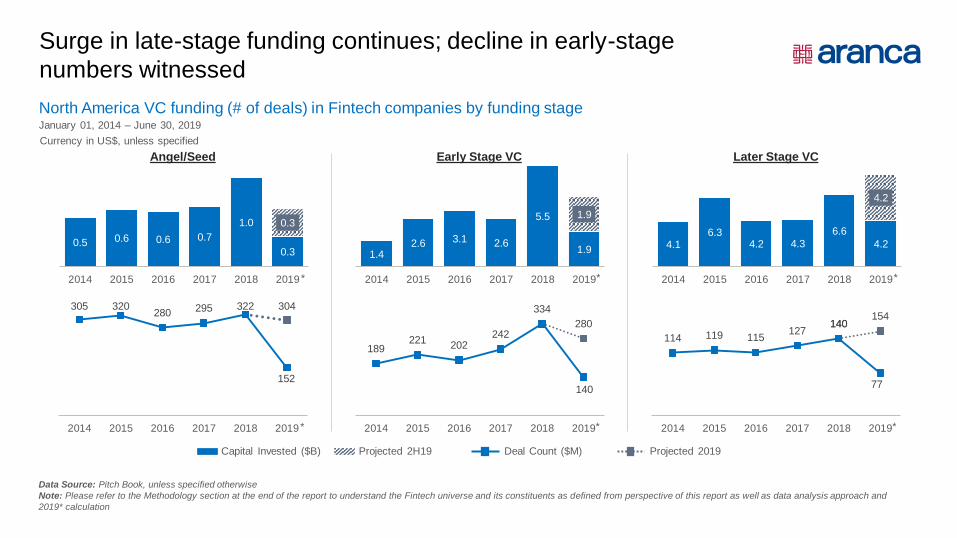
Surge in late-stage funding continues; decline in early-stage
numbers witnessed
North America VC funding (# of deals) in Fintech companies by funding stageJanuary 01, 2014 – June 30, 2019
Angel/Seed Early Stage VC Later Stage VC
Capital Invested ($B) Projected 2H19 Deal Count ($M) Projected 2019
* * *
* * *
Currency in US$, unless specified
Data Source: Pitch Book, unless specified otherwise
Note: Please refer to the Methodology section at the end of the report to understand the Fintech universe and its constituents as defined from perspective of this report as well as data analysis approach and
2019* calculation

Marginal decrease in median deal sizes
North America VC funding median deal size by funding stage
0.8 1.3 1.1 1.5 1.6 1.5
3.5
5.36.0 6.0
9.0
7.0
16.5
21.0
15.014.0
20.0
16.5
2014 2015 2016 2017 2018 2019
Angel/Seed Early Stage VC Later Stage VC
January 01, 2014 – June 30, 2019
Currency in US$, unless specified
Data Source: Pitch Book, unless specified otherwise
Note: Please refer to the Methodology section at the end of the report to understand the Fintech universe and its constituents as defined from perspective of this report as well as data analysis approach
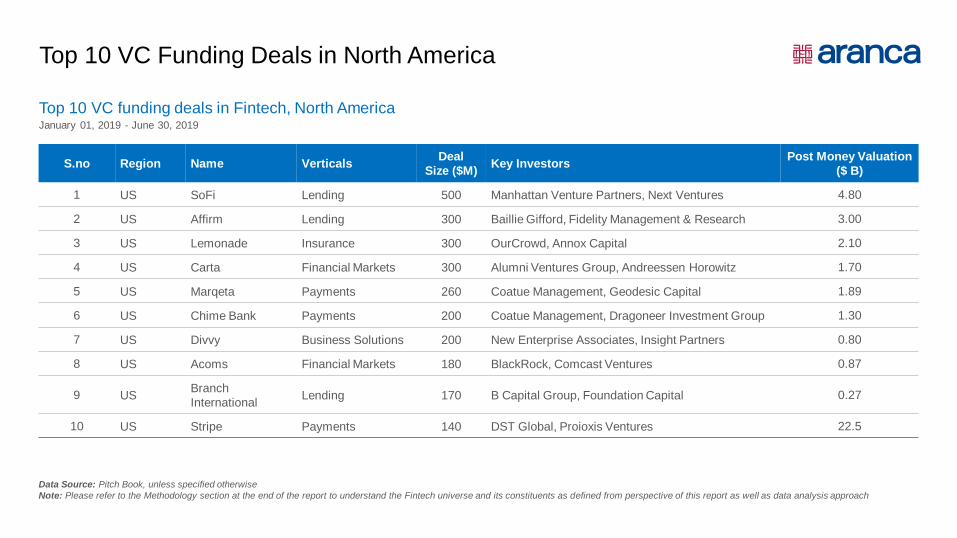
Top 10 VC Funding Deals in North America
Top 10 VC funding deals in Fintech, North AmericaJanuary 01, 2019 - June 30, 2019
Data Source: Pitch Book, unless specified otherwise
Note: Please refer to the Methodology section at the end of the report to understand the Fintech universe and its constituents as defined from perspective of this report as well as data analysis approach
S.no Region Name VerticalsDeal
Size ($M)Key Investors
Post Money Valuation
($ B)
1 US SoFi Lending 500 Manhattan Venture Partners, Next Ventures 4.80
2 US Affirm Lending 300 Baillie Gifford, Fidelity Management & Research 3.00
3 US Lemonade Insurance 300 OurCrowd, Annox Capital 2.10
4 US Carta Financial Markets 300 Alumni Ventures Group, Andreessen Horowitz 1.70
5 US Marqeta Payments 260 Coatue Management, Geodesic Capital 1.89
6 US Chime Bank Payments 200 Coatue Management, Dragoneer Investment Group 1.30
7 US Divvy Business Solutions 200 New Enterprise Associates, Insight Partners 0.80
8 US Acoms Financial Markets 180 BlackRock, Comcast Ventures 0.87
9 USBranch
InternationalLending 170 B Capital Group, Foundation Capital 0.27
10 US Stripe Payments 140 DST Global, Proioxis Ventures 22.5

1.4
3.4
2.2 2.21.8 1.7
1.7
2014 2015 2016 2017 2018 2019
110 116106
125
99 97
58
2014 2015 2016 2017 2018 2019
1.2 0.91.3 1.3
2.01.4
1.4
2014 2015 2016 2017 2018 2019
111130
122113
102
122111
65
2014 2015 2016 2017 2018 2019
Mega deals boost funding in Lending and Payments
North America VC funding, Fintech - Lending and PaymentsJanuary 01, 2014 – June 30, 2019
While the total number of deals in Lending
did not increase drastically, a steep fall has
been witnessed in the Early Stage, with a
corresponding increase in the Late Stage.
Furthermore, the size of the mega rounds
keeps growing as the top four deals
contributed $1.10 billion of the $1.66 billion
funding in 1H-2019. A similar trend can be
observed in VC funding in Payments,
wherein six mega deals contributed $0.90
billion of the $1.45 billion received from 65
deals. Investors continued to be bullish on
North American Fintech start-ups in 1H-
2019.
Capital Invested ($B) Projected 2H19 Deal Count ($M) Projected 2019
Lending
Payments
*
* *
*
Currency in US$, unless specified
Data Source: Pitch Book, unless specified otherwise
Note: Please refer to the Methodology section at the end of the report to understand the Fintech universe and its constituents as defined
from perspective of this report as well as data analysis approach and 2019* calculation

Surge in Regtech VC funding: 2019 slated to be best year
North America VC funding, Fintech – Regtech
0.20.1
0.20.1
0.2 0.2
0.2
2014 2015 2016 2017 2018 2019
January 01, 2014 – June 30, 2019
25
36
16 1822
25 25
18
2014 2015 2016 2017 2018 2019
*
*
Currency in US$, unless specified
Data Source: Pitch Book, unless specified otherwise
Note: Please refer to the Methodology section at the end of the report to understand the Fintech universe and its constituents as defined from perspective of this report as well as data analysis approach and
2019* calculation
Capital Invested ($B) Projected 2H19 Deal Count ($M) Projected 2019

0.30.7
1.10.7
1.8
0.6
0.6
2014 2015 2016 2017 2018 2019
1.2
2.0
1.2 1.2
2.0
0.7
0.7
2014 2015 2016 2017 2018 2019
69
52
28
55 58
74 69
26
2014 2015 2016 2017 2018 2019
107 10692 92
86
102 107
53
2014 2015 2016 2017 2018 2019
Significant slowdown witnessed in funding in Insurance Tech
and Business Solutions
North America VC funding, Fintech – Insurance and Business SolutionsJanuary 01, 2014 – June 30, 2019
Insurance Business Solutions
Capital Invested ($B) Projected 2H19 Deal Count ($M) Projected 2019
*
*
*
*
Currency in US$, unless specified
Data Source: Pitch Book, unless specified otherwise
Note: Please refer to the Methodology section at the end of the report to understand the Fintech universe and its constituents as defined from perspective of this report as well as data analysis approach and
2019* calculation

In 1H-2019, VC Funding
in Fintech companies in
Europe clocked
$3.0Bacross
160 dealsFintech

Fintech funding in Europe to reach record high
in 2019
VC funding in Fintech companies in Europe
1.6
2.41.7
3.8 3.53.0
3.0
320
252
294
363413
287
160
2014 2015 2016 2017 2018 2019*
Capital Invested ($B) Projected 2H19 Projected 2H19 Deal Count
January 01, 2014 – June 30, 2019
Europe is witnessing staggering growth in
VC funding in Fintech, and 2019 may as
well be a blockbuster year based on robust
1H deal activity. While seven mega deals
($100M+) were registered in the first six
months, compared with the same number
recorded in the entire year in 2018, growth
is much more broad based, encompassing
all Fintech verticals and funding stages.
Median deal sizes have grown four times
since 2014, to around $4 million in 1H-
2019.
Currency in US$, unless specified
Data Source: Pitch Book, unless specified otherwise
Note: Please refer to the Methodology section at the end of the report to understand the Fintech universe and its constituents as defined
from perspective of this report as well as data analysis approach and 2019* calculation

96
124143
169157
96
48
2014 2015 2016 2017 2018 2019
152
101121
159
195
133
76
2014 2015 2016 2017 2018 2019
58
72
27 3035
61 58
36
2014 2015 2016 2017 2018 2019
0.10.2
0.40.3
0.2
0.1
0.1
2014 2015 2016 2017 2018 2019
0.71.1
0.81.3
1.7
1.0
1.0
2014 2015 2016 2017 2018 2019
0.8 1.20.5
2.21.6 1.9
1.9
2014 2015 2016 2017 2018 2019
Late-stage funding witnessed explosive growth in 1H-2019
Europe VC funding (# of deals) in Fintech companies by funding stageJanuary 01, 2014 – June 30, 2019
Angel/Seed Early Stage VC Later Stage VC
Capital Invested ($B) Projected 2H19 Deal Count ($M) Projected 2019
*
*
*
*
*
*
Currency in US$, unless specified
Data Source: Pitch Book, unless specified otherwise
Note: Please refer to the Methodology section at the end of the report to understand the Fintech universe and its constituents as defined from perspective of this report as well as data analysis approach and
2019* calculation

Median deal sizes in late-stage companies peak at record levels
Europe VC funding median deal size by funding stage
0.5 0.7 0.8 1.21.4 1.2
2.5 2.5 2.2 2.6
4.9 4.8
9.1
15.7
9.0
11.5 11.4
19.0
2014 2015 2016 2017 2018 2019
Angel/Seed Early Stage VC Later Stage VC
January 01, 2014 – June 30, 2019
Data Source: Pitch Book, unless specified otherwise
Note: Please refer to the Methodology section at the end of the report to understand the Fintech universe and its constituents as defined from perspective of this report as well as data analysis approach

Top 10 VC Funding Deals in Europe
Top 10 VC funding deals in Fintech, EuropeJanuary 01, 2019 - June 30, 2019
Data Source: Pitch Book, unless specified otherwise
Note: Please refer to the Methodology section at the end of the report to understand the Fintech universe and its constituents as defined from perspective of this report as well as data analysis approach
S.no Region Name VerticalsDeal
Size ($M)Key Investors
Post Money Valuation
($ B)
1 Germany N26 Payments 300Government of Singapore Investment Corporation,
Insight Partners3.50
2 U.K. Checkout.com Payments 230 Blossom Capital, DST Global 2.00
3 U.K. Iwoca Lending 196 Augmentum (London), Intesa Sanpaolo 0.10
4 Sweden Lendify Lending 160 Insight Investment, Anders Borg 0.09
5 U.K. Monzo Personal Finance 147 Latitude, Y Combinator 2.33
6 Germany Wefox Insurance 125 CreditEase, Mubadala Investment Company -
7 Germany Raisin Lending 117Goldman Sachs Principal Strategic Investments,
Orange Digital Ventures0.78
8 U.K. Starling Bank Payments 98 Merian Chrysalis Investment, Merian Global Investors 0.17
9 France PayFit Business Solutions 82 Bpifrance, Eurazeo -
10 U.K. GoCardless Payments 76 National Grid Partners, Adams Street Partners -

36 38
20
37
47 46
19
2014 2015 2016 2017 2018 2019
34
34
1116
28
44
34
17
2014 2015 2016 2017 2018 2019
4640
6166 75
65
46
20
2014 2015 2016 2017 2018 2019
0.1 0.10.2
0.30.4 0.3
0.3
2014 2015 2016 2017 2018 2019
0.0 0.00.1
0.40.5
0.4
0.4
2014 2015 2016 2017 2018 2019
0.3
1.4
0.5
1.0
0.50.7
0.7
2014 2015 2016 2017 2018 2019
Lending, Insurance, and Business Solutions deals grow in
value, but shrink in volume
Europe VC funding, Fintech – Lending, Insurance and Business Solutions January 01, 2014 – June 30, 2019
Capital Invested ($B) Projected 2H19 Deal Count ($M) Projected 2019
*
*
*
*
*
*
Currency in US$, unless specified
Business Solutions Insurance Lending
Data Source: Pitch Book, unless specified otherwise
Note: Please refer to the Methodology section at the end of the report to understand the Fintech universe and its constituents as defined from perspective of this report as well as data analysis approach and
2019* calculation

0.2 0.2 0.2
0.3 0.30.3
0.3
2014 2015 2016 2017 2018 2019
0.80.6
0.4
1.20.9 0.9
0.9
2014 2015 2016 2017 2018 2019
37
60
38
50
59 65
3730
2014 2015 2016 2017 2018 2019
51
6864 66 69 75
51
34
2014 2015 2016 2017 2018 2019
Better funding activity in Payments and Financial Markets in
1H-2019 after slump in 2018
Europe VC funding, Fintech – Financial Markets and Payments January 01, 2014 – June 30, 2019
Financial Markets Payments
Capital Invested ($B) Projected 2H19 Deal Count ($M) Projected 2019
* *
* *
Currency in US$, unless specified
Data Source: Pitch Book, unless specified otherwise
Note: Please refer to the Methodology section at the end of the report to understand the Fintech universe and its constituents as defined from perspective of this report as well as data analysis approach and
2019* calculation

In 1H-2019, VC Funding
in Fintech companies in
Asia clocked
$1.2Bacross
52 dealsFintech

VC funding deal activity drops to lowest level
since 2014
VC funding in Fintech companies in Asia
1.4
6.8
10.5
7.26.1
1.2
14.0
1.2
104
114
212 215201
237
52
2014 2015 2016 2017 2018 2019*
January 01, 2014 – June 30, 2019
Sharp decline in funding in Asian Fintech
companies was witnessed in 1H-2019 in
the key markets of China and India as the
number of deals plummeted. Turmoil in
China’s P2P lending vertical amid
tightening regulatory norms hit funding
activity across early-stage and late-stage
segments. After a record number of deals
in 2018, India witnessed a plunge in the
number of Fintech deals. The only silver
lining was continued growth in median deal
sizes. It would be interesting to see
whether deal activity rebounds in the
coming quarters.
Capital Invested ($B) Projected 2H19 Deal Count ($M) Projected 2019 Ant Financial ($B)
Currency in US$, unless specified
Data Source: Pitch Book, unless specified otherwise
Note: Please refer to the Methodology section at the end of the report to understand the Fintech universe and its constituents as defined
from perspective of this report as well as data analysis approach and 2019* calculation

16
46
74
87
5863
8
2014 2015 2016 2017 2018 2019
6055
10089
99
121
30
2014 2015 2016 2017 2018 2019
54
28
13
38 3944
54
14
2014 2015 2016 2017 2018 2019
0.20.2
0.20.1
0.3
0.1
0.1
2014 2015 2016 2017 2018 2019
1.01.7
3.7 4.0
2.4
0.50.5
2014 2015 2016 2017 2018 2019
0.3 4.86.7
3.1 3.30.6
14.0
0.6
2014 2015 2016 2017 2018 2019
Deal activity declines across stages, but most in early stage
Asia VC funding (# of deals) in Fintech companies by funding stageJanuary 01, 2014 – June 30, 2019
Angel Seeds Early Stage VC Later Stage VC
*
*
*
*
*
*
Capital Invested ($B) Projected 2H19 Deal Count ($M) Projected 2019 Ant Financial ($B)
Currency in US$, unless specified
Data Source: Pitch Book, unless specified otherwise
Note: Please refer to the Methodology section at the end of the report to understand the Fintech universe and its constituents as defined from perspective of this report as well as data analysis approach and
2019* calculation

Median deal sizes witness sharp decline from peak in 2018
Asia VC funding median deal size by funding stage
0.7 1.0 1.0 1.01.5
2.8
10.0
5.0
7.35.6
10.0
5.5
10.0
30.8
15.0
20.8
37.7
27.8
2014 2015 2016 2017 2018 2019
Angel/Seed Early Stage VC Later Stage VC
January 01, 2014 – June 30, 2019
Currency in US$, unless specified
Data Source: Pitch Book, unless specified otherwise
Note: Please refer to the Methodology section at the end of the report to understand the Fintech universe and its constituents as defined from perspective of this report as well as data analysis approach

Top 10 Global VC Funding Deals in Asia
Top 10 VC funding deals in Fintech, AsiaJanuary 01, 2019 - June 30, 2019
Data Source: Pitch Book, unless specified otherwise
Note: Please refer to the Methodology section at the end of the report to understand the Fintech universe and its constituents as defined from perspective of this report as well as data analysis approach
S.no Region Name VerticalsDeal
Size ($M)Key Investors
Post Money Valuation
($ B)
1 China Momo (Application Software) Payments 100Warburg Pincus, Goldman Sachs Merchant Banking
Division-
2 ChinaShanghai Dianrong Financial
Information ServicesLending 100 Affirma Capital, Dalian Finance Industry Investment Group -
3 Indonesia Akulaku Business Solutions 100 Ant Financial, Blue Sky Alternative Investments 0.45
4 China Wiseco Technology Lending 95 China Growth Capital, Green Pine Capital Partners -
5 India InCred Finance Lending 83 - -
6 Singapore GoBear Lending 80 Aegon, Walvis Group -
7 China Shuidichou Lending 74 Yuri Milner, Dianping.com -
8 India Acko General Insurance Insurance 65 Intact Ventures, RPS Ventures 0.30
9 China BangSun Technology RegTech 51 VT Ventures, Xinhu Zhongbao Company -
10 China Lupu Investment Financial Markets 45 Duane Kuang -

20
14
8
14
2320
7
2014 2015 2016 2017 2018 2019
33
16
25
52
40 40
33
8
2014 2015 2016 2017 2018 2019
78
3034
66 6959
78
15
2014 2015 2016 2017 2018 2019
0.1 2.0
5.1
2.5
0.60.1
0.1
2014 2015 2016 2017 2018 2019
0.3
1.71.2
2.6
1.30.2
0.2
2014 2015 2016 2017 2018 2019
0.8
2.1
3.4
1.01.8
0.40.4
2014 2015 2016 2017 2018 2019
All major verticals witness steep decline in funding
Asia VC funding, Fintech – Diverse VerticalsJanuary 01, 2014 – June 30, 2019
Capital Invested ($B) Projected 2H19 Deal Count ($M) Projected 2019
Business Solutions Payments Lending
* * *
* * *
Currency in US$, unless specified
Data Source: Pitch Book, unless specified otherwise
Note: Please refer to the Methodology section at the end of the report to understand the Fintech universe and its constituents as defined from perspective of this report as well as data analysis approach and
2019* calculation

Methodology
The underlying deal data used in the report was sourced from Pitchbook. Only transactions with a ‘Completed’ status were considered.
Fintech Data Selection Criteria
All transactions that were classified under the “Fintech” vertical by Pitchbook were selected. In addition, we also considered transactions based on search results that
included keys words such as Fintech, financial technology; finance technology, financial service technology, etc.
We also specifically reviewed the details such as original classification, business description, nature of deal, deal value for all transactions with deal value greater
than or equal to $1 billion using publicly available articles and/or company website. This was then used to make the reasonable judgment for their inclusion or
otherwise within the broader Fintech universe as well as the within different verticals/segments therein.
Categorization of Deal Type
For the purposes this report, our focus on Fintech deals is primarily three deal types as per Pitchbook classification: venture capital (VC), private equity (PE), and
mergers and acquisitions (M&As). All others deal types classifications including but not limited to “accelerator/incubator, secondary transaction, debt financed, publicly
listed, joint venture (JV), and others” are not included in the analysis of this report.
Venture Capital
For the purpose of this report, we observed the Deal Type and Deal Universe reported by Pitchbook for each deal. Based on Aranca’s analysis the deals tagged as
“early stage VC, late stage VC, angel (individual), restart-angel, seed round and Corporate” were classified as VC deals.
Venture Capital Stages
Angel/seed deals include deals tagged by Pitchbook as angel (individual) and seed round.
Early-stage deals include deals tagged by Pitchbook as early stage, which mostly include Series A and Series B companies. VC corporate deals with size less than $5
million that did not contain any specific tag for early or late stage (about 1% of total VC deals) within Pitchbook data were categorized as “early stage”.
Late-stage deals include deals tagged by Pitchbook as “late stage”, which typically represent Series C (and above) transactions. Furthermore, in absence of specific
classification, VC Corporate deals with size greater than or equal to $5 million (about 1% of total VC deals) were categorized as “late stage”.
In the report, Accelerator/Incubator is not a part of the VC universe.

Methodology (continued)
Categorization of Industry Segments
All Fintech deals have been classified under nine segments, namely, payments, lending, insurance, financial markets (wealth management and capital markets),
personal finance, business solutions, RegTech, real estate/mortgage, and Blockchain/crypto.
The companies have been classified based on the business description provided by Pitchbook or the company website.
1. Payments: Companies that provide money transfer and payment solutions, point-of-sale (PoS) systems, wallets, credit cards, etc.
2. Lending: Companies that provide loans or a marketplace for lending, working capital and any other type of business financing, crowdfunding, peer-to-peer (P2P)
lending, etc.
3. Insurance: Companies that provide insurance or provide technology/marketplace for all types of insurance products, insurance-enabling solutions, etc.
4. Financial Markets (Wealth Management and Capital Markets): Companies that provide portfolio management and advisory services, financial data and analytics,
trading or brokerage firms, investment management firms, etc.
5. Personal Finance: Companies that provide budget management apps, expense trackers, financial literacy apps, etc.
6. Business Solutions: Companies that provide business-process-enabling systems or technology such as accounting, payroll systems, and companies that do not
fall under any of the above categories
7. RegTech: Companies that provide solutions for risk management, regulatory compliance, assistance in audit, etc.
8. Real Estate/Mortgage: Companies that provide real estate advisory, rent payment solutions, any mortgage-related tech, etc.
9. Blockchain/Crypto: Companies offer Cryptocurrency/Blockchain related services or technology
2019 Full year calculation
The full year 2019 data provided in the charts is arrived at by annualizing 1H 2019 data and are not informed estimates. It is to facilitate better comparability with prior
years. Accordingly, the "dotted line" indicates 2019 full year annualized number of deals based on 1H 2019 actual data. The "shaded column area" indicates 2H 2019
capital invested based on 1H 2019 actual data.

Aranca is a trusted research & advisory partner to global companies, from the
hottest start-ups to the Fortune 500.
500+ strong team professional team
across multi-disciplinary domains
2500+ global Clients
80+ countries where we have delivered
projects
120+ sectors and sub-sectors
researched by our analysts
Business Research & Advisory
CXOs in Strategy, SBUs, Sales, Marketing, CI/MI, Innovation
Valuation & Financial Advisory
CFOs in Start-ups, PE//VC firms, Corporate M&A teams, mid-market cos.
Investment Research & Analytics
Brokerage, Hedge Funds, IRPs, I-Banks, AMCs, Investor Relations
Technology | IP Research & Advisory
R&D, Tech Scouting, Open Innovation, IP teams, Product Development
PRACTICE AREAS

Disclaimer
This document is for informational use only and may be
outdated and/or no longer applicable. Nothing in this
publication is intended to constitute legal, tax, or investment
advice. There is no guarantee that any claims made will
come to pass. The information contained herein has been
obtained from sources believed to be reliable, but Aranca
does not warrant the accuracy of the information. Consult a
financial, tax or legal professional for specific information
related to your own situation.
Bharat Ramnani, ACAHead of Valuations & Financial Advisory
Email: [email protected]
Ph: +91 22 3937 9999 Ext. 259
LinkedIn Profile
For additional details, please visit:
https://www.aranca.com/
https://www.linkedin.com/company/aranca
Bharat’s Client Service delivery experience of over 15 years
includes advising global clients across diverse strategic and
transaction advisory engagements, corporate finance and
business valuation situations. He has been instrumental in
building Aranca’s financial advisory services group, which
caters to wide spectrum of clientele including large corporate,
private equity & venture capital, family offices as well as
hundreds of high performing start-ups.
Bharat is a Chartered Accountant and holds an expert
designation in business valuation from American Society of
Appraisers.
Ashish RaneSenior Manager, Valuations and Financial Advisory
Email: [email protected]
Ph: +91 22 3937 9999 Ext. 390
LinkedIn Profile
Ashish has over 9 years of experience in Corporate Finance,
Transaction Advisory and Business Valuation and has
managed financial advisory engagements for over 300
Venture Capital firms focused on investments within the
Technology domain.
Ashish holds an MBA from New York’s Stern School of
Business and a Baccalaureate degree in Business and
Management Information Systems from Pennsylvania State
University.
www.aranca.com
If you have any questions about the information in the report, please reach out to Ashish Rane at [email protected]