powerpoint presentation · gm % % 37.6% 37.6% 37.6% 0.0ppt 100.0% (62.4)ppt summary total revenue...
TRANSCRIPT


BERTRAND MALLET CEO BELGIUM & LUXEMBOURG
Previously the
Group MD for EM
and Group
Strategy Director
Senior Bain
Consultant:
Retail and
Distribution focus

Inchcape Performance Management cycle
• Rigorous performance
management ingrained in
Inchcape’s culture through
timely implementation of key
processes - centrally, locally and
at every level of the organisation
• Leading indicators are
monitored on a daily basis
throughout the Group
Daily Customer Metrics
At a Daily level, the key areas of focus are leading indicators:
• Showroom & Web Traffic,
• Test Drives
• Conversion (Sales)
• Enquiries and Bookings (Aftersales)

Daily Customer Metrics
• This Dynamic information gives us clear and early insights,
thanks to the depth and breadth of the data:
• Global / regional / local focus enables us to differentiate
- national, regional or local trends
• Traffic / leads / test drives / offers - identify and differentiate
opportunities:
– Traffic building actions
– Dealer focus
– Attractiveness of commercial conditions

Weekly P&L / Cash
• On a weekly basis our scorecards provide detailed P&L and
Cash Flow forecasts for all entities, with a specific focus on
leading indicators such as
• Ordertake
• Delivery Momentum Versus monthly Rolling Forecasts
• Working Capital Level
• Corrective actions vs. deviations can be implemented
immediately (e.g. ordertake momentum, stock management,
etc…)
Belgium and Luxembourg MONTH
Prior
Week Week 9 Budget Var Budget Prior Year Var PY
CURRENT MONTH FORECAST Units
Orderbank end of month # units 5,580 5,362 5,567 (3.7)% 5,284 1.5%
No ageing analysis # units 0 0 - -
Orderbank month +1 # units 1,876 2,419 2,324 4.1% 2,096 15.4%
Orderbank month +2 # units 1,921 1,224 1,381 (11.4)% 1,668 (26.6)%
Orderbank month +3 # units 1,184 1,111 1,813 (38.7)% 1,421 (21.8)%
Orderbank month +4 # units 588 597 38 1471.1% 88 578.4%
Orderbank month +5 # units 11 11 11 0.0% 11 0.0%
NEW
Ordertake full month - External # units 2,400 2,409 2,178 10.6% 2,127 13.3%
Ordertake full month - Total # units 2,994 3,031 2,668 13.6% 2,520 20.3%
Volumes # units 3,036 2,831 3,035 (6.7)% 2,213 27.9%
Revenue £k 50,861 47,099 50,982 (7.6)% 35,939 31.1%
ASP £/unit 16,753 16,637 16,798 (1.0)% 16,240 2.4%
Gross profit £k 2,181 2,126 2,197 (3.2)% 1,666 27.6%
GPU £/unit 718 751 724 3.8% 753 (0.3)%
GM% % 4.3% 4.5% 4.3% 0.2ppt 4.6% (0.1)ppt
USED
Ordertake full month - External # units 50 53 43 23.3% 26 103.8%
Ordertake full month - Total # units 50 53 43 23.3% 26 103.8%
Volumes # units 167 175 167 4.8% 180 (2.8)%
Revenue £k 1,695 1,598 1,516 5.4% 1,761 (9.2)%
ASP £/unit 10,148 9,131 9,078 0.6% 9,781 (6.6)%
Gross profit £k 115 116 110 5.9% 161 (28.0)%
GPU £/unit 691 664 657 1.0% 896 (25.9)%
GM% % 6.8% 7.3% 7.2% 0.0ppt 9.2% (1.9)ppt
SERVICE
Hours # hours 7,785 7,903 8,005 (1.3)% 7,136 10.7%
Revenue £k 499 489 516 (5.2)% 426 14.8%
Recovery Rate £/hour 47.9 46.3 48.1 (3.8)% 45.6 1.5%
Gross Profit £k 270 265 282 (6.1)% 214 23.7%
GM % % 54.1% 54.2% 54.7% (0.6)ppt 50.3% 3.9ppt
BODYSHOP
Hours # hours 1,213 1,220 1,380 (11.6)% 1,324 (7.9)%
Revenue £k 212 214 224 (4.5)% 193 10.5%
Recovery Rate £/hour 96.0 96.2 90.7 6.1% 87.6 9.9%
Gross Profit £k 63 64 69 (7.6)% 62 2.4%
GM % % 29.6% 29.8% 30.8% (1.0)ppt 32.2% (2.4)ppt
PARTS
Revenue £k 6,062 5,585 6,276 (11.0)% 5,664 (1.4)%
Gross Profit £k 1,908 1,793 1,913 (6.3)% 1,779 0.8%
GM % % 31.5% 32.1% 30.5% 1.6ppt 31.4% 0.7ppt
AFTERSALES
Total Revenue £k 6,772 6,288 7,015 (10.4)% 6,283 0.1%
Total Gross Profit £k 2,240 2,122 2,264 (6.3)% 2,055 3.2%
GM % % 33.1% 33.7% 32.3% 1.5ppt 0 1.0ppt
OTHER
Revenue £k 596 596 596 0.0% 145 310.0%
Gross Profit £k 224 224 224 0.1% 145 54.1%
GM % % 37.6% 37.6% 37.6% 0.0ppt 100.0% (62.4)ppt
SUMMARY
Total Revenue £k 59,923 55,581 60,109 (7.5)% 44,128 26.0%
Revenue elim (-ve) £k (9,746) (9,294) (9,013) 3.1% (6,699) 38.7%
Revenue external £k 50,178 46,286 51,097 (9.4)% 37,429 23.7%
Revenue L4L £k 50,178 46,286 51,097 (9.4)% 37,429 23.7%
Gross profit £k 4,760 4,588 4,794 (4.3)% 4,029 13.9%
% Margin (% Ext Rev) % 9.5% 9.9% 9.4% 0.5ppt 10.8% (0.9)ppt
Expenses £k (4,014) (3,959) (4,047) 2.2% (3,703) (6.9)%
Operating profit £k 746 629 747 (15.9)% 326 92.8%
ROS% (% Ext Rev) % 1.5% 1.4% 1.5% (0.1)ppt 0.9% 0.5ppt
JV post acq P/L £k 0 0 0 - (14) (100.0)%
Finance Costs £k (47) (47) (48) 2.2% (50) 7.1%
PBT £k 700 582 699 (16.8)% 261 122.6%

Monthly Balance Scorecard
On a monthly basis our balance
scorecard monitors
• Customer Scores
• P&L
• Operational Effectiveness
• Capital Employed
(including Stock)
• Cash Flow indicators
Rolling Forecast
All items are reviewed along 3 dimensions:
Versus Targets
Versus Last Year
Versus Best In Class benchmark
The 3-dimensional benchmarking helps
to identify opportunities for growth, in
particular with regards to Network
League Table Management
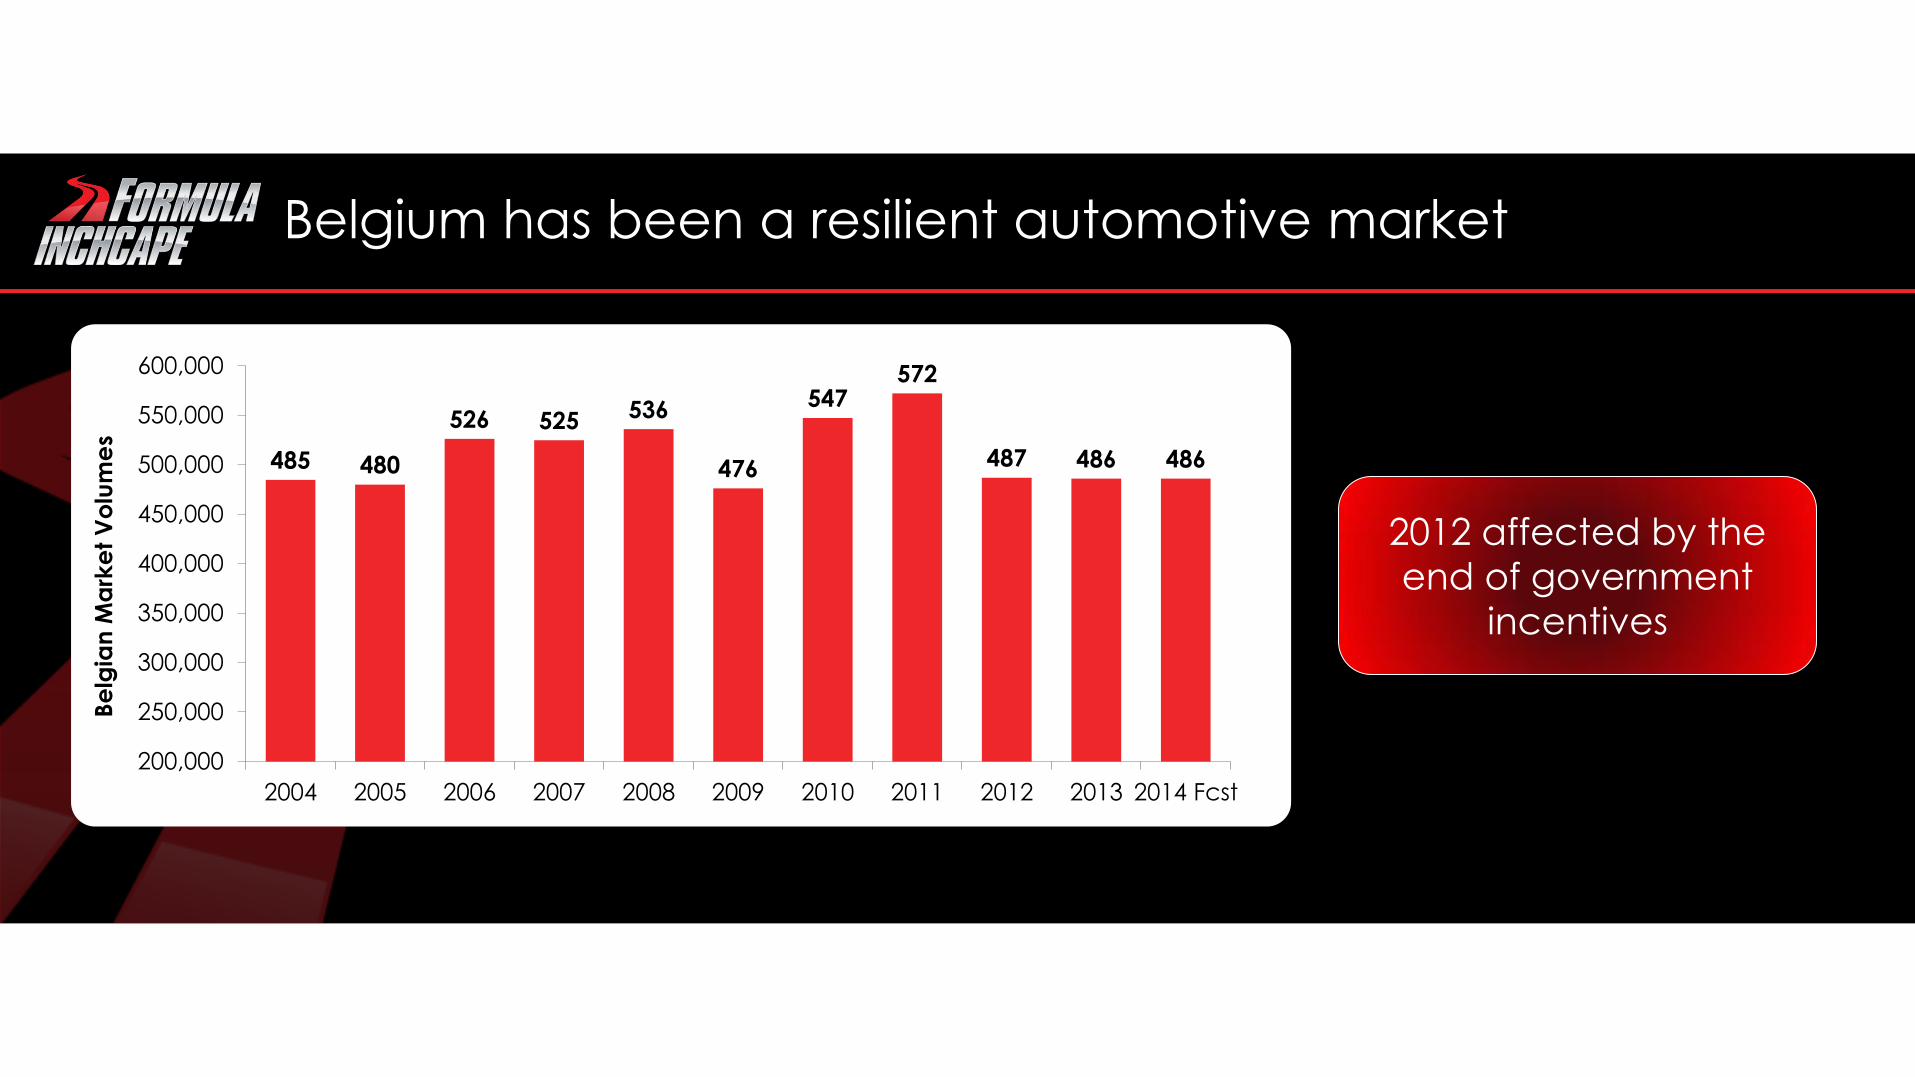
Belgium has been a resilient automotive market
485 480
526 525 536
476
547 572
487 486 486
200,000
250,000
300,000
350,000
400,000
450,000
500,000
550,000
600,000
2004 2005 2006 2007 2008 2009 2010 2011 2012 2013 2014 Fcst
Be
lgia
n M
ark
et
Vo
lum
es
2012 affected by the
end of government
incentives

Strong opportunity to grow share in core segments
• Constant stream of key new product launches in the next 3 years
• Hybrid as key competitive advantage in both private and fleet markets
• Improved value proposition at the heart of each segment
• Increased petrol demand across segments
• Improved diesel line-up thanks to partnership with BMW

The Share Growth Opportunity in Belgium
• Rigorous performance
management of the network
• A constant focus on customer
experience
• Successful marketing and sales
efforts, - We have an opportunity to
continue to grow Toyota and Lexus
market shares in Belgium 3.3%
3.6%
4.2%
2.0%
2.5%
3.0%
3.5%
4.0%
4.5%
2012 2013 2014 Q1
Ma
rke
t Sh
are
PC
Be
lgiu
m
Growth of Toyota Market Share

Product range significantly extended
H2 2012 H1 2013 H2 2013 H1 2014 H2 2014
NG Auris
MC Verso
NG Rav4
Auris TS
ProAce
NG Corolla
NG Aygo
MC Yaris
Verso 1,6d
IS 300h GS 300h NX 300h
NG Yaris H
NG Auris H Auris TS H
MC CT200h
MC Yaris H
Particular focus on
new Hybrid models
as well as a new
diesel powertrain

Excellent customer experience and loyalty in the Toyota network providing a strong platform for future growth
2008 2010 2012
#1 Hyundai Toyota Toyota
#2 Toyota Hyundai Peugeot
#3 Peugeot Peugeot Ford
#4 Nissan Nissan Citroën
Source: NCBS Survey
Best in class retailer recommendation High aftersales loyalty
0
10
20
30
40
50
60
70
80
90
100
Maintenance Quick fit Body repair Tyres
% lo
ya
lty
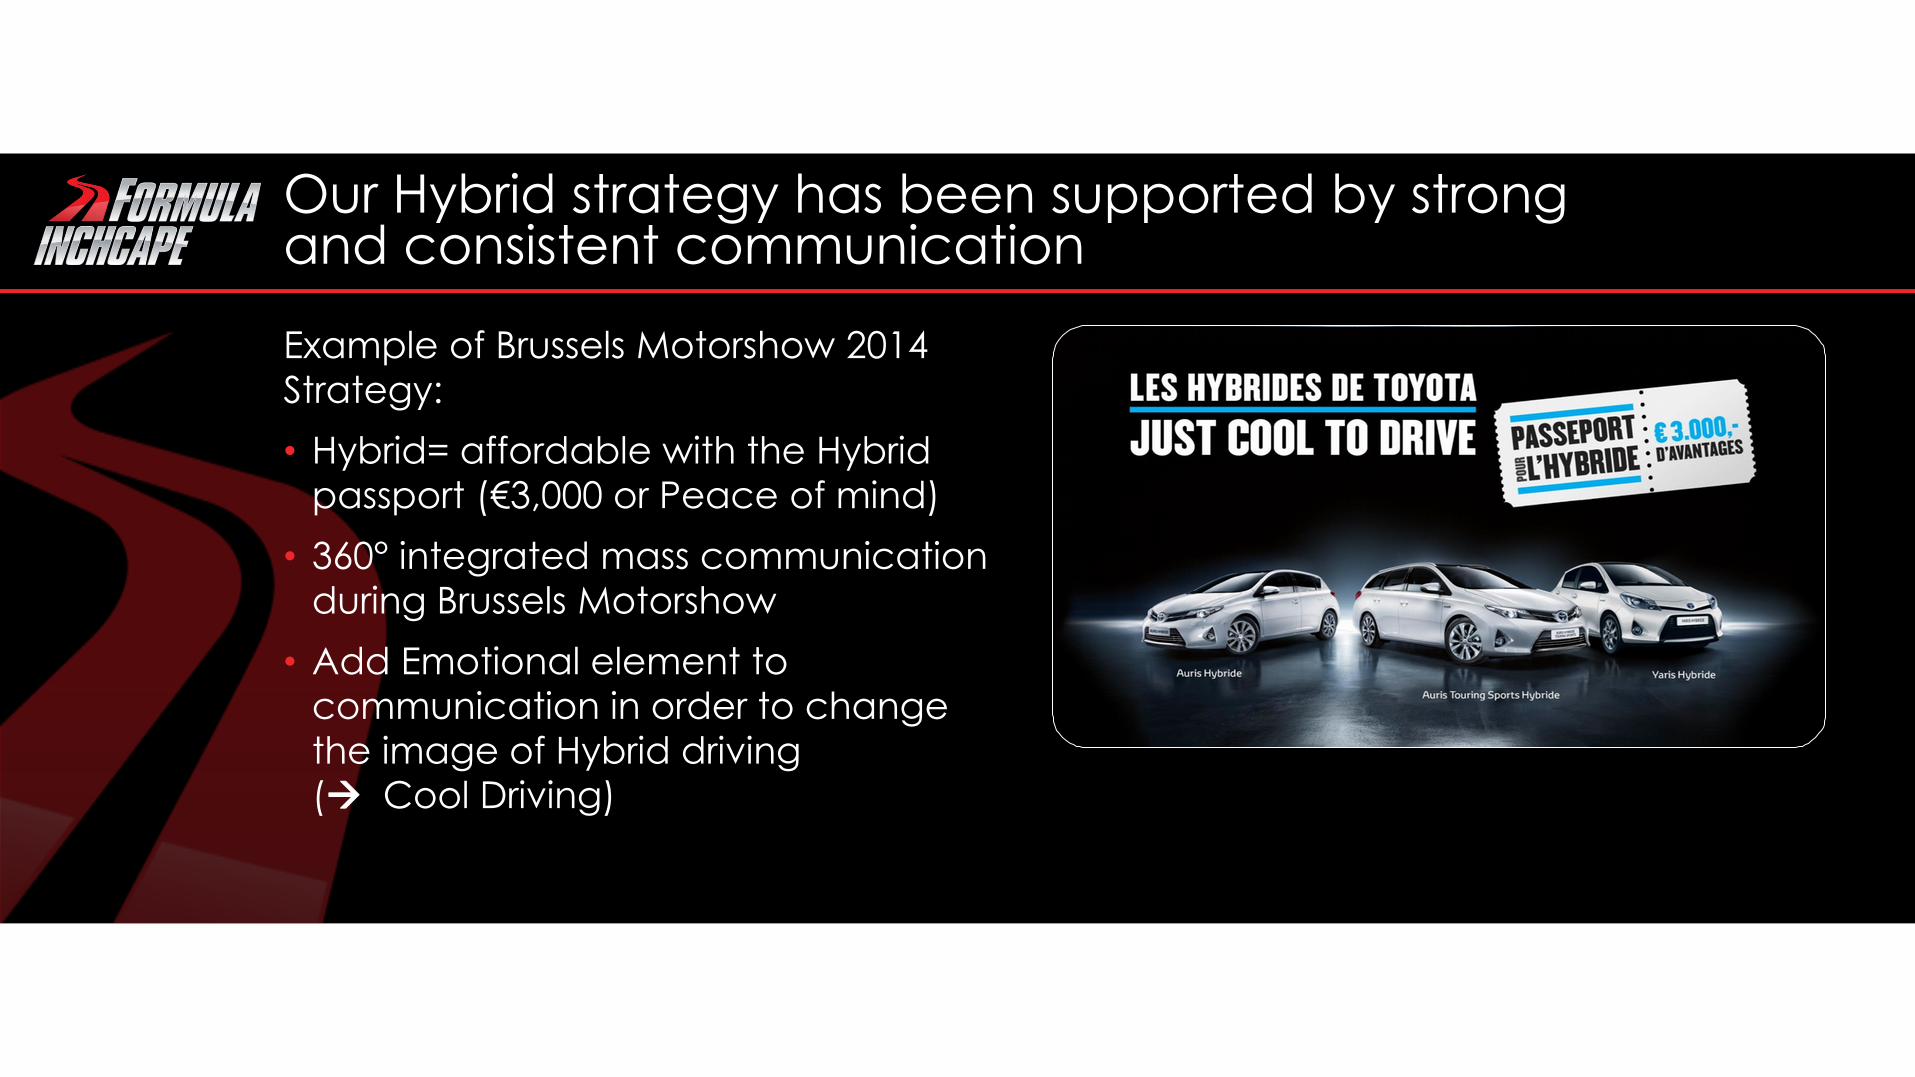
Our Hybrid strategy has been supported by strong and consistent communication
Example of Brussels Motorshow 2014
Strategy:
• Hybrid= affordable with the Hybrid
passport (€3,000 or Peace of mind)
• 360° integrated mass communication
during Brussels Motorshow
• Add Emotional element to
communication in order to change
the image of Hybrid driving ( Cool Driving)
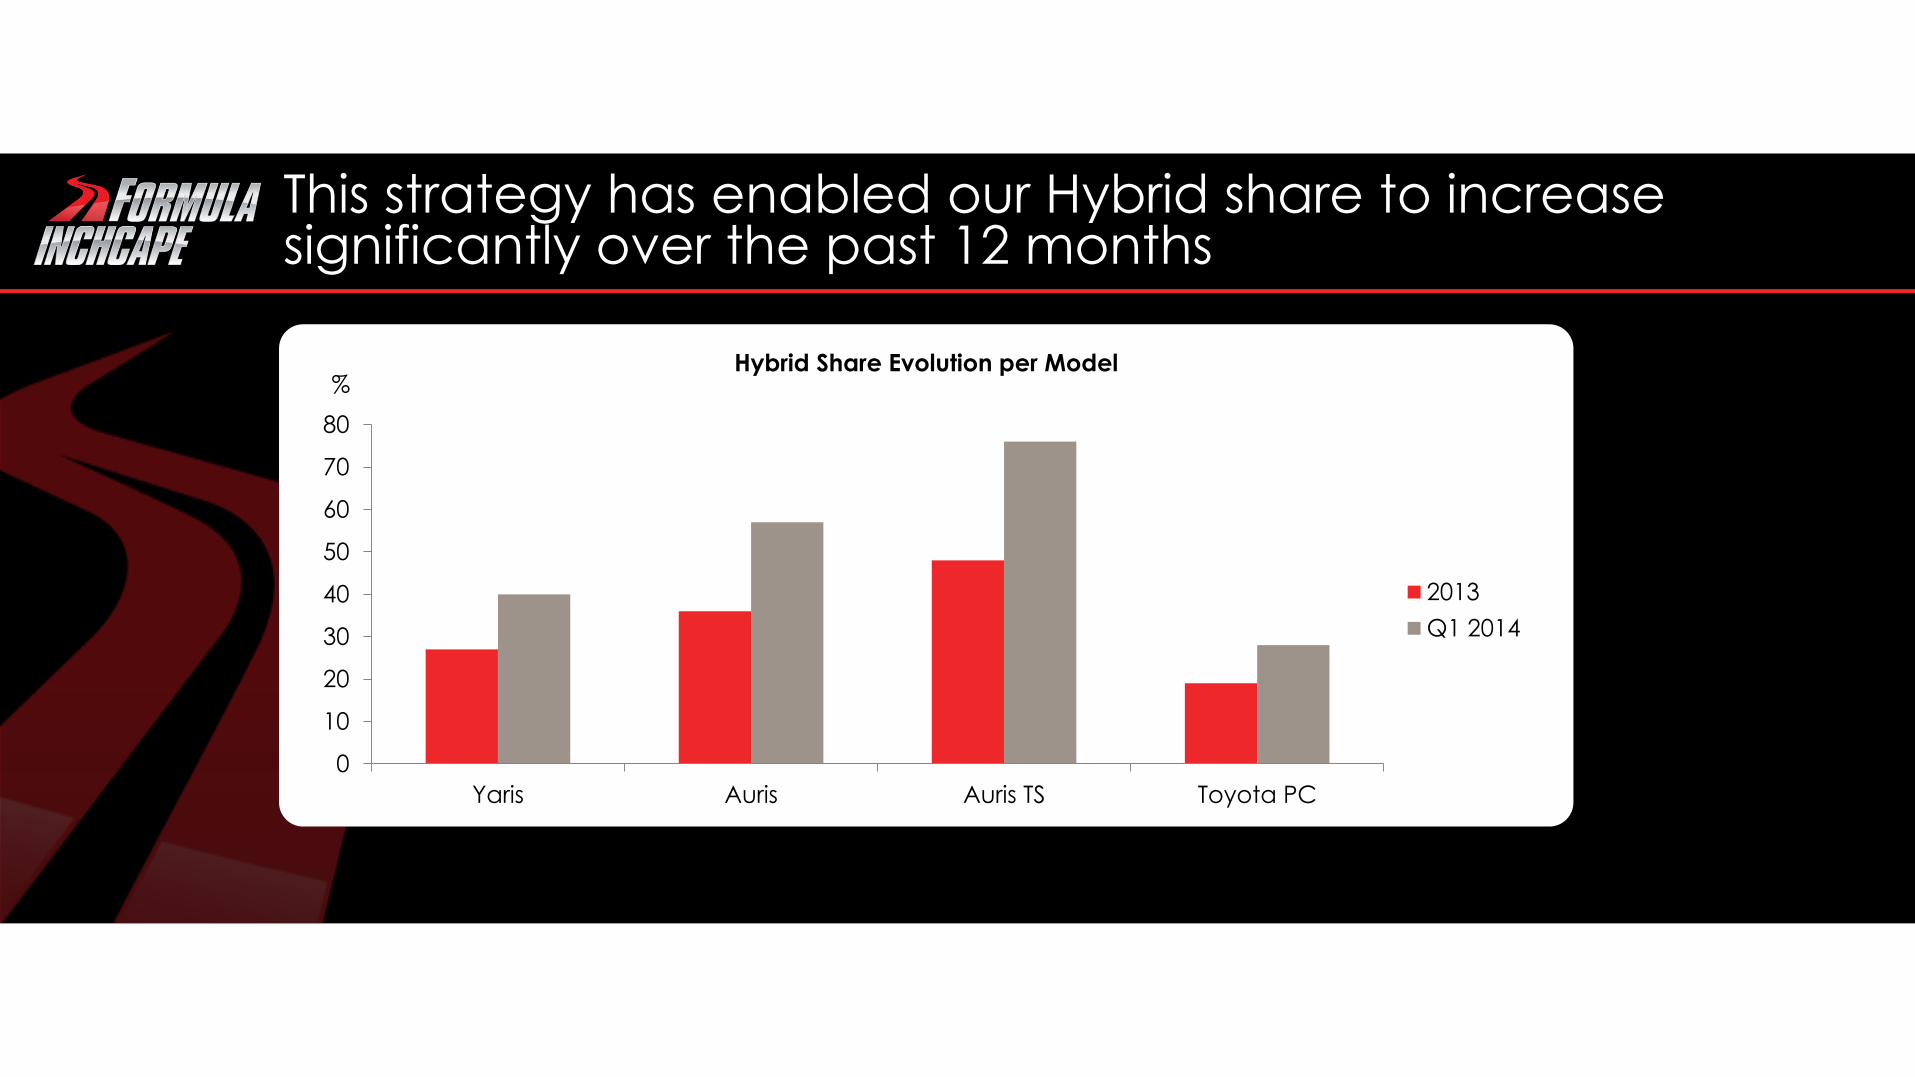
0
10
20
30
40
50
60
70
80
Yaris Auris Auris TS Toyota PC
2013
Q1 2014
%
This strategy has enabled our Hybrid share to increase significantly over the past 12 months
Hybrid Share Evolution per Model

Profitable Revenue growth ahead in Toyota Belgium
Solid foundations of Toyota dealer
network
Differentiated customer
experience in Sales & Aftersales
Strength of Toyota brand Strong market positioning
Quality of product line up Market share growth in petrol,
diesel and hybrid

GEORGE ASHFORD CEO AUSTRALASIA
Previously the MD
of European Retail
and CEO of
Toyota Belgium
10 years of
experience at
Yum Restaurants
International

Inchcape performance management
As a scale distribution and retail business performance management is focused on:
• Driving effective management of the brand
• Driving site by site performance across
– Third party dealer network AND
– Inchcape network
• Leveraging scale to drive cost efficiencies across the group

Brand performance metrics
Brand performance metrics focus on:
• Long term health of the brand
• Effectiveness of each campaign
• Share performance
• Premiumisation
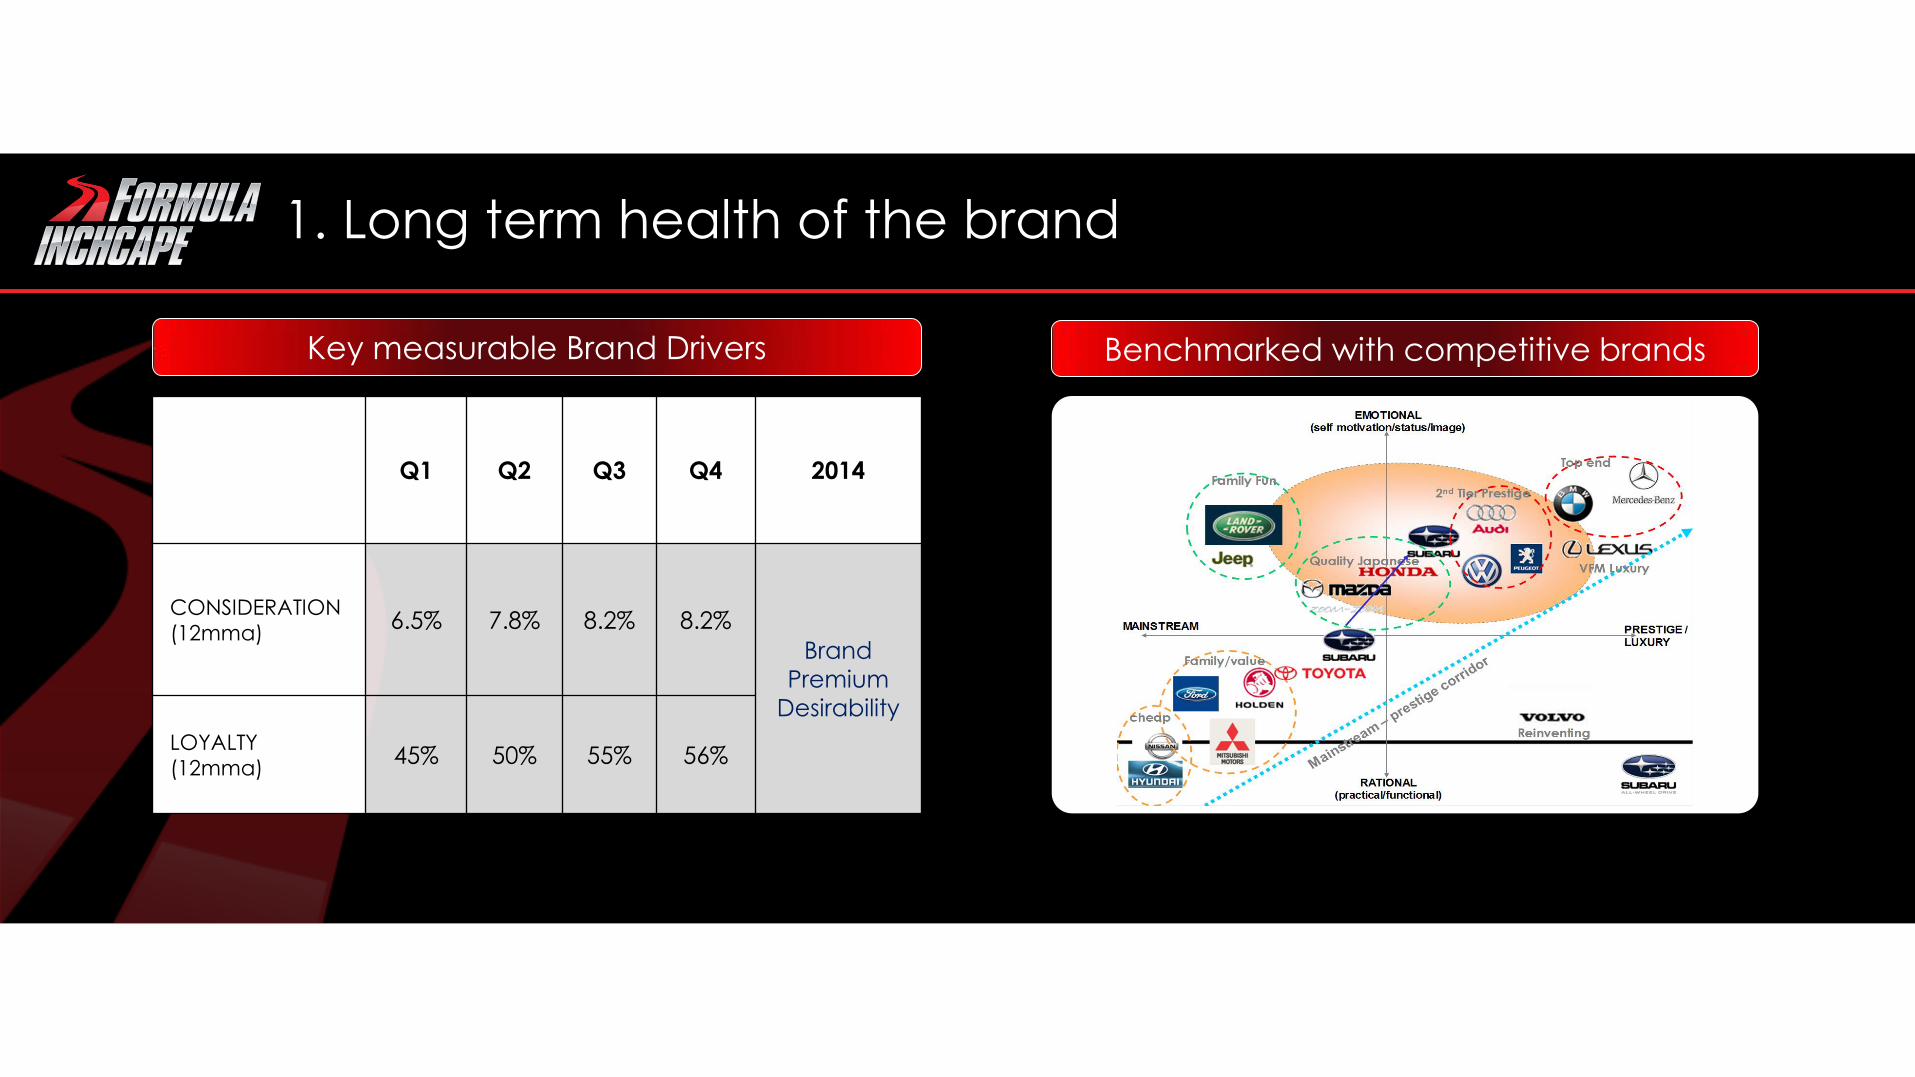
1. Long term health of the brand
Key measurable Brand Drivers
Q1 Q2 Q3 Q4 2014
CONSIDERATION
(12mma) 6.5% 7.8% 8.2% 8.2%
Brand
Premium
Desirability
LOYALTY
(12mma) 45% 50% 55% 56%
Benchmarked with competitive brands

2. Effectiveness of each campaign
Campaign Marketing Effectiveness Aligned “Go to market” process
Early bird reporting & ROI tracking

VEHICLE MARKET REVIEW - AUSTRALIA
VFACTS
SEGMENT MONTH % MONTH % MARKET % YTD % YTD % MARKET %
Mar-14 Mar-14 GROWTH Mar-14 Mar-14 GROWTH
MICRO 1,789 3.8 2,125 4.4 -336 -15.8 5,065 3.8 6,165 4.6 -1,100 -17.8
LIGHT 9,411 20.0 10,559 21.7 -1,148 -10.9 25,440 19.2 29,912 22.3 -4,472 -15.0
SMALL 21,512 45.7 22,414 46.1 -902 -4.0 63,122 47.7 60,679 45.3 2,443 4.0
MEDIUM 6,422 13.6 6,489 13.3 -67 -1.0 16,685 12.6 16,922 12.6 -237 -1.4
LARGE 4,350 9.2 3,494 7.2 856 24.5 11,972 9.0 10,358 7.7 1,614 15.6
UPPER LARGE 293 0.6 318 0.7 -25 -7.9 884 0.7 993 0.7 -109 -11.0
PEOPLE MOVERS 900 1.9 729 1.5 171 23.5 2,643 2.0 1,999 1.5 644 32.2
SPORTS 2,402 5.1 2,536 5.2 -134 -5.3 6,545 4.9 6,931 5.2 -386 -5.6
TOTAL PASSENGER 47,079 48.4 48,664 50.0 -1,585 -3.3 132,356 49.7 133,959 49.1 -1,603 -1.2
SUV 30,778 61.3 29,148 59.8 1,630 5.6 82,513 61.6 82,605 59.4 -92 -0.1
OTHER COMMERCIAL 19,410 38.7 19,588 40.2 -178 -0.9 51,501 38.4 56,484 40.6 -4,983 -8.8
TOTAL COMMERCIAL 50,188 51.6 48,736 50.0 1,452 3.0 134,014 50.3 139,089 50.9 -5,075 -3.6
TOTAL MARKET 97,267 100.0 97,400 100.0 -133 -0.1 266,370 100.0 273,048 100.0 -6,678 -2.4
SUBARU
PASSENGER 717 1.5 1,314 2.7 -597 -45.4 2,572 1.9 2,823 2.1 -251 -8.9
SUV 3,095 6.2 2,905 6.0 190 6.5 7,412 5.5 7,606 5.5 -194 -2.6
TOTAL SUBARU 3,812 3.9 4,219 4.3 -407 -9.6 9,984 3.7 10,429 3.8 -445 -4.3
3. Share performance : VFACTS

4. Premiumisation
XV DUALIS ASX TIGUAN $22,000
$40,000
$24,000
$26,000
$28,000
$30,000
$32,000
$34,000
$36,000
$38,000
Strong and sustained Premium grade/suffix mix Clear Model USP

Performance Management site by site applies same philosophy in third party and owned sites
Accelerate
Grow
Manage
High Octane Performance Management
Reduce Span of
Performance:
- Daily traffic and
conversion
- Weekly profitability and
stock control
- Monthly benchmarking
group wide, dealership
level
- Monthly Best Practice
Sharing
- Clear communication
Low performance
Best in class/
performance
potential
Middle Performance
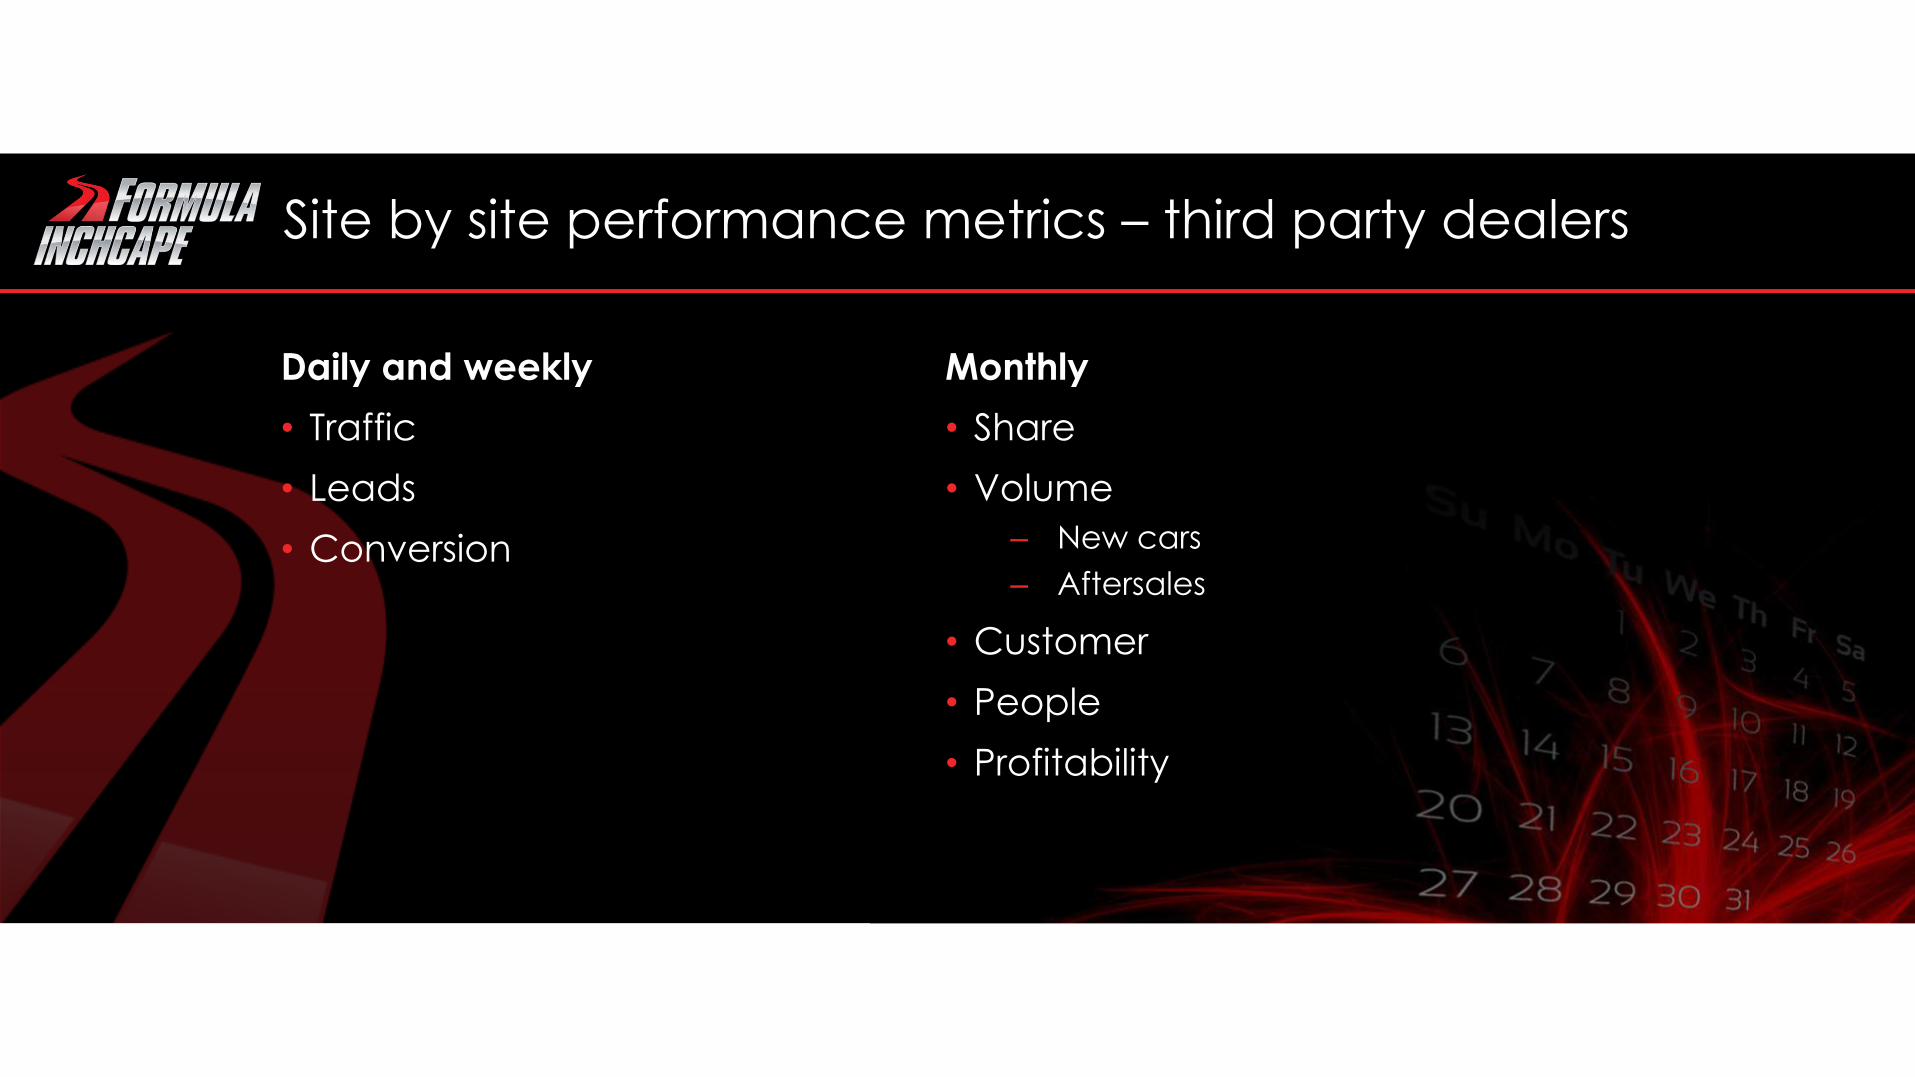
Site by site performance metrics – third party dealers
Daily and weekly
• Traffic
• Leads
• Conversion
Monthly
• Share
• Volume
– New cars
– Aftersales
• Customer
• People
• Profitability

Monthly Performance Measurement

Site by site performance metrics – Inchcape sites
Daily and weekly
• Traffic
• Leads
• Test drives
• Conversion
Weekly
• Profitability
• Customer
• Stock
Monthly
• OEM performance
• Sales funnel
• Customer
• People
• Stock
• Profitability
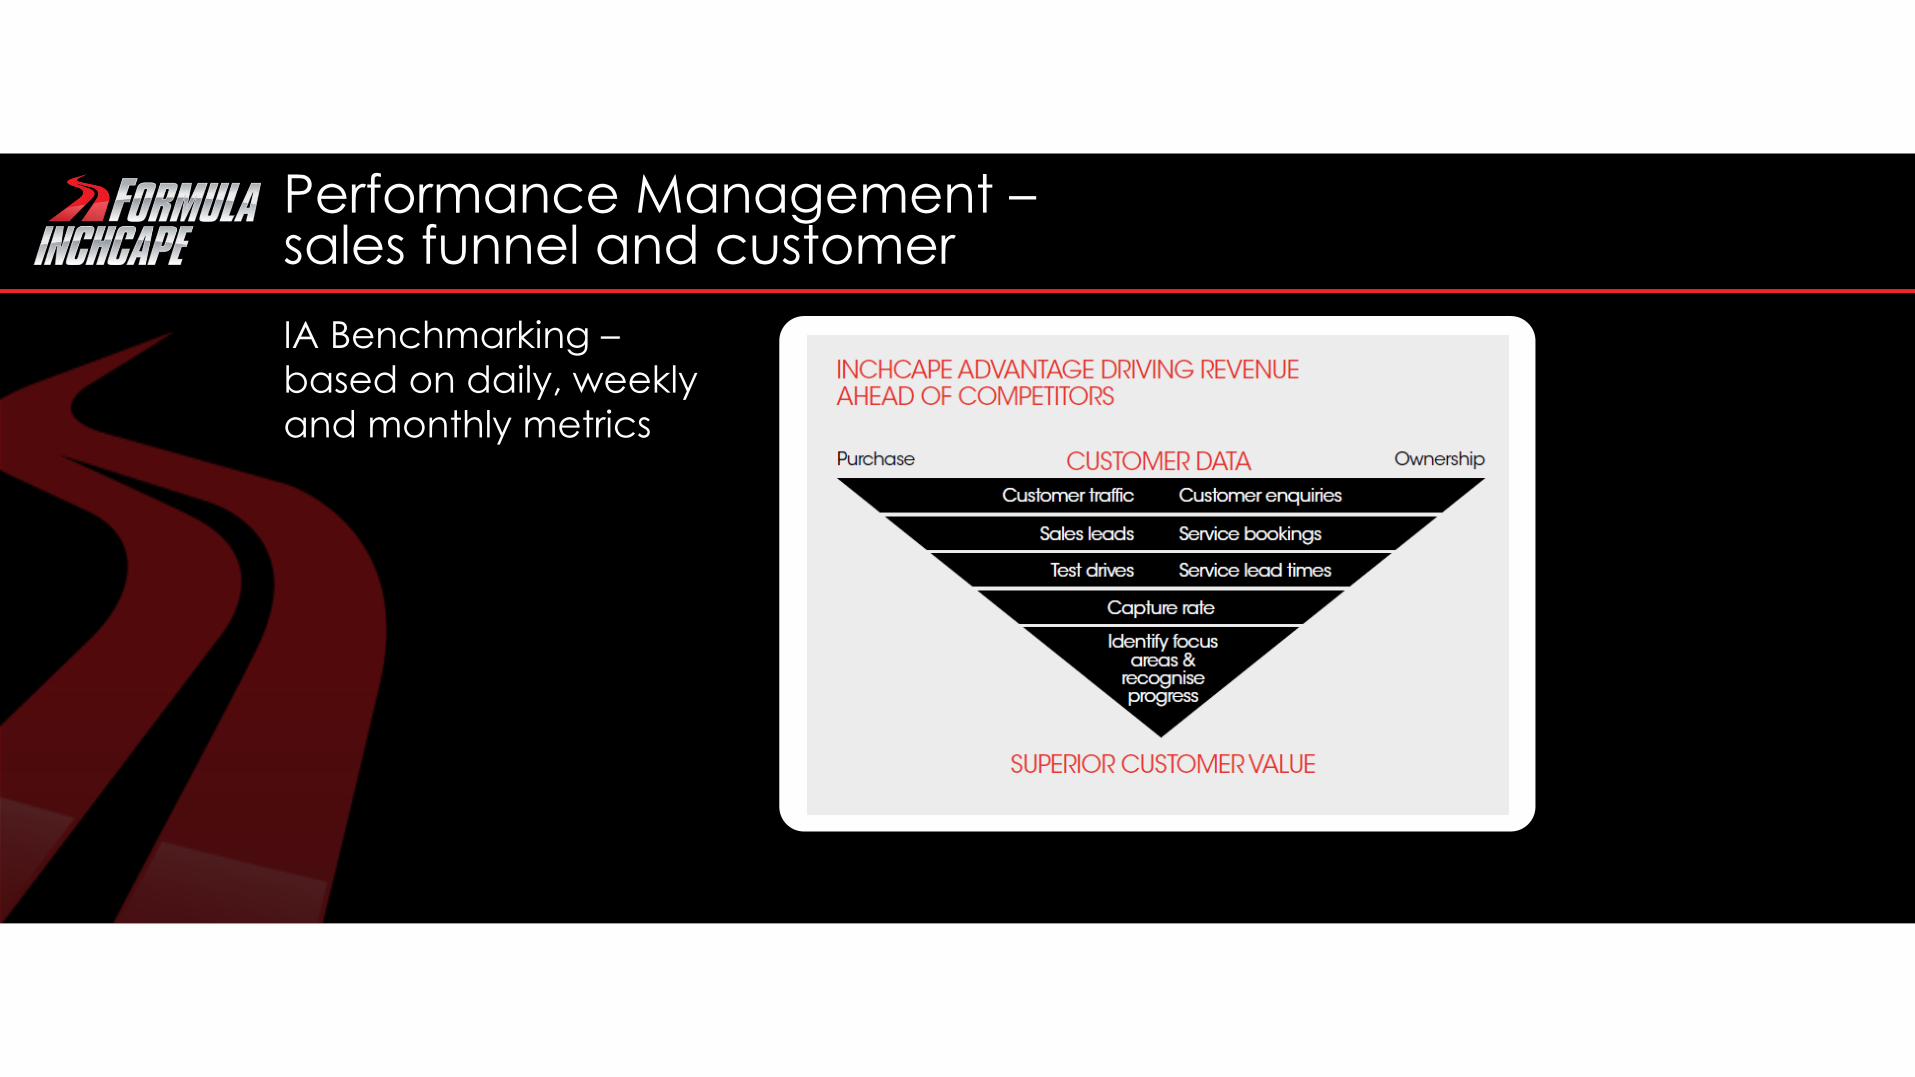
Performance Management – sales funnel and customer
IA Benchmarking –
based on daily, weekly
and monthly metrics

Performance Management
Weekly balanced scorecard – 3
dimensional approach:
Performance vs target, past year and YTD
IA Benchmarking – daily metrics
Monthly balanced scorecard –
3 dimensional approach:
Performance vs target, past year and Best in Class

Performance Management - people
Behavioural performance review and people planning
Jan and Feb • My Performance • My Behaviour • Leadership Skills • Values
• My Grow with Inchcape Plan
FULL YEAR REVIEW
Jan and Feb • My Performance • My Behaviour • Leadership Skills • Values
• My Grow with Inchcape Plan
FULL YEAR PLANNING -
Jul and Aug • My Performance • My Behaviour • Leadership Skills • Values
• My Grow with Inchcape Plan
MID YEAR REVIEW -
- Sales (Sales Consultants)
- Service (Service Advisors,
Workshop Controllers
MONTHLY REVIEW -

Performance Management – leveraging scale
Granular trend and benchmarking across
• Overheads
• Cost of sales
• Productivity
Delivering scale advantage through
• Supplier consolidation/negotiation
• Consolidation of back office functions
• Process re-engineering

Scale advantages realized
Supplier consolidation and negotiation
• Shipping
• F&I
Back office consolidation
• Shared services
• Centralized PDI
Process re-engineering
• Stock control

Performance Management ingrained in our culture
Centricity of Performance Management across the Group…
…and a relentless pursuit of high performance throughout Inchcape…
Delivering premium growth and premium returns
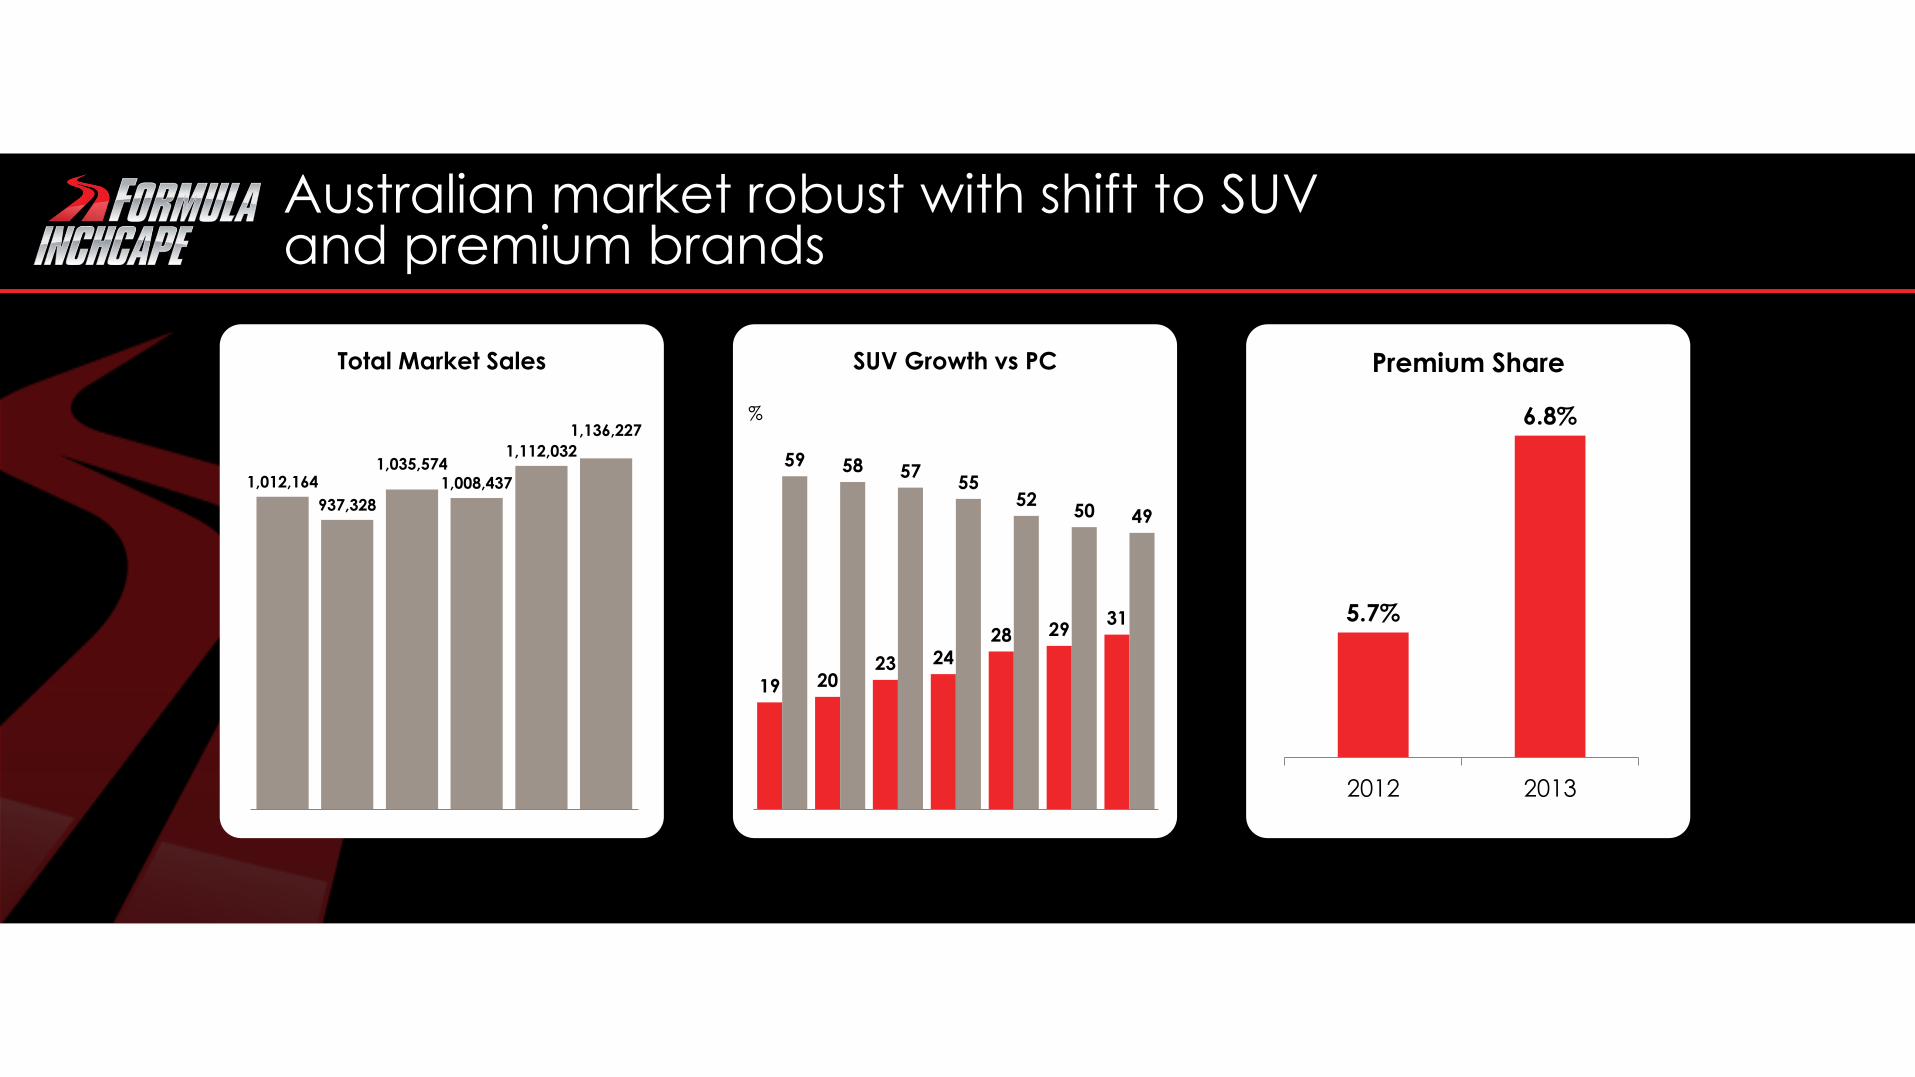
Australian market robust with shift to SUV and premium brands
1,012,164
937,328
1,035,574 1,008,437
1,112,032
1,136,227
Total Market Sales
19 20 23 24
28 29 31
59 58 57 55
52 50 49
SUV Growth vs PC
%
Premium Share
5.7%
6.8%
2012 2013
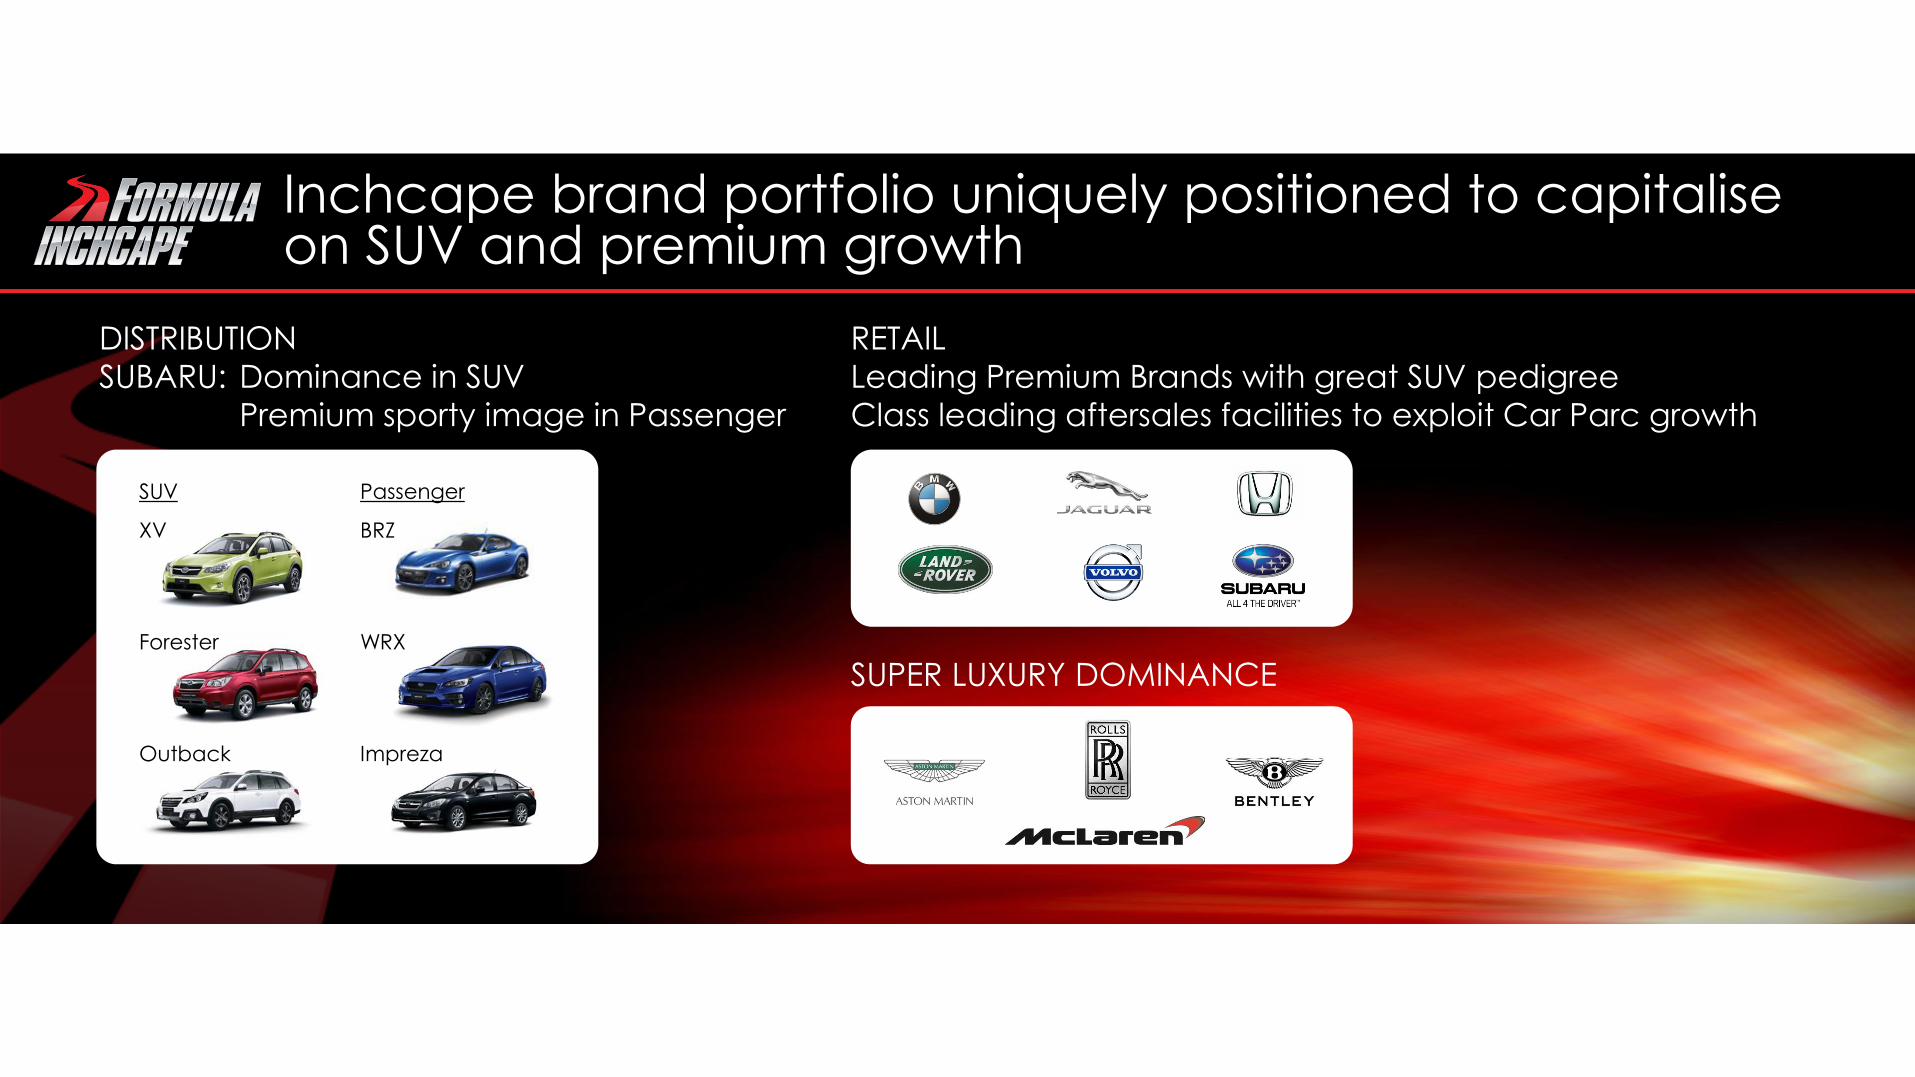
Inchcape brand portfolio uniquely positioned to capitalise on SUV and premium growth
DISTRIBUTION
SUBARU: Dominance in SUV
Premium sporty image in Passenger
RETAIL
Leading Premium Brands with great SUV pedigree
Class leading aftersales facilities to exploit Car Parc growth
SUV Passenger
XV
BRZ
Forester
WRX
Outback
Impreza
SUPER LUXURY DOMINANCE