powerpoint presentation · pdf fileslide 3 highlights – full year 2016 investor...
TRANSCRIPT

Slide 1
Full year 2016
London, 6 February 2017
Manato Ohara, diagnosed with type 1 diabetes Kanagawa, Japan

Slide 2
Forward-looking statements
Novo Nordisk’s reports filed with or furnished to the US Securities and Exchange Commission (SEC), including the company’s Annual Report 2016 and Form 20-F, which are both filed with the SEC in February 2017 in continuation of the publication of the Annual Report 2016, and written information released, or oral statements made, to the public in the future by or on behalf of Novo Nordisk, may contain forward-looking statements. Words such as ‘believe’, ‘expect’, ‘may’, ‘will’, ‘plan’, ‘strategy’, ‘prospect’, ‘foresee’, ‘estimate’, ‘project’, ‘anticipate’, ‘can’, ‘intend’, ‘target’ and other words and terms of similar meaning in connection with any discussion of future operating or financial performance identify forward-looking statements. Examples of such forward-looking statements include, but are not limited to: • Statements of targets, plans, objectives or goals for future operations, including those related to Novo Nordisk’s products, product research, product development, product introductions
and product approvals as well as cooperation in relation thereto • Statements containing projections of or targets for revenues, costs, income (or loss), earnings per share, capital expenditures, dividends, capital structure, net financials and other
financial measures • Statements regarding future economic performance, future actions and outcome of contingencies such as legal proceedings, and • Statements regarding the assumptions underlying or relating to such statements.
These statements are based on current plans, estimates and projections. By their very nature, forward-looking statements involve inherent risks and uncertainties, both general and specific. Novo Nordisk cautions that a number of important factors, including those described in this presentation, could cause actual results to differ materially from those contemplated in any forward-looking statements.
Factors that may affect future results include, but are not limited to, global as well as local political and economic conditions, including interest rate and currency exchange rate fluctuations, delay or failure of projects related to research and/or development, unplanned loss of patents, interruptions of supplies and production, product recall, unexpected contract breaches or terminations, government-mandated or market-driven price decreases for Novo Nordisk’s products, introduction of competing products, reliance on information technology, Novo Nordisk’s ability to successfully market current and new products, exposure to product liability and legal proceedings and investigations, changes in governmental laws and related interpretation thereof, including on reimbursement, intellectual property protection and regulatory controls on testing, approval, manufacturing and marketing, perceived or actual failure to adhere to ethical marketing practices, investments in and divestitures of domestic and foreign companies, unexpected growth in costs and expenses, failure to recruit and retain the right employees, and failure to maintain a culture of compliance.
Unless required by law, Novo Nordisk is under no duty and undertakes no obligation to update or revise any forward-looking statement after the distribution of this presentation, whether as a result of new information, future events or otherwise. Important drug information • Victoza® (liraglutide 1.2 mg & 1.8 mg) is approved for the management of type 2 diabetes only • Saxenda® (liraglutide 3 mg) is approved in the US and EU for the treatment of obesity only
Investor presentation Full year 2016

Slide 3
Highlights – Full year 2016
Investor presentation Full year 2016
1 Adjusted operating profit account for partial divestment of NNIT and out-licensing of assets for inflammatory disorders, both in 2015
Research and Development • Tresiba® demonstrated CV non-inferiority and reduced severe hypoglycaemia risk vs insulin glargine U100 in DEVOTE trial • FDA approval received for Xultophy® 100/3.6 in the US • Xultophy® showed significant reduction of hypoglycaemic events and weight loss in DUAL VII vs basal-bolus • Fast-acting insulin aspart approved in the EU and Canada, class II resubmission of NDA in the US expected within 3 months
Sales development • Sales increased by 6% in local currencies and 4% in Danish kroner
• North America grew by 4% in local currencies and accounted for 41% share of growth in local currencies • Latin America and Region China grew by 28% and 12% in local currencies, respectively • Tresiba® now accounts for 47% share of growth in local currencies
Financials • Adjusted1 operating profit increased by 6% in local currencies • Diluted earnings per share adjusted for the partial divestment of NNIT increased by 19% to 14.96 DKK per share • 19% increase in total dividend to DKK 7.60 per share of DKK 0.20 proposed (including interim dividend of DKK 3.00 paid in
August 2016) • New share repurchase programme of up to DKK 16 billion to be executed during the coming 12 months • 2017 financial outlook:
• Reported sales growth is expected to be 1-6% (around 2% lower in local currencies) • Reported operating profit growth is expected to be around 0-5% (around 2% lower in local currencies)

Slide 4
Novo Nordisk’s strategic priorities build on the Novo Nordisk Way
Investor presentation Full year 2016
Expand leadership in DIABETES
Expand leadership in GROWTH DISORDERS
Pursue leadership in HAEMOPHILIA
Expand leadership in GROWTH DISORDERS
Pursue leadership in OBESITY
Expand leadership in DIABETES
Pursue leadership in HAEMOPHILIA
Expand into ADJACENT DISEASE AREAS
1. We create value by having a patient centred business approach
2. We set ambitious goals and strive for excellence 3. We are accountable for our financial, environmental
and social performance 4. We provide innovation to the benefit of our
stakeholders 5. We build and maintain good relations with our key
stakeholders 6. We treat everyone with respect 7. We focus on personal performance and development 8. We have a healthy and engaging working environment 9. We optimise the way we work and strive for
simplicity 10. We never compromise on quality and business ethics
The Novo Nordisk Way and 10 Essentials Novo Nordisk strategic priorities
4

Slide 5
Driving future growth opportunities in International Operations
AAMEO: Africa, Asia, Middle East & Oceania
‘New’ IO sales growth – full year of 2016
Local currencies Growth Share of IO growth
Region Europe 2% 9%
Region AAMEO 7% 24%
Region China 12% 32%
Region Japan & Korea 4% 4%
Region Latin America 28% 30%
Total sales 7%
Key priorities for regions ensuring future growth in International Operations
Region EU
Region Latin
America
Region China
Region Japan
& Korea
• Continued market share gains with Tresiba® and Xultophy®
• Expand Victoza® label with LEADER® CV data • Ensure successful launches of Fiasp®
• Sustain strong underlying volume market growth • Successfully launch Tresiba® and Victoza® • Continue to invest in local manufacturing to support
market access
• Sustain solid insulin market growth and stabilisation of market share
• Pursue further market uptake of Victoza®
• Improve access to care and upgrade to modern insulin
Investor presentation Full year 2016
• Strengthen leadership in the insulin market with Tresiba®
• Expand the GLP-1 market with Victoza® • Strengthen leadership position in Biopharm
• Sustain strong underlying volume market growth • Continued market share gains with Tresiba®
• Expand obesity market with Saxenda®
Region AAMEO
5

Slide 6
US reorganisation and key priorities
Key focus areas to ensure sustainable growth in the US
Organisation • Reorganisation in the US completed • Overall aim to increase focus, agility and accountability
Key priorities • Sharpen commercial focus on key brands • Address affordability issues for insulin products • Engage in value based contracting approaches
Portfolio • Commercial priorities in 2017: - Tresiba® - Victoza®
- Saxenda®
• Xultophy® expected to be launched H1 2017
US sales by product – full year of 2016
Investor presentation Full year 2016
Local currencies Growth (%)
Growth (mDKK)
New-generation insulin n/a 2,211
Modern insulin (9%) (2,628)
Human insulin (3%) (57)
Victoza® 12% 1,565
Other diabetes and obesity care 73% 903
- Hereof Saxenda® 202% 913
Diabetes and obesity care 5% 1,994
Haemophilia (7%) (379)
- Hereof NovoSeven® (8%) (593)
Norditropin® 24% 866
Other biopharmaceuticals (11%) (270)
Biopharmaceuticals 2% 217
Total 4% 2,211
6

Slide 7
Expected future sales drivers, partly offset by 2-3% negative impact on global pricing Expected future cost drivers
Key assumptions supporting the long-term financial target of an average of 5% operating profit growth1
Insulin
• Continued underlying 3-4% volume growth of the global insulin market
• Market share gains and value upgrades driven by the new generation franchise
Investor presentation Full year 2016
Obesity • Continued expansion of the obesity market
with Saxenda® in the US
• Successful launches in new markets
Biopharm
• Limited growth of the biopharm franchise mainly due to increased competition in the haemophilia space
• Potential for bolt-on activity to support growth
• 1-3 percentage points decline expected as a result of US pricing impact, partly offset by mix effect and productivity gains
GM
S&D
R&D
Admin
• 2-3 percentage points decline expected in the S&D to sales ratio
• Lower growth in S&D costs mainly driven by focused promotional activities in the US
• Admin to sales ratio expected to decline to around 3%
• Lower growth in admin costs driven by various savings initiatives
• Around 13% R&D to sales ratio expected to remain unchanged
• Refocused research efforts releasing resources to be invested in adjacent disease areas
GM: Gross margin
GLP-1
• Continued expansion of the GLP-1 market with underlying volume growth of >10% annually
• Solid market leadership with Victoza® supported by semaglutide launch (exp 2018)
7
1 New long term financial target established in connection with the Q3 2016 report. The target of 5% operating profit growth is an average for the period of 4-5 years, with 2015 as the base year.

Slide 8
Cash return priorities and business development activities
Organic growth enables steady cash return to shareholders via dividends and share repurchase programmes
Investor presentation Full year 2016
Cash return priorities • Dividend to match pharma peer-group • Dividend distributed twice a year as interim in August and
final in connection with the Annual General Meeting in March the following year
• Share repurchase to cover at least remaining cash flow • The total programme may be reduced in size, if significant
product in-licensing or bolt-on acquisition opportunities are undertaken during 2017
Business development activities • External academic and business collaborations • Bolt-on within Biopharm and adjacent disease areas • Ramp-up in internal organisational capabilities
10 12 13 16 11
14 15
17 8
05
1015202530354045
2013 2014 2015 2016
16
15
Annual cash return to shareholders
* Interim dividend for 2017 not decided. For illustration only. Note: Dividends are allocated to the year of dividend pay. For 2017 expected free cash flow is DKK 29-33 billion. Share repurchase programmes run for 12 months starting February until end January of the following year.
DKK billion
Share repurchase Dividend Free cash flow
Interim dividend
2017E*
Free cash flow guidance

Slide 9
Local currencies Growth Share of growth
New-generation insulin1 212% 51%
Modern insulin (3%) (25%)
Human insulin 2% 4%
Victoza® 12% 36%
Other diabetes and obesity care2 26% 21%
- Hereof Saxenda® 245% 19%
Diabetes and obesity care 6% 87%
Haemophilia3 0% (1%)
Norditropin® 14% 18%
Other biopharmaceuticals4 (6%) (4%)
Biopharmaceuticals 4% 13%
Total 6% 100%
Sales growth is driven by new-generation insulin and Victoza®
Investor presentation Full year 2016
Sales as reported – full year 2016 Growth analysis – full year 2016
1 Comprises Tresiba®, Xultophy® and Ryzodeg® 2 Primarily NovoNorm®, needles and Saxenda®
3 Comprises NovoSeven®, NovoEight® and NovoThirteen®
4 Primarily Vagifem® and Activelle®
Other biopharmaceuticals (7%)
7% Haemophilia (2%)
11%
Diabetes and obesity care
+4%
79%
3%
80%
Norditropin®
+12%
Note: Norditropin® sales growth in the full year 2016 is derived primarily from the US and reflects a positive non-recurring adjustment to rebates in the Medicaid patient segment
Sales of DKK 111.8 billion (+4%)
9%
8% 3%
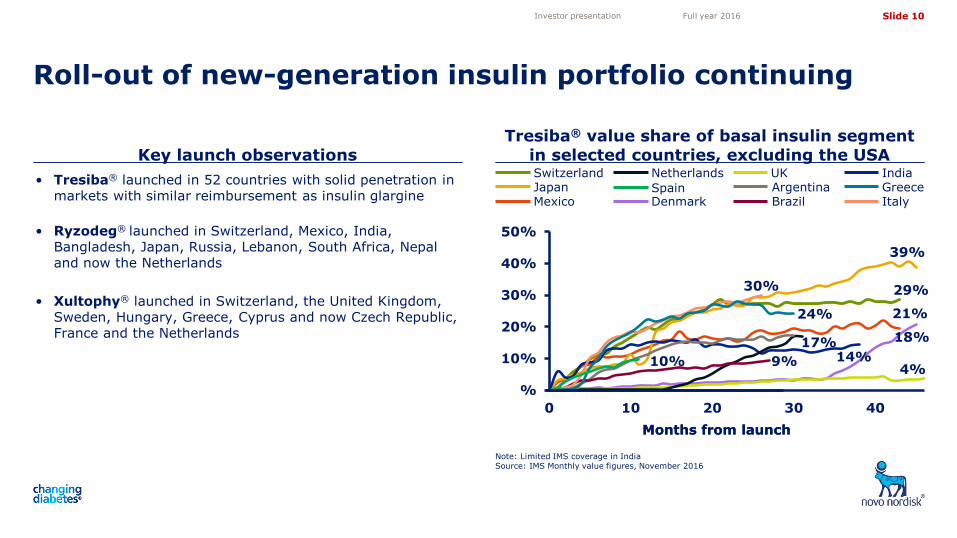
Slide 10
• Tresiba® launched in 52 countries with solid penetration in markets with similar reimbursement as insulin glargine
• Ryzodeg® launched in Switzerland, Mexico, India, Bangladesh, Japan, Russia, Lebanon, South Africa, Nepal and now the Netherlands
• Xultophy® launched in Switzerland, the United Kingdom, Sweden, Hungary, Greece, Cyprus and now Czech Republic, France and the Netherlands
Key launch observations Tresiba® value share of basal insulin segment
in selected countries, excluding the USA
Roll-out of new-generation insulin portfolio continuing
Note: Limited IMS coverage in India Source: IMS Monthly value figures, November 2016
Investor presentation Full year 2016
Months from launch
Mexico
Switzerland Japan
Denmark
Netherlands Argentina Brazil
UK India Greece Italy
Spain
%
10%
20%
30%
40%
50%
0 10 20 30 40Months from launch
10% 4%
17%
30%
24%
9%
18% 14%
29%
39%
21%

Slide 11
Weekly US NBRx volume market shares
Increasing total market share of the basal insulin franchise in the US
Source: IMS weekly data, 13 January 2017, excludes Medicaid
Investor presentation Full year 2016
Tresiba® launch in the US • Full commercial launch in January 2016 following specialist
engagement in Q4 2015
• Tresiba® volume market share reached 5.5% by the end of 2016
• Recent increase in Tresiba® and Levemir® uptake following commercial formulary changes for CVS in the basal insulin segment
• Tresiba® U200 accounts for nearly 80% of total Tresiba® volume
• Wide formulary access has been obtained with around 75% access for patients in commercial channels and Medicare part D combined
Note: The graph does not show NPH, which accounts for the residual market share Source: IMS weekly data, 13 January 2017, excludes Medicaid NBRx: New-to-brand prescriptions; MS: Market share
Basal NBRx MS
0%
10%
20%
30%
40%
50%
10%
Jan 2016
Levemir® NN Total Basal Tresiba® glargine U100 glargine U300
biosimilar glargine U100
38%
23%
35%
15%
9%
Dec 2016

Slide 12
Investor presentation Full year 2016
Victoza® maintains leadership in the faster growing US GLP-1 market
US GLP-1 market development
Source: IMS NPA monthly, November 2016
US GLP-1 market shares Total TRx Growth rate
exenatide Victoza®
albiglutide dulaglutide MAT GLP-1 TRx (million)
GLP-1 TRx market share
MAT volume growth rate
Nov 2016
Nov 2013
0%
5%
10%
15%
20%
25%
30%
35%
012345678
0%
20%
40%
60%
80%
100%
Nov 2013
Nov 2016
US GLP-1 market TRx volume
0.00
0.10
0.20
0.30
0.40
GLP-1 TRx volume (million)
Nov 2013
Nov 2016
exenatide Victoza®
albiglutide dulaglutide
50%
25%
18% 7%

Slide 13
DEVOTE trial design Key results and next step
Tresiba® demonstrated CV safety and reduced severe hypoglycaemia risk vs insulin glargine U100 in DEVOTE trial
Investor presentation Full year 2016
Insulin glargine U100 once daily (blinded vial) + standard of care
Tresiba® once daily (blinded vial) + standard of care
0
7,637 patients
with type 2 diabetes
Trial objective • To investigate the cardiovascular safety of Tresiba®
CV: Cardiovascular Note: Key inclusion criteria: Adults above 50 years with type 2 diabetes and established cardiovascular disease, or above 60 years with multiple cardiovascular risk factors; HbA1c ≥7.0% or HbA1c <7.0% and current basal insulin therapy ≥20 units per day; treatment with ≥1 oral or injectable anti-diabetic drug(s) * The trial was concluded after at least 633 events
• Non-inferiority on CV safety demonstrated with a hazard ratio of 0.91 in favour of Tresiba® relative to insulin glargine U100 with no statistically significant difference between the two treatments
• Compared to insulin glargine U100, Tresiba® demonstrated a superior and statistically significant: • 27% reduction in the proportion of subjects with one or
more severe hypoglycaemia episodes • 40% reduction in the overall rate of severe
hypoglycaemia episodes • 53% reduction in the rate of nocturnal severe
hypoglycaemia episodes
Next steps • Presentation of detailed results at a scientific meeting and
submission to regulatory authorities in the first half of 2017
Event driven trial*
CV: Cardiovascular

Slide 14
• Concizumab (NN7415) phase 1b multiple dose trial Explorer 3 completed
Key development milestones reached
Investor presentation Full year 2016 Draft
• FDA approval for Xultophy® 100/3.6 (NN9068) in the US • Supplemental application for the SWITCH trials submitted for Tresiba® (NN1250) in the EU • Real-world evidence study EU-TREAT with Tresiba® completed • Submission of once-weekly semaglutide (NN9535) in the US and EU for the treatment of type 2 diabetes • All ten clinical trials in the oral semaglutide (NN9924) phase 3a PIONEER programme initiated • Once daily semaglutide (NN9536) phase 2 results • Anti-IL-21 and GLP-1 in type 1 diabetes (NN9828) granted orphan drug designation in the US
• FGF21 obesity (NN9499) phase 1 trial initiated • Phase 2 trial with once-daily semaglutide (NN9931) initiated in NASH
Diabetes
Obesity and other areas
Biopharm
Investor presentation Full year 2016
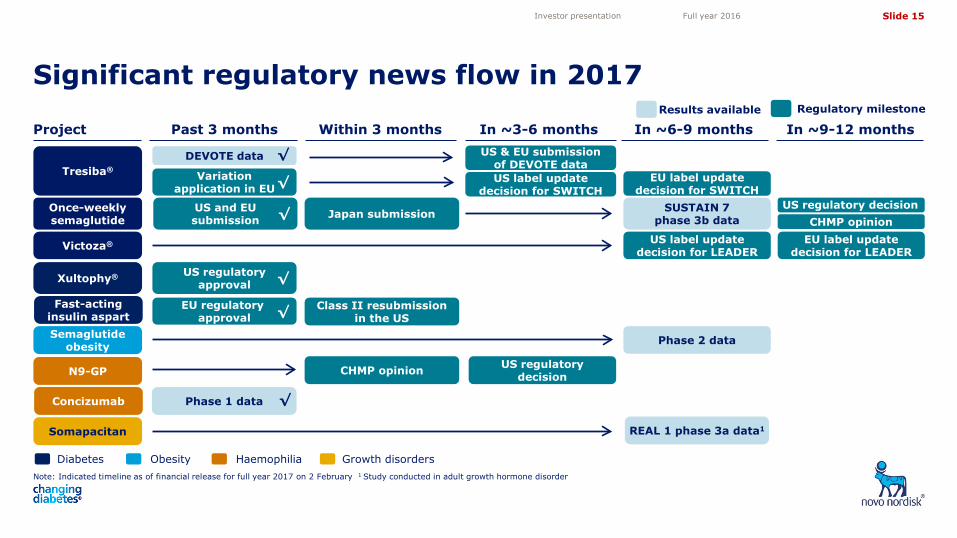
Slide 15
Significant regulatory news flow in 2017
Investor presentation Full year 2016
Project Past 3 months Within 3 months In ~3-6 months In ~6-9 months In ~9-12 months
Note: Indicated timeline as of financial release for full year 2017 on 2 February 1 Study conducted in adult growth hormone disorder
Diabetes Haemophilia Growth disorders
Tresiba®
Victoza®
Xultophy® US regulatory approval
Once-weekly semaglutide
DEVOTE data
N9-GP
Fast-acting insulin aspart
US and EU submission
CHMP opinion
EU regulatory approval
Somapacitan
Concizumab Phase 1 data
Variation application in EU
√
√
√
Results available Regulatory milestone
√
Class II resubmission in the US
√
US regulatory decision
REAL 1 phase 3a data1
SUSTAIN 7 phase 3b data
US label update decision for LEADER
EU label update decision for LEADER
US & EU submission of DEVOTE data
EU label update decision for SWITCH
√
Obesity
Semaglutide obesity Phase 2 data
US label update decision for SWITCH
√
Japan submission CHMP opinion
US regulatory decision

Slide 16
Financial results – full year 2016
Investor presentation Full year 2016
1 Non-recurring income comprises the partial divestment of NNIT (DKK 2,376 million) in 2015 2 Non-recurring income comprises the out-licensing of assets for inflammatory disorders (DKK 449 million) in 2015
DKK million FY 2016 FY 2015 Change Sales 111,780 107,927 4% Gross profit 94,597 91,739 3% Gross margin 84.6% 85.0%
Sales and distribution costs (28,377) (28,312) 0% Percentage of sales 25.4% 26.2%
Research and development costs (14,563) (13,608) 7% Percentage of sales 13.0% 12.6%
Administration costs (3,962) (3,857) 3% Percentage of sales 3.5% 3.6%
Other operating income, net 737 3,482 N/A Non-recurring income from the partial divestment of NNIT A/S1 - 2,376
Operating profit 48,432 49,444 (2%)
Operating profit adjusted for non-recurring income1,2 48,432 46,619 4%
Financial items (net) (634) (5,961) (89%) Profit before income tax 47,798 43,483 10% Tax (9,873) (8,623) 14% Effective tax rate 20.7% 19.8%
Net profit 37,925 34,860 9% Diluted earnings per share (DKK) 14.96 13.52 11% Diluted earnings per share (DKK) adjusted for partial divestment of NNIT1 14.96 12.58 19%

Slide 17
40
60
80
100
120
140
Currency impact in 2016 driven by unfavourable development in both hedged and unhedged currencies
Investor presentation Full year 2016
Hed
ged
curr
enci
es
Inde
x (1
Jan
201
5= 1
00)
CNY/DKK JPY/DKK USD/DKK
Non
-hed
ged
curr
enci
es
Inde
x (1
Jan
201
5 =
100
)
CAD/DKK GBP/DKK
1 DKK per 100; 2 As of 27 January 2017; 3 Operating profit in DKK million per annum; 4 Chinese Yuan traded offshore (CNH) Note: Operating profit impact of one of the non-hedged currencies appreciating 5% is in the range of DKK -15 to +30 million
Hedged Currencies
2015 average
2016 average2
Spot rate2
Impact of a 5% move3
Hedging (months)
USD1 673 673 697 2,100 12
CNY1 107.0 101.3 101.3 320 94
JPY1 5.56 6.21 6.05 200 14
GBP1 1,028 911 873 90 12
CAD1 526 508 531 80 11
Non-hedged Currencies
2015 average
2016 average2
Spot rate2
ARS1 0.73 0.46 0.44
TRY1 248 223 179
INR1 10.49 10.02 10.23
RUB1 11.06 10.10 11.78
BRL1 205 195 220
INR/DKK ARS/DKK RUB/DKK TRY/DKK BRL/DKK
80
90
100
110
120
130
140
3 1 2 4
2015 2016
3 1 2 4

Slide 18
Financial outlook for 2017
The financial outlook is based on an assumption of a continuation of the current business environment and given the current scope of business activities and has been prepared assuming that currency exchange rates remain at the level as of 27 January 2017
Investor presentation Full year 2016
Sales growth - local currencies
Sales growth - reported
Operating profit growth - local currencies
Operating profit growth - reported
Financial items (net)
Effective tax rate
Capital expenditure
Free cash flow
Depreciation, amortisation and impairment losses
Expectations 2 Feb 2017
-1% to 4%
Around 2 percentage points higher
-2% to 3%
Loss of around DKK 2.4 billion
21-23%
Around DKK 10.0 billion
Around DKK 3 billion
Around DKK 29-33 billion
Around 2 percentage points higher

Slide 19
Source: IMS MAT November 2016 volume and value (DKK) figures
Solid leadership positions and continued market opportunities Promising pipeline and product launches
Closing remarks
Investor presentation Full year 2016
> > • The only company with a full portfolio of novel insulin and GLP-1 products
• Semaglutide portfolio offers expansion opportunity with both injectable and oral administration
• Xultophy® supports promising outlook for insulin and GLP-1 combination therapy
• Saxenda® and multiple clinical stage development projects hold potential within obesity
• Broad pipeline within haemophilia and growth hormone disorders
27% Novo Nordisk value market share in diabetes care and solid leadership position
~4% insulin market volume growth
45% Novo Nordisk insulin volume market share with leadership position across all regions
>20% GLP-1 volume market growth
60% Novo Nordisk GLP-1 volume market share with strong global leadership position
15 countries successfully launched Saxenda®

Slide 20
Share information Investor Relations contacts
Investor contact information
Investor presentation Full year 2016
Novo Nordisk’s B shares are listed on the stock exchange in Copenhagen under the symbol ‘NOVO B’. Its ADRs are listed on the New York Stock Exchange under the symbol ‘NVO’. For further company information, visit Novo Nordisk on the internet at: novonordisk.com Peter Hugreffe Ankersen +45 3075 9085 [email protected]
Melanie Raouzeos +45 3075 3479 [email protected]
Hanna Ögren +45 3079 8519 [email protected]
Anders Mikkelsen +45 3079 4461 [email protected]
In North America:
Kasper Veje +1 609 235 8567 [email protected]
Novo Nordisk A/S Investor Relations Novo Allé, DK-2880 Bagsværd
Upcoming events
23 Mar 2017 Annual General Meeting 2017
03 May 2017 Financial statement for the first three months of 2017
09 Aug 2017 Financial statement for the first half of 2017
01 Nov 2017 Financial statement for the first nine months of 2017