powerpoint presentationgreenbusinesscentre.com/energyaward2017presentations/buildings... · icici...
TRANSCRIPT

9/6/2017
1
18th National Award for
Excellence in Energy
Management 2017
Corporate Office, BKC
August 30 & 31, 2017
ICICI Bank Ltd. Corporate Office Mumbai
Profile & Benchmarking
Energy Savings
Innovation Projects
Environment Projects
Encon Management
ICICI Bank Ltd. Corporate Office Mumbai
Area 42563 sqm
Floor plate of 1407.52 sqm
North - South building orientation
Double glazed building
ICICI Bank Ltd. Corporate Office Mumbai
Lobby area is 2323.42 sqm with height of 11 meters
Grills are provided at 4 meters for cooling

9/6/2017
2
ICICI Bank Ltd. Corporate Office Mumbai
2 Atriums of 30 meters height for harnessing day light in
passages for all 10 floors
Day Light harnessing
LED Lights across all floors
8
ICICI Bank Ltd. Corporate Office Mumbai
9/6/2017
3
Year of occupation 1998
Area 42563 sqm
No. of floors 2 Basement +12
No. of Work station 2375
Air Cooled Chillers1 x 370 TR
1 x 250 TR
Water Cooled Chillers1 x 500 TR
1 x 550 TR
UPS 7 x 80 kVA
Diesel generators 2 x 750 kVA
Transformer 4 x 1500 kVA
Total connected load 3171kW
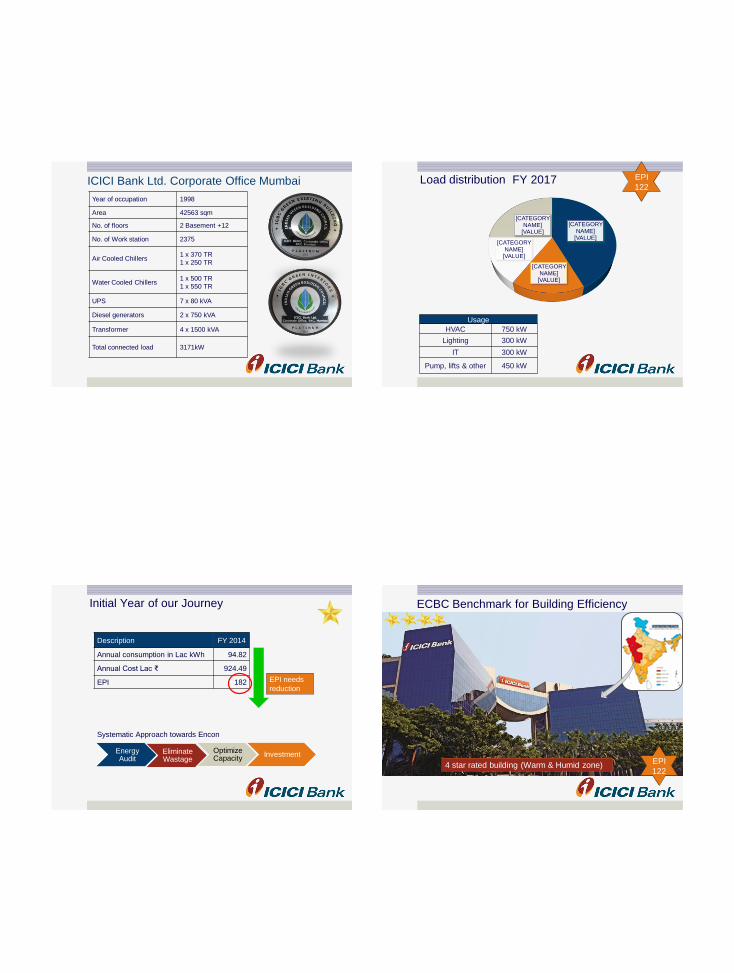
ICICI Bank Ltd. Corporate Office Mumbai Load distribution FY 2017
Usage
HVAC 750 kW
Lighting 300 kW
IT 300 kW
Pump, lifts & other 450 kW
[CATEGORY NAME]
[VALUE]
[CATEGORY NAME]
[VALUE]
[CATEGORY NAME]
[VALUE]
[CATEGORY NAME]
[VALUE]
EPI
122
Initial Year of our Journey
Energy Audit
Description FY 2014
Annual consumption in Lac kWh 94.82
Annual Cost Lac ₹ 924.49
EPI 182
Systematic Approach towards Encon
EPI needs
reduction
Eliminate Wastage
Optimize Capacity
Investment
ECBC Benchmark for Building Efficiency
4 star rated building (Warm & Humid zone) EPI
122
9/6/2017
4
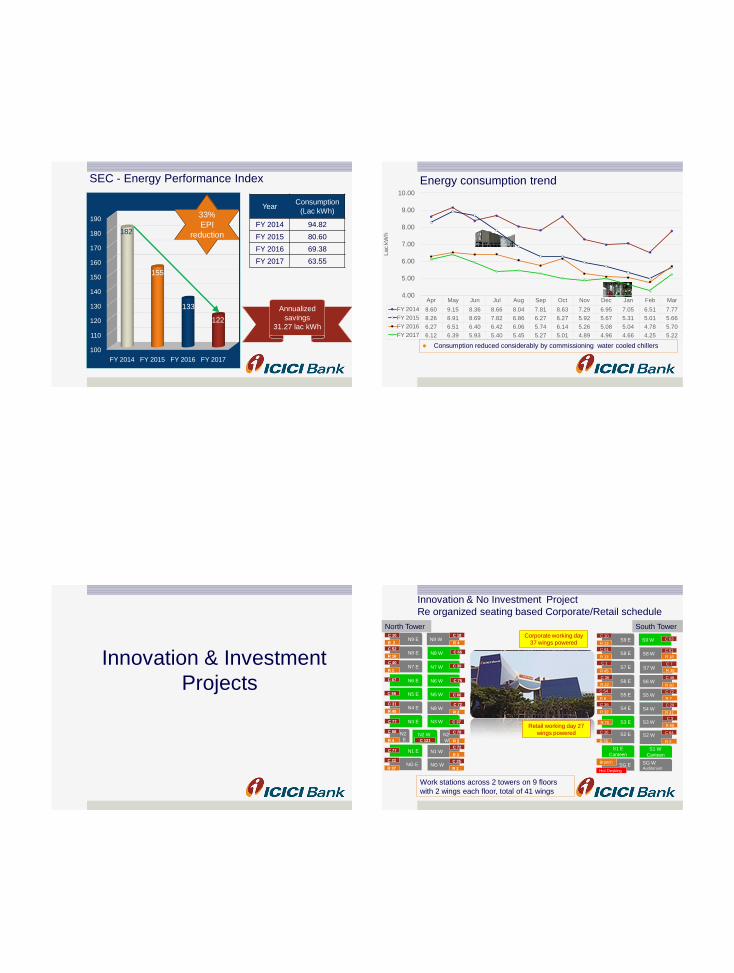
SEC - Energy Performance Index
YearConsumption
(Lac kWh)
FY 2014 94.82
FY 2015 80.60
FY 2016 69.38
FY 2017 63.55
100
110
120
130
140
150
160
170
180
190
FY 2014 FY 2015 FY 2016 FY 2017
182
155
133
122
33%
EPI
reduction
Annualized
savings
31.27 lac kWh
Apr May Jun Jul Aug Sep Oct Nov Dec Jan Feb Mar
FY 2014 8.60 9.15 8.36 8.66 8.04 7.81 8.63 7.29 6.95 7.05 6.51 7.77
FY 2015 8.26 8.91 8.69 7.82 6.86 6.27 6.27 5.92 5.67 5.31 5.01 5.66
FY 2016 6.27 6.51 6.40 6.42 6.06 5.74 6.14 5.26 5.08 5.04 4.78 5.70
FY 2017 6.12 6.39 5.93 5.40 5.45 5.27 5.01 4.89 4.96 4.66 4.25 5.22
4.00
5.00
6.00
7.00
8.00
9.00
10.00
Lac k
Wh
Energy consumption trend
Consumption reduced considerably by commissioning water cooled chillers
Innovation & Investment
Projects
S9 E S9 W
S8 E S8 W
S7 E S7 W
S6 E S6 W
S5 E S5 W
S4 E N4 W
S3 E S3 W
S2 E
S1 E
CanteenS1 W
Canteen
SG E SG W Auditorium
S2 W
C 63C 10
R 13
C 51C 61
R 13
C 7C 1
R 45
C 46
R 30
C 36
S4 W
C 72C 54
R 41
C 36
R 32
C 3
C 29
C 64
R 2
C 16
R 56
Branch
Hot Desking
R 76R 68
R 6 R 7
R 42
R 38
R 18
N9 E N9 W
N8 E N8 W
N7 E N7 W
N6 E N6 W
N5 E N5 W
N4 E N4 W
N3 E N3 W
N2
EN2 W
N1 E N1 W
NG E NG W
N2
W
C 18
R 4
C 10
R 2
C 66C 52
R 16
C 39C 40
R 1
C 75C 67
N8 W
C 66C 66
R 2
C 31
R 40
C 37C 77
C 72
C 25
R 2
C 22
R 37
C 78
R 2
C 88
R 4
C 72
R 3C 77
C 121
Innovation & No Investment Project
Re organized seating based Corporate/Retail schedule
Work stations across 2 towers on 9 floors
with 2 wings each floor, total of 41 wings
Corporate working day
37 wings powered
Retail working day 27
wings powered
North Tower South Tower

9/6/2017
5
Innovation & No Investment Project
Re organized seating based Corporate/Retail schedule
N9 E N9 W
N8 E N8 W
N7 E N7 W
N6 E N6 W
N5 E N5 W
N4 E
N3 E N3 W
N2
EN2 W
N1 E N1 W
NG E NG W
N2
W
C 22C 12
C 66C 68
C 39C 41
C 75C 67
N4 W
C 66C 66
C 31
R 40
C 37C 77
C 74
C 27C 22
R 37
C 80C 90
C 75C 77
C 121
S9 E S9 W
S8 E S8 W
S7 E S7 W
S6 E S6 W
S5 E S5 W
S4 E
S3 E S3 W
S2 E
S1 E
CanteenS1 W
Canteen
SG E SG W Auditorium
S2 W
C 63C 10
R 13
C 51C 61
R 13
R 46
C 46
R 30
C 36
S4 W
C 79C 60
C 70C 68
C 11
C 66R 72
Branch
Hot Desk
R 76
R 42
R 45
R 18
Corporate working day powered
33 instead of 38 wings
Retail working day
powered 12 instead of 27 wings
0.26 Lac kWh Annualized Savings
Working Saturday Saved 1100 kWh
North Tower South Tower
FY 2017 Innovation with No Investment Project
Hub Room AC Switched off
Pre Scenario
20 Hub rooms
24x7 Air conditioning provided
Switches designed to operate in temperature upto 42°C
Switches not required to be
accessed after office hours
Post Implementation
Switching off of hub room AC s
during night & holidays
Temperature does not exceeds beyond 26 °C due to residual
cooling
No impact what so ever on the IT
equipment
1.00 lac
kWh
Annualized
savings
No Investment Projects
FY 2017 No Investment Project
Chiller optimization Pre Scenario – manual
operation of chillers leading to
unwanted energy consumption
Post Implementation
Additional Chiller is auto
switched on/ off depending on
load
Set point increased at night time by 1 °C
Set points adjusted as per
seasonal variation
On Saturday set point increased by 1 °C
1.00 lac
kWh
Annualized
savings
9/6/2017
6
Energy efficient IT
equipment lead to
reduction of UPS load
Redeployed that UPS to
other required bank
location
FY 2017 No Investment Project
UPS optimization
0.10 lac
kWh
Annualized
savings
DescriptionPre
Scenario
Post
Scenario
UPS count &
Capacity
8 x 80
kVA
6 x 80
kVA
Load 12 to 23 % 40 to 45%
Efficiency 80% 90%
Pre Scenario
Load was distributed on 4
transformers of 1500 kVA
FY 2017 No Investment Project
Transformer optimization
Post Scenario
1 transformer switched off
Load redistributed on 3
transformers
On weekend the load is
redistributed on only 2
transformers
Equipment life enhanced
Fixed (iron) losses avoided
Weekend savings approx.
130 kWh/ day
No Investment / Innovation projects in 3 years
FY 2015 & FY 2016
• Rescheduling HVAC & lighting
• AHU filter cleaning
• AC Temperature at 24°C
• Remote shut down of computer
• Optimization & rationalization of UPS
• Employee awareness & participation drives
FY 2017
• Heat mapping & rationalization of seating & Hot desks
• Switch off of Hub room Ac’s
• Transformer optimization
• Lift stoppage on alternate floors by employee discipline
• Chiller load optimization
• UPS rationalization
• Sustenance of all the initiatives of FY 2015 & FY 2016
4.69 Lac
kWh
Savings
Innovation Projects with
Investment
9/6/2017
7
Innovative Project Auto Tube Cleaning System
Balls injected through condenser inlet, these balls descale the tubes
Impurities collected are discarded through condenser outlet
Innovative Project Auto Tube Cleaning System
Pre Project Scenario
With usage of water cooled
chillers there is fouling inside the
condenser tubes
Resulting in higher kW/ TR
Manual cleaning is difficult &
requires shut down of approx. 24
hours
Post implementation
ATCS is installed as a retrofit on
old chiller & it’s an integral part of
the chiller
Chiller efficiency is maintained
Investment
Projects
Electronically Commutated (EC) motors for AHUs
Features:-
• Low losses & hence 40% less input power to deliver same CFM
• Permits part load operations even at 10%
• Less noise & Elimination of VFD
• Smooth speed control
Planned Encon Project – 1 FY 2017

9/6/2017
8
FY 2017 Investment Project EC Blower
0
100
200
300
400
500
600
700
800
900
1000
971
388
Units consumed per day
Pre EC Post EC
motors
16 EC motors installed
60% drop in
consumption
0.08 Lac
kWh
Annualized
Savings
Tri-rotor water cooled chiller
Features:-
• Full & part load efficiencies are superior to twin rotor screw
technology
• Vastly reduces bearing loads
• Less moving parts – high reliability
• Very low inrush current
• Highly reliable operations even in worst operating conditions
• Specially designed environment friendly R-134a refrigerant
• Capacity control by VFD
Planned Encon Project – 2 for FY 2017
Pre Scenario
1320 TR air cooled & 500 TR
water cooled chillers
Centrifugal water cooled chiller
cannot work below 30% load
Tri-rotor Water Cooled Chiller contd…
Post installation scenario
Replaced chillers 2 air cooled
with 1 water cooled 550 TR
Installed capacity reduced from
1820 TR to 1670 TR
New Chiller kW/TR 0.69
ROI 2.9 years
Centrifugal Chiller
Tri-Rotor water cooled chiller
Tri-rotor water cooled chiller can
operate at 10% loads.
Better efficiency during low
loads
Tri-rotor Water Cooled Chiller contd…
5.00 Lac
kWh
Annualized
Savings

9/6/2017
9
Renewable energy
Renewable energy
PPA- FY 2017
38.48 Lac kWh Solar
generated
EB supplied
40% kWh
Key Highlights
Power Purchase agreement
Zero emissions / clean energy
60%
green
powered
20
IGBC Green Existing Building & Green Interiors
ICICI Bank Ltd., Corporate Office – BKC
Platinum 2016

9/6/2017
10
Green Building Aspects
Energy WaterEmployee comfort
Waste management
30000
32000
34000
36000
38000
40000
42000
44000
46000
48000
FY 2014
FY 2015
FY 2016
FY 2017
Kilo liters
Water meters for monitoring
120 KLD -STP
Aerators on all taps Waterless urinals
Cooling towers Gardening
Use of
STP
water
Water Conservation
17%
consumption
reduced
• Environmental Index (EI) is a
combination of Comfortable temperature : 24°C & acceptable CO2
limits : 1000 ppm
• It is controlled through equipment
based monitoring
• Periodic employee survey’s
conducted
Enhanced Employee Comfort Waste Management
Solid
• Paper
waste given
for
recycling
250kg/day
• Canteen
waste
disposed
separately
Liquid
• 120 kLD
STP water
used for
gardening
& cooling
tower
E-Waste
• Disposal
through
authorized
vendor
• Sensitivity
awareness
creation
amongst
users
Hazardous
• Battery –
Buyback
mechanism
• Oils/
lubricants –
Collected
by vendor

9/6/2017
11
Financial Year CO2 emission (Tons)
FY 2014 7775
FY 2015 6611
FY 2016 5964
FY 2017 5221
Key Highlights
• Energy Savings
• Renewable energy
utilization
• Launch of i-travel app
• Reduction in Air travel
extensive use of VC
• Awareness for PUC checks
of vehicles
4000
5000
6000
7000
8000
FY 2014
FY 2015
FY 2016
FY 2017
CO2 emission (Tons)
15 %
drop
GHG Emission Inventory & Certification Car Pooling App
iTravelSafe
app for
employees
Option to
share a car
or get a ride
Celebration of special events
Tips to celebrate “Green festivals” using natural variants and
reducing paper wastage
World Environment Week
9/6/2017
12
45
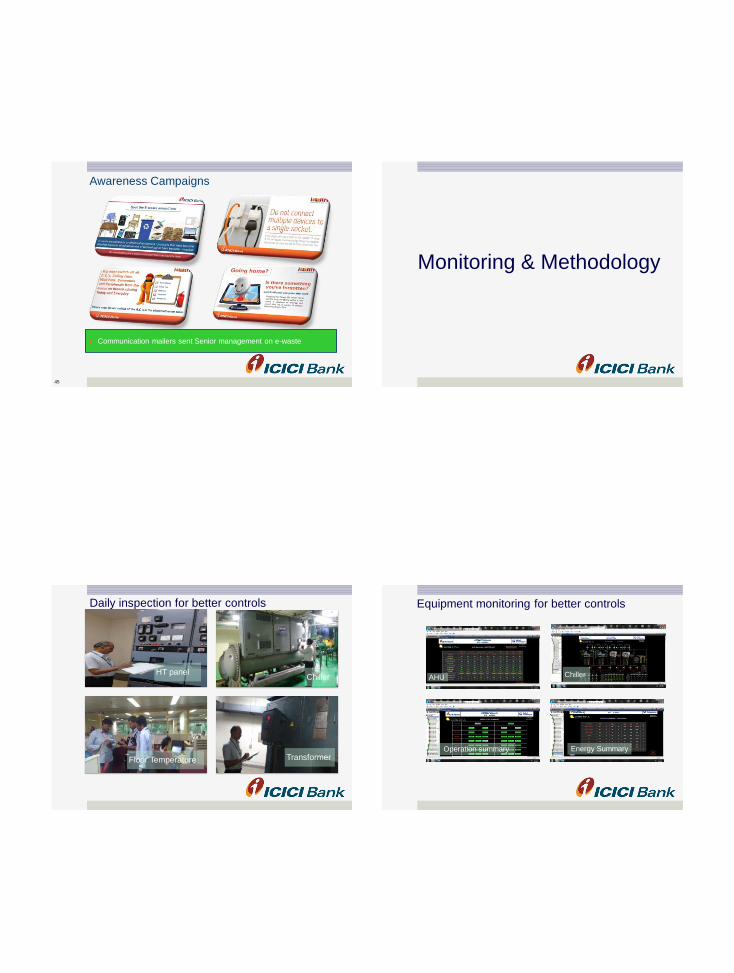
Awareness Campaigns
Communication mailers sent Senior management on e-waste
Monitoring & Methodology
Daily inspection for better controls
HT panelChiller
Floor Temperature Transformer
Equipment monitoring for better controls
AHU Chiller
Operation summary Energy Summary
9/6/2017
13
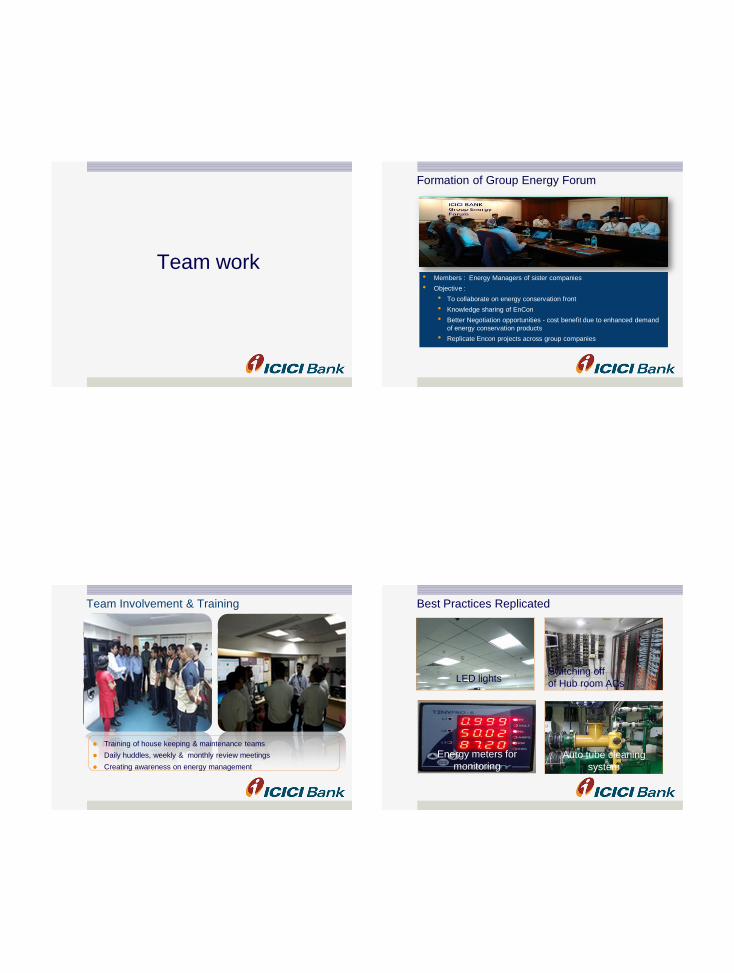
Team work
Formation of Group Energy Forum
• Members : Energy Managers of sister companies
• Objective :
• To collaborate on energy conservation front
• Knowledge sharing of EnCon
• Better Negotiation opportunities - cost benefit due to enhanced demand
of energy conservation products
• Replicate Encon projects across group companies
Team Involvement & Training
Training of house keeping & maintenance teams
Daily huddles, weekly & monthly review meetings
Creating awareness on energy management
Best Practices Replicated
Energy meters for
monitoringAuto tube cleaning
system
Switching off
of Hub room ACsLED lights

9/6/2017
14
Hot Desk
Comfort Temperature Filter Cleaning
IAQ monitoring
Best Practices Replicated
54
Awards & Accolades
Year Name of AwardOrganized
byType
2007National Awards for Excellence in Energy
Management 2007CII
Excellent Energy
Efficient Unit
2015National Awards for Excellence in Energy
Management 2015CII
Excellent Energy
Efficient Unit
2015National Awards for Excellence in Energy
Management 2015CII
Most Useful
Presentation
2016 10th State level Energy Conservation Awards MEDA 1st Rank
2016National Awards for Excellence in Energy
Management 2016CII
Excellent Energy
Efficient Unit
2016National Awards for Excellence in Energy
Management 2016CII
Most Useful
Presentation
2016 EE Foundation Global Environment Awards 2016 EEF Gold Award
2016Safety, Health & Environment Awards
( Western Region )CII Gold Award
Summary En Con Projects in 3 years
No Investment / Innovation Projects
• Rescheduling HVAC & lighting
• AHU filter cleaning
• Temperature control AC 24°C
• Remote shut down of computers
• Optimization & rationalization of UPS & Transformer
• Heat mapping & reallocation of seating, Hot desk provided
• Switching off of ACs in HUB rooms
• Chiller sequencing & load optimization
Investment / Innovation projects
• Tri rotor water cooled chiller
• Auto tube cleaning system
• Electronically Commutated motors for AHU
• Dual Coil AHU
• Replacement of FTL with LEDs
• Water pump replacement
• Replacement of HVAC pumps
• Use of motion sensors
• Water cooled chiller with use of STP water
33% Saved
31.37 kWh
9/6/2017
15
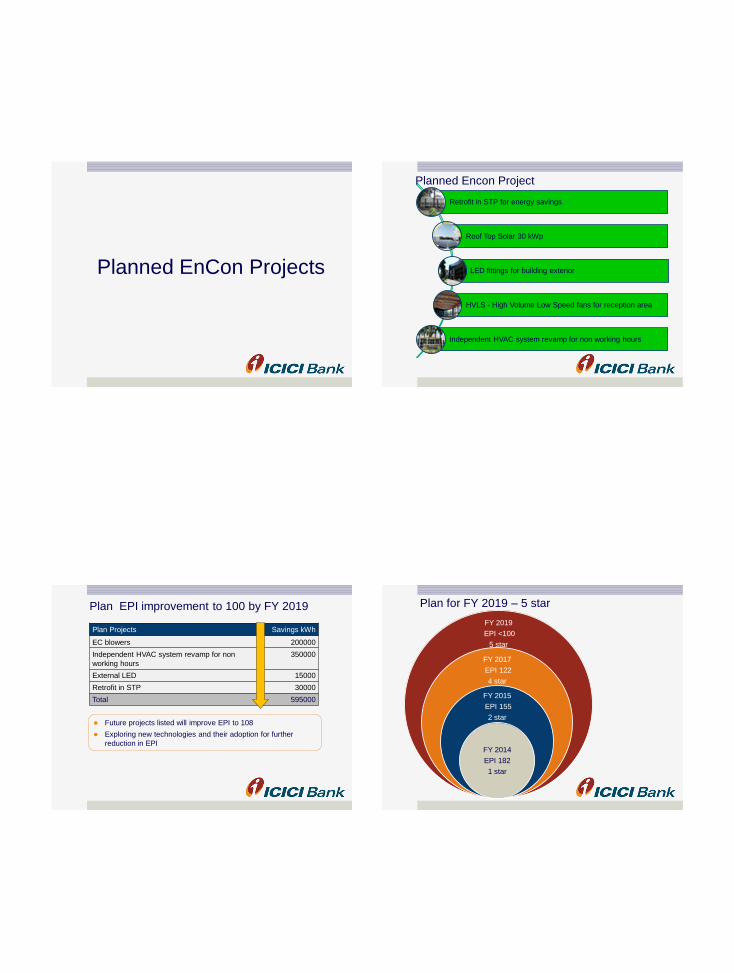
Planned EnCon Projects
Retrofit in STP for energy savings
Roof Top Solar 30 kWp
LED fittings for building exterior
HVLS - High Volume Low Speed fans for reception area
Independent HVAC system revamp for non working hours
Planned Encon Project
Plan EPI improvement to 100 by FY 2019
Future projects listed will improve EPI to 108
Exploring new technologies and their adoption for further
reduction in EPI
Plan Projects Savings kWh
EC blowers 200000
Independent HVAC system revamp for non
working hours
350000
External LED 15000
Retrofit in STP 30000
Total 595000
Plan for FY 2019 – 5 star
FY 2019
EPI <100
5 star
FY 2017
EPI 122
4 star
FY 2015
EPI 155
2 star
FY 2014
EPI 182
1 star

9/6/2017
16
Thank You