powerpoint presentation management... · your buying power would be reduced to $10,000 you would...
TRANSCRIPT

SFC/US/45665/6.13/V4/07SEC419-12

SFC/US/45665/6.13/V4/07SEC419-12
An investor should carefully consider a fund’s risks, investment objectives, charges, and expenses before
investing. The prospectus contains this and other information about the fund. You can obtain a prospectus
from your PFSI Registered Representative. Please read and consider the prospectus carefully before
investing.
Investing in mutual funds entails some risk. Investment return and principal may fluctuate. Shares, when
redeemed, may be worth more or less than their original value.
Investments Offered By:
PFS Investments Inc.
1 Primerica Parkway
Duluth, GA 30099-0001
470-381-1000
NOTE TO REGISTERED REPRESENTATIVE: You must use the speaker’s notes included with this presentation.
Also, this presentation should accompany the client-approved Asset Management Brochure (Item #A8864).
Primerica and PFS Investments are affiliated companies.

SFC/US/45665/6.13/V4/07SEC419-12
Let Primerica help you make the most of your money.
• In business since 1977
• More than 2 million clients maintain investment accounts with us
• Investment clients have more than $40 billion in asset values in their PFSI investment accounts
Primerica refers to Primerica and its affiliated companies.

SFC/US/45665/6.13/V4/07SEC419-12
Most People Don’t Plan to Fail, They Fail to Plan.

SFC/US/45665/6.13/V4/07SEC419-12
Today’s Financial Challenges
… Six of every 10 workers “always” or “usually” live paycheck to paycheck. — finance.yahoo.com, viewed June 28, 2011
57% of Americans polled reported that they have less than $25,000 saved for retirement. — 2013 Retirement Confidence Survey
Only 13% of workers surveyed said they were “very confident” about having enough money to live comfortably through retirement. — 2013 Retirement Confidence Survey
Instead of doing a systematic calculation, 54% of workers continue to guess at how much they will need to accumulate for retirement. — 2013 Retirement Confidence Survey
How do you feel about your current financial situation?

SFC/US/45665/6.13/V4/07SEC419-12
Pay Yourself First!
1. Put yourself at the head of the line. • Rule of thumb: save 10% of your income
• Treat it as a bill that you owe to yourself and your family
2. Set up a complete savings program with three accounts. Account Purpose 1. Emergency Fund Cover unforeseen expenses 2. Short-Term Savings Vacation, new computer, etc... 3. Long-Term Savings Retirement, college, etc...
Do you have a program in place for a comfortable retirement?

SFC/US/45665/6.13/V4/07SEC419-12
How Most People Save
You invest $10,000 at a four percent rate of return with your local bank ...
You earn interest for the year: $400
But you pay $100 in taxes on that interest at 25%*: -$100
So your net earnings are: $300
Your resulting balance would be: $10,300
...but if inflation is 3%, your buying power would be reduced to $10,000
You would have actually earned no gain to your purchasing power!
*The 25% tax bracket is hypothetical and your tax bracket may be different. If your tax bracket is not 25%, the results will vary.
Can you afford a guarantee?

SFC/US/45665/6.13/V4/07SEC419-12
Become an Owner, Not a Loaner
Savings Accounts, CDs, Cash Value Life Insurance =
Historically Low Rates of Return
CDs and savings accounts are generally FDIC insured up to $250,000. The $250,000 limit expires December 31, 2013.
Your Money Global
Economy

SFC/US/45665/6.13/V4/07SEC419-12
The Rule of 72
72 ÷ 12% 6 Years
72 ÷ 4% 18 Years
72 ÷ 6% 12 Years
This simple calculation (72 ÷ the interest rate) gives you the approximate
number of years it will take to double your savings:
This table serves as a demonstration of how the Rule of 72 concept works from a mathematical standpoint. It is a hypothetical and is only an approximation of accumulations. It is not intended to represent any specific savings vehicle. The chart uses constant rates of return, unlike actual investments which will fluctuate in value. It does not include fees or taxes, which would lower performance.
SFC/US/45665/6.13/V4/07SEC419-12
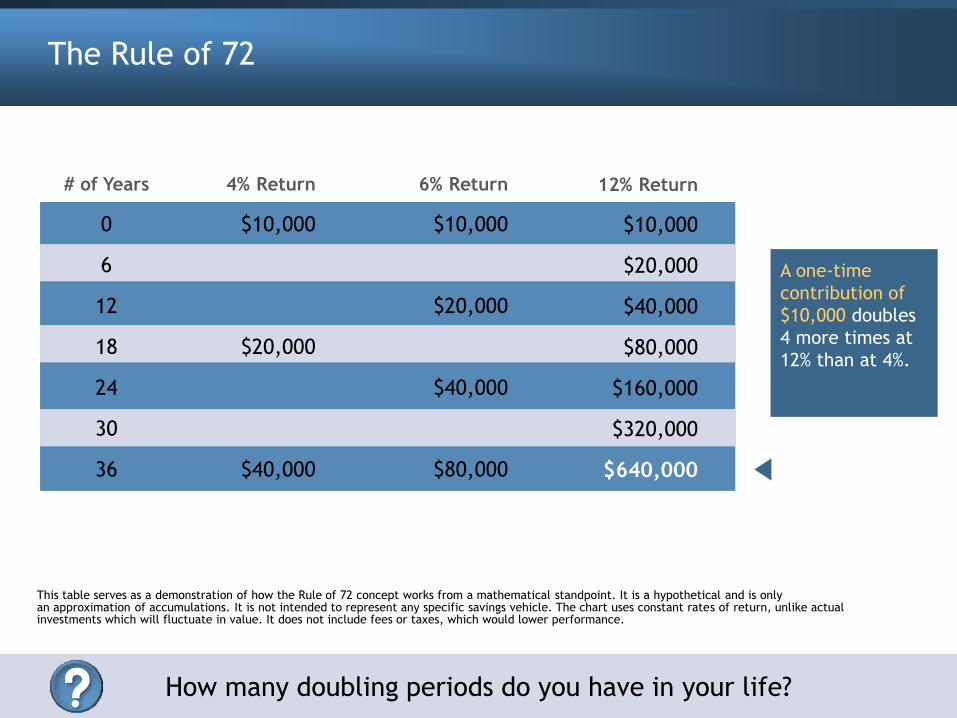
The Rule of 72
# of Years 4% Return
0 $10,000
6
12
18 $20,000
24
30
36 $40,000
This table serves as a demonstration of how the Rule of 72 concept works from a mathematical standpoint. It is a hypothetical and is only an approximation of accumulations. It is not intended to represent any specific savings vehicle. The chart uses constant rates of return, unlike actual investments which will fluctuate in value. It does not include fees or taxes, which would lower performance.
A one-time
contribution of
$10,000 doubles
4 more times at
12% than at 4%.
6% Return
$10,000
$20,000
$40,000
$80,000
12% Return
$10,000
$20,000
$40,000
$80,000
$160,000
$320,000
$640,000
How many doubling periods do you have in your life?

SFC/US/45665/6.13/V4/07SEC419-12
Rate of Return Is the Key
Growth of a $10,000 Investment (December 31, 1982 to December 31, 2012)
Investing in mutual funds may be a very good way!
What kind of return do you need to reach your goals?
How can you invest to reach them?
S&P 500
Total Return 10.80% $217,197
Bonds 8.10% $103,534
30 Day T-Bills 4.29% $35,337
U.S. Inflation 2.91% $23,642
Source: Morningstar. Past performance is no guarantee of future results. This chart is for illustrative purposes and does not represent an actual investment. Further, the returns do not reflect the
past or future performance of any specific investment. All investments involve risk including loss of principal. The figures in the chart above assume reinvestments of dividends. They do not reflect
any fees, expenses or tax consequences, which would lower results. Because these indices are not managed portfolios, there are no advisory fees or internal management expenses reflected in their
performance. Investors cannot invest directly in any index. Government bonds and Treasury bills are guaranteed by the full faith and credit of the United States government as to the timely payment
of principal and interest, while stocks are not guaranteed and have been more volatile than other asset classes. As interest rates rise, bond prices fall.
The figures represent an initial investment of $10,000. The Standard & Poor’s 500®, which is an unmanaged group of securities, is considered to be representative of the stock market in general. Bonds are
represented by the Barclays Capital Aggregate Bond Index is an intermediate term market capitalization — weighted index, meaning the securities in the index are weighted according to the market size of
each bond type. Most U.S. traded investment grade bonds are represented. Municipal bonds and treasury inflation-protected securities are excluded, due to tax treatment issues. The index includes treasury
securities, government agency bonds, mortgage-backed bonds, corporate bonds, and a small amount of foreign bonds traded in U.S. The U.S. 30-Day T-bills are government backed short-term investments
considered to be risk-free and as good as cash because the maturity is only one month and are represented by the IA SBBI US 30 Day TBill TR index. Inflation history is represented by the IA SBBI US Inflation
index. Small Company Stocks – Dimensional Fund Advisors, Inc. (DFA) U.S. Micro Cap Portfolio; Large Company Stocks – Standard & Poor’s 500 ©, which is an unmanaged group of securities, is considered to be
representative of the stock market in general; Long-Term Government Bonds – 20-year U.S Government Bond; Treasury Bills – 30-Day U.S. Treasury Bill; International Stocks – Morgan Stanley Capital
International Europe, Australasia, and Far East (EAFE) Index.

SFC/US/45665/6.13/V4/07SEC419-12
Think Long Term
Look at the record of positive results over calendar periods, from January 1, 1943 through December 31, 2012.
These rolling time periods begin January 1, 1943 with each subsequent time period beginning again January of the following year. The final rolling periods of each are as follows: 1-Year Periods (January 1, 2012 – December 31, 2012); 3-Year Periods (January 1, 2010 – December 31, 2012); 5-Year Periods (January 1, 2008 – December 31, 2012); 10-Year Periods (January 1, 2003 – December 31, 2012); and 20-Year Periods (January 1, 1993 – December 31, 2012).
Source: Morningstar. Past performance is no guarantee of future results. This chart is for illustrative purposes and does not represent an actual investment. The returns do not reflect the past or future performance of any specific investment. All investments involve risk including loss of principal. The figures in the chart above assume reinvestments of dividends. They do not reflect any fees, expenses or tax consequences, which would lower results. The Standard & Poor’s 500®, which is an unmanaged group of securities, is considered to be representative of the stock market in general. The data assumes reinvestment of all income and does not account for taxes or transaction costs. Because these indices are not managed portfolios, there are no advisory fees or internal management expenses reflected in their performance and investors cannot invest directly in any index.
1-Year Periods
55 Positive periods
15 Negative periods
3-Year Periods
60 Positive periods
8 Negative periods
5-Year Periods
59 Positive periods
7 Negative periods
10-Year Periods
59 Positive periods
2 Negative periods
20-Year Periods
51 Positive periods
0 Negative periods
What has been your experience in the market?
SFC/US/45665/6.13/V4/07SEC419-12
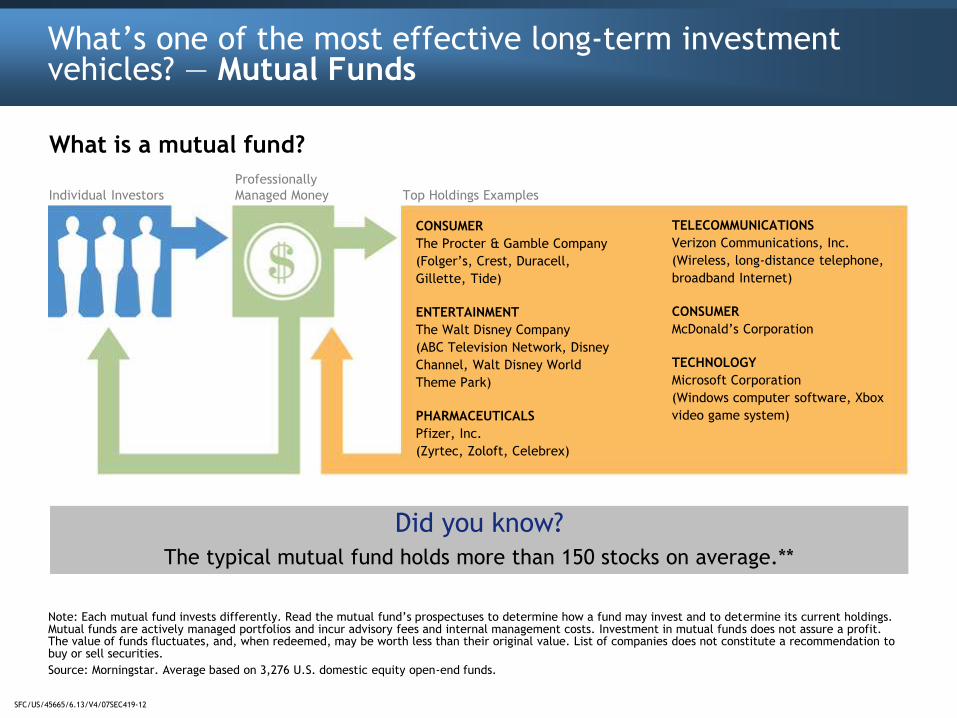
What’s one of the most effective long-term investment vehicles? — Mutual Funds
What is a mutual fund?
Note: Each mutual fund invests differently. Read the mutual fund’s prospectuses to determine how a fund may invest and to determine its current holdings. Mutual funds are actively managed portfolios and incur advisory fees and internal management costs. Investment in mutual funds does not assure a profit. The value of funds fluctuates, and, when redeemed, may be worth less than their original value. List of companies does not constitute a recommendation to buy or sell securities.
Source: Morningstar. Average based on 3,276 U.S. domestic equity open-end funds.
Did you know?
The typical mutual fund holds more than 150 stocks on average.**
Professionally
Individual Investors Managed Money Top Holdings Examples
CONSUMER
The Procter & Gamble Company
(Folger’s, Crest, Duracell,
Gillette, Tide)
ENTERTAINMENT
The Walt Disney Company
(ABC Television Network, Disney
Channel, Walt Disney World
Theme Park)
PHARMACEUTICALS
Pfizer, Inc.
(Zyrtec, Zoloft, Celebrex)
TELECOMMUNICATIONS
Verizon Communications, Inc.
(Wireless, long-distance telephone,
broadband Internet)
CONSUMER
McDonald’s Corporation
TECHNOLOGY
Microsoft Corporation
(Windows computer software, Xbox
video game system)

SFC/US/45665/6.13/V4/07SEC419-12
Mutual funds earn money three ways:
1. Dividends
2. Capital Gains
3. Capital Appreciation
Should any of these be earned, they may be subject to taxation. Also note that the value of a fund may fluctuate.

SFC/US/45665/6.13/V4/07SEC419-12
5 Great Reasons to Own a Mutual Fund:
1. Professional money management
2. Diversification of assets
3. Growth potential
4. Affordability
5. Liquidity
Mutual funds are not guaranteed against a loss. Mutual funds also have costs and fees that are attributable to management and distribution.

SFC/US/45665/6.13/V4/07SEC419-12
A Tale of Five Investors
1. $10,000 invested August 31, 1987
2. Market crash in October 1987
3. Each investor left with $7,674
How did they react?
SFC/US/45665/6.13/V4/07SEC419-12
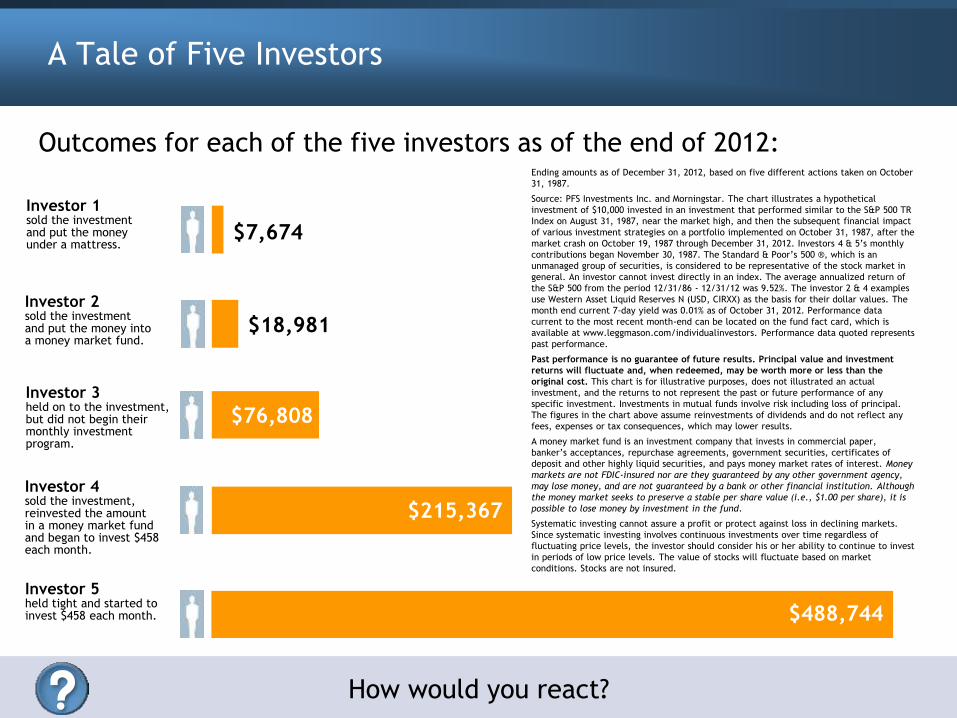
A Tale of Five Investors
Ending amounts as of December 31, 2012, based on five different actions taken on October
31, 1987.
Source: PFS Investments Inc. and Morningstar. The chart illustrates a hypothetical
investment of $10,000 invested in an investment that performed similar to the S&P 500 TR
Index on August 31, 1987, near the market high, and then the subsequent financial impact
of various investment strategies on a portfolio implemented on October 31, 1987, after the
market crash on October 19, 1987 through December 31, 2012. Investors 4 & 5’s monthly
contributions began November 30, 1987. The Standard & Poor’s 500 ®, which is an
unmanaged group of securities, is considered to be representative of the stock market in
general. An investor cannot invest directly in an index. The average annualized return of
the S&P 500 from the period 12/31/86 - 12/31/12 was 9.52%. The investor 2 & 4 examples
use Western Asset Liquid Reserves N (USD, CIRXX) as the basis for their dollar values. The
month end current 7-day yield was 0.01% as of October 31, 2012. Performance data
current to the most recent month-end can be located on the fund fact card, which is
available at www.leggmason.com/individualinvestors. Performance data quoted represents
past performance.
Past performance is no guarantee of future results. Principal value and investment
returns will fluctuate and, when redeemed, may be worth more or less than the
original cost. This chart is for illustrative purposes, does not illustrated an actual
investment, and the returns to not represent the past or future performance of any
specific investment. Investments in mutual funds involve risk including loss of principal.
The figures in the chart above assume reinvestments of dividends and do not reflect any
fees, expenses or tax consequences, which may lower results.
A money market fund is an investment company that invests in commercial paper,
banker’s acceptances, repurchase agreements, government securities, certificates of
deposit and other highly liquid securities, and pays money market rates of interest. Money
markets are not FDIC-insured nor are they guaranteed by any other government agency,
may lose money, and are not guaranteed by a bank or other financial institution. Although
the money market seeks to preserve a stable per share value (i.e., $1.00 per share), it is
possible to lose money by investment in the fund.
Systematic investing cannot assure a profit or protect against loss in declining markets.
Since systematic investing involves continuous investments over time regardless of
fluctuating price levels, the investor should consider his or her ability to continue to invest
in periods of low price levels. The value of stocks will fluctuate based on market
conditions. Stocks are not insured.
$18,981
Investor 2 sold the investment and put the money into a money market fund.
$76,808 Investor 3 held on to the investment, but did not begin their monthly investment program.
$215,367
Investor 4 sold the investment, reinvested the amount in a money market fund and began to invest $458 each month.
$488,744
Investor 5 held tight and started to invest $458 each month.
Outcomes for each of the five investors as of the end of 2012:
How would you react?
$7,674
Investor 1 sold the investment and put the money under a mattress.

SFC/US/45665/6.13/V4/07SEC419-12
It’s time, not timing, that matters
$10,000 investment for 20 years during worst times vs. best times
$10,000 investments are made immediately following market high (or market low) month-end date.
Example: In the market high scenario, the first $10,000 contribution is made immediately following the last trading day of the month.
*January dates denoted with an asterisk indicate the $10,000 was invested immediately prior to the first trading day of the year (January).
Source: Morningstar. Past performance is no guarantee of future results. This chart is for illustrative purposes and does not represent an actual investment but instead the performance of the S&P 500. The returns do not reflect the past or future performance of any specific investment. All investments involve risk including loss of principal. The figures in the chart above assume reinvestments of dividends and do not reflect any fees, expenses or tax consequences.
The Standard & Poor’s 500®, which is an unmanaged group of securities, is considered to be representative of the stock market in general. The data assumes reinvestment of all income and does not account for taxes or transaction costs which may lower results. Because these indices are not managed portfolios, there are no advisory fees or internal management expenses reflected in their performance and investors cannot invest directly in any index.
Invest Near Market Highs
Date Cumulative Account
Investment Value Dec. 31
Dec 93 $10,000 $10,000
Aug 94 $20,000 $19,887
Dec 95 $30,000 $37,331
Nov 96 $40,000 $55,749
Dec 97 $50,000 $84,345
Dec 98 $60,000 $118,450
Dec 99 $70,000 $153,374
Aug 00 $80,000 $148,141
Jan 01 $90,000 $139,043
Mar 02 $100,000 $116,082
Dec 03 $110,000 $159,380
Dec 04 $120,000 $186,724
Dec 05 $130,000 $205,895
Dec 06 $140,000 $248,415
Oct 07 $150,000 $281,578
Jan 08* $160,000 $177,400
Dec 09 $170,000 $234,348
Dec 10 $180,000 $279,649
Apr 11 $190,000 $294,918
Sep 12 $200,000 $352,078
Annualized Compound Return
(Dec 31, 1993 - Dec. 31, 2012):
+8.15%
Invest Near Market Lows
Date Cumulative Account
Investment Value Dec. 31
Jan 93* $10,000 $10,999
Mar 94 $20,000 $31,675
Jan 95* $30,000 $53,531
Jan 96* $40,000 $75,883
Jan 97* $50,000 $101,196
Aug 98 $60,000 $153,023
Jan 00* $70,000 $185,222
Nov 00 $80,000 $178,407
Sep 01 $90,000 $168,271
Sep 02 $100,000 $141,926
Feb 03 $110,000 $206,052
Jan 04* $120,000 $228,475
Apr 05 $130,000 $260,626
Jan 06* $140,000 $301,790
Feb 07 $150,000 $328,970
Nov 08 $160,000 $217,365
Feb 09 $170,000 $290,345
Jun 10 $180,000 $346,408
Sep 11 $190,000 $374,905
Jan 12* $200,000 $434,903
Annualized Compound Return
(Dec 31, 1993 - Dec. 31, 2012):
+8.25%
Do you see the importance of time in the market vs. timing?

SFC/US/45665/6.13/V4/07SEC419-12
Unem
plo
ym
ent
reaches
9.7
%
Gre
ece B
ailout
Mort
gage f
ore
clo
sure
s sp
ike
Asi
an t
sunam
i st
rikes
Terr
ori
sts
att
ack A
meri
ca
Asi
a s
uff
ers
wid
esp
read f
inancia
l cri
sis
Okla
hom
a C
ity b
om
bin
g k
ills
168 p
eople
Bosn
ian w
ar
begin
s
Dow
dro
ps
190 p
oin
ts o
n O
cto
ber
13,
second w
ors
t dro
p in h
isto
ry
U.S
. bom
bs
Lib
ya
Double
-dig
it u
nem
plo
ym
ent
Ris
ing g
as
pri
ces
U.S
. in
vades
Iraq
Technolo
gy s
tock b
ubble
burs
ts
Milit
ant
Taliban leaders
take K
abul
Fed r
ais
es
inte
rest
rate
s si
x t
imes
U.S
. ente
rs G
ulf
War
to lib
era
te K
uw
ait
Junk b
ond d
eale
r M
ichael M
ilken c
harg
ed w
ith insi
der
tradin
g
U.S
. fa
ces
record
budget
defi
cit
s
Invest with your head, not the headlines
This chart illustrates an investment in the S&P 500 total return index. An investor cannot invest directly in an index. See endnotes 1 and 2 for further details.
Fis
cal Cliff
Double
-dig
it J
ob L
oss
Ris
ing G
as
Pri
ces
Iraq Invaded
Tech S
tocks
Fall
Taliban T
ake K
abul
Inte
rest
Rate
Hik
es
Pers
ian G
ulf
War
Insi
der
Tradin
g
Budget
Defi
cit
There have been plenty of reasons not to invest in the stock market over the years, but for the long-term investors, the results have generally been positive over time.
If you invested $10,000 in the stock market on December 31,
1982 and left it in the market, even when the news was bad…
30 years later (December 31, 2012), your investment would have
grown to $217,197 (10.80% average annual total return).
$217,1
97

SFC/US/45665/6.13/V4/07SEC419-12
Source: Morningstar. Past performance is no guarantee of future results. This chart illustrates a hypothetical investment of $10,000 in an investment which performed similarly to the S&P 500 total return index. Dates reflected are from January 1 through December 31 of each year, respectively. This chart is for illustrative purposes and does not represent an actual investment. The returns do not reflect the past or future performance of any specific investment. All investments involve risk including loss of principal. The figures in the chart above assume reinvestments of dividends. They do not reflect any fees, expenses or tax consequences, which would lower results. The Standard & Poor’s 500®, which is an unmanaged group of securities, is considered to be representative of the stock market in general. The data assumes reinvestment of all income and does not account for taxes or transaction costs which may lower results. Because these indices are not managed portfolios, there are no advisory fees or internal management expenses reflected in their performance and investors cannot invest directly in any index. See next slide for additional notes.
Invest with your head, not the headlines
Average Annual Total Return: 10.80%
2003 2004 2005 2006 2007 2008 2009 2010 2011 2012
$ Market Value 140,749 156,065 163,731 189,591 217,197 126,209 159,356 183,361 187,233 217,197
Total % Return 28.68 10.88 4.91 15.79 5.49 -37.00 26.46 15.06 2.11 16.00
Events Iraq Asian Hurricane Rising Gas Mortgage Financial Double-digit Greece EU Debt Fiscal Invaded Tsunami Katrina Prices Crisis Crisis Job Loss Bailout Crisis Cliff
1983 1984 1985 1986 1987 1988 1989 1990 1991 1992
$ Market Value 12,256 13,024 17,157 20,359 21,428 24,987 32,904 31,883 41,596 44,765
Total % Return 22.56 6.27 31.73 18.67 5.25 16.61 31.69 -3.10 30.47 7.62
Events Massive Iran/Iraq Budget Libya Black Insider Market Airline Persian Bosnian Layoffs War Deficit Bombed Monday Trading Crash Bankruptcy Gulf War War
Do you see how, over time, you can achieve your investing goals regardless of the headlines?
1993 1994 1995 1996 1997 1998 1999 2000 2001 2002
$ Market Value 49,277 49,928 68,690 84,641 112,640 144,831 175,305 159,345 140,405 109,375
Total % Return 10.08 1.32 37.58 22.96 33.36 28.58 21.04 -9.10 -11.89 -22.10
Events WTC Interest Oklahoma Budget Taliban Asian Y2K Tech Terrorism Accounting Bombing Rate Hikes City Bombing Crisis Take Kabul Market Crash Fears Stocks Fall Attack Scandals

SFC/US/45665/6.13/V4/07SEC419-12
Invest with your head, not the headlines
1. The figures represent an initial investment of $10,000. The Standard & Poor’s 500®, which is an unmanaged group of securities, is considered to be representative of the stock market in general. Bonds are represented by the Barclays Capital Aggregate Bond Index is an intermediate term market capitalization — weighted index, meaning the securities in the index are weighted according to the market size of each bond type. Most U.S. traded investment grade bonds are represented. Municipal bonds and treasury inflation-protected securities are excluded, due to tax treatment issues. The index includes treasury securities, government agency bonds, mortgage-backed bonds, corporate bonds, and a small amount of foreign bonds traded in U.S. The U.S. 30-Day T-bills are government backed short-term investments considered to be risk-free and as good as cash because the maturity is only one month. Morningstar collects yields on the T-bill on a weekly basis from The Wall Street Journal. Treasury Bills are secured by the full faith and credit of the U.S. Government and offer a fixed rate of return, while an investment in the stock market offers no such guarantee. Inflation history is gathered from the Ibbotson Stocks, Bonds, Bills and Inflation module.
2. An investment such as stocks represented by the S&P Index may not be appropriate for an investor seeking a short-term investment or who is unwilling to experience the volatility, including the potential loss of principal. Source: PFS Investments Inc. and Morningstar. The chart above illustrates a hypothetical investment of $10,000 invested in the S&P 500 TR Index on August 31, 1987, near the market high, and then the subsequent financial impact of various investment strategies on a portfolio implemented on October 31, 1987, after the market crash on October 19,1987 through December 31, 2012. Investors 4 & 5’s monthly contributions began November 30, 1987. The Standard & Poor’s 500®, which is an unmanaged group of securities, is considered to be representative of the stock market in general. An investor cannot invest directly in an index. Systematic investing cannot assure a profit or protect against loss in declining markets. Since systematic investing involves continuous investments over time regardless of fluctuating price levels, the investor should consider his or her ability to continue to invest in periods of low price levels. A money market fund is an investment company that invests in commercial paper, banker’s acceptances, repurchase agreements, government securities, certificates of deposit and other highly liquid securities, and pays money market rates of interest. Money markets are not FDIC-insured, may lose money, and are not guaranteed by a bank or other financial institution. Although the money market seeks to preserve a stable per share value (i.e., $1.00 per share), it is possible to lose money by investment in the fund. Principal value and investment returns will fluctuate and, when redeemed, may be worth more or less than the original investment amount.
3. An investment such as stocks represented by the S&P Index may not be appropriate for an investor seeking a short-term investment or who is unwilling to experience the volatility, including the potential loss of principal. The Standard & Poor’s 500®, which is an unmanaged group of securities, is considered to be representative of the stock market in general. The data assumes reinvestment of all income and does not account for taxes or transaction costs. Because these indices are not managed portfolios, there are no advisory fees or internal management expenses reflected in their performance and investors cannot invest directly in any index.
Government bonds and Treasury bills are guaranteed by the full faith and credit of the United States government as to the timely payment of principal and interest, while stocks are not guaranteed and have been more volatile than the other asset classes. Furthermore, small company stocks are more volatile than large company stocks and are subject to significant price fluctuations, business risks and are thinly traded. International investments involve special risks such as fluctuations in currency, foreign taxation, economic and political risks, liquidity risks and differences in accounting and financial standards. The data assumes reinvestment of all income and does not account for taxes or transaction costs. Because these indices are not managed portfolios, there are no advisory fees or internal management expenses reflected in their performance and investors cannot invest directly in any index.

SFC/US/45665/6.13/V4/07SEC419-12
Systematic Investing: A Proven Method
• Two investors • $100/month • Different Markets
Which example would you prefer?
Month 1 Month 2 Month 3 Month 4 Month 5 Month 6
$20 18 16 14 12 10 8 6 4 2 0
Share
Pri
ce
A
Investor A
Systematic Investing allows you to use dollar-cost averaging to build wealth over the long term.
Investor A
invests $100 a month in a rising market.
Investor B
B
Investor B
invests $100 a month in a fluctuating market.
Dollar-cost averaging is a technique for lowering the average cost per share over time. While a continuous program of dollar-cost averaging can reduce cost per share over time, it cannot
assure a profit or protect against loss in declining markets. Since dollar-cost averaging involves continuous investments over time, the investor should consider his or financial ability to
continue purchases through low price levels. The values shown are hypothetical, not intended to reflect any specific market period but to demonstrate the effect of a fluctuating market.
SFC/US/45665/6.13/V4/07SEC419-12
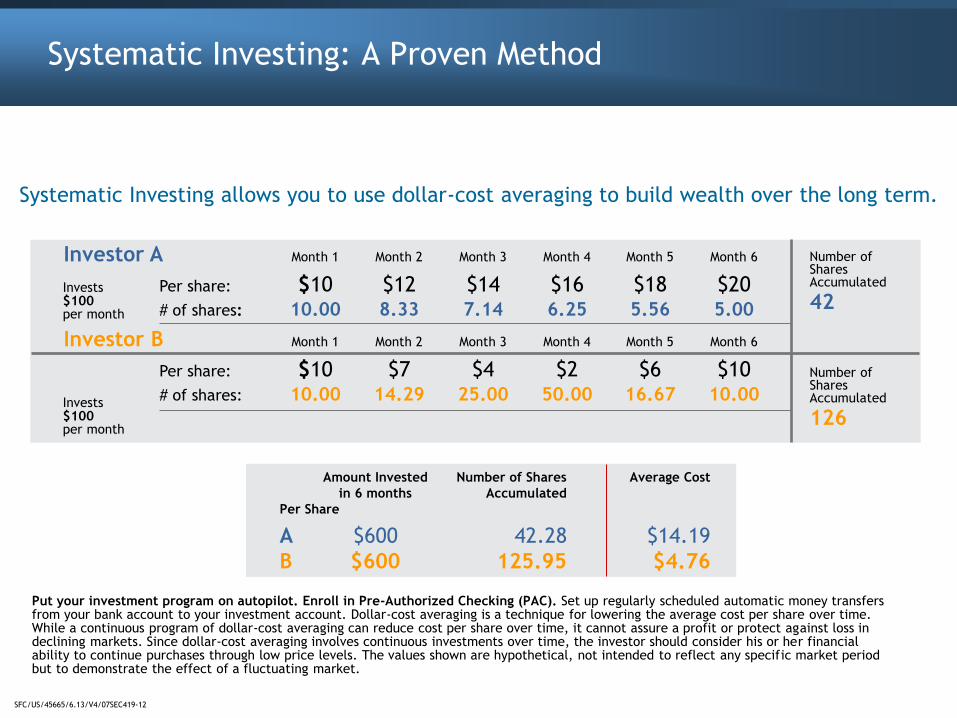
Systematic Investing: A Proven Method
Put your investment program on autopilot. Enroll in Pre-Authorized Checking (PAC). Set up regularly scheduled automatic money transfers from your bank account to your investment account. Dollar-cost averaging is a technique for lowering the average cost per share over time. While a continuous program of dollar-cost averaging can reduce cost per share over time, it cannot assure a profit or protect against loss in declining markets. Since dollar-cost averaging involves continuous investments over time, the investor should consider his or her financial ability to continue purchases through low price levels. The values shown are hypothetical, not intended to reflect any specific market period but to demonstrate the effect of a fluctuating market.
Systematic Investing allows you to use dollar-cost averaging to build wealth over the long term.
Investor A Month 1 Month 2 Month 3 Month 4 Month 5 Month 6
Per share: $10 $12 $14 $16 $18 $20 # of shares: 10.00 8.33 7.14 6.25 5.56 5.00
Investor B Month 1 Month 2 Month 3 Month 4 Month 5 Month 6
Per share: $10 $7 $4 $2 $6 $10 # of shares: 10.00 14.29 25.00 50.00 16.67 10.00
Invests $100 per month
Invests $100 per month
Number of Shares Accumulated
42
Number of Shares Accumulated
126
Amount Invested Number of Shares Average Cost
in 6 months Accumulated
Per Share
A $600 42.28 $14.19
B $600 125.95 $4.76

SFC/US/45665/6.13/V4/07SEC419-12
Diversification is a time-tested principle.
Spread out your investment dollars to protect against market risk.
Source: Morningstar. Past performance is no guarantee of future results. This chart is for illustrative purposes only and does not represent an actual investment or the performance of any specific investment. All investments involve risk including loss of principal. Small Company Stocks—Russell 2000 Index; Large Company Stocks—Standard & Poor’s 500®, which is an unmanaged group of securities, is considered to be representative of the stock market in general; Long-Term Government Bonds—20-year U.S. Government Bond; Treasury Bills—30-day U.S. Treasury Bill; International Stocks—Morgan Stanley Capital International Europe, Australasia, and Far East (EAFE) Index. Government bonds and Treasury bills are guaranteed by the full faith and credit of the United States government as to the timely payment of principal and interest, while stocks are not guaranteed and have been more volatile than the other asset classes. As interest rates rise, bond prices fall. Bond funds do not carry the same guarantees as bonds themselves. Furthermore, small company stocks are more volatile than large company stocks and are subject to significant price fluctuations, business risks and are thinly traded. International investments involve special risks such as fluctuations in currency, foreign taxation, economic and political risks, liquidity risks and differences in accounting and financial standards. The data assumes reinvestment of all income and does not account for taxes or transaction costs which may lower results. Because these indices are not managed portfolios, there are no advisory fees or internal management expenses reflected in their performance and investors cannot invest directly in any index.
What is the ideal asset mix?
1998 1999 2000 2001 2002 2003 2004 2005 2006 2007 2008 2009 2010 2011 2012
Large
Stocks
28.6%
Small
Stocks
29.8%
LT Gov’t
Bonds
21.5%
Small
Stocks
22.8%
LT Gov’t
Bonds
17.8%
Small
Stocks
60.7%
Int’l
Stocks
20.7%
Int’l
Stocks
14.0%
Int’l
Stocks
26.9%
Int’l
Stocks
11.6%
LT Gov’t
Bonds
25.9%
Int’l
Stocks
32.5%
Small
Stocks
31.3%
LT Gov’t
Bonds
28.2%
Small
Stocks
18.2%
Int’l
Stocks
20.3%
Int’l
Stocks
27.3%
30-Day
T-Bills
5.9%
30-Day
T-Bills
3.8%
30-Day
T-Bills
1.7%
Int’l
Stocks
39.2%
Small
Stocks
18.4%
LT Gov’t
Bonds
7.8%
Small
Stocks
16.2%
LT Gov’t
Bonds
9.9%
30-Day
T-Bills
1.7%
Small
Stocks
28.1%
Large
Stocks
15.1%
Large
Stocks
2.1%
Int’l
Stocks
17.9%
LT Gov’t
Bonds
13.1%
Large
Stocks
21.0%
Small
Stocks
-3.6%
LT Gov’t
Bonds
3.7%
Int’l
Stocks
-15.7%
Large
Stocks
28.7%
Large
Stocks
10.9%
Small
Stocks
5.7%
Large
Stocks
15.8%
Large
Stocks
5.5%
Small
Stocks
-36.7%
Large
Stocks
26.5%
LT Gov’t
Bonds
10.1%
30-Day
T-Bills
0.0%
Large
Stocks
16.0%
30-Day
T-Bills
4.9%
30-Day
T-Bills
4.7%
Large
Stocks
-9.1%
Large
Stocks
-11.9%
Small
Stocks
-13.3%
LT Gov’t
Bonds
1.5%
LT Gov’t
Bonds
8.5%
Large
Stocks
4.9%
30-Day
T-Bills
4.8%
30-Day
T-Bills
4.7%
Large
Stocks
-37.0%
30-Day
T-Bills
0.1%
Int’l
Stocks
8.2%
Small
Stocks
-3.3%
LT Gov’t
Bonds
3.3%
Small
Stocks
-7.3%
LT Gov’t
Bonds
-9.0%
Int’l
Stocks
-14.0%
Int’l
Stocks
-21.2%
Large
Stocks
-22.1%
30-Day
T-Bills
1.0%
30-Day
T-Bills
1.2%
30-Day
T-Bills
3.0%
LT Gov’t
Bonds
1.2%
Small
Stocks
-5.2%
Int’l
Stocks
-43.1%
LT Gov’t
Bonds
-14.9%
30-Day
T-Bills
0.1%
Int’l
Stocks
-11.7%
30-Day
T-Bills
0.1%
LO
WER R
ETU
RN
HIG
HER R
ETU
RN
Although diversification does not assure a profit or protect against loss, diversification may help spread out the risk in your portfolio. This chart shows how the returns in different asset classes have varied from one year to the next.

SFC/US/45665/6.13/V4/07SEC419-12
Volatility of Small Cap Stocks
Source: Morningstar. Past performance is no guarantee of future results. This chart is for illustrative purposes only and does not represent an actual investment or the performance of any specific investment. All investments involve risk including loss of principal. Small Company Stocks—Russell 2000 Index; Large Company Stocks—Standard & Poor’s 500®, which is an unmanaged group of securities, is considered to be representative of the stock market in general; Long-Term Government Bonds—20-year U.S. Government Bond; Treasury Bills—30-day U.S. Treasury Bill; International Stocks—Morgan Stanley Capital International Europe, Australasia, and Far East (EAFE) Index. Government bonds and Treasury bills are guaranteed by the full faith and credit of the United States government as to the timely payment of principal and interest, while stocks are not guaranteed and have been more volatile than the other asset classes. As interest rates rise, bond prices fall. Bond funds do not carry the same guarantees as bonds themselves. Furthermore, small company stocks are more volatile than large company stocks and are subject to significant price fluctuations, business risks and are thinly traded. International investments involve special risks such as fluctuations in currency, foreign taxation, economic and political risks, liquidity risks and differences in accounting and financial standards. The data assumes reinvestment of all income and does not account for taxes or transaction costs which may lower results. Because these indices are not managed portfolios, there are no advisory fees or internal management expenses reflected in their performance and investors cannot invest directly in any index. Diversification does not assure a profit or protect against loss.
See how returns vary from year to year?
1998 1999 2000 2001 2002 2003 2004 2005 2006 2007 2008 2009 2010 2011 2012
Large
Stocks
28.6%
Small
Stocks
29.8%
LT Gov’t
Bonds
21.5%
Small
Stocks
22.8%
LT Gov’t
Bonds
17.8%
Small
Stocks
60.7%
Int’l
Stocks
20.7%
Int’l
Stocks
14.0%
Int’l
Stocks
26.9%
Int’l
Stocks
11.6%
LT Gov’t
Bonds
25.9%
Int’l
Stocks
32.5%
Small
Stocks
31.3%
LT Gov’t
Bonds
28.2%
Small
Stocks
18.2%
Int’l
Stocks
20.3%
Int’l
Stocks
27.3%
30-Day
T-Bills
5.9%
30-Day
T-Bills
3.8%
30-Day
T-Bills
1.7%
Int’l
Stocks
39.2%
Small
Stocks
18.4%
LT Gov’t
Bonds
7.8%
Small
Stocks
16.2%
LT Gov’t
Bonds
9.9%
30-Day
T-Bills
1.7%
Small
Stocks
28.1%
Large
Stocks
15.1%
Large
Stocks
2.1%
Int’l
Stocks
17.9%
LT Gov’t
Bonds
13.1%
Large
Stocks
21.0%
Small
Stocks
-3.6%
LT Gov’t
Bonds
3.7%
Int’l
Stocks
-15.7%
Large
Stocks
28.7%
Large
Stocks
10.9%
Small
Stocks
5.7%
Large
Stocks
15.8%
Large
Stocks
5.5%
Small
Stocks
-36.7%
Large
Stocks
26.5%
LT Gov’t
Bonds
10.1%
30-Day
T-Bills
0.0%
Large
Stocks
16.0%
30-Day
T-Bills
4.9%
30-Day
T-Bills
4.7%
Large
Stocks
-9.1%
Large
Stocks
-11.9%
Small
Stocks
-13.3%
LT Gov’t
Bonds
1.5%
LT Gov’t
Bonds
8.5%
Large
Stocks
4.9%
30-Day
T-Bills
4.8%
30-Day
T-Bills
4.7%
Large
Stocks
-37.0%
30-Day
T-Bills
0.1%
Int’l
Stocks
8.2%
Small
Stocks
-3.3%
LT Gov’t
Bonds
3.3%
Small
Stocks
-7.3%
LT Gov’t
Bonds
-9.0%
Int’l
Stocks
-14.0%
Int’l
Stocks
-21.2%
Large
Stocks
-22.1%
30-Day
T-Bills
1.0%
30-Day
T-Bills
1.2%
30-Day
T-Bills
3.0%
LT Gov’t
Bonds
1.2%
Small
Stocks
-5.2%
Int’l
Stocks
-43.1%
LT Gov’t
Bonds
-14.9%
30-Day
T-Bills
0.1%
Int’l
Stocks
-11.7%
30-Day
T-Bills
0.1%
LO
WER R
ETU
RN
HIG
HER R
ETU
RN

SFC/US/45665/6.13/V4/07SEC419-12
Volatility of International Stocks
Source: Morningstar. Past performance is no guarantee of future results. This chart is for illustrative purposes only and does not represent an actual investment or the performance of any specific investment. All investments involve risk including loss of principal. Small Company Stocks—Russell 2000 Index; Large Company Stocks—Standard & Poor’s 500®, which is an unmanaged group of securities, is considered to be representative of the stock market in general; Long-Term Government Bonds—20-year U.S. Government Bond; Treasury Bills—30-day U.S. Treasury Bill; International Stocks—Morgan Stanley Capital International Europe, Australasia, and Far East (EAFE) Index. Government bonds and Treasury bills are guaranteed by the full faith and credit of the United States government as to the timely payment of principal and interest, while stocks are not guaranteed and have been more volatile than the other asset classes. As interest rates rise, bond prices fall. Bond funds do not carry the same guarantees as bonds themselves. Furthermore, small company stocks are more volatile than large company stocks and are subject to significant price fluctuations, business risks and are thinly traded. International investments involve special risks such as fluctuations in currency, foreign taxation, economic and political risks, liquidity risks and differences in accounting and financial standards. The data assumes reinvestment of all income and does not account for taxes or transaction costs which may lower results. Because these indices are not managed portfolios, there are no advisory fees or internal management expenses reflected in their performance and investors cannot invest directly in any index. Diversification does not assure a profit or protect against loss.
See how returns vary from year to year?
1998 1999 2000 2001 2002 2003 2004 2005 2006 2007 2008 2009 2010 2011 2012
Large
Stocks
28.6%
Small
Stocks
29.8%
LT Gov’t
Bonds
21.5%
Small
Stocks
22.8%
LT Gov’t
Bonds
17.8%
Small
Stocks
60.7%
Int’l
Stocks
20.7%
Int’l
Stocks
14.0%
Int’l
Stocks
26.9%
Int’l
Stocks
11.6%
LT Gov’t
Bonds
25.9%
Int’l
Stocks
32.5%
Small
Stocks
31.3%
LT Gov’t
Bonds
28.2%
Small
Stocks
18.2%
Int’l
Stocks
20.3%
Int’l
Stocks
27.3%
30-Day
T-Bills
5.9%
30-Day
T-Bills
3.8%
30-Day
T-Bills
1.7%
Int’l
Stocks
39.2%
Small
Stocks
18.4%
LT Gov’t
Bonds
7.8%
Small
Stocks
16.2%
LT Gov’t
Bonds
9.9%
30-Day
T-Bills
1.7%
Small
Stocks
28.1%
Large
Stocks
15.1%
Large
Stocks
2.1%
Int’l
Stocks
17.9%
LT Gov’t
Bonds
13.1%
Large
Stocks
21.0%
Small
Stocks
-3.6%
LT Gov’t
Bonds
3.7%
Int’l
Stocks
-15.7%
Large
Stocks
28.7%
Large
Stocks
10.9%
Small
Stocks
5.7%
Large
Stocks
15.8%
Large
Stocks
5.5%
Small
Stocks
-36.7%
Large
Stocks
26.5%
LT Gov’t
Bonds
10.1%
30-Day
T-Bills
0.0%
Large
Stocks
16.0%
30-Day
T-Bills
4.9%
30-Day
T-Bills
4.7%
Large
Stocks
-9.1%
Large
Stocks
-11.9%
Small
Stocks
-13.3%
LT Gov’t
Bonds
1.5%
LT Gov’t
Bonds
8.5%
Large
Stocks
4.9%
30-Day
T-Bills
4.8%
30-Day
T-Bills
4.7%
Large
Stocks
-37.0%
30-Day
T-Bills
0.1%
Int’l
Stocks
8.2%
Small
Stocks
-3.3%
LT Gov’t
Bonds
3.3%
Small
Stocks
-7.3%
LT Gov’t
Bonds
-9.0%
Int’l
Stocks
-14.0%
Int’l
Stocks
-21.2%
Large
Stocks
-22.1%
30-Day
T-Bills
1.0%
30-Day
T-Bills
1.2%
30-Day
T-Bills
3.0%
LT Gov’t
Bonds
1.2%
Small
Stocks
-5.2%
Int’l
Stocks
-43.1%
LT Gov’t
Bonds
-14.9%
30-Day
T-Bills
0.1%
Int’l
Stocks
-11.7%
30-Day
T-Bills
0.1%
LO
WER R
ETU
RN
HIG
HER R
ETU
RN

SFC/US/45665/6.13/V4/07SEC419-12
Volatility of Large Cap Stocks
Source: Morningstar. Past performance is no guarantee of future results. This chart is for illustrative purposes only and does not represent an actual investment or the performance of any specific investment. All investments involve risk including loss of principal. Small Company Stocks—Russell 2000 Index; Large Company Stocks—Standard & Poor’s 500®, which is an unmanaged group of securities, is considered to be representative of the stock market in general; Long-Term Government Bonds—20-year U.S. Government Bond; Treasury Bills—30-day U.S. Treasury Bill; International Stocks—Morgan Stanley Capital International Europe, Australasia, and Far East (EAFE) Index. Government bonds and Treasury bills are guaranteed by the full faith and credit of the United States government as to the timely payment of principal and interest, while stocks are not guaranteed and have been more volatile than the other asset classes. As interest rates rise, bond prices fall. Bond funds do not carry the same guarantees as bonds themselves. Furthermore, small company stocks are more volatile than large company stocks and are subject to significant price fluctuations, business risks and are thinly traded. International investments involve special risks such as fluctuations in currency, foreign taxation, economic and political risks, liquidity risks and differences in accounting and financial standards. The data assumes reinvestment of all income and does not account for taxes or transaction costs which may lower results. Because these indices are not managed portfolios, there are no advisory fees or internal management expenses reflected in their performance and investors cannot invest directly in any index. Diversification does not assure a profit or protect against loss.
See how returns vary from year to year?
1998 1999 2000 2001 2002 2003 2004 2005 2006 2007 2008 2009 2010 2011 2012
Large
Stocks
28.6%
Small
Stocks
29.8%
LT Gov’t
Bonds
21.5%
Small
Stocks
22.8%
LT Gov’t
Bonds
17.8%
Small
Stocks
60.7%
Int’l
Stocks
20.7%
Int’l
Stocks
14.0%
Int’l
Stocks
26.9%
Int’l
Stocks
11.6%
LT Gov’t
Bonds
25.9%
Int’l
Stocks
32.5%
Small
Stocks
31.3%
LT Gov’t
Bonds
28.2%
Small
Stocks
18.2%
Int’l
Stocks
20.3%
Int’l
Stocks
27.3%
30-Day
T-Bills
5.9%
30-Day
T-Bills
3.8%
30-Day
T-Bills
1.7%
Int’l
Stocks
39.2%
Small
Stocks
18.4%
LT Gov’t
Bonds
7.8%
Small
Stocks
16.2%
LT Gov’t
Bonds
9.9%
30-Day
T-Bills
1.7%
Small
Stocks
28.1%
Large
Stocks
15.1%
Large
Stocks
2.1%
Int’l
Stocks
17.9%
LT Gov’t
Bonds
13.1%
Large
Stocks
21.0%
Small
Stocks
-3.6%
LT Gov’t
Bonds
3.7%
Int’l
Stocks
-15.7%
Large
Stocks
28.7%
Large
Stocks
10.9%
Small
Stocks
5.7%
Large
Stocks
15.8%
Large
Stocks
5.5%
Small
Stocks
-36.7%
Large
Stocks
26.5%
LT Gov’t
Bonds
10.1%
30-Day
T-Bills
0.0%
Large
Stocks
16.0%
30-Day
T-Bills
4.9%
30-Day
T-Bills
4.7%
Large
Stocks
-9.1%
Large
Stocks
-11.9%
Small
Stocks
-13.3%
LT Gov’t
Bonds
1.5%
LT Gov’t
Bonds
8.5%
Large
Stocks
4.9%
30-Day
T-Bills
4.8%
30-Day
T-Bills
4.7%
Large
Stocks
-37.0%
30-Day
T-Bills
0.1%
Int’l
Stocks
8.2%
Small
Stocks
-3.3%
LT Gov’t
Bonds
3.3%
Small
Stocks
-7.3%
LT Gov’t
Bonds
-9.0%
Int’l
Stocks
-14.0%
Int’l
Stocks
-21.2%
Large
Stocks
-22.1%
30-Day
T-Bills
1.0%
30-Day
T-Bills
1.2%
30-Day
T-Bills
3.0%
LT Gov’t
Bonds
1.2%
Small
Stocks
-5.2%
Int’l
Stocks
-43.1%
LT Gov’t
Bonds
-14.9%
30-Day
T-Bills
0.1%
Int’l
Stocks
-11.7%
30-Day
T-Bills
0.1%
LO
WER R
ETU
RN
HIG
HER R
ETU
RN

SFC/US/45665/6.13/V4/07SEC419-12
Volatility of Long-Term Government Bonds
Source: Morningstar. Past performance is no guarantee of future results. This chart is for illustrative purposes only and does not represent an actual investment or the performance of any specific investment. All investments involve risk including loss of principal. Small Company Stocks—Russell 2000 Index; Large Company Stocks—Standard & Poor’s 500®, which is an unmanaged group of securities, is considered to be representative of the stock market in general; Long-Term Government Bonds—20-year U.S. Government Bond; Treasury Bills—30-day U.S. Treasury Bill; International Stocks—Morgan Stanley Capital International Europe, Australasia, and Far East (EAFE) Index. Government bonds and Treasury bills are guaranteed by the full faith and credit of the United States government as to the timely payment of principal and interest, while stocks are not guaranteed and have been more volatile than the other asset classes. As interest rates rise, bond prices fall. Bond funds do not carry the same guarantees as bonds themselves. Furthermore, small company stocks are more volatile than large company stocks and are subject to significant price fluctuations, business risks and are thinly traded. International investments involve special risks such as fluctuations in currency, foreign taxation, economic and political risks, liquidity risks and differences in accounting and financial standards. The data assumes reinvestment of all income and does not account for taxes or transaction costs which may lower results. Because these indices are not managed portfolios, there are no advisory fees or internal management expenses reflected in their performance and investors cannot invest directly in any index. Diversification does not assure a profit or protect against loss.
See how returns vary from year to year?
1998 1999 2000 2001 2002 2003 2004 2005 2006 2007 2008 2009 2010 2011 2012
Large
Stocks
28.6%
Small
Stocks
29.8%
LT Gov’t
Bonds
21.5%
Small
Stocks
22.8%
LT Gov’t
Bonds
17.8%
Small
Stocks
60.7%
Int’l
Stocks
20.7%
Int’l
Stocks
14.0%
Int’l
Stocks
26.9%
Int’l
Stocks
11.6%
LT Gov’t
Bonds
25.9%
Int’l
Stocks
32.5%
Small
Stocks
31.3%
LT Gov’t
Bonds
28.2%
Small
Stocks
18.2%
Int’l
Stocks
20.3%
Int’l
Stocks
27.3%
30-Day
T-Bills
5.9%
30-Day
T-Bills
3.8%
30-Day
T-Bills
1.7%
Int’l
Stocks
39.2%
Small
Stocks
18.4%
LT Gov’t
Bonds
7.8%
Small
Stocks
16.2%
LT Gov’t
Bonds
9.9%
30-Day
T-Bills
1.7%
Small
Stocks
28.1%
Large
Stocks
15.1%
Large
Stocks
2.1%
Int’l
Stocks
17.9%
LT Gov’t
Bonds
13.1%
Large
Stocks
21.0%
Small
Stocks
-3.6%
LT Gov’t
Bonds
3.7%
Int’l
Stocks
-15.7%
Large
Stocks
28.7%
Large
Stocks
10.9%
Small
Stocks
5.7%
Large
Stocks
15.8%
Large
Stocks
5.5%
Small
Stocks
-36.7%
Large
Stocks
26.5%
LT Gov’t
Bonds
10.1%
30-Day
T-Bills
0.0%
Large
Stocks
16.0%
30-Day
T-Bills
4.9%
30-Day
T-Bills
4.7%
Large
Stocks
-9.1%
Large
Stocks
-11.9%
Small
Stocks
-13.3%
LT Gov’t
Bonds
1.5%
LT Gov’t
Bonds
8.5%
Large
Stocks
4.9%
30-Day
T-Bills
4.8%
30-Day
T-Bills
4.7%
Large
Stocks
-37.0%
30-Day
T-Bills
0.1%
Int’l
Stocks
8.2%
Small
Stocks
-3.3%
LT Gov’t
Bonds
3.3%
Small
Stocks
-7.3%
LT Gov’t
Bonds
-9.0%
Int’l
Stocks
-14.0%
Int’l
Stocks
-21.2%
Large
Stocks
-22.1%
30-Day
T-Bills
1.0%
30-Day
T-Bills
1.2%
30-Day
T-Bills
3.0%
LT Gov’t
Bonds
1.2%
Small
Stocks
-5.2%
Int’l
Stocks
-43.1%
LT Gov’t
Bonds
-14.9%
30-Day
T-Bills
0.1%
Int’l
Stocks
-11.7%
30-Day
T-Bills
0.1%
LO
WER R
ETU
RN
HIG
HER R
ETU
RN

SFC/US/45665/6.13/V4/07SEC419-12
Volatility of 30-Day Treasury Bills
Source: Morningstar. Past performance is no guarantee of future results. This chart is for illustrative purposes only and does not represent an actual investment or the performance of any specific investment. All investments involve risk including loss of principal. Small Company Stocks—Russell 2000 Index; Large Company Stocks—Standard & Poor’s 500®, which is an unmanaged group of securities, is considered to be representative of the stock market in general; Long-Term Government Bonds—20-year U.S. Government Bond; Treasury Bills—30-day U.S. Treasury Bill; International Stocks—Morgan Stanley Capital International Europe, Australasia, and Far East (EAFE) Index. Government bonds and Treasury bills are guaranteed by the full faith and credit of the United States government as to the timely payment of principal and interest, while stocks are not guaranteed and have been more volatile than the other asset classes. As interest rates rise, bond prices fall. Bond funds do not carry the same guarantees as bonds themselves. Furthermore, small company stocks are more volatile than large company stocks and are subject to significant price fluctuations, business risks and are thinly traded. International investments involve special risks such as fluctuations in currency, foreign taxation, economic and political risks, liquidity risks and differences in accounting and financial standards. The data assumes reinvestment of all income and does not account for taxes or transaction costs which may lower results. Because these indices are not managed portfolios, there are no advisory fees or internal management expenses reflected in their performance and investors cannot invest directly in any index. Diversification does not assure a profit or protect against loss.
Do you understand the importance of diversification?
1998 1999 2000 2001 2002 2003 2004 2005 2006 2007 2008 2009 2010 2011 2012
Large
Stocks
28.6%
Small
Stocks
29.8%
LT Gov’t
Bonds
21.5%
Small
Stocks
22.8%
LT Gov’t
Bonds
17.8%
Small
Stocks
60.7%
Int’l
Stocks
20.7%
Int’l
Stocks
14.0%
Int’l
Stocks
26.9%
Int’l
Stocks
11.6%
LT Gov’t
Bonds
25.9%
Int’l
Stocks
32.5%
Small
Stocks
31.3%
LT Gov’t
Bonds
28.2%
Small
Stocks
18.2%
Int’l
Stocks
20.3%
Int’l
Stocks
27.3%
30-Day
T-Bills
5.9%
30-Day
T-Bills
3.8%
30-Day
T-Bills
1.7%
Int’l
Stocks
39.2%
Small
Stocks
18.4%
LT Gov’t
Bonds
7.8%
Small
Stocks
16.2%
LT Gov’t
Bonds
9.9%
30-Day
T-Bills
1.7%
Small
Stocks
28.1%
Large
Stocks
15.1%
Large
Stocks
2.1%
Int’l
Stocks
17.9%
LT Gov’t
Bonds
13.1%
Large
Stocks
21.0%
Small
Stocks
-3.6%
LT Gov’t
Bonds
3.7%
Int’l
Stocks
-15.7%
Large
Stocks
28.7%
Large
Stocks
10.9%
Small
Stocks
5.7%
Large
Stocks
15.8%
Large
Stocks
5.5%
Small
Stocks
-36.7%
Large
Stocks
26.5%
LT Gov’t
Bonds
10.1%
30-Day
T-Bills
0.0%
Large
Stocks
16.0%
30-Day
T-Bills
4.9%
30-Day
T-Bills
4.7%
Large
Stocks
-9.1%
Large
Stocks
-11.9%
Small
Stocks
-13.3%
LT Gov’t
Bonds
1.5%
LT Gov’t
Bonds
8.5%
Large
Stocks
4.9%
30-Day
T-Bills
4.8%
30-Day
T-Bills
4.7%
Large
Stocks
-37.0%
30-Day
T-Bills
0.1%
Int’l
Stocks
8.2%
Small
Stocks
-3.3%
LT Gov’t
Bonds
3.3%
Small
Stocks
-7.3%
LT Gov’t
Bonds
-9.0%
Int’l
Stocks
-14.0%
Int’l
Stocks
-21.2%
Large
Stocks
-22.1%
30-Day
T-Bills
1.0%
30-Day
T-Bills
1.2%
30-Day
T-Bills
3.0%
LT Gov’t
Bonds
1.2%
Small
Stocks
-5.2%
Int’l
Stocks
-43.1%
LT Gov’t
Bonds
-14.9%
30-Day
T-Bills
0.1%
Int’l
Stocks
-11.7%
30-Day
T-Bills
0.1%
LO
WER R
ETU
RN
HIG
HER R
ETU
RN

SFC/US/45665/6.13/V4/07SEC419-12
Take advantage of tax-deferred savings.
• Individual Retirement Account (IRA)
• Other Tax-Deferred Savings Accounts*
*Earnings from tax-deferred accounts may be subject to taxation upon withdrawal. This chart represents the growth of a hypothetical investment, assuming the stated annual nominal rate of return compounded monthly, over a specific time period. This example does not take inflation or applicable fees into account and should not be considered to be representative of the performance of any specific investment product or investment strategy.
For purposes of comparison, the taxable account is calculated using a 25% income tax bracket. Your actual annual rate of return could be more or less. Also, withdrawals before age 59 1/2 may be subject to a 10% penalty. Investors should consider their personal investment horizon and income tax bracket, both current and anticipated, when making investment decisions. Lower maximum tax rates on capital gains and dividends would make the return on the taxable investment more favorable.
Taxable $739,900
Invest $10,000 per year for 30 years at a 9% rate of return
Tax-deferred $1,537,100

SFC/US/45665/6.13/V4/07SEC419-12
Don’t pay the high cost of waiting.
• Age 27: Invest $100/month at 9% return
• By age 67, that investment is worth almost $471,640
• But start investing one year later and same investment only grows to $430,040
• You would miss out on nearly $42,000!
Hypothetical 9% rate of return not intended to represent any actual investment. Unlike actual investments, the accounts show a constant rate of return without any fees or charges. Tax-deferred growth and tax-deductible contributions are taxed upon withdrawal. Withdrawals prior to age 59 1/2 may be subject to a 10% penalty tax. Assumes payments are made at the beginning of compounding period with 9% rate of return compounded monthly.
Actual returns would differ and be significantly impacted by periods of negative returns, failure to make monthly contributions and any withdrawals.
Amount
of savings
High cost
of waiting
Start saving at: Age 27 Age 28 Age 32 Age 42
$471,640 $430,040 $112,950 $296,380
$41,600 $175,260 $358,690 The longer you wait to start saving for the future, the less time your money has to grow.
Even delaying your investing program a year or two can make a big difference in how much you end up with.
That’s because you pay “the high cost of waiting.”
The sooner you begin to save, the greater the growth potential of your investment

SFC/US/45665/6.13/V4/07SEC419-12
When does $40,000 exceed $190,000?
The hypothetical 9% rate of return and tax-deferred accumulation shown for both IRA accounts are not guaranteed or intended to demonstrate the performance of any actual investment. Unlike actual investments, the accounts show a constant rate of return without any fees or charges. Tax-deferred growth and any tax-deductible contributions are taxed upon withdrawal. Withdrawals prior to age 59 1/2 may be subject to a 10% penalty tax. Assumes payments are made at the beginning of compounding period with 9% rate of return compounded monthly.
It pays to start early!
Investor A Annual End of Year Age Payment Accumulation
22 5,000 5,470 23 5,000 11,450 24 5,000 17,990 25 5,000 25,150 26 5,000 32,980 27 5,000 41,540 28 5,000 50,910 29 5,000 61,150
30 0 66,890 31 0 73,160 32 0 80,030 33 0 87,530 34 0 95,750 35 0 104,730 36 0 114,550 37 0 125,300 38 0 137,050 39 0 149,910 40 0 163,970 41 0 179,350 42 0 196,180 43 0 214,580 44 0 234,710 45 0 256,730 46 0 280,810 47 0 307,150 48 0 335,960 49 0 367,480 50 0 401,950 51 0 439,660 52 0 480,900 53 0 526,010 54 0 575,350 55 0 629,330 56 0 688,360 57 0 752,930 58 0 823,560 59 0 900,820 60 0 985,320 61 0 1,077,750 62 0 1,178,860 63 0 1,289,440 64 0 1,410,400 65 0 1,542,700 66 0 1,687,420 67 0 1,845,710
Investor B Annual End of Year Age Payment Accumulation
22 0 0 23 0 0 24 0 0 25 0 0 26 0 0 27 0 0 28 0 0 29 0 0 30 5,000 5,470 31 5,000 11,450 32 5,000 17,990 33 5,000 25,150 34 5,000 32,980 35 5,000 41,540 36 5,000 50,910 37 5,000 61,150 38 5,000 72,360 39 5,000 84,620 40 5,000 98,020 41 5,000 112,690 42 5,000 128,730 43 5,000 146,270 44 5,000 165,460 45 5,000 186,450 46 5,000 209,410 47 5,000 234,520 48 5,000 261,990 49 5,000 292,040 50 5,000 324,900 51 5,000 360,850 52 5,000 400,170 53 5,000 443,180 54 5,000 490,220 55 5,000 541,670 56 5,000 597,960 57 5,000 659,520 58 5,000 726,850 59 5,000 800,510 60 5,000 881,070 61 5,000 969,190 62 5,000 1,065,570 63 5,000 1,171,000 64 5,000 1,286,320 65 5,000 1,412,450 66 5,000 1,550,420 67 5,000 1,701,330
Total Contributions: $40,000
Total Accumulation at Age 67: $1,845,710
Total Contributions: $190,000 Total Accumulation at Age 67: $1,701,330

SFC/US/45665/6.13/V4/07SEC419-12
Which type of investor are you?
Should you be Aggressive or Conservative?
Investments with the potential for greater returns also carry higher risks, including loss of principal and investment gains.
AGGRESSIVE Aggressive Equity Funds
Emerging Growth Funds
CONSERVATIVE Income Funds
Bond Funds
Municipal Bond Funds, Government Funds
MODERATE Large-Cap Equity Funds
Balanced Funds
Mid-Cap Funds, International Funds

SFC/US/45665/6.13/V4/07SEC419-12
Model Portfolios
Helps you create an investment program tailored to your investing style and goals.
Five basic models to meet the needs of most investors.
PFSI’s Intelligent Approach to Investing
Investment Profile Questionnaire helps determine your investing style.
1. Income
2. Conservative Growth
3. Moderate Growth
4. Growth
5. Aggressive Growth

SFC/US/45665/6.13/V4/07SEC419-12
Use asset allocation to reach your goals
• Portfolios composed of preset lists of funds researched by industry experts –Ibbotson Associates, a Morningstar Company.
• Relieves the burden of research into fund selection/allocation.
• Goal: Create a list of funds with better returns than average, while exposing the investment to roughly same or less risk.

SFC/US/45665/6.13/V4/07SEC419-12
Why Choose PFS Investments Inc.?
• Access to some of the most recognized and reputable portfolio managers in the industry
• Asset allocation guidance based on industry leading expertise from Ibbotson Associates
• Custom-built model portfolios to meet your investment objectives and risk tolerances

SFC/US/45665/6.13/V4/07SEC419-12
SFC/US/45665/6.13/V4/07SEC419-12