powerpoint presentation · apri = aspartate aminotransferase-to-platelet ratio index; arfi =...
TRANSCRIPT

5/12/2016
1
Alex Monto, MDProfessor of Clinical Medicine
University of California San Francisco
San Francisco, California
Hepatology for the Nonhepatologist
FLOWED: 04/28/2016
San Francisco, California: May 5, 2016
Slide 2 of 45
Introduction
• Liver is the largest internal organ in body (~3-4 lbs.), and the largest gland
• Receives blood through: a) portal venous system, containing all nutrients and chemicals taken in through the GI tract, and b) hepatic artery
• Principal jobs: - Protein, lipid, cholesterol synthesis and metabolism- Glucose metabolism/glycogen storage- Production of bile, which emulsifies lipids, aiding in
digestion- Detoxifying/metabolizing many medications/foreign
substances- Unique immune responses
Slide 3 of 45

5/12/2016
2
Slide 4 of 45
Most Common Causes of Chronic Liver Disease in the United States
#1: NASH/fatty liver disease: 23 million
#2: Alcohol: 8-10 million
#3: Chronic Hepatitis C: 3-6 million
#4: Chronic Hepatitis B: 1-2 million
#5: Hemochromatosis: <100,000
#6: Primary Biliary Cirrhosis: 60,000
Lower: autoimmune hepatitis, PSC
Slide 5 of 45
Overview
• Only ~20-30% of pts with chronic HCV will develop cirrhosis (even if untreated)
• 2015 was the year with the most HCV treatment ever; 2016 may have even more
• October 2014: FDA approval of Sof/Led
• December 2014: FDA approval of PrOD
• August 2015: FDA approval of Daclatasvir (NS5A inhibitor)
• January 2016: FDA approval of Elb/Grz
Slide 6 of 45
Overview
• Hepatitis C therapy as it was from 1998-2010, with 48 weeks of interferon-based therapy for most patients and cure rates of 20-80% is over
• 3 hepatitis C proteins: the protease, the polymerase, and NS5A are under attack with new drugs (all oral, generally 12-24 weeks)
• 2016 and later belong largely to all-oral, IFN-free, at least 2 drug regimens: 8-12 weeks, 92+% cure

5/12/2016
3
Slide 7 of 45
Slide 8 of 45
Glossary
• Sof/Led: sofosbuvir/ledipasvir
• PrOD: paritaprevir with ritonavir boosting/ombitasvir/dasabuvir
• GZR/EBR: grazoprevir/elbasvir
• Dcv: daclatasvir
• Sof/Velp: sofosbuvir/velpatasvir (expected FDA approval late 6/2016)
Slide 9 of 45
New General Points
• “Cure” is now very genotype and sub-type specific: GT 2 > GT 1b > GT 1a > GT 3
• SVR12 (negative HCV RNA 12 weeks after treatment): standard outcome (SVR 24 was the old standard
• SVRs in non-cirrhotics generally > cirrhotics
5/12/2016
4
Slide 10 of 45
2013 2014 2015 2016
Q1 Q2 Q3 Q4 Q1 Q2 Q3 Q4 Q1 Q2 Q3 Q4 Q1 Q2 Q3 Q4
2013 2014 2015 2016
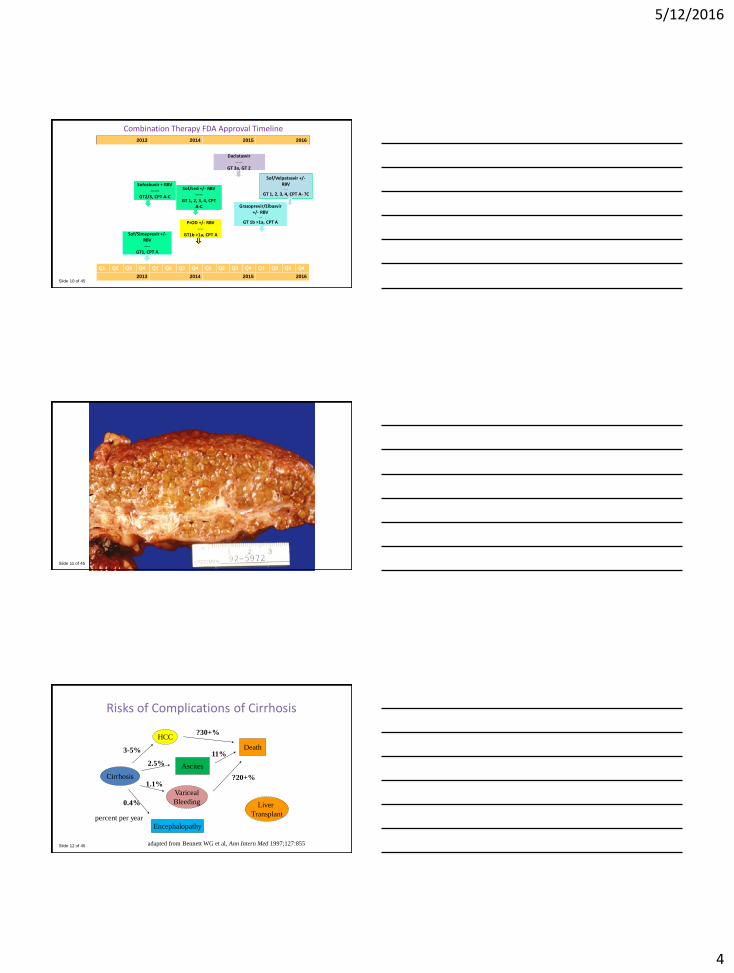
Combination Therapy FDA Approval Timeline
Sofosbuvir + RBV------
GT2/3, CPT A-C
Daclatasvir -----
GT 3a, GT 2
Sof/Led +/- RBV-----
GT 1, 2, 3, 4, CPT A-C
PrOD +/- RBV----
GT1b >1a, CPT A
Grazoprevir/Elbasvir +/- RBV
----
GT 1b >1a, CPT A
Sof/Simeprevir +/-RBV----
GT1, CPT A
* Precise timing TBD
Sof/Velpatasvir +/-RBV
-----
GT 1, 2, 3, 4, CPT A- ?C
Slide 11 of 45
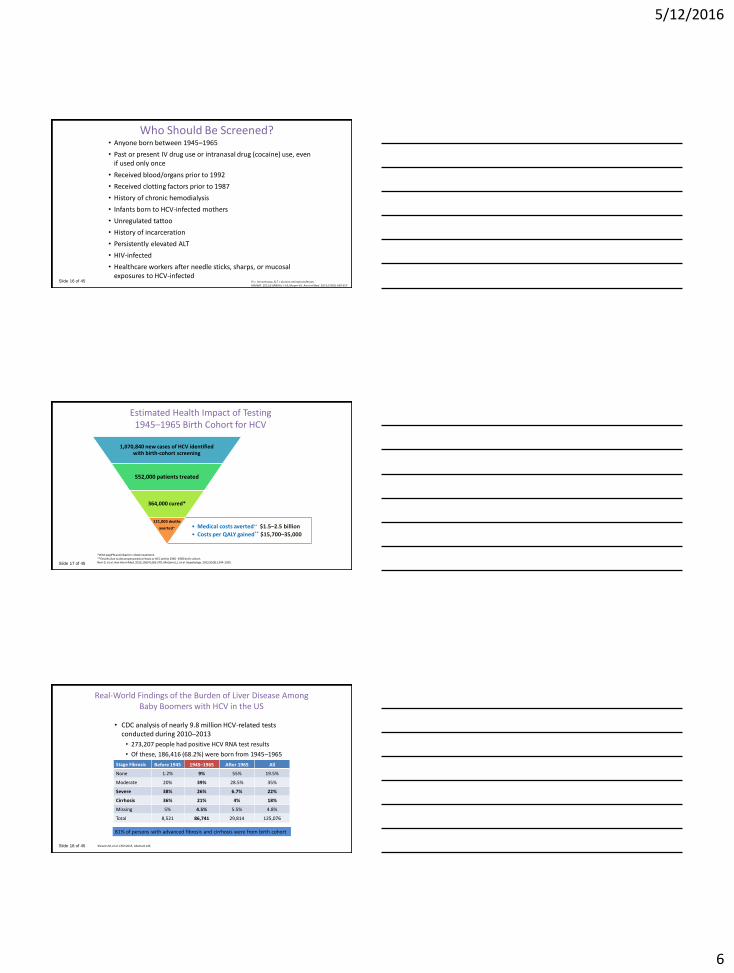
CIRRHOTIC LIVER
Slide 12 of 45
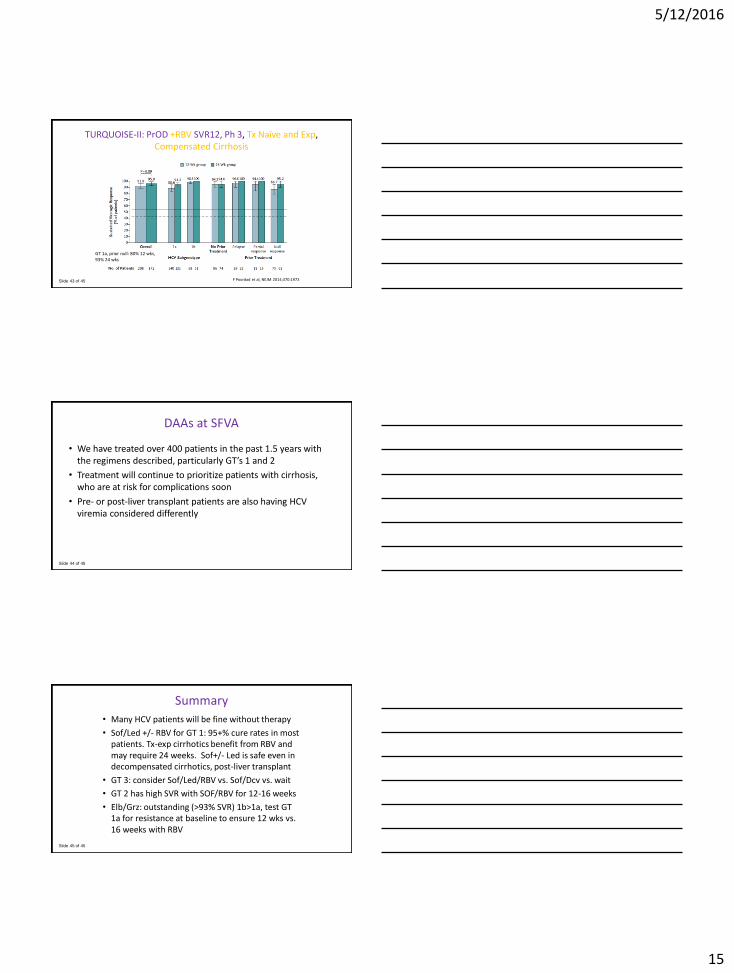
Risks of Complications of Cirrhosis
Cirrhosis
Variceal
Bleeding
HCC
Ascites
Encephalopathy
adapted from Bennett WG et al, Ann Intern Med 1997;127:855
0.4%
3-5%
2.5%
1.1%
percent per year
Death
Liver
Transplant
11%
?20+%
?30+%

5/12/2016
5
Slide 13 of 45
Cirrhosis Natural History Studies Summary
• No decompensation: 80% 10-year survival
• Decompensation is variable, imperfectly predicted. Portal HTN vs. synthetic dysfunction
• HCC, ascites: the 2 principal forms of decompensation
• Risk of decompensation: roughly 4-5% per year in a patient with Child’s A cirrhosis
• After decompensation, probability of 5-yr survival without transplant: 35-50%
Slide 14 of 45
Forecast Burden of HCV-Related Morbidity and Mortality
DCC = decompensated cirrhosis; HCC = hepatocellular carcinoma. Rein DB, et al. Dig Liver Dis. 2011;43(1):66-72.
Assuming 2,700,000 HCV infected persons are in primary care
1.47 million will develop cirrhosis
350,000 will develop liver cancer
897,000 will die from HCV-related complications
0
5000
10000
15000
20000
25000
30000
35000
40000
20
10
20
12
20
14
20
16
20
18
20
20
20
22
20
24
20
26
20
28
20
30
20
32
20
34
20
36
20
38
20
40
20
42
20
44
20
46
20
48
20
50
20
52
20
54
20
56
20
58
20
60
Nu
mb
er
Time (years)
Deaths
DCC
HCC
Slide 15 of 45
Projected HCV Sequelae Cost U.S. 1950–2030
$10
$8
$6
$4
$2
$0
19601950 1980 2020 20302000 201019901970
$3.0
$4.0
$5.0
$1.0
$0.0
$2.0
Tota
l Co
st (b
illio
ns)
Seq
uel
ae C
ost
(bill
ions
)
Total Cost
Decomp Cirrhosis HCC
F0-F3
Liver Transplant
Comp Cirrhosis
Razavi H, et al. Hepatology. 2013;57(6):2164-2170.
The Total Cost of Chronic HCV Is Expected to Peak in 2024 at $9.1 Billion
5/12/2016
6
Slide 16 of 45
Who Should Be Screened?• Anyone born between 1945–1965
• Past or present IV drug use or intranasal drug (cocaine) use, even if used only once
• Received blood/organs prior to 1992
• Received clotting factors prior to 1987
• History of chronic hemodialysis
• Infants born to HCV-infected mothers
• Unregulated tattoo
• History of incarceration
• Persistently elevated ALT
• HIV-infected
• Healthcare workers after needle sticks, sharps, or mucosal exposures to HCV-infected
IV = intravenous; ALT = alanine aminotransferase.MMWR. 2012;61(RR04):1-18; Moyer VA. Ann Int Med. 2013;159(5):349-357.
Slide 17 of 45
Estimated Health Impact of Testing 1945–1965 Birth Cohort for HCV
1,070,840 new cases of HCV identified with birth-cohort screening
552,000 patients treated
364,000 cured*
• Medical costs averted** $1.5–2.5 billion
• Costs per QALY gained** $15,700–35,000
121,000 deaths
averted**
*With pegIFN and ribavirin + DAA treatment.**Deaths due to decompensated cirrhosis or HCC within 1945–1965 birth cohort. Rein D, et al. Ann Intern Med. 2012;156(4):263-270; McGarry LJ, et al. Hepatology. 2012;55(5):1344-1355.
Slide 18 of 45
Real-World Findings of the Burden of Liver Disease Among Baby Boomers with HCV in the US
• CDC analysis of nearly 9.8 million HCV-related tests conducted during 2010–2013
• 273,207 people had positive HCV RNA test results
• Of these, 186,416 (68.2%) were born from 1945–1965
Stage Fibrosis Before 1945 1945–1965 After 1965 All
None 1.2% 9% 55% 19.5%
Moderate 20% 39% 28.5% 35%
Severe 38% 26% 6.7% 22%
Cirrhosis 36% 21% 4% 18%
Missing 5% 4.5% 5.5% 4.8%
Total 8,521 86,741 29,814 125,076
81% of persons with advanced fibrosis and cirrhosis were from birth cohort
Klevens M, et al. CROI 2015. Abstract 145.

5/12/2016
7
Slide 19 of 45
Opportunities to Improve Care and Outcomes in HCV
100% 50% 43% 27% 16% 9%0%
20%
40%
60%
80%
100%
Chronic HCV-Infected
Diagnosed andAware
Access toOutpatient Care
HCV RNAConfirmed
Prescribed HCVTreatment
Achieved SVR
Per
cen
tage
of P
atie
nts
HCV Care Cascade3,500,00
Yehia BR, et al. PLoS One. 2014;9(7):e101554.
Slide 20 of 45
The Benefits of Achieving SVR
Yoshida EM, et al. Hepatology. 2014; Epub ahead of print; Thorlund K, et al. Clin Epidemiol. 2014;6:49-58; van der Meer AJ, et al. JAMA. 2012;308(24):2584-2593.
Viral Eradication Improved Liver Histology
↓ Mortality
SVR
↓ Extrahepatic Complications
↓ Decompensation ↓ HCC
Improved Clinical Outcomes
Slide 21 of 45
Fibrosis Assessment
Clinical findings
Physical exam (firm liver edge, splenomegaly, palmar erythema, spider angiomata)
Low platelets (< 100,000/μL)
Abdominal images Surface abnormalities (including dilate portal vein diameter, intraabdominal collaterals, splenomegaly)
Serum markers of fibrosis APRI, FIB-4, FibroSure (FibroTest)
Liver biopsy Useful in establishing the stage but invasive
Liver fibrosis imaging Ultrasonography (transient elastography, ARFI), MRE, MRI, CT, etc.
APRI = aspartate aminotransferase-to-platelet ratio index; ARFI = acoustic radiation force imaging; MRE = magnetic resonance elastography; MRI = magnetic resonance imaging; CT = computed comography.Leroy V, et al. J Hepatol. 2014;S0168-8278(14)00137-8; Holmberg SD, et al. Clin Infect Dis. 2013;57(2):240-246; Chou R, Wasson N. Ann Intern Med. 2013;158(11):807-820; Poynard T, et al. J Hepatol. 2014;60(4):706-714; Udell JA, et al. JAMA. 2012;307(8):832-842; de Lédinghen V, Vergniol J. Gastroenterol Clin Biol. 2008;32(6 Suppl 1):58-67; Tapper EB, et al. Clin Gastroenterol Hepatol. 2014;S1542-3565(14)00818-0; Smith JO, et al. Aliment Pharmacol Ther. 2009;30(6):557-576; Bonekamp S, et al. J Hepatol. 2009;50(1):17-35.

5/12/2016
8
Slide 22 of 45
Invasive and Nonivasive Fibrosis Compared
Liver Biopsy Serum Markers Transient Elastography
MethodologyDirect observation Measures direct and indirect
serum markers* of fibrosis
Liver stiffness by detection of ultrasound-propagated shear waves
Accuracy for detecting cirrhosis
HighModerate (APRI) to high (FibroSURETM, ELF)
High
Accuracy for detecting intermediate fibrosis
HighLow (APRI) to moderate (FibroSURETM, ELF)
Moderate to high
Risk of complications Risk of pain/bleeding Minimal Minimal
Contraindications Coagulopathy Minimal Obesity; narrow rib spaces
Limitations Sampling errorObserver variation
False-positives with hemolysis, inflammation, Gilbert’s syndrome
False-positives with inflammation, congestion
Longitudinal monitoring
UnsuitableIndices may change with disease progression/therapy
Liver stiffness changes with disease progression/therapy
Cost Highest per-treat cost Low per-test cost High initial equipment cost
Serum tests that incorporate markers of fibrogenesis are generally more accurate. AST = aspartate aminotransferase; ELF = enhanced liver fibrosis.Nguyen D, Talwalkar JA. Hepatology. 2011;53:2107-2110.
Slide 23 of 45
“Highest” Priority for Treatment
F0 F1 F2 F3 F4
Highest Priority Owing to Highest Risk for Severe Complications:
• Advanced fibrosis (Metavir F3) or compensated cirrhosis (Metavir 4)
• Organ transplant
• Type 2 or 3 essential mixed cryoglobulinemia with end-organ manifestations (eg, vasculitis)
• Proteinuria, nephrotic syndrome, or membranoproliferative glomerulonephritis
Afdhal NH. Gastroenterol Hepatol. 2012;8(9):605-607; Bonder A, et al. Curr Gastroenterol Rep. 2014;16(2):372; AASLD, IDSA. Recommendations for testing, managing, and treating HCV. www.hcvguidelines.org. Accessed 3/27/15.
Slide 24 of 45
“High” Priority for TreatmentOwing to High Risk for Complications
• Fibrosis (Metavir F2)
• HIV-1 coinfection
• HBV coinfection
• Other coexistent liver disease (eg, NASH)
• Debilitating fatigue
• T2DM (insulin resistant)
• Porphyria cutanea tarda
HIV = human immunodeficiency virus; HBV = hepatitus B virus; NASH = nonalcoholic steatohepatitis; T2DM = type 2 diabetes mell itus. AASLD, IDSA. Recommendations for testing, managing, and treating HCV. www.hcvguidelines.org. Accessed 3/27/15.

5/12/2016
9
Slide 25 of 45
Most Patients Meet “High” or “Highest” Priority for HCV Treatment
Priority Status N = 8,504
“HIGHEST PRIORITY” 32.9%
F3 or higher by biopsy or FIB-4 score ≥ 2.5 30.0%
˂ F3 with chronic kidney disease 2.9%
“HIGH PRIORITY” 28.9%
F2 by biopsy or FIB-4 score ≥ 1.6 or < 2.5 22.7%
˂ F2 with HIV coinfection 0.7%
˂ F2 with HBV coinfection 0.2%
˂ F2 with NASH 0.4%
< F2 with DM 4.9%
NOT MEETING “HIGHEST” or “HIGH PRIORITY” 38.2%
Results from Chronic Hepatitis Cohort Study (CHeCS). Xu F, et al. AASLD The Liver Meeting 2014, Boston, MA. LB-29.
Slide 26 of 45
Communication, Coordination, and Collaboration among Providers
Initial
• Verification of diagnosis, dose, and comorbidities
• Regimen conformity with guidelines
• Patient/caregiver counseling
• Services and support
Follow-Up
• On-treatment monitoring
• Viral load evaluation
• Response to therapy
• Barriers to compliance
• Adverse effects, administration, cost, complex therapy
• Follow-up after treatment completion
Specialty Pharmacy Times. Managing hepatitis C costs, improving patient outcomes. www.specialtypharmacytimes.com/publications/specialty-pharmacy-times/2014/august-2014/managing-hepatitis-c-costs-improving-patient-outcomes/P-1. Accessed 3/27/15.
Slide 27 of 45
Barriers to Older Therapies
IFN/pegIFN
• Flu-like symptoms
• Leukopenia, thrombocytopenia
• Depressed mood
• Insomnia
RBV
• Significant anemia
• Rash
• Cough and dyspnea
• Teratogenicity
• Multiple daily dosing
First DAAs
• Complicated regimens
• Anemia, neutropenia, thrombocytopenia
• Rash
• Significant pill burden
• Drug interactions

5/12/2016
10
Slide 28 of 45 Lawitz E et al, Jacobson I et al, NEJM May 2013
POSITRON TN, PEG-IFN-unable
SOF + RBV, n=207
PBO, n=71
SVR12
FUSION Treatment Experienced
SOF + RBV, n=103 PBO
SOF + RBV, n=98
SVR12
SVR12
NEUTRINO Treatment Naïve
SOF + PEG-IFN+RBV, n=327 SVR12
GT 2/3
GT 1/4/5/6
0 12 16 24 36Week
FISSION Treatment Naïve
SOF+ RBV, n=256
PEG-IFN+RBV, n=243
SVR12
SVR12
Sofosbuvir Phase 3 Study Designs
SVR2489% GT 1, 9% GT 4, 2% GT 6
Slide 29 of 45
NEUTRINO: Sofosbuvir + P/R for 12 weeksSVR12 according to Genotype and Cirrhosis
Lawitz E et al, NEJM May 2013
SVR
12
(%
)
92
80
100
80
60
40
20
0No
CirrhosisCirrhosis
252/273 43/54
SVR12 According to Fibrosis Level
SVR
12
(%
)
8996
100100
80
60
40
20
0GT 1 GT 4 GT 5,6
261/292 27/28 7/7
SVR12 According to Genotype
n/N =
Slide 30 of 45
Sofosbuvir + RBV in HCV GT 2/3Impact of Genotype on SVR12
62
30
61
56
94
86
93
97
0 20 40 60 80 100
Fusion 16 Wk
Fusion 12 Wk
Positron 12 Wk
Fission 12 Wk
GT-2 GT-3
SVR 12 in G2/3 (%)Lawitz E et al, Jacobson IM et al, NEJM May 2013

5/12/2016
11
Slide 31 of 45
Sofosbuvir + RBV in HCV Genotype 2Impact of Treatment Status and Cirrhosis on SVR12
989192 9496
60
100
78
0
10
20
30
40
50
60
70
80
90
100
No Cirrhosis Cirrhosis
Fission 12 (TN) Positron 12 (TN) Fusion 12 (TE) Fusion 16 (TE)
Slide 32 of 45
Phase III Studies of Sofosbuvir (Nuc) + Ledipasvir (NS5A) ± RBV in GT1 HCV
ION-1: GT1 treatment-naive pts (16% cirrhotic): SOF/LDV
± RBV for 12 wks
.
ION-3: GT1 treatment-naive pts: SOF/LDV FDC ± RBV
for 8 or 12 wks
SOF/LDV SOF/LDV + RBV
ION-2: GT1 treatment-experienced pts (20% cirrhotic): SOF/LDV FDC
± RBV for 12 or 24 wks
8 Wks 12 Wks
202/215
206/216
201/216
12 Wks 24 Wks
102/109
107/111
108/109
110/111n/N =
209/214
211/217
SV
R12 (
%)
12 Wks
98 97100
90
60
40
20
0
94 93 95 94 96 99 99
Slide 33 of 45
ION-2: Ledipasvir/Sofosbuvir for Tx-Exp GT 1
Characteristic 12-Wk Regimen 24-Wk RegimenLDV–SOF LDV–SOF + RBV LDV-SOF + RBV(N = 109) (N = 111) (N = 109) (N = 111)
Age: yr, mean 56 57 56 55
Post-treatmentAt 4 wk 103 (94) 107 (96) 109 (100) 110 (99)At 12 wk 102 (94) 107 (96) 108 (99) 110 (99)Virologic breakthr: 0 0 0 1 Relapse 7 (6%) 4 (4%) 0 0* One of the 109 patients who received 12 weeks of ledipasvir–sofosbuvir had an HCV RNA level of 42 IU per milliliter
N Afdhal et al, NEJM Apr 17 2014;370:16
20% of pts had cirrhosis79% GT 1a, 21% GT 1b55% of pts had previously failed PEG-RBV-protease inhibitor

5/12/2016
12
Slide 34 of 45 TW=treatment week FUW=follow up week
C-EDGE TN: GZR/EBR for 12 Weeks in TN GT 1, 4, or 6
Slide 35 of 45
Impact of Baseline NS5A Variants on Efficacy in GT 1 Patients
C-EDGE TN: GZR/EBR for 12 Weeks in TN GT 1, 4, or 6
GT 1a GT 1b
9299
58
22
0
20
40
60
80
100
Overall No NS5AVariant
AnyNS5A
Variant
BaselineRAV with> 5-fold
shift
SV
R12,
%
144/157 133/135 11/19 2/9
99 10094 94
0
20
40
60
80
100
Overall No NS5AVariant
AnyNS5A
Variant
BaselineRAV with> 5-fold
shift
129/131 112/112 17/18 16/17
Zeuzem, EASL, 2015, G07Zeuzem, et al. Ann Intern Med Published Online April 2015
Slide 36 of 45
Efficacy by Prior Relapse vs. Prior Partial or Null ResponsePer-Protocol Analysis
Kwo, EASL, 2015, P0886
• Relapse: primarily in prior partial or null responders treated for 12 weeks
10091
1009192 94
100 100
0
20
40
60
80
100
Prior relapse Prior partial or null response
SV
R12,
%
GZR/EBR 12 weeks GZR/EBR+RBV 12 weeks
GZR/EBR 16 weeks GZR/EBR+RBV 16 weeks
35/35 37/37 35/38 39/39 61/67 58/64 62/66 62/62
C-EDGE TE: GZR/EBR±RBV for 12 and 16 Weeks in TE GT 1, 4, or 6
• Open-label trial: patients failing prior PEG/RBV randomized 1:1:1:1. Demographics: median age 57 years (range: 19 to 77); 64% male; 67% White; 18% Black or African American; 9% Hispanic or Latino; mean BMI 28 kg/m2; 78% HCV RNA levels > 800,000 IU/mL; 34% had cirrhosis; 79% had non-C/C IL28B alleles (CT or TT); 60% GT 1a, 39% GT 1b, 1%: genotype 1-other.

5/12/2016
13
Slide 37 of 45
SAPPHIRE-1: PrOD +RBV, Placebo-controlled, Ph 3, Tx-Naïve, Non-cirrhotic
RBV 1000mg-1200mg Wt < 75kg vs. >=75kgJJ Feld et al, NEJM 2014;370:1594
Slide 38 of 45
SAPPHIRE-1: PrOD+RBV, Placebo-controlled, Ph 3, Tx-Naïve,Non-cirrhotic
JJ Feld et al, NEJM 2014;370:1594
Slide 39 of 45
PrOD +/-RBV SVR12, Ph 3, Tx Naïve, Non-Cirrhotic
JM Pawlotsky, Gastro 2014;146:1176

5/12/2016
14
Slide 40 of 45
PrOD +/-RBV SVR12, Ph 3, Tx Exp, Non-Cirrhotic
JM Pawlotsky, Gastro 2014;146:1176
Slide 41 of 45
TURQUOISE-II: PrOD +RBV, Ph 3, Tx-Naïve/Exp, Cirrhotic
PrOD+ RBV (n=208)
PrOD+RBV (n=172)
Wk 12 Wk 24 SVR 12-24
RBV 1000mg-1200mg Wt < 75kg vs. >=75kg
Slide 42 of 45
TURQUOISE-II: PrOD +RBV SVR12, Ph 3, Tx Naïve and Exp, Compensated Cirrhosis
F Poordad et al, NEJM 2014;370:1973
5/12/2016
15
Slide 43 of 45
TURQUOISE-II: PrOD +RBV SVR12, Ph 3, Tx Naïve and Exp, Compensated Cirrhosis
F Poordad et al, NEJM 2014;370:1973
GT 1a, prior null: 80% 12 wks,93% 24 wks
Slide 44 of 45
DAAs at SFVA
• We have treated over 400 patients in the past 1.5 years with the regimens described, particularly GT’s 1 and 2
• Treatment will continue to prioritize patients with cirrhosis, who are at risk for complications soon
• Pre- or post-liver transplant patients are also having HCV viremia considered differently
Slide 45 of 45
Summary
• Many HCV patients will be fine without therapy
• Sof/Led +/- RBV for GT 1: 95+% cure rates in most patients. Tx-exp cirrhotics benefit from RBV and may require 24 weeks. Sof+/- Led is safe even in decompensated cirrhotics, post-liver transplant
• GT 3: consider Sof/Led/RBV vs. Sof/Dcv vs. wait
• GT 2 has high SVR with SOF/RBV for 12-16 weeks
• Elb/Grz: outstanding (>93% SVR) 1b>1a, test GT 1a for resistance at baseline to ensure 12 wks vs. 16 weeks with RBV