power train analysis for the doe/nasa 100 … nasa tm-78997 power train analysis for the doe/nasa...
TRANSCRIPT
DOE/NASA/1028-78/19 NASA TM-78997
POWER TRAIN ANALYSIS FOR THE DOE/NASA 100-kW WIND TURBINE GENERATOR
(NASA-TR-78997) FOWEE T R A I N A N A L Y S I S FCR N79- 16355 T H E D@E/NASA 100-kR WIND T U R E I N E SEMERA'KOB Final. Report (NASA) 57 p HC AOU/MF A01
Unclas CSCL 10A G3/44 43370
Robert C. Seidei, Harold Gold, and Leon M. Wenzel National Aeronautics and Space Administration Lewis Research Center
October 1978
Prepared for U. S. DEPARTMENT OF ENERGY Office of Energy Technology Division of Distributed Solar Technology
https://ntrs.nasa.gov/search.jsp?R=19790008184 2018-06-19T20:57:55+00:00Z

DOEINASAi1028-78/19 NASA TM-78997
POWER-TRAIN ANALYSIS FOR THE DOElNASA 100-kW WIND TURBINE GENERATOR
Robert C. Seidel, Harold Gold, and Leon M. Wenzel National Aeronautics and Space Administration Lewis Research Center Cleveland, Ohio 44135
October 1978
Prepared for U. S. DEPARTMENT OF ENERGY Off ice of Energy Technoiogy D ivis ion of D is t r i b ut ed S ola r Tech nology Washington, D. C. 20545 Under Interagency Agreement E(49-261-1028
SUMMARY
Progress in explaining variations of power experienced in the on-line opera- tion of a 100-kW experimental wind turbine-generator is reported. Data a re presented that show the oscillations tend to be characteristic of a wind-driven synchronous generator because of low torsional damping i n the power train, resonances of its large structure, and excitation by unsteady and nonuniform wind flow. The repo'rt includes a dynamic analysis of the drive-train torsion, the generator, passive driveline damping, and active pitch control a s well as correlation with experimental recordings. Experimental measurements of the system transfer function were made by disturbing the blade pitch angle. They compared well with the model dynamics up through the frequency of the first mode. Oscillations of power were experienced near the first-mode frequency and are explained a s resulting from the first-mode resonance amplifying distur- bances from, for e-xample, blade asymmetries. Control of power about a set point used proportional-plus-integral feedback to the pitch actuator, and control gains were formulated for reducing disturbames up to frequencies less than the first mode. A fluid coupling installed in the high-speed shsft is one solution demonstrated for reducing the first-mode resonant amplificatiou.
A predicted second-mode resonance at 3.5 hertz in the power train was not observed experimentally. A small effect of tower motion within the power train dynamics (an interaction not modelled) was observed experimentally. Experimen- tally observed variations in power at the two-per-rotor-revolution (2P) frequency were more than predicted. The larger 2P variation is suspected to be the impact of local turbulences not modelled. A wind feed-forward control scheme was em- ployed, but failed to attenuate wind-speed-change effects as well as predicted be- cause the anemometer measurement of wind speed used in the control was not well correlated with the wind speed at thc rotor.
INTRODUCTIOK
A 100-kW experimental wind turbine-generator, designated the Mod-0, is being used to identify and solve technical problems associated with large wind tur - bines. It is located near Sandusky, Ohio and has been operating since November, 1975 under the federal wind energy program directed by the Department of Energy. The hational Aeronautics and Space Administration, Lewis Research Center, has provided design and test.
Significant variations of power output are present when the Mod-0 is synchro- nized to a utility network (on-line). Some variations occur because of random

2
VI ind speed fluctuations that are too high in frequency for automatic compensation through the blade pitch mechanism. Further, blade passage through nonuniform winds such a s wind shear and tower blockage produces high frequency periodic input disturbances. Because the generator assumes a torsion spring-like quality when on-line, a spring-mass resonance in the power train can result. This reso- nance can be destructive of structure and power quality.
The oscillation of parallel connected synchronous generators is a persistent problem even in current utilities. A s discussed in reference 1, problems range from power variations of a single generator relative to a utility grid to regional oscillatjms for interconnected networks across the United States. Ayp-oaches to oscillations from wind turbine synchronous generators are given in references 2 to 5 The possible implementation of a slip coupling is discussed in reference 2. A slip coupling adds damping to the power train but at the cost of more complexity and reduced efficiency. In reference 3, transients accompanying wind gusts, with a compliant and damped shaft between the turbine and the generator, are calcu- lated. A compliant shaft smooths the higher frequency power variations and damp- ing prevents resonant oscillations with no steady power loss. However, construc- tion of a suitably soft and damped shaft is not easily achieved. The use of a corn- liant shaft to lower the first resonance to below the turbine rotation frequency is analyzed in reference 4; and a method for increased generator damping through a variable excitation control is described in reference 5.
analysis and test, several passive drive-train coupling elements and active pitch controls. Only torsional power-train dynamics are considered, and the analysis utilizes a linearization of the nonlinear system about an operating point. The wind turbine generator is modelled as one machine on an infinite bus with constant gen- erator field excitation. The report does not include discussion of induction gener- a%ors, fly wheel inertias, and active damping through variable blade pitch and generator excitor controls.
This study examines the nature of the power variations and evaluates, through
SYSTEM DESCFUPTION
An overall view of the Mod-0 wind turbine is shown in figure 1. It is a two- bladed, horizontal axis machine with a rotor diameter of 38.1 meters (125 ft) . The-axis of the downwind rotor is mechanically yawed normal to the wind. The blades are aluminum NACA 23000 series airfoils with a twist of 34' from root to tip. The power train components, located inside the nacelle atop the tower, are shown in figure 2. The hub contains the hydraulic servo and bevel gears for col- lective pitch control. The low speed shaft supports the weight of the rotor through

3
bearings mounted to the bedplate and is connected to the gear box through a spring- type coupling (not shown). The gear box is a triple mesh of gears that increases the 40 rpm rotational speed of the low speed shaft by a factor of 45. The high- speed shaft transmit8 the torque through a parallel set of five V belts, nominally having a 1:l speed ratio. The generator is a four pole, 125 kVA, 480 volt, syn- chronous generator rated for 100 kW at a 0.8 power factor.
Three high speed shaft configurations were analyzed in the test program: a stiff steel coupling, a softer spring elastomeric coupling, and a fluid slip coupling.
A block diagram of the power control feedback loop is shown in figure 3. A transducer measurement of the power is compared with set point power and the error signal sent to a proportional plus integral structured controller. The con- troller commands a pitch angle through the pitch actuator.
MODEL DESCRIPTION
The primary goal of the power traln modelling was to describe the transfer function of generator power-to-blade disturbances for on-line operation.
Drive Train
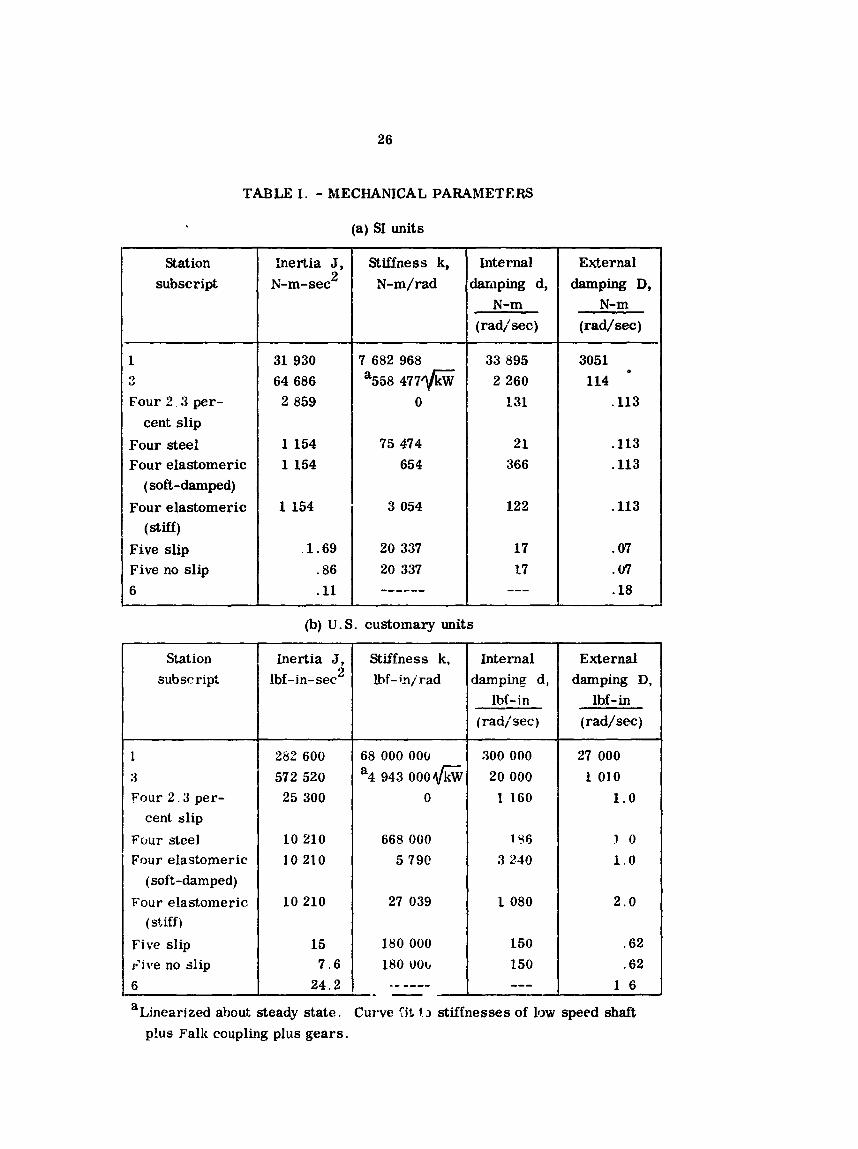
A block diagram of the power train mechanical elements represented as lumped masses connected by torsion springs is shown in figure 4, The values of stiffness, inertia, internal damping, and external damping used in this model are listed in table I. The stiffness and inertia values are from a normal modes analy- sis of the Mod-0 wind turbine reported in reference 6. The aerodynamic damping of blade inplane motion, parameter D1, was estimated from curves of rotor power at different speeds and is relatively small, especially considering it represents the inherent damping available from the wind. The external damping values repre- sent viscous losses from friction, windage, etc. which are based on a measured 80 percent power train efficiency. The relatively larger internal o r material damping values are estimates based on an assumed 0.05 damping ratio in the higher modes.
beled trstiffft a re the parameters for the physical elastomeric shaft tested. The set labeled %oft-dampedfv are for an assumed shaft with an overly optimistic damping. Its lower stiffness corresponds to the stiffness obtained from bench tests rather than the stiffness measured in actual wind turbine test operation. The shaft was instrumented to enable recording its windup while rotating at 1800 rpm. The higher stiffness recorded is believed to be the result of internal bind- ing of the elastomeric shaft steel supports.
Two sets of values are given for the elastomeric shaft. The parameters la-

4
For the dynamics study, the blade model was a single mass and torsion spring. The spring stiffness was sized to give the 2. <7 hertz frequency calcu- lated for the blade first inplane mode from structural studies (ref. '7). A nominal value of one-half of the rigid body moment of inertia was assigned to the blade tip and the remainder to the hub. The sensitivity of this approximation is discussed later.
bus is shown in figure 5. The generator model is the voltage-behind-subtransient- reactance model, E", of reference 8.
A block diagram of the generator electrical model connected to an infinite
Control
An active generator exciter control is not modelled. Field tests showed the exciter response to be slow; hence a constant voltage is used. An active variable blade pitch angle control is modelled. The pitch actuator is modelled as a double lag at 1.5 hertz based on test measurements of the actuator response.
power-train efficiency of 80 percent, a 125-kW rotor power input produces a 100- kW electrical power output. The blade pitch gain, the slope of the power-pitch curve, is shown at two wind speeds. The blade pitch gain of 42 kW/deg at the higher wind speed is about four times greater than the gain at the lower wind speed. To be conservative, that blade gain of 42 kW/deg for the higher wind speed is used in controller gain designs. The disturbance gain for wind speed changes can also be inferred from figure 6. In the high winds it is 56 kW/m/s (26 kW/mph). In a wind feed forward control scheme to be discussed later, the correction in pitch used for a change in wind speed can be obtained from these gains as (56 kW/m/s)/(42 kW/deg) = 1.34 degrees of pitch change per meter per second change in wind speed.
The static performance predicted for the blades is given in figure 6. For a
Model Equations
A list of the report symbols, detailed mechanical and electrical model equa- tions, and FORTRAN computer program listings are presented in appendixes A, B, and C, respectively.
The power-train model has two nonlinear elements: the stiffness of the low speed shaft coupling, and the electrical generator. However, a linear analysis was used throughout the study. The low speed shaft was linearized at the oper- ating point power level, and the generator equations became linearized by numer- ically perturbing the state variables (in both directions) around an operating point.

The generator linearization was not particularly sensitive to the perturbation size for even a 20 percent change. System transfer functions and frequency responses were obtained using the programs of reference 9. In comparisons of experimental and analytical results, a few percent error may exist because the generator power and the generator torque were assumed proportional and were used interchange- ably.
MODEL ANALYSIS
The analysis concerned primarily the transfer function of generator power- to-blade disturbances with different plant element dynamics and pitch control. Sensitivity studies were made for different blade tip inertias and generator elec- trical conditions.
Plant Dynamics - No Control
Frequency response magnitude plots of the transfer function of generator power-to-blade disturbances are shown in figure 7. Phase angle plots convey mostly redundant information and are not shown. Blade disturbances can result, for example, from angle of attack changes due either to changes in wind speed or pitch angle. Responses are shown for three high-speed shaft configurations: a stiff steel shaft, a soft-damped elastomeric shaft, and a slip coupling set to slip 2.3 percent at 100 kW. The responses are normalized to one at zero frequency and include no pitch control. The stiff steel shaft displays a large peak in the response at 0.69 hertz, a frequency very close to the one per rotor revolution (1P) frequency of 0.67 hertz. This resonance amplifies wind fluctuations and the periodic power variations due to, for example, any differences between blades. The peak is less with the slip and elastomeric couplings because of the damping the couplings provide.
From figure 7 it can be seen that the responses of the different configurations are about the same at the even multiples of rotor revolution frequency (2P, 4P, . . . ). The largest difference occurs at the 2P frequency where the slip coupling response is about 50 percent lower than that of the stiff shaft. Thus it would be expected that the response to disturbances at frequencies above 2P would be nearly the same for all configurations.
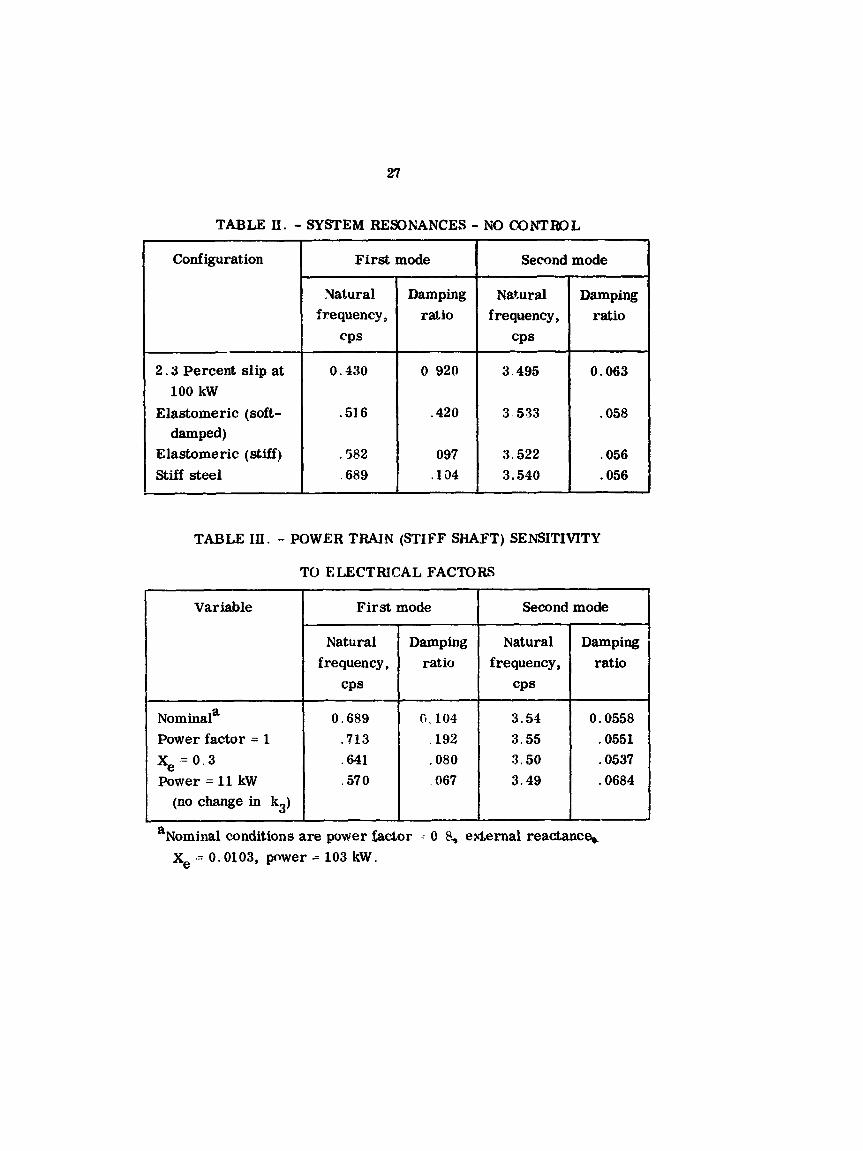
The systems' first and second mode natural frequencies and damping ratios corresponding to the peaks in the magnitude response plot are listed in table 11. It is seen that the different couplings affect primarily only the first mode clamping ratio. The ratio increases from 0.097 for the stiff elastomeric coupling, to 0.10

6
for the stiff steel shaft, to 0.42 for the soft-damped elastomeric coupling, to 0.92 for the 2.3 percent slip coupling. Note that the damping ratio for the stiff elasto- meric shaft is lower than for the stiff steel shaft, showing that a softer coupling lowers the resonant frequency but without enough damping may increase the reso- nant amplification.
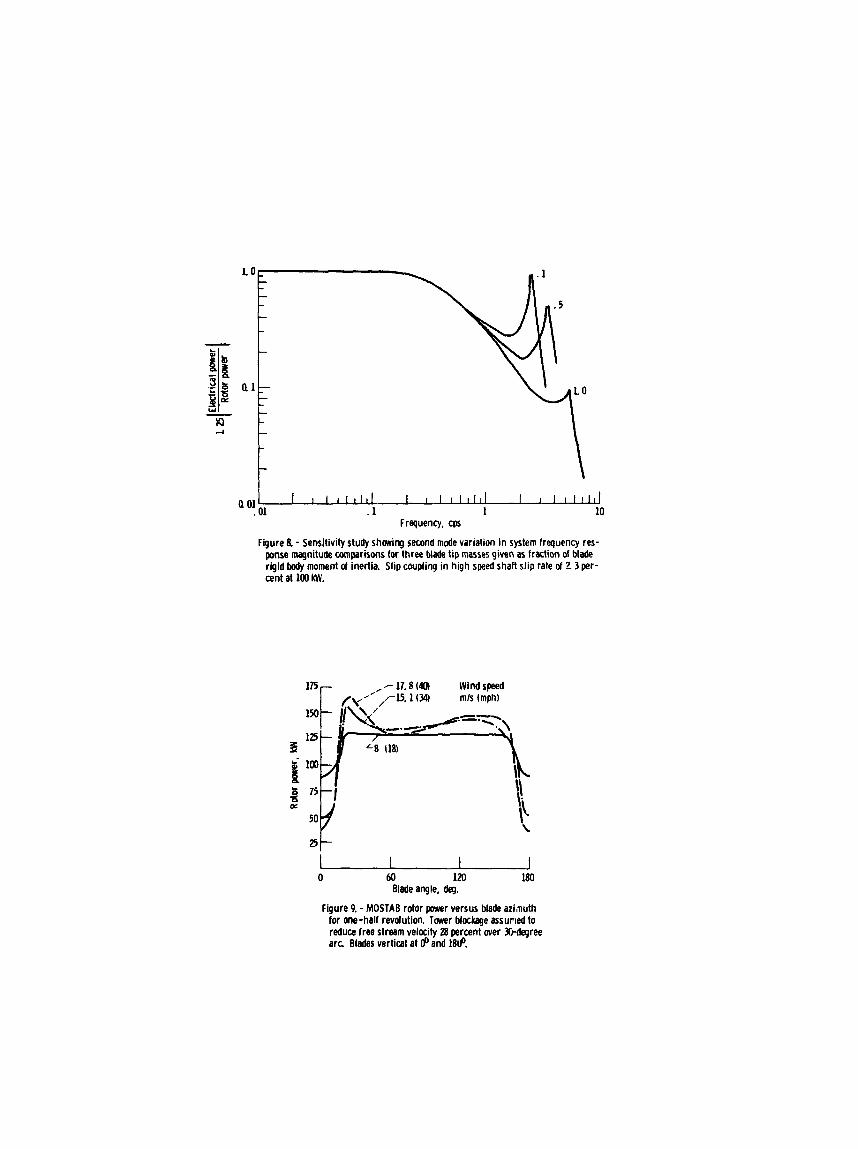
rigid body moment of inertia. System frequency responses with the slip covrgling configuration for three blade tip inertias of 0.1, 0.5, and 1.0 of the rigid body in- ertia are plotted in figure 8. To keep the results comparable, the blade's natural frequency and damping ratio with the hub fixed and the total moment of inertia of the blade tip plus hub were held constant. It is seen that the second mode of the power train is sensitive to the tip mass. The smaller tip mass results in more peaking at a lower frequency.
In another sensitivity study, changes in the generator and electrical tie line conditions were investigated. The sensitivity analysis was for one machine on an infinite bus with no active exciter control. The conditions were changed one at a time from the power factor of 0.8 to 1.0, the power level of 100 kW to 10 kW, and from the external tie line reactance of 0.0103 per unit to 0.3 per unit. Results are considered for the stiff shaft configuration because of its initially low damping. The power train's first and second mode characteristics are listed in table III. The first mode damping ratio increases for increased power factor and decreases for decreased power. The sensitivity to all changes, however, is small.
As discussed, the blade tip moment of inertia was set to one-half of the blade's
Periodic Response
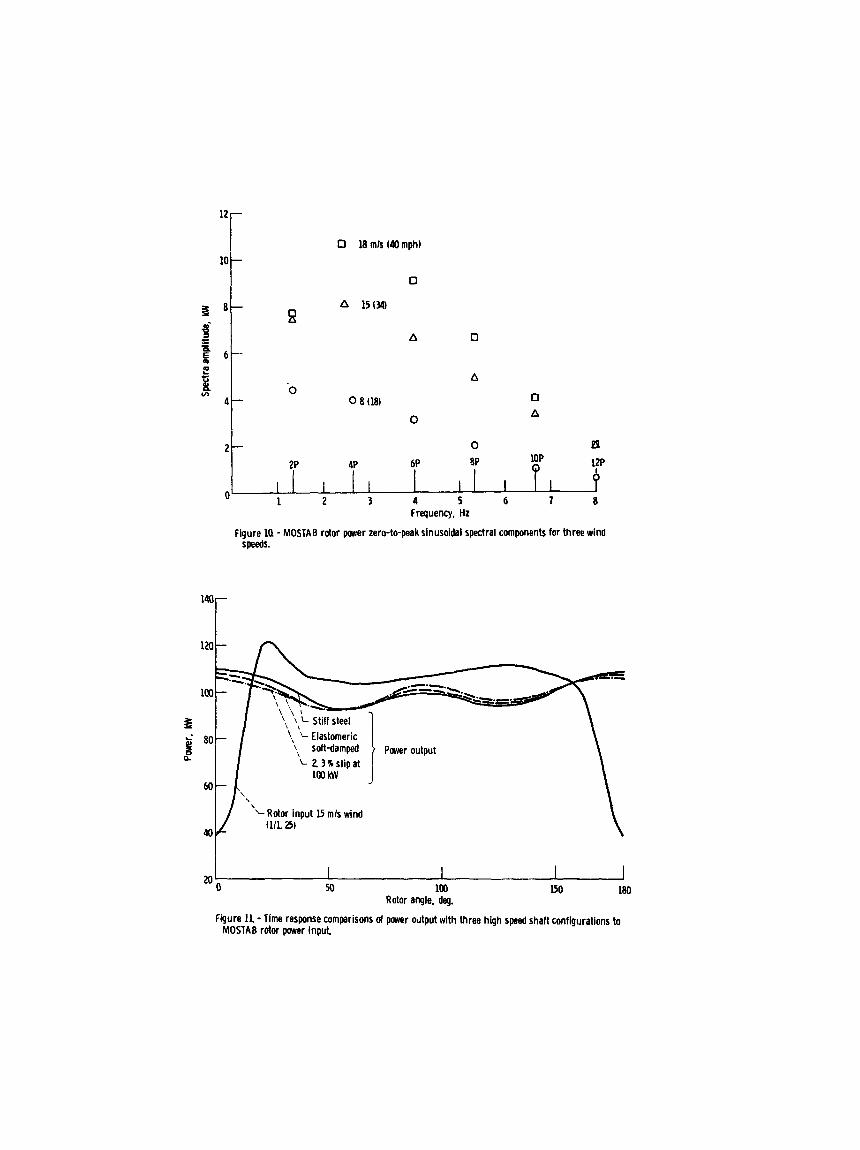
The periodic disturbances resulting from linear wind shear and tower blockage of the wind were calculated by the rotor aerodynamics program MOSTAB-WT ( re f . 10). (In the MOSTAB program the blade is divided into 12 segments and al- lowed to move in the flap direction. The program assumes a rigid rotating hub with no blade torsional dynamics. ) The time domain power variations calculated by MOSTAB for three different wind speeds are plotted in figure 9. In high winds the rotor power momentarily drops to less than half. The spectral components of the rotor power curves of figure 9 are plotted in figure 10. The curves have con- tent only at the even multiples of rotor frequency (2P, 4P, . . . ) which is the case for periodic disturbances to two symmetric blades.
A MOSTAB forcing function and the resulting responses in power output are shown in figure 11. The method used to obtain the power responses in the time domain was:

7
(1) Use MOSTAB to calculate the forcing function as a function of time. (2) Take a Fourier transform of the forcing function. (3) Multiply by the appropriate drive-train transfer function. (4) Take an inverse Fourier transform of resulting product.
The responses obtained for the three high-speed shaft couplings appear similar. The output variation displays a 2P and a 4P component nearly equal in amplitude. The maximum excursion of power is about 7 kW from the mean.
at the key (2P, 4P, . . . ) periodic frequencies are plotted in figure 12 for the slip coupling configuration with no blade pitch control. These magnitudes are less than the MOSTAB disturbance given in figure 10 by the attenuation of the power train. Consistent with the time response description, the 4P components are as large as the 2P components.
The spectral magnitude components of the output power (from step 3 above)
Closed b o p Pitch Control
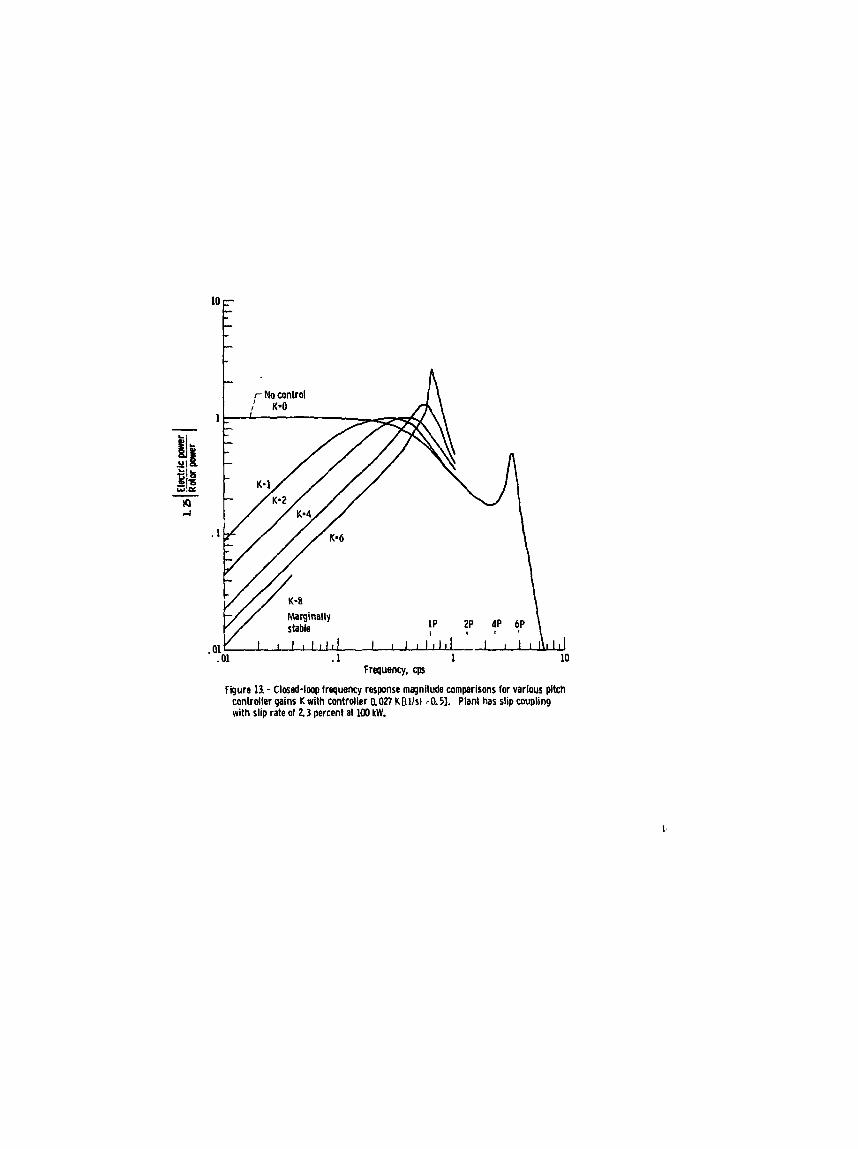
The proportional plus integral blade pitch controller w a s described in fig- ure 3. System magnitude responses with closed loop pitch control are shown in figure 13 for the slip coupling configuration for a family of controller gains each having the proportional gain equal to one-half of the integral gain. For a given integral gah, that ratio nearly maximizes the damping ratio of the first mode. Depending on gain, the control attenuates disturbances to a value between 0.7 and 0.2 of their open loop value at a frequency of 0.1 hertz. At a frequency a decade lower the closed loop amplitude is about a decade lower because of the integral control action. All responses peak above the open loop amplitude before reaching the system first =ode frequency. The peaking develops into a closed loop insta- bility with sufficiently high gains at about 0 . 6 hertz. The effect of the control is not significant at the (BP, 4P, . . . ! blade passing frequencies because the control bandwidth is less than the 2P frequency.
The effect of the ccntroller with the stiff steel shaft is similar to results shown for the slip coupling if a filter set to notch out frequencies near the system first mode is used in the control. The notch filter used was a second order zero with a damping ratio of 0.1 (to cancel the system first mode) over a second order pole with a damping ratio of 1.0. Of course, the control does not remove the first mode resonance, which continues to exist, but the control does not excite this reso- nance. Without the notch filter the stiff high-speed shaft coupling is harder to con- trol. For example, for system stability there can be no significant proportional gain and the integral gain must be low.

8
Wind Feed Forward Control
A wind feed forward control scheme using the wind speed signal as an open- loop input into the pitch angle control was investigaged as a means of attenuating the effect of wind speed changes. A schematic of the wind feed forward control is shown in figure 14. The anemometer used was insensitive to the wind direction and was located on the nacelle. It was about 4.6 meters upwind of the rotor and had about a 4.6-meter of air distance constant. These characteristics are modelled with an exponential lead and a lag. Figure 15, a c r o a plot of the data in figure 14, shows the pitch angle required to keep constant power for different wind speeds. The rated and low power curves shown have nearly the same slope, 1.342 deg/(m/s), thus one gain can approximate all power levels. The feed for- ward schedule is cut off for wind speeds below 8 m/s, and the output of the closed loop power control effectively biases the schedule up and down. A potential flaw in this scheme is that the wind speed measured by the relatively small anemom- eter may not be representative of the rotor average wind velocity.
the anemometer and pitch actuator dynamics. With an ideal measurement of the wind speed (one that is truly repreratative of the instantaneous blade average wind) and the assumed linear relation between wind speed and power, disturbances due to wind speed changes would be attenuated by the followirig factor
The wind speed correction has dynamics because the signal must pass through
distance upwind wind speed e
I - -
The frequency response magnitude of this expression is plotted in figure 16 for several wind speeds. It can be seen that the feed forward control theoretically should result in greatly reduced low frequency wind disturbance e r ror and er ror reduction up to about 2 hertz.
RESULTS AND DISCUSSION
As part of the search for a betler understanding of the Mod-0 power variations and the means to smooth them, experimental measurements of the power train dy- namics were made and compared with model predictions. Measurements were made for the three high-speed shaft couplings, a range of controller gains, and with wind feed forward control. The transfer function of generator power output- to-rotor disturbance was the key relationship sought.

9
Transfer Function Measurement
To obtain data on the response of output power to rotor disturbances, the blade pitch angle was intentionally disturbed. In figure 17, a schematic block diagram of the setup used to disturb the blade pitch angle is shown. A signal from a random noise generator was summed into the pitch command. The resulting pitch disturbance provided data for transfer function measurements. About 25 minutes of data were recorded to achieve statistically good results for each test. The taped signals were either analog or sampled adequately to be nearly analog for frequencies of interest below 10 hertz. The reduction of data to its spectral content and transfer function relationships was performed using a spec- trum analyzer (ref. 11).
For some tests in days of low winds, the generator was run as a motor driv- ing the blades as a fan. Comparisons showed that whether the generator was run a s a generator or as a motor did not significantly affect the transfer functions sought.
pitch angle change is shown in figure 18. The data are most reliable near 0.5 and 2.0 hertz as indicated by the high coherence. That is, the output is attributable to the input and not to some other plant noise. fiear zero frequency the coherence is low and the data are not reliable. The magnitude response does not hold a nearly constant value extending to zero frequency because wind speed changes compete with the test pitch disturbance. The action of the closed loop control is to sup- press power changes. This occurred primarily at low frequencies where the wind's content is concentrated (ref. 12), and where the loop ,ain is highest be- cause of the integral control. The coherence is also low near 0.7 and l. 3 hercz because of system 1P and 2P disturbances not related to the test disturbance. Beyond about 2.5 cps the coherence is generally near zero, and further results are reported to only 2.5 hertz.
the power train dynamic model would predict to be mar 3.5 hertz. A second mode resonance would be indicated by a peak in the magnitude response accompanied by a phase shift of 180' and high coherence, In the sensitivity study, it was noted that the second mode peak decreased for increased inertia in the blade tip. How- ever, it may not follow that the experimental nonobservance of a second mode can be used to increase the tip inertia because the cantilevered and tapered blade was represented by only a single mass.
An example measurement of the transfer function of electric power output to
There was no clear measurement of a system second mode resonance which

10
Stiff steel shaft I - A transfer function measured in high winds with the stiff steel high-speed shaft (no slip coupling) and the corresponding model predictions are compared in figure 19. The vertical magnitude axis scale is linear to more clearly illustrate the large resonance. The resonant frequency, that frequency where the phase is -90' and the magnitude peaks, is seen to be 0.69 hertz which is also the calculated value. The experimental resonant peak is lower than that predicted by the model. The experimental first mode damping ratio is estimated to be 0.22 which is more damping than the calculated value of 0.10 (table 11). In- creased damping could result from slippage in the V belts. About 0.3 percent slip was found; but it was not very repeatable. A 0.3 percent viscous slip in the model results in a 0 .2 damping ratio but lowers the calculated first mode fre- quency lower than the measured value. Alternative explah&t,ions include presum- ing the generator has more damping than calculated. It is n o r e likely, however, that nonlinearities become important for large swings in p ~ l - e r . Nonlinearities in a system ma!' appear to decrease a resonance because power input at one fre- quency may shift. upon output to different frequencieb and thus be missed in the data reduction.
Stiff elastomeric shaft. - A measured and calculated transfer function with the stiff elastomeric high-speed shaft is shown in figure 20. A large first mode resonant peak, similar to the results with the steel shaft, is evident in the plot. The observed resonant Lreguency is 0.54 hertz which is also the calculated fre- quency. From the transfer function magnitude and phase characteristics, the first mode damping ratio is estimated to be 0.22, which is more damped than the calculated value of about 0.1. It is noted that experimentally, both the elasto- meric and the steel shaft responses give a damping ratio of about 0.22. Slip in the V belts in the motoring mode where the elastomeric shaft test was run was much 1 2 ~ s than the 0.3 percent slip quoted for the steel shaft. The likely explana- tion for the greater apparent damping again being that, for large swings in power, nonlinearities in the system appear to reduce the resonant peak.
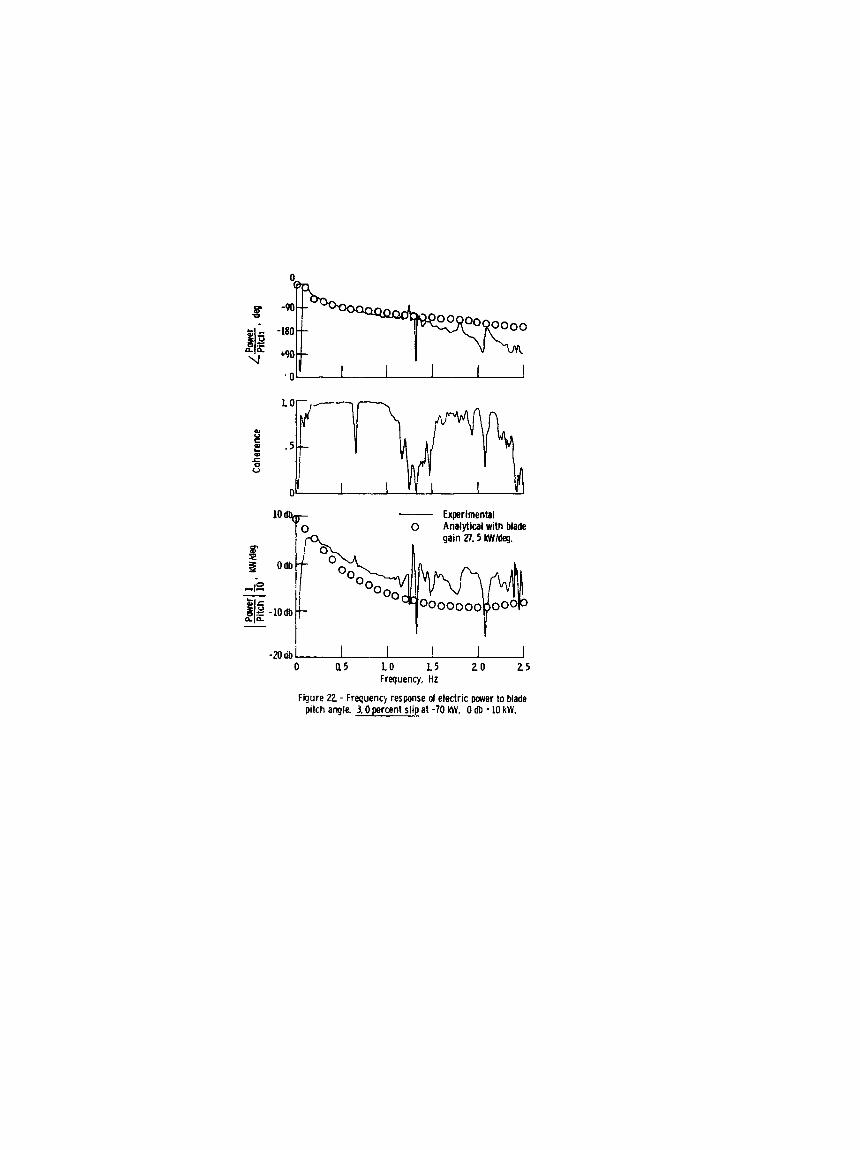
Slip coupling. - The calculated and measured system transfer functions for the slip coupling set to slip 1.5 and 4.7 percent at 100 kW are compared in fig- ures 21 and 22, respectively. The predicted responses are in good agreement through the fir& mode resonance of about 0.5 hertz. Near 2 hertz there exists a difference of about 10 dB or a factor of 3. This is discussed next.
Tower interaction. - In previous transfer function magnitude comparisons the amplitude responses of the model were lower than the experimental data near 2 hertz. Because measurements of tower motion correlate well with power varia- tions near that frequency it is believed that there is tower interation. Three ac- celerometers were mounted in perpendicular planes on the rear main bearing
11
support of the low speed shaft. Only the horizontal yaw results are reported; the other two planes were similar. To show the effect of tower motion on the power train, the path is broken into two parts. First, the response of tower acceleration- to-pitch is shown in figure 23, and then the response of power-to-tower accelera- tion is shown in figure 24. Judging from the coherences, this path is important only near 2 hertz where tower natural frequencies are excited. At 1.85 hertz it is interesting to note that I1acceleration-to-pitch1' (0.18 g/deg) times "power-to- acceleration" (107 kW/g) equals 19 kW/deg. This 19 kW/deg compares well with the direct value obtained from figure 21 of about 17 kW/deg measured (and 6 .;W/ deg calculated), Thus, with good coherence, the tower motion patn accounts for the higher response magnitude. Fortunately, tower motiorr does not cause a seri- ous problem for the Mod-0 because it occurs at a relatively high. and well placed frequency in comparison with the major excitation forces.
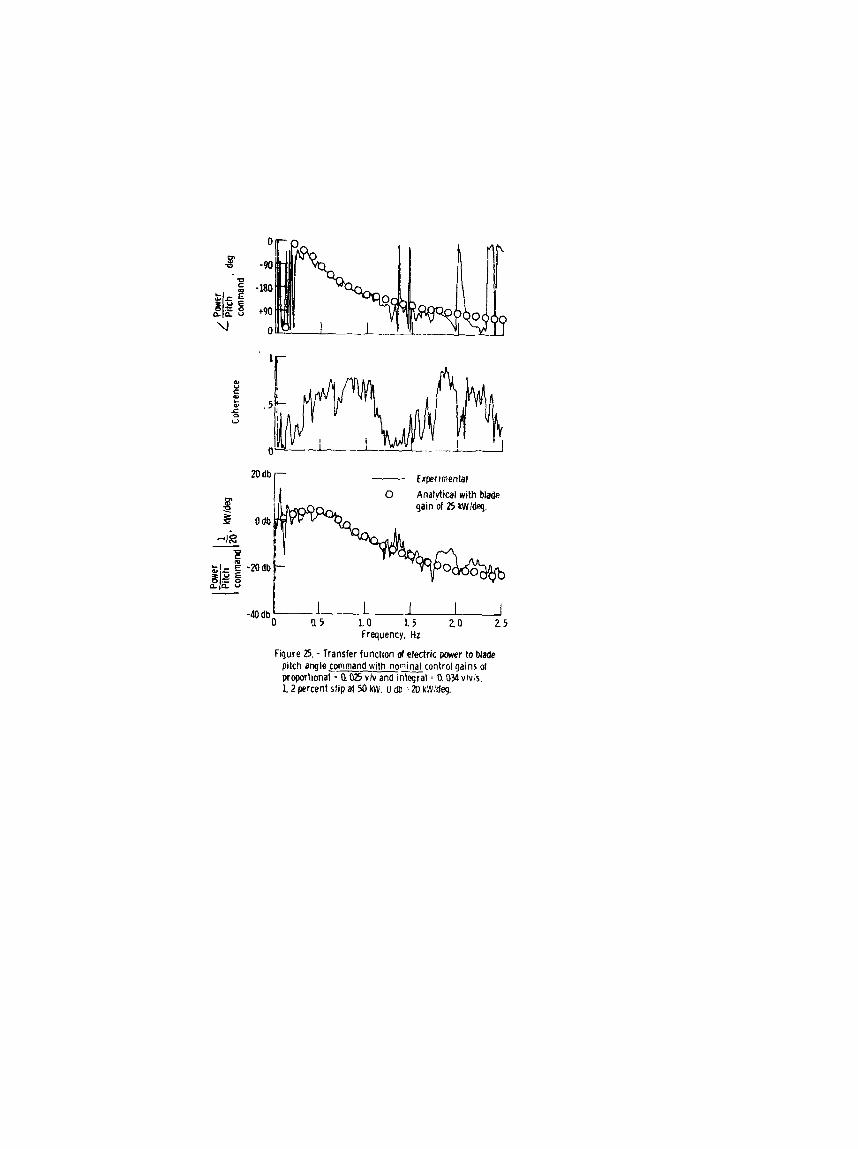
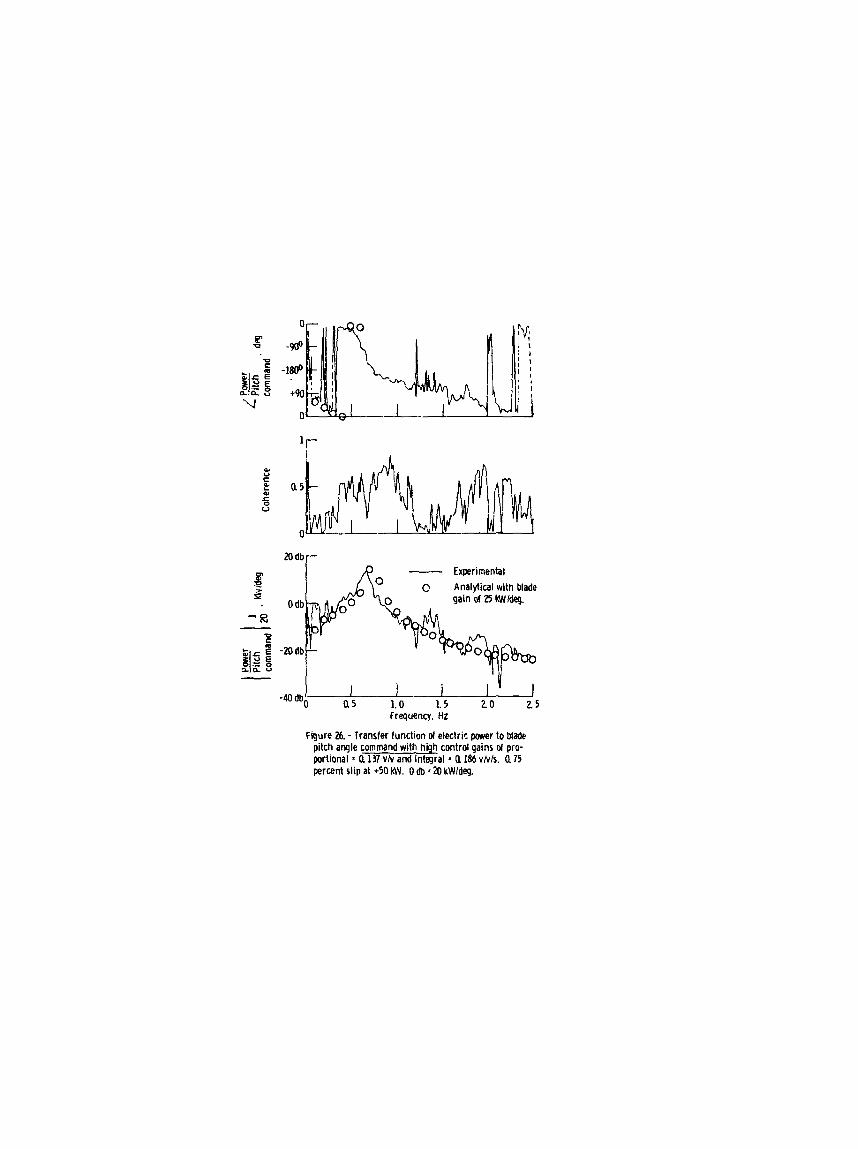
power-to-pitch command is shown in figures 25 and 26. Figure 25 was run at normal values of proportional and integral gain while in figure 26 the gains were increased by a factor of 6. Calculated responses are shown in both cases; it is noted that the analytical and experimental results agree well. The response with the high gain controller exhibits better low frequency attenuation but it is more resonant. The actual system was nearly unstable; it oscillated out of synchronism moments after completing the test tape. The model with that high gain was un- stable. The phase response calculations are shown to only the frequency of insta- bility. Obviously the control gain needs to be some compromise between attenua- tion at low frequency and amplification near the first mode.
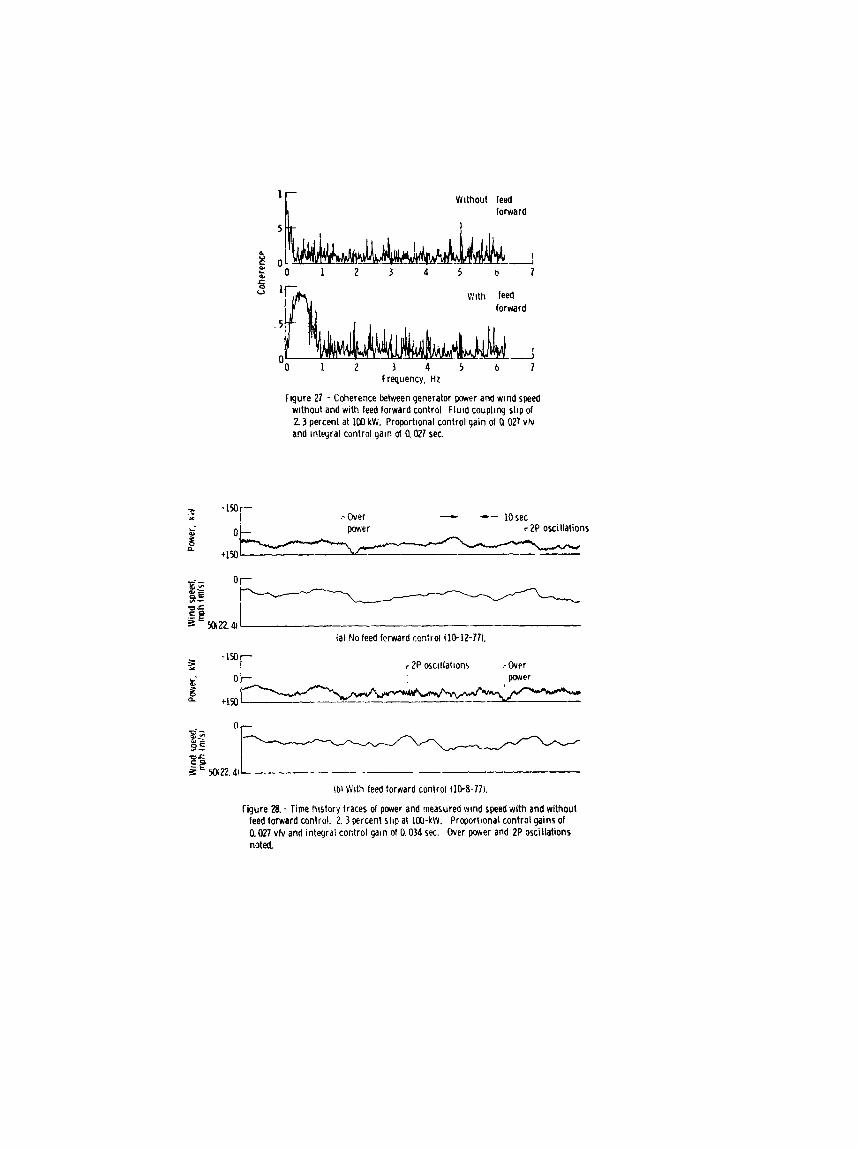
Wind feed forward. - Operational data recordings of the slip coupling configu- ration were made with and without wind feed forward control. Comparisons varied because of wind differences between runs and it was difficult to isolate the effect of the feed forward control. A comparison of the coherences of the responses of "power-to-the measured wind speed" is shown in figure 27. The argment for wind feed forward is that it. should decrease any relation between wind and power. It is seen that in both cases the coherence is mostly low and the transfer function data are not reliable. The coherence with feed forward showed a lower relation at the very low frequencies but a generally higher relation up to 1 hertz. This would indicate that the feed forward as implemented was increasing rather than decreas- ing power excursions resulting from unsteady wind conditions over a broad fre- quency range. This is attributed to the single, relatively small wind speed sensor not being a reliable indication of the instantaneous average wind over the circle of area swept out by the blades.
Control gains. - The effect of the controller on the closed loop response of

12
Power Time History
hmple time history traces of Mod-0 power variations about a 100-kW set point are sb?wn in figures 28(a) and (b). The power dropped below the set point sometimes because there was not enough wind. In circled areas labeled "over power", the power peaked to near 150 kW. In the figure 28(a), the case without wind feed forward, the overshoot was apparently in response to a gust of wind. It is no+zd that control action subsequently reduced the power level although the wind speed remained high. In figure 28(b), the case with wind feed forward, the power overshoot, occurred in response to a drop in the measured wind speed! Ap- paren:ly, the feed forward control over-corrected because the measured drop in local wind was not representative of the blade average wind speed. M i k e the model calculations of figure 11, the power exhibits oscillations at a Erequaicy of 2P fading in and out The 2P oscillzitions have at times about a 20-kW zero-to- peak amplitude for both low and high winds. This 20-kW (maximum) amplitude compares poorlv to a predicted (mean) amplitude of only 1.2 kW in a 8 . 9 m/s wind from figure 12.
Spectral Analysis of Power
A frequency domain spectral analysis of generatGr power measurements is shown in figure 29. The peak at the odd 1P multiple exists because, as was found, the blades were not pitched the same by a difference of 1.7'. The source of the peaks labeled "X" at. 2.56 hertz and at twice that frequency has not as yet been identified. There are peaks at the even multiples of the blade passing frequencies (2P, 4P, . . hroader . This may suggest that nonlinear o r higher order couplings exist. An- other possibility is that the flow field has random local distortions over only part of the bkde area and lasting only a few revolutions so as to modulate t k e periodic power around the 2P frequency. The buildup around the 2P peak was observed "real-time" during the data reduction. It appeared to be random, lending support to assumed unsteady local wind turbulence.
In figure 30, the frequency content in the peaks of the spectrum of figure 29 are compared with model predictions. The experimental peaks are not a single frequency as in the analytical case. The effective content of the broad peaks was calculated as the square root of the sum of the squares of individual analyzer readings. The analytical points were values from figure 12 divided by the square root of h o to convert zero-to-peak sinusoidal amplitude to root mean square power The coniparison shows good agreement at the 4P and 6P frequencies, but there is mucb more content in the experimental data at 2P and 8P. The 8P content
) . The 2P peak differs qualitatively from the others in that it is much

13
was small enough and at a high enough frequency to be insignificant. The average 2P output power content, about 4 kW rms, is about four times that predicted and is discussed further.
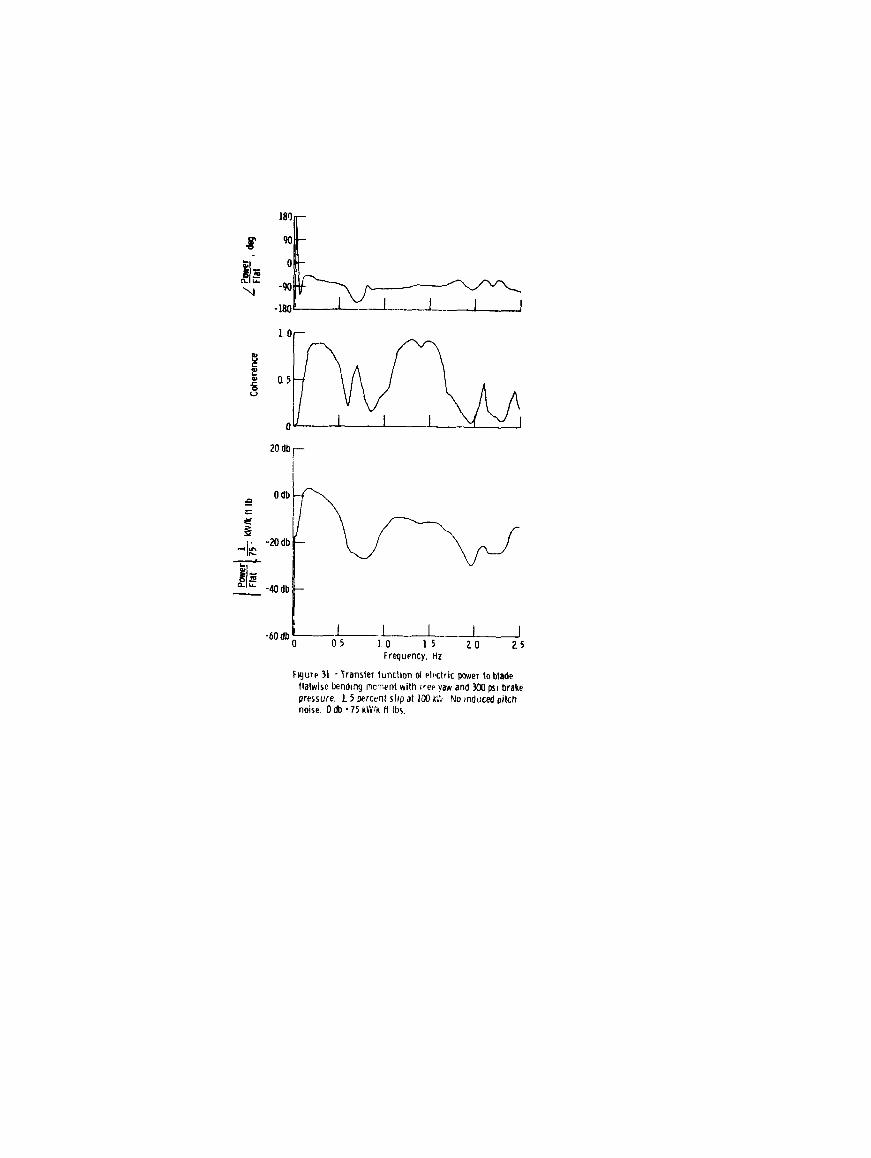
Power oscillation at the 2P frequency has just been shown higher than that predicted using input from MOSTAB for a fixed hub applied as a schedule to the power train torsional model. An insight is that the 2P power correlates well with the blade flatwise bending moment (a nontorsional moment and not in the model). Transfer function data between power and blade flatwise bending moment, from experimental data recorded during normal operation are shown in figure 31. Be- cause the coherence is high near the 2P frequency, it cu oe concluded that the 2P power variations result probably from a forcing function and not some unknown torsional resonance. A 2P forcing function not considered in the MOSTAB calcu- lations is nonlinear wind shear. The MOSTAB calculations assumed a linear wind shear of plus and minus 15 percent of the hub wind speed. This linear shear causes little net aero-torque variations as blade differences cancel. However, a quadratic shear with power portional to wind speed wouid increase the aero-torque variations. A calculation that does not include inertial effects from flap dynamics shows quadratic shear could about double the 2P spectrum content (add a 7.5 kW sinusoid to the 2P rotor input o r 1.3 kW rms to the 2P generator output). Another possible source of 2P power variation not considered in the MOSTAB calculations are random local turbulences.
CONCLUDING REMARKS
1. Oscillation of electric power near the one-per-rotor-revolution frequency (1P) was evident during early on-line tests of the Mod-0 with the stiff ha - speed shaft. This was found to result from a torsional power-train resonance near the 1P frequency having only a 0.10 damping ratio. The resonance-amplified 1P noise resulting from nonsymmetric blade-pitch settings. The control system (when without a first-mode notch filter implemented) further increased the oscilla- tion. The frequency of the first mode depends upon the power-train torsional spring rate. To shift the resonant frequency away from the 1P frequency and to add damping to the system so as to reduce the amplification, different high-speed shaft couplings were studied. The calculated damping ratio of the first mode in- creased to 0.42 fcr a soft-damped elastomeric coupling and to 0.92 for a fluid coupling set to slip 2 .3 percent at 100 kW. Experimental measurements of the system transfer function compared well with linear-model dynamics up through the frequency of the first mode. In particular, the ability of the slip coupling to damp the first mode in comparison with the stiff shaft was demonstrated experi- mentally,

2. Although the model predicted a significant resonance from the second mode of the power train, there was no clear measurement proving its existence.
3. A small tower motion was observed experimentally. However, tower mo- tion was not part of the power-train model.
4 . The measured power content near the two-per-revolution (ZP) frequency w a s broadband and had some four-times-greater content than predicted. The larger 2P power may resul t from local turbulences acting over only part of the blade area.
5. In a sensitivity analysis, dynamics of the power-train model (with constant generator excitation) were not significantly affected by small variations of the gen- erator and electrical parameters of power level, power factor, and tie-line reac- tance.
6 . Closed-loop pitch controller proportional-plus-integral-feedback gains were formulated that could attenuate low-frequency disturbances but only up to frequencies less than the system first mode. Excessively high gains drove the system toward instability at about 0.6 hertz.
to command pitch indicated virtual elimination of low-frequency wind effects and attenuation to frequencies well beyond the system first mode. But the large advan- tage predicted was not seen, on the average, experimentally because the measured wind speed did not represent the instantaneous wind speed past the rotor blades.
7 . Analysis of a wind feed-forward control scheme using a wind-speed signal

15
APPENDIX A
SYMBOLS
C
D
d
d
E
E~~ F
I
J
j
K1' %PKd k
P
9
R
Rs r
a r
S
T
Tb
Te v V
X
torque conversion, N-m/P. U . extet *a1 damping, N-m/(rad/sec)
direct axis
internal damping, N-m/(rad/sec)
rmsEMF, P.U.
field EMF, P.U.
torque, N-m
rms current, P. U . 2 inertia, N-m/sec
imaginary number
constants
spring rate, N-m/rad
rotor frequency
quadrature axis
resistance, P. tr .
gear ratio
reference axis
armature resistance, P . U . Laplace variable, sec'l
time constant, sec
blade torque, N-m
electrical torque, N-m
voltage, P. U.
wind velocity, m/s
reactance, P.U.
constant

16
synchronous reactance, P . U . mutual armature damper circuit reactance, P. U. admittance, P. U
angle between V, and Va, rad
pitch angle, deg
angle between quadrature and reference axis, rad
angle between E" and reference axis, rad
angle hetween reference axis and I,, rad
statfir rms subtransient flux linkage, P.U.
angle between I, and Va, rad
Subscripts :
a
d
e
IC
9
r
t
X
0
I.
2
3
4
5
6
a0
armature
direct axis
external
initial condition
quadrature axis
rcference axis
terminal
conjugate direction to r axis
open circuit
fir st blade
second blade
hub and low speed shaft
gear box and high-speed shaft
first pulley and "V" belts
second pulley and generator
infinite bus
Superscripts: 9 transient
( 1 sub+ransient summed impedance A

17
APPEhlIX B
MODEL
Mechanical Model
The differential equations of the mechanical model of the Mod-0 power train shown in figure 5 are listed below for a perturbation about an operating point.
Jlg2 = F2 - Ole2
J # ~ = F~ - F~ - F~ - D & ~
J 4 g 4 = R F - F 3 - R D 8 8 4 g 4 4
where the forces Fi between the inertias are
F3 = 5 ( 0 4 - 03) + d 3 t 4 - b 3 )
Generator Model
The differential equations for the generator model shown in the figure 7 block diagram are listed next.

18
where
3 = ra + R~
n X" = X" + xe
Model electrical parameters are given in table IV. The external tie line re- sistance and reactance values listed are for the Mod-0 Plum Brook Station location. The following four parameters listed were estimated as follows.

19
x" = (x; + x")/2 B
Tio = T;(x&/xJ)
IIVITIAL CONDITIONS
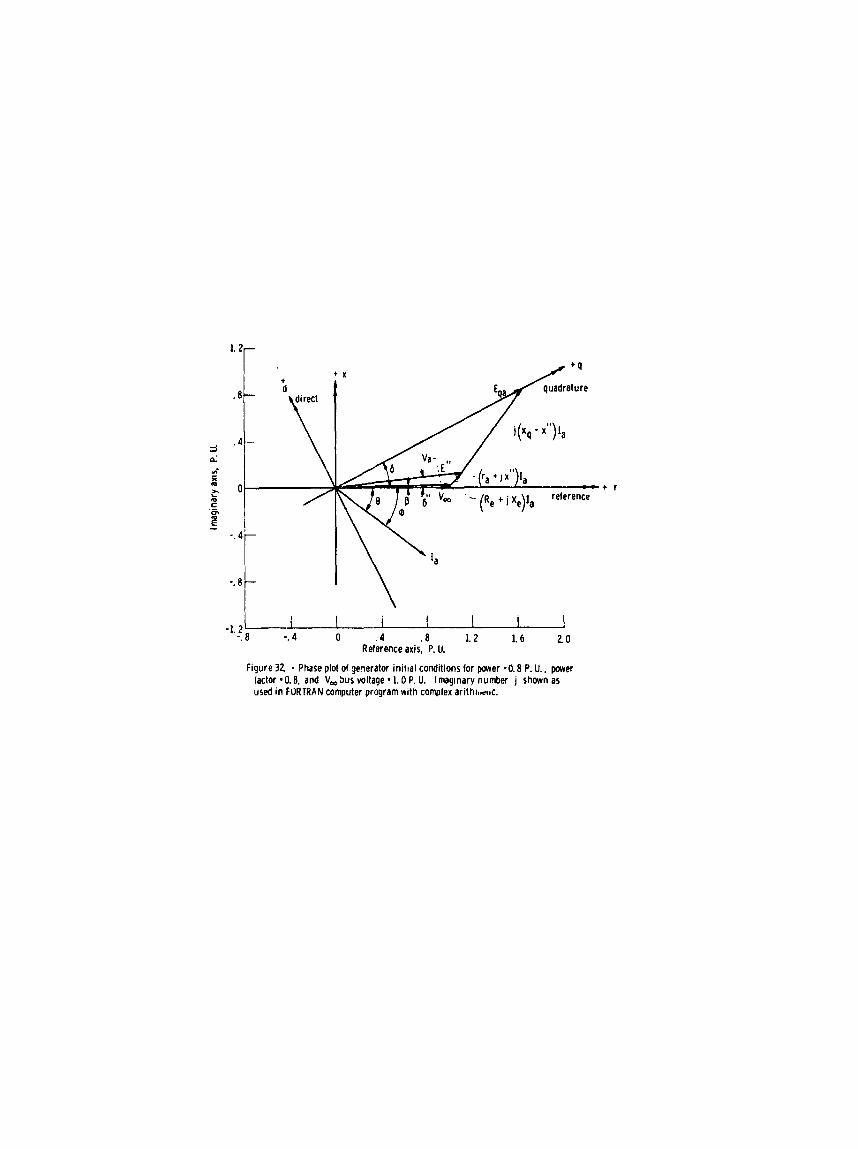
The a, s u e d Imown initial variables were not model states but the machine power, the power factor cos cp, and voltage of the infinite bus V,. An ini- tial condition phase diagram is given in figure 32. The model values derived are in the direct-quadrature axis which is a rotated mirror image of the refer- ence bus axis.
An estimate of current I, is
I, s machine power/(V, cos cp)
The power into the infinite bus is the machine power minus the transmission line ohmic loss.
2 bus power = machine power - Re',
The current 1, in phase with this power is
I, = bus power/V,
The derivation of the I, component follows. The coordinates of Va from figure 32 (or p. 161 of ref. 8 ) using complex arithmetic are
Va = V, + Ia(Re + jXe)
The angle p between V, and Vm is

20
B = tan-l 'xRe + 'rXe
The power factor angle 'p between Ia and Va is the arc cosine of the power factor.
4p = cos-' (power factor)
From figure 32
' p = p - e
where 8 is the angle of I , with the reference or
-1 e =tan (I&)
Thus ,
t a n q = t a n ( / 3 - 6 ) = t a n p - t a n e 1 +tan p tan e
which after substitution for 8 and p can be solved for I ~ .
9 - 4(-Xe f Re tan q)(-IrXe 2 + Ir)(Vm + Re1,#an 'p
2(-Xe -I- Re tan ~ p ) Ix = -vm f
The sign of the quadratic used was that for the minimum I, (a negative number). From figure 32 the F" and Eqa vectors with respect to the reference axis
are

21
These variables are related to the model d-q axis. The electrical angle d be- tweenthe q and r axes is
d = tan-'(Imag Eqa/Real E ) qa
The angle 6" of the E" vector to reference is
6" = tan"(1mag E"/Real E")
From figure 32 geometry
E;=- I E"( sh(6 - 6")
The other initial conditions can be found by setting the state equations to zero. The AD state equation and the E" equation are two equations in two unkuowne.
9
with solutions
E;=E;-K XI 2( d - % )Id
or using the definition of K2
E; = E: - (x i - x")Id
and

22
The E’ state equation solved for EFD is (4
The set of numerical values for the figure 32 nominal operating point and pa- rameters of table IV are liated below . Machine power. P.U. . . . . . . . . . . . . . . . . . . . . . . . . . . . . . ~ 0 . 8 Powerfactor . . . . . . . . . . . . . . . . . . . . . . . . . . . . . . . . . 0 . 8
lap. x) . . . . . . . . . . . . . . . . . . . . . . . . . . . . . . . (0.7953, -0.5898) V,(r, x) . . . . . . . . . . . . . . . . . . . . . . . . . . . . . . (1.0098, -0.0054) Eqa(r, x) . . . . . . . . . . . . . . . . . . . . . . . . . . . . . . (1.6517,O. 8411)
E”(r, x) . . . . . . . . . . . . . . . . . . . . . . . . . . . . . . . (1.1188,0.1225) 6, rad . . . . . . . . . . . . . . . . . . . . . . . . . . . . . . . . . . . . . 0.4110 b”, rad . . . . . . . . . . . . . . . . . . . . . . . . . . . . . . . . . . . . 0.1090 Te, P.U. . . . . . . . . . . . . . . . . . . . . . . . . . . . . . . . . . . 0.8176
I,, P.U. . . . . . . . . . . . . . . . . . . . . . . . . . . . . . . . . . . -0.5898
E:, P.U. . . . . . . . . . . . . . . . . . . . . . . . . . . . . . . . . . -0.3985
v-. P.U. . . . . . . . . . . . . . . . . . . . . . . . . . . . . . . . . . . . . . 1
I,. P.U. . . . . . . . . . . . . . . . . . . . . . . . . . . . . . . . . . . ,0 .7953
E”, P.U. . . . . . . . . . . . . . . . . . . . . . . . . . . . . . . . . . . 1.0525 9
C ;ad . . . . . . . . . . . . . . . . . . . . . . . . . . . . . . . . . . . . 0.6381 Id, P.U. . . . . . . . . . . . . . . . . . . . . . . . . . . . . . . . . . . -0.8865
I , P.U. . . . . . . . . . . . . . . . . . . . . . . . . . . . . . . . . . . . 0.4411
E’, P.U. . . . . . . . . . . . . . . . . . . . . . . . . . . . . . . . . . . 1.0565
b. P.U. . . . . . . . . . . . . . . . . . . . . . . . . . . . . . . . . . . 0.9546
EFD, P.U. . . . . . . . . . . . . . . . . . . . . . . . . . . . . . . . . . 2.8694
9
9

23
APPENDIX C
COMPUTER SUBROUTINES
Computer subroutines written in FORTRAN generated the initial conditione and state derivatives for a linear analysis package. These subroutines are listed in figures 33 and 34.
below. The FORTRAN symbols which are unlike the report symbols are defined
z(i) = e1 Z(l1) = 86
Z(2) = i1 2(12) = 86
z(3) = e 2 Z(13) = El
~ ( 4 ) = e2 Z(14) = A,,
z(5) = e3 Z(15) = E;
Z(6) = e 3 Z(16) = Te (lagged at 10 Hz)
z(7) = e 4 Z(17) = (3
z(8) = e 4 Z(18) = 3
z(9) = e5 Z(19) = controller state
Z(10) = e 5
CDl = DL, etc.
D1 = dl, etc.
K11 = kl
R 1 = Rg
DLT = 6" TM = IC
The F vector is the derivative of the 2 vector. For example, F(l) = 8, .. and F(2) = el. Other constants are

24
B = 2/0.112 s3rvo damping
ONVRT (in-lb/P. U . ) = torque high speed shaft
Gain (in-b/P. U . ) = transducer gain 10 V/kW x servo gain (9.4 deg/V) 160
x blade gain (42.6 kW/deg) x convert (6869 in-b/P. U. )
x speed ratio Rg (45 rpm/rpm

2s
REFERENCES
1. Symposium on Adequacy and Philosophy of Modeling: Dynamic System Per- formance. 1975 Winter Meeting IEEE, N \'., 1976.
2. Wind Turbine Project New York Univ , Engineering Research College, for Off ice of Production Research and Development, War Production Board, W. P.B.-144, Washlngtm, D. C. Jan. 31, 1946.
3. Johnson, Craig C . ; and Smith, R. T. : Dynamics of Wind Generators on Elec- t r ic IJtility Networks. IEEE Trans. Aerosp. Electron. Syst Vol. AES-12, no. 4 July 1976, pp. 483-493
4. Mirandy, L. P E Rotor/Generator Isolation for Wind Turbineo. AIAA Paper 77-572 Mar. 1977.
5. Barton, Robert S. : Mod-1 Wind Turbine Generator Analysis. Wind Turbine Structural Dynamics. NASA CP-2034, 1977, pp. 167-178.
6. Sullivan, T . L.; Miller, D. R.; and Spera, D. A : Drive Train Normal Modes Analysis for the FRDA/NASA 100-Kilowatt Wind Turbine Generator. NASA TM-73718, 1977.
7. Chamis, C . C . ; and Sullivan, T . L : Free Vibrations of the ERDA-NASA 100 kW Wind Turbine. NASA TM X-71879, 1976
8. Anderson, P. M . ; and Fouad, A . A : Power System Control and Stability. Vol 1. The Iowa State University Press, 1977
9. Seidel, Robert C. : Computer Programs for Calculation of Matrix Stability and Frequency Response from a Sate-Space System Description. NASA TM X-71581, 1974.
10. Hoffman, John A. ; and Holchin, Barry W . : Modifications to MOSTAB for Wind Turbine Applications. MRI-2711, Mechanical Research, hc., 1974.
11. Instruction Manual for the Model O-FFT 400, OMNIFEROUS Fast Fourier Transform Analyzer System. Nicolet Scientific Corporation, Northvale, N . J . , 1976.
12. Lumley, J . L. ; and Panofsky, H . A , ; The Structure of Atmospheric Turbu- lence. Interscience Publishers, 1964.
26
TABLE I. - MECHANICAL PARAMETERS
Station subscript
1 9 “ Four 2 . 3 per-
cent slip Four steel Four elastomeric
(soft-damped) Four elastomeric
Five slip Five no slip 6
(stiff)
Station subscript
~ ~~
1 3
Four 2 . 3 per- cent slip
Four steel Four elastomeric
(soft-damped) Four e la st,ome r i c
( stiff) Five slip r’ive no slip 6
Inertia J, N-m-sec 2
31 930 64 686
2 859
1 154 1 154
1 1 5 4
.1 .69 .86 .ll
(a) SI units
Stiffness k, N-m/rad
I 682 968 a558 4 7 7 e
0
75 474 65 4
3 054
20 337 20 337 ------
(b) U.S. customary units -
inertia J, 2 lbf-in-sec
262 600 572 520
25 300
10 210 10 210
10 210
15 7 .6
24.2
Stiffness k. Ihf - in/ rad
68 000 000 a4 943 ooo&w
0
668 000 5 79c
27 039
180 000 i ao 001,
Internal
N-m (rad/sec)
33 895 2 260
131
21 366
ki@ng d,
122
17 17
---
Internal lamping d,
Ihf- i n ( rad jsec)
900 000 20 000
1 160
1 %
3 2-40
1080
150 250 ---
External
-Ping D, N-m
(rad/sec)
3051 114
0
.113
.113
.113
.113
.07
.07
.18
External damping D,
lbf - in ( rad/sec)
27 000 1 0 1 0
1 . 0
1 9 1.0
2.0
.62
.62 1 6
“Linearized ahout steady state. Curve Tit t;, stiffnesses of l ~ w speed shaft p!us Falk coupling plus gears .
27
Configuration
TABLE LI. - SYSTEM RESONANCES - NO CONTROL
I Second mode First mode
Damping ratio
0 920
.420
I
097 . I04 I
Natural frequency,
CPS
3.495
3.533
3.522 3.540
2.3 Percent slip at 100 kW
damped)
Stiff steel
Elastomeric (soft-
Elastomeric (stiff)
Damping ratio
Natural frequency ,
CPs
0.430
.516
582 ,689
0.063
.058
.056
.056
TABLE III. - POWER TFWN (STIFF SHAFT) SENSITIVITY
TO ELECTRICAL FACTOW
Variable First mode Second mode
Natural Damping Natural Damping frequency, ratio frequency, ratio
CPS
0.689 6.104 3.54 0.0558 Power factor = 1 .713 .192 3.55 .0551 xe = 0.3 .641 ,080 3.50 .0537 Power = 11 kW .670 ,067 3.49 .0684
(no change in k3)
aNominal conditions are power b e t o r 1 o 8- e*ernal reactanca, Xe .= 0.0103, power = 103 kW.

28
TABLE IV . . ELECTRICAL PARAMETERS
T;. sec . . . . . . . . . . . . . . . . . 0.0085
Tio. sec . . . . . . . . . . . . . . . . . 0.062 Thy 6ec . . . . . . . . . . . . . . . . . . 0.145 Tio. sec . . . . . . . . . . . . . . . . . 0.011 Tio. sec . . . . . . . . . . . . . . . . . 1.942 xi. P.U. . . . . . . . . . . . . . . . . 0.128 xby P.E. . . . . . . . . . . . . . . . . 0.165 xds P.U. . . . . . . . . . . . . . . . . 2.21 x" P.U. . . . . . . . . . . . . . . . . 0.193 9'
5 . P.U. Xd. P.U.
Kl. P.U.
K2. P.U.
S d . P.U.
x". P.U.
Kd. P.U.
ray P.U.
Re. P.U.
xe. P.U. v . P.U.
ob
. . . . . . . . . . . . . . . . 0.05
. . . . . . . . . . . . . . . . 2.16
. . . . . . . . . . . . . . . 0.1605 0.961
. . . . . . . . . . . . . . . . 0.039
. . . . . . . . . . . . . . . . 0.696
. . . . . . . . . . . . . . . . 1.965
. . . . . . . . . . . . . . . . 0.018
. . . . . . . . . . . . . . . 0.00466
. . . . . . . . . . . . . . . 0.01031
. . . . . . . . . . . . . . . . . . . 1
. . . . . . . . . . . . . . . .
Base kilovolt.amperes. kVA . . . . . . . . 125 Basevoltage. V . . . . . . . . . . . . . . . 480 Base ohms. ohms per phase wye . . . . 1.843


Disk Brake - Fiuid coupling -,
v-belts 7
aduator
Figure 2 - MoU-0 turbine generator schematic d nacelle interior.
W i n d mls
Electric power, kW Dr iwe train
Figure 3. - Blodc diagram d closed Imp power control.

e,
Figure 4 - Block diagram of simplified paver train model showing inertial masses and torsional springs and dampers.
Figure 5. - Block diagram of generator third order dynamic model connected to an infinite bus through algebra equations.

7m -
Blade pitch angle at 314 radius, deg
Figure 6. - Rotor performance map Operating point tangents show blade gain at twa wind speeds.

Figure 7. - Power train frequency response magnitude comwrisons for three high speed shaft configurations
Frequency, cps
Figure - Sensitivity study shaving second mode variation in system frequency res- ponse magnitude comparisons tor three blade t ip masses given as fraction of Made rigid b d y moment of inertia. Slip coupling in high speed shaft slip rate of 2 3 per- cent at 100 kW.
+ 0 60 120 180
Blade angle, dsg.
Figure 9. - MOSTAB rotor power versus blade azinuth for one-half revolution. Twer blockage assuned to reduce free stream velocity 28 percent Over %-degree arc. Blades vertical at @ and 18@.
12
10
z 5- r a. E rn
vl f
0
A
-
-
6 -
4- 0 a
2- 0 ep
2P 4P 6P 8P lOP 1?P
i I I I P
Figure 1Q - MOSTAB rotor power zero-to-peak sinusoidal spectral components for three wind speeds.
9' 8o tl \\ soft-damped i Paver output
\ .
\\ \\L Stiff steel \, Elastomeric \
\ I / .L Rotor input 15 mls wind
W L 25)
\ 50 im 150 180
Rotor angle, deg.
figure 11 - Time response comparisons of pvuer odtput with three high speed shaft configurations to MOSTAB rotor power input

0 0 17.8 m k (40 mpht A l5.0(34)
0 A
0
8P IOP
Figure 12 - Calculated spectral content of power output (with 2 3 percent slip at 100 WU in slip couplingt in response to MOSTAB rotor power input tor three wind speeds.
10
1
. 1 v+:;,, I , I 2P I t 1 4 P * ! l , , , ,
I 01 .1 1 10 Frequency, cps
. 01
Figure 13. - Closed-loop frequency response magnitude comparisons for various pitch controller gains K with Controller a 027 K [(Us) rO.5) . Plant has slip coupling with slip rate of 2 3 percent at 100 kW.
1

Wind, rnls -
Electric power, kW
I Anemometer I L ________-_- - J
Figure 14 - Block diagram of closed loop power control and wind feed forward contro!.
Windspeed. m h
Windspeed. mph
Figure IS. - Derlvation of wlnd feed forward gain as slope of straight line approximation to curves of constant m e r In pitch angle ver- sus wind soeed.

T-8 m h (18 mphl \
Frequency, Hz
Figure 16. - Frequency response rdagnitude plot of theoretical attenuation d disturban- ces due to wind speed changes with wind feed forward control for three wind rpeeds.

angle - lind Q -- - 1 )
Electric power
Plant

0
-90
180
90
0
! _-L_A---L_- I 1 I 1 7 1 3 a 5 6 7
I -40 db 0
Frequency. Hr
Figure 18. - Exprimectal phase, coherence. and magnitude frequency response plot of electric mer-to-blade pitch angle. L !3 percect slip at -70 kW. 0 dt, = 5 W'dey.

L O
0, u c E f Q 5 u
0
- Experimental 0 Analytical with 30
Wldeg. blade gain
1 5 2 0 2 5 Frequency. Hz
Figure 19. - Transfer tundim d electric pacer to Made pitch angle lor= high speed shaft +70 W.

0
80 r- Experimental
0 Analylical with 20
60 /-- kWldeg. blade gain 0 Analylical with 20
kWldeg. blade gain
Frequency, Hz
Figure - Transfer function of electric m e r to blade pitch angle for elastomeric high speed shaft -50 kw.

Experimental - 0 Anelytkal with blade gain n. 5 kwldeg
' 0 i I I J
10 db
G a5 L O L 5 2 0 25 Frequency. Hz
Figure 21 - Frequency response d electric paver to Made pitch angle. L Il5 percent slip at -70 R. 0 db * 10 It#ldq.
Loy-7-J . s t -
0' I I I I
10 d+ Experimental 0 Analytical with blade 0
gain 27.5 Wldeg.
f Odb
-1s t r 0-0
- -10db r -
0 a5 L O 1s 20 25 Frequency, HZ
Figure 22 - Frequency response d electric m e r to blade pitch angle. 3.0 percent slieat -70 kW. 0 db = 10 kW.
-20 db

6
8: -900
Ai 'v +96
'6
u
$g -166
Frequency. HZ
Figure 23. - Transfer function rJf horizontal accdfratim of main bearing to Ditch change 1 05 3erwnt slio at -70 kW Odb = 053391dq-

U l d b r
a5 1. 0 1. 5 20 25 -60db L 2-
0 Frequency. HZ
Figure 24 - Transfer function of electric p w e r to horizontal acceleration of main bearing. 1.05 p e r c m i p at -70 MN. 0 db = 750 kWldeg.
ll-
2 0 d b p -- Experimental 0 Analytical with blade
&’ gain of 25 kwldeq. 9 Odb
4 2 - 5) c m E -2Odb
S1.G !z caov -
0 a5 1. 0 1. 5 2 0 25 Frequency, HL
-40 db
Figure 25. - Transfer function of electric power to blade pitch angle command with nominal control gains of proportional = Q 025 vhr and integral = 0.034vhris. 1.2 percent slip at 50 kw. u db = 20 kWibeg.
'I-
20 db - Experimental P 0 Analytical with blade 2
c_
0
I 1 J a5 1.0 1.5 2 0 2.5
Frequency. HZ
Figure 26. - Transfer function ol electric m e r to Made pitch angle command with high control gains of pro- portional * a 137 vhc and integral * a I86 v,'v/s. a 75 percent slip at +SO kW. 0 db '20 kWldq.
-40 dbo
Without feed forward
5
a $ 0 L
w i t h leed u L forward
. 5
7 0
0 1 2 3 4 5 6 Frequency, HZ
Figure 27 - Coherence between generator power and wind speed without and with feed forward control Fluid coupling slip of 2 3 percent at 1M) kW. Proportional control gain of 0.027 vlv and integral control gain of a 027 sec.
z -1%- 10 sec z -Over .-) e-
'.power r 2 P oscil lations 0- i
n - 6
t - - - - - - V ---------%
501n.41 - (a) No feed fcrward control (10-12-771.
-My B .2P oscillation) ,- Over i power
__I- __-
Uk=
!bl With feed forward conlrol 110-8-77).
Figure 28 - Time history traces of power and measured wind speed w i th and without feed forward control. 2. 3 percent slip at 100-kVY. Prwor t i ona l control gains of 0.027 vlv and integral control gain of 0.034 SQ. Over power and 2P oscillations noted.

Peak b I ..__I,
2x 20 db Peak " X " I
I 0 1 2 3 4 5 6 1
Frequency, cps
Figure 29. - 12-12-77 Spectra of generator electric power. 2 3 percent at 100-kW. Proportional control gains of 0.027 vlv and integral control gain of 0. OM sec. No wind feed forward con- trol.
I
A
A 0
E E
L LL
A MOD-Odata 0 MOSTABllinear
analysis
0 B A
0
. O l 0 A ZP 4P 6P 8P
Frequency, multiple per rev
Figure M . Comparison of analytically predicted and measured frequcncy content of peaks in leneratcr power.
* O d b r
0 o s 1. 0 1 5 20 2 5 -60 db
Fregupncy. HZ
Fyuw 31 -Transfer function Of eli~ctric pmer to blade flatwise bending mcllen! rrith ireo y a w and 300 psi brake pressure. 1.5 percent slipat 100 kl'? No induced pitch noise. 0 db = 75 kk'drk 11 Ibs.
1. 2 r
. a
. 4 a 0' g
+ r m g o - P .-
-. 4
-. a
I i ! -. a -. 4 0 . 4 . a 1. 2 1. 6 2 0
Reference axis. P. U.
-1. 2
figure 32 - Phase plot of generator inittal conditions for power =O. E P. U., power factor *O. E. and V, bus voltage * 1.0 P. U. Imaginary number j shown as used in FORTRAN computer program with complex a r i t h i O p d .

Figure 33. - Subroutine CNSTS Fortran lining.

ORIGINAL PAGE IS OF POOB QUALsryi
Figure 34. - Subroutine HPRC Fortran listing.

1 Report No
NASA TM-78997 2 Government Accesrmn N o 3 Recopient's Catalog No
! E Abstract I
I Progress in explaining variations cf power experienced in the owline operation of a 100-kW experimental wind turbine-generator i s reported. Data are presented that show the oscillations tend to be characteristic of a wind-driven synchronous generator because of low torsional damp-
uniform wind flow. The report includes dynamic analysis of the drive-train torsion, the gener- !
ator, passive driveline damping, and active pitch control as well as correlation with experimen- i tal recordings. The analysis assumes one machine on an infinite bus with constant generator- field excitation.
/ ing in the power train, resonances of its large structure, and excitation by unsteady and non- /
1
4 Titie and Subt#tir
POWER-TRAIN ANALYSIS FOR THE DOE/NASA 100-kW WIND TLrRBINE GENERATOR --i
5 Report Date
October 1978 6 Pwfotming Organmtoon Code
7 Authar3si
Robert C. Seidel, Harold Gold, and Leon M. Wenzel
9 Performing O:ganrzataon Name and Address
National Aeronautics and Space Administration Lewis Research Center Cleveland, Ohio 44135
I2 Sponsoring Agerry Name and 4ddrerr
Division of Distributed Solar Energy Washington, D.C. 20545
U. S. Departmen, of Energy
i 8 Performing Organization Rowrt Pdo
E-9413 10 lliori Unit No
I
j 11 Contract or Grznr No I
1 I
I
Technical Memorandum I 14 S~wrsorlng Agencv -Report No. 1
DOE?NASA/l028-78/19 ! {
13 Type of Report and Period Cove&
7 Ket Words (Suggested by Authorlst 1
Wind turbine Power train D y na mins
18 Distributmn Statement
Unclassified - unlimited STAR Category 44 DOE Category UC-60
I9 Securitf Classif fof this report,
Unclassified 20 Security Classif (of this pagel 21 No of Pages 22 Price'
Unclassified