power supply magneticsgonascent.com/papers/optical.pdf · power supply magnetics ... suchmaterials...
TRANSCRIPT

Power Supply Magnetics Part I: Selecting Transformerllnductor Core Material Donald E. Pauly, Consultant, Sponsored by The Arnold Engineering Company, Marengo, Illinois
A review of magnetic theory and core applications from DC to 100 kHz. Materials covered include silicon steel, powdered iron, Sendust, Molypermalloy, Hi-Flux TM and ferrites.
s witching power supply trans- formers andinductors require theuse of high performance core materials. Choosing the proper core material for a specific application requires an understanding of core material tech- nology.
A good start on understanding the magnetic principles is magnetizing force, which is proportional to the number of ampere turns and inversely proportional to the magnetic path length. The cgs and mks units of magnetizing force are the oersted and the ampere-turnlmeter, respec- tively. The cgs and mks units of magnetic flux density are, respec- tively, the gauss and tesla. One oer- sted is 79.6 ampere turnslmeter (2501~) and 10,000 gauss is one tesla. Magnetic flux density is designated by B, and magnetizing force is desig- nated by H. A flux change of 1 gauss per second over a square Cm of core area will induce 1 o - ~ voltslturn. One volt will be induced in a turn of wire that encloses one square meter of core area and whose flux density changes at one teslalsec.
In non-magnetic materials, B is a linear function of H. Iron, cobalt and
nickel, are examples of ferromag- varying degrees of nonlinear flux netic materials. When subjected to a levels. magnetizing force, suchmaterials and The flux level ofmagnetic materi- many oftheir alloys have much higher als reaches a limit called saturation, internal flux levels than non-mag- regardless ofhow much magnetizing netic materials. As the magnetizing force is applied. Saturation flux lev- force varies, these materials have els of various magnetic materials
Figure 1. BJH Curve of Typical Soft Magnetic Material With Large Hysteresis.

Power Supply Magnetics may range up to 24.5 kilogauss. Ferromagnetic materials also retain various amounts of permanent magnetism after removal of the magnetizing force.
Magnetic materials vary in their ease of magnetiza- tion, which is described by their permeability and desig- nated by p. Material maximum permeabilities can range up to 1,000,000 for Supermalloy. The permeability ofair is 1.0000004 and may be considered equal to that of a vacuum. As long as a magnetic material remains linear and has no appreciable hysteresis, B = H x p. For large magnetizing forces, ferromagnetic materials cease to obey this relationship and become nonlinear.
Any permanent magnetism in a material constitutes stored energy. An amount of demagnetizing force called the coercive force (Hc) is necessary to demagnetize the material. Materials that are easy to magnetize and de- magnetize are referred to as soft magnetic materials. Residual flux in soft magnetic materials ranges from 50 to 15,000 gauss and coercive force varies from .0 1 to 10 oersteds.
BIH Curves Figure I shows the behavior of a typical soft magnetic
material having a large amount of hysteresis. It was initially demagnetized and then driven with an AC signal for a magnetizing force. Flux density in gauss is shown along the vertical or B axis and magnetizing force in oersteds is shown along the horizontal or H axis.
The relationship of energy storage to B/H curves will now be explained with winding resistance effects ig- nored. The voltage (E) across a winding is proportional to the product of the rate of change of flux (dB/dt), the core area (A), and the number of turns (n). The current (I) required to drive a given core is proportional to the desired magnetizing force (H) and path length (I), and inversely proportional to n.
The power (P) supplied to the core at any given instant is the product of the voltage and the current. When multiplying the expressions for E and I together we find that the number of turns cancel and that P is the product of A, 1, H, and dB/dt. The product of A and 1 is the core volume or v. To find the energy provided to the core (U), we must integrate.P over the time interval during which the core flux is changing. P=vH(dB/dt), so Pdt=vHdB, where v is a constant. The integral of Pdt or U is the energy expended by the drive source and the integral of vHdB is the energy stored in the inductor. The integral of HdB is the energy stored in the core per unit volume.
Figure 2 shows the current increasing from zero to a positive value, which makes the voltage positive. The energy stored per unit volume is not the area under the curve but rather the area to the left of the curve. This is because B is plotted vertically and H is plotted horizon- tally. If it was a H/B curve, the energy stored would be the area under it.
Energy Input
A B Segments
Figure 2. Area of All Rectangles Is Total Energy Stored Per Unit Volume.
If the current decreases from a positive value toward zero, the voltage will be negative while the current is still positive. Note that Figure 3 is elevated above the curve in Figure 2. This is a region where the core delivers energy back to the drive circuit. The area to the left ofthe curve is now the energy returned from the core to the drive circuit. Due to hysteresis loss, eddy current loss, and residual loss this energy is always somewhat less than the energy originally stored in the core.
The difference between the area left of the curves of Figure 2 and Figure 3 is simply the area inside the right half of the loop of Figure I. This is also the hysteresis energy lost in a half cycle of operation. The energy lost in the other half cycle of operation is the area inside the left half of the loop ofFigure I. Therefore, the total core loss per unit volume for a complete cycle of operation is the area inside the B/H loop plus the eddy current loss and residual loss.
Saturation No satisfactory standard exists in the industry for
definition of the saturation point of core materials. Identical core materials made by different manufacturers are advertised with different saturation levels because of different measurement methods. These published figures are much higher than practical operating levels and are frequently misleading to the designer.
In Figure 4, at point 1 the AC permeability is 60, at point 2 it has decreased to 30, and at point 3 it has been reduced to 15. Most filter choke applications have enough DC present at the operating point to reduce the AC p to one-half its low level value. By the time the AC perme- ability has dropped to one-eighth of its initial value, the core may usually be considered saturated. AC perme- ability is the main parameter of interest to filter choke designers.

The DC permeability of a core may be defined as BIH. This ratio is the same as p. at low drive level and becomes progressively smaller as the drive level is increased. Here, satura- tion is defined as the point where the DC permeability has dropped to half its initial value or p.12. The DC per- meability is the average AC perme- ability over the entire drive range.
At point 4 in Figure 4, the DC permeability is 30 and the core meets the definition of saturation. Here H is 227 oersteds and B is 6700 gauss. The AC permeability is about 7.5 at this point. Core properties at higher drive levels are of academic interest only. Using this methodof saturation measurement allows ready compari- son of the energy storage capability of any permeability core.
DC permeability is easy to mea- sure and is repeatable. At the point of saturation, AC permeability will usu- ally have decreased to about one- eighth of its initial value. This de- pends to some extent upon the exact shape of the BIH curve, but the satu- ration figure coincides with the end of usefulness of the core in practice. The proper operating level of a core depends upon its specific applica- tion, but meaningful saturation speci- fications greatly assist in its determi- nation. Saturation levels given here
Figure 3. Area of All Rectangles Is Total Energy Returned Per Unit Volume.
7 Segments
may not agree with published data of manufacturers using different mea- surement methods.
Energy Return
-H
I7 Area of all rectangles is total energy returned per unit volume
Losses in Magnetic Components
For a given core size and fre- quency, the maximum power output of a transformer is proportional to its operating flux density. As the flux density is raised by removing turns or increasing operating voltage, core losses increase. A transformer is most efficient if it is loaded so that its copper loss is equal to the core loss.
The same rule applies for maximiz- ing Q in an inductor.
Figure 5 shows the derivation of this rule.
Efficiency =
~~ If RL = % + R, , efficiency is
maximized.
Figure 5. Transformer Model Showing Figure 4, MPP Core: 1.06 in., p 6 0 ; Vertical: 1 kgausddiv., Horizontal: 40 Oerstedsldiv. Winding Resistance, Core Loss and Load.

Power Supply Magnetics Q is maximum and
If Rp>>Rs then RL = 4-
Rp'epresents the core loss and dissipates nearly the same power re- gardless of load. R, represents the total series resistance of the trans- former windings corrected for turns ratio effects. The power in R, is proportional to the power in the load. Efficiency is the power in RL divided by the total power in RL, Rp, and R,.
By differentiating the expression for efficiency and solving it for zero, we can find the maximum. Ordi- narily we may assume that % is much greater than R,. We find that efficiency is maximum when RL is the geometric mean of % and R,. In that case, the power in is equal to "p the power in R,. A typica example is shown for a 10k %, a 100Q RL, and a 1Q R, where the maximum effi- ciency is 98%. Figure 6 shows that the efficiency drops to 96% with both a 25Q and 400R load.
For the heavy load:
For the light load: 25
Efficiency= 25 + + = 96%
Figure 7 shows the model for an inductor that considers winding re- sistance and core loss.
Q of an inductor is the tangent of the phase angle between voltage and current. Ordinarily, Rp is much greater than R,. At very low fre- quencies the reactance ofthe induc- tor is near zero and the finite resis- tance of R, gives a Q near zero. At very high frequencies, the inductive reactance is very high and the effect of R, is very small. However, the shunt loss of Rp causes the Q to again approach zero. The Q will reach a maximum at some interme- diate frequency.
The expression for Q inFigure 7 may be solved for a maximum as well, by setting its derivative equal to zero. As in the transformer case, Rp can be assumed to be much greater than $. Much like the efficiency of a transformer load, the Q of an inductor is maximized when its re- actance is the geometric mean of R and R,. This shows that inductor 4 is maximized at a frequency where the core loss is equal to the copper loss.
A given core has a unique L/R time constant associated with any full winding. Take for example a winding of any convenient number ofturns for reference. If a winding is made with twice as many turns from wire of half the cross section, its resistance will be four times greater than the reference winding. This is because its length is twice as great and its resistance per unit length is also twice as great. Accordingly, a winding of half the turns made from wire of twice the cross seetion will have one fourth the resistance. There- fore, the winding resistance is pro- portional to the square of the num- ber ofturns. Because the inductance of a core is also proportional to the square of the number of turns, their ratio is a constant. This L/R ratio is equal to the inductive time constant. It can range from several millisec- onds to several seconds, depending upon core permeability and size.
Silicon Steel Cores Silicon steel is used to make lami-
nated cores and tape wound cores for power transformers in the 50 to 400 Hz range. Many different alloys are used but 97% iron and 3% silicon is the most common. Silicon steel satu- rates at about 17 kilogauss and has a permeability of about 10,000. Be- cause iron is highly conductive, solid steel cores act as shorted turns and cause huge circulating currents. These current paths resemble the eddies in a stream bed and are called eddy currents. Such eddy currents can cause very large losses.
Eddy current loss can be greatly reduced by dividing the core into a large number of thin slices that are insulated from each other by an ox- ide film. These slices are called lami- nations and are shown inFigure 8. If they are sufficiently thin, losses can be reduced to acceptable levels. There is a racetrack-shaped eddy current path in the lamination, but the volt- age around it is very low due to its small area. The resistance around the path is relatively large because it is so thin.
The combination of low voltage and high resistance results in a low power loss per lamination. Thinner laminations further reduce eddy cur- rent losses but increase the cost of manufacture. Diminishing returns require a certain minimum thickness. In most transformer designs, the to- tal eddy current loss is negligible compared to hysteresis.
Toroids are rolled up like a tape spool from a long thin steel strip coated with an oxide film. Individual layers of the tape core serve the func- tion of laminations as shown inFig- ure 9. Toroids are the most efficient magnetically but require special ma- chines to install their windings. This increases the total cost of manufac- ture to some extent.
Even when eddy current losses are made negligible, large hysteresis losses remain. At the 60 Hz power line frequency these losses are man- ageable and silicon steel is the most efficient core material. Its efficiency

is greatest at about 400 Hz provided the laminations are sufficiently thin. Aircraft electrical systems operate there for maximum efficiency and reduced weight. Flux densities must be reduced above that frequency to prevent core overheating. For trans- formers at 1 kHz and above, ferrites are generally more efficient than sili- con steel.
Insulated bobbins are used to pre- vent lamination-to-winding shorts. Tape wound toroids are coated with an insulating material to prevent core- to-winding shorts. An air gap may be inserted in steel cores by sawing them in two, but burrs from the sawing process cause the laminations or tape layers to short together. These shorts must be removed by chemi- cal means or polishing to prevent severe eddy current losses at the edge of the gap.
Heavy Load Model Light Load Model in, 15 w ~ n , 1/15 w
25W
Figure 6. Efficiency for Heavy and Light Loads.
more, and cost more. Hollow con- ductors that are about one skin depth thick are the most economical. At 20 kHz, use of solid wire larger than #14 is a waste of money because of its excessive losses. At 200 kHz, #24 starts to become ineffective.
Thin foil may be used in high Figure7.lnductorModelConsideringM/inding frequency transformers to avoid most Resistance and Core LOSS. skin effect losses but it is difficult to insulate properly during winding.
Lik Wire and Fringing Fields ~lexible printed circuit material con- ample, 2-in. wide Kapton laminated
At high frequencies, magnetic ef- sisting of copper foil on Kapton has with 4 -mil thick copper foil is equiva-
fects cause current to flow only near been successfully used to wind high lent to #10 solid copper with very
the surface of large diameter conduc- , frequency transformers. As an ex- low skin effect losses.
tors. This phenomenon, called skin effect, makes the effective resistance of such conductors much greater than might be expected. Skin depth of a material is inversely propor- tional to the square root of the products of frequency, conductiv- ity, and permeability ['I.
Copper has the same permeability as avacuum and its skin depth is only 0.33 in. at 60 Hz. Silicon steel lami- nations have only 1/35th the conduc- tivity of copper and a permeability 10,000 times greater. The skin depth at 60Hz in laminations is therefore only about 20 mils. The 20 kHz skin depths in copper and lamina- tions are 18 mils and 1 mil, respec- tively.
Magnetic conductors are essen- tially useless at high frequencies. If large amounts ofhigh frequency cur- rent are passed through steel screws, they will run very hot. Brass or alu- minum screws should be used in- stead. Solid conductors are ineffi- cient if their diameter is greater than two skin depths at their operating frequency. They workpoorly, weigh
- -
Figure 8. Laminated G s f o m e r Stack.

Power Supply Magnetics
If large wire is made up from many small strands that are insulated from each other, skin effect losses are greatly reduced. This type ofwire is called Litz wire. Strands near the center are gradually brought out to the edge of the bundle and vice versa. This prevents current from flowing only on some strands. As an ex- ample, 200 strands of #38 insulated magnet wire are used to make Litz wire that is the DC equivalent of # 15 solid wire.
When a gap is introduced into a magnetic path, the field fans out around its edges as shown in Figure 10. This fringing field causes eddy current losses in any windings into which it extends. The larger the di- ameter of the wire in a fringing field, the greater its eddy current losses will be. Because copper conducts about 35 times better than silicon steel, the losses in large copper con- ductors are muchmore severe than in thick laminations. Litz wire is effec- tive in reducing the eddy current losses in windings subjected to a fringing field. At 20 kHz, Litz wire can make a 10:l improvement in the Q of gapped ferrite inductors.
Litz wire is effective in reducing fringing field loss, but its diameter is about 40% greater than solid wire of the same cross sectional conductor area. This is a result of its complex twisted structure and the presence of a large amount of internal insulation. A substantial winding area penalty must be paid to use Litz wire. The DC resistance of a winding using it will be about twice as great as if it were done with solid magnet wire. It is also hard to strip and about three times more expensive than solidmag- net wire. Powdered cores usually do not need Litz wire because they have no fringing field. Litz wire is ordi- narily used only where absolutely necessary.
Powdered Cores Powdered cores are made from a
variety of materials. A magnetic al-
Figure 9. Tape Wound Core.
loy is made into fine particles from 5 to 200 microns in diameter. The par- ticles are coated with an insulating material from 0.1 to 3 microns thick. The powder is then forced by punches into dies at pressures up to 300,000 psi. The high pressures require the use of tungsten carbide tooling. A variety of shapes are possible but toroids are the most common shape produced. Small toroids are coated with parylene and larger toroids are coated with an epoxy paint. This coating is necessary to prevent shorts during the winding process or later during operation.
Adjusting the size ofthe magnetic particles, thickness of their coating, and pressure allows the permeability to be varied from 4 to 550. The final product is then annealed at high tem- perature in a hydrogen atmosphere. This relieves stresses created during pressing, prevents oxidation, and improves the final magnetic proper- ties of the core.
Because the individual magnetic particles are insulated from each other, eddy current losses are mini- mized. The insulating material pro- vides the equivalent of a distributed air gap that lowers the permeability and allows the core to store substan- tial amounts of energy. The lack of a localized air gap eliminates the nui- sance of a fringing field and its asso- ciated losses in nearby windings.
Powdered iron is made in permeabilities from4 to 85 and is the least costly of all powdered cores. Because of manufacturing difficul- ties, the higher permeabilities avail-
Fringing Field
Figure 70. Gapped Core.
able with other core types are im- practical. In addition to toroids, it is made in slug form for variable induc- tors as well as E and I cores. It saturates at about 10 kilogauss but has very high losses.
While the losses in powdered iron are high, they are less than in silicon steel. It is useful in slug form at very low flux levels for tuned transformer adjustment. Powdered iron is also used in lower performance filters where large amounts of DC must be tolerated and cost is very critical. It runs very hot when subjected to sub- stantial amounts of high frequency ripple current.
MPP stands for molybdenum permalloy powder and is also known as molypermalloy[2]. MPP cores are manufactured from a powdered al- loy of 2% molybdenum, 8 l % nickel and 17% iron. Molypermalloy tor- oids are made in permeabilities from 14 to 350. This is the widest range available with any type of powdered core. MPP saturates at 7 kilogauss and has the lowest loss of all pow- dered cores. It has the best tempera- ture stability as well as the smallest permeability change from low to medium drive level. The high nickel content of MPP makes it the most expensive of all powdered cores, but its superior performance usually more than offsets its cost.
MPP is the best performing mate- rial for audio frequency filters, low level medium frequency tuned cir- cuits, and smoothing chokes in switchingpower supplies. MPP cores may be used in high energy resonant
6 . PCIM 1996

circuits operating near saturation up to about 3.5 kHz. When driven to saturation above that frequency, they tend to run too hot. It is the best material for current transformers in the 10 kHz to 1 MHz range, especially when large amounts of DC must be tolerated. Where short high energy voltage spikes must be isolated from a power bus, its low eddy current loss provides the most efficient solution.
Sendust was invented in Japan prior to World War 11. It is made from an alloy of 6% aluminum, 9% silicon, and 85% iron in powdered form. Sendust toroids come in permeabilities from 60 through 125 under the trade name of s u p e r - ~ s s T M . This material has DC bias properties similar to MPP and has lower losses than powdered iron but more than MPP. High performance audio tape heads have been made from SENDUST. MSS is well suited to medium performance line and output filters.
Although it is somewhat more expensive than pow- dered iron, its greatly reduced losses of MSS almost always justify its cost premium. In switching power suppl applications where loss is not too critical, Super MSSYM can usually be substituted for MPP. Because ~ u p e r - ~ ~ ~ ~ ~ costs substantially less than MPP, it frequently is the best choice.
High Flux (HF) cores are made from a powdered alloy of 50% nickel and 50% iron. These HF toroids are available in permeabilities from 14 through 200. With a practical saturation of 11 kilogauss, it can store more than four times as much energy as MPP or MSS for the same core size and permeability. HF costs slightly less than MPP and is the best choice where maximum energy must be stored and core loss is only moderately critical. Its loss is much less than powdered iron but higher than MPP or s u p e r - ~ s s T M . HF is the best choice for low frequency high energy resonant circuits, and chokes that must pass large amounts of DC. It makes possible RFI filters for line operated supplies that can lengthen recti- fier pulses and improve the power factor.
References 1 . R. Landee, D. Davis, and A. Albrecht, Electronic Designers
Handbook, McGraw-Hill, N.Y., 1957 page 20-1 1 2. MPP Core Catalog PC-104J, 8/94 Arnold Engineering Co.,
Marengo, IL 3. Super-MSSTM Core Catalog, Arnold Engineering Co.,
Marengo, IL 4. ~ i - ~ l u x ~ ~ Powder Core Catalog, PC 1461 Arnold Engineer-
ing Co., Marengo, IL
01996 from PClM Magazine, reprinted from January 1996 issue.

POWER %
Power Supply Magnetics - Part II: Selecting Core Material Donald E. Pauly, Consultant, Sponsored By The Arnold Engineering Company, Marengo, Illinois
A review of magnetic theory and core applications from DC to 100 kHz. Materials covered include silicon steel, powdered iron, Sendust, Molypermalloy, Hi-FluxTM and ferrites.
F errites are a ceramic material made from iron oxide with manga- nese, zinc, or other metallic oxide. The components are mixed in pow- der form, then cast and fired. The result is a hard, brittle, glass-like substance. Common permeabilities range from 750 to 10,000. Satura- tion flux densities range from 3 to 5 kilogauss. Ferrites may be manufac- tured in any convenient shape such as toroids, E and I cores, pot cores, and slugs.
Ferrites have the lowest losses of all commonly available core materi- als due to their very low residual flux and high resistivity. They are the best choice for transformers from 1kHz to 1MHz. Unless gapped, they are not well suited to many high fre- quency applications. This stems from their large change in permeability and Q with temperature and drive level.
The resistivity of ferrites is typi- cally a million times greater than most magnetic alloys. Although this gives them the lowest eddy current loss of any solid material, their wind- ings must still be insulated from the core. Ferrite edges are razor sharp and will readily cut through the insu- lation of ordinary magnet wire dur- ing the winding process.
An insulating coating of parylene or epoxy paint is applied to ferrite
toroids to prevent shorts during wind- ing. Even though ferrites have arather high resistance, eddy current losses are sometimes a problem. This oc- curs in high volts per turn applica- tions, such as chokes with low fre- quency high voltage pulses. In such cases, MPP (molybdenum permalloy powder) is a better choice.
Core Shapes Toroids are the least costly to
manufacture and the most efficient magnetic shape. With a large num- ber of turns they require special ma- chines to install their windings, which offsets their lower cost to some ex- tent. Gaps are not ordinarily used for toroids because of the difficulty of fastening the sections together.
E and I cores are more costly to manufacture because of the need to have the two core pieces fit together precisely. If they do not mate well, the sections will crack when damped together. A gap is usually installed when required by grinding down the middle leg of an E core. Sometimes two such cores are mated together to double the gap length. The bobbin for E and I cores can be wound at high speed on inexpensive machines, which compensates for some of the higher core cost.
Pot cores are the most expensive core to manufacture. They are manu-
factured in two halves which are designed to enclose a bobbin and are carefully mated together. The core sections almost completely surround the bobbin, except for small open- ings for the wires to the windings. Almost all ofthe magnetic field ofthe windings is confined to the interior of the core. If the core is grounded, the moderately conductive ferrite acts as an electrostatic shield for the wind- ings as well. Pot cores are therefore the best shielded of all core types.
Pot cores suffer from heat buildup because their windings are sur- rounded by core material that does not conduct heat well and prevents air circulation. As with E cores, one or both pot core center legs may be ground down to provide an air gap. When a pot core is gapped, heating effects from fringing fields in the windings cause even greater tem- perature rise. Gapped pot cores may be equipped with threaded slugs in their center posts to adjust their in- ductance for tuned applications.
With an air gap, ferrites can be made stable in permeability as well as capable of storing substantial amounts of energy. While their per- meability is reduced, they can toler- ate large amounts of DC without saturation. Gapping is ordinarily accomplished by grinding down the middle leg of an E core or pot core. Litz wire is necessary to minimize

the fringing field losses due to the gap at higher frequencies.
In the early 1980s, Stackpole Car- bon Company manufactured a low loss ferrite toroid with low perme- ability for energy storage. For rea- sons not known to the author, the product line was abandoned. The industry is in dire need of a resurrec- tion of that or a similar technology.
Core Loss The true cost to the end user of
core loss is often overlooked. For example, consider a core that wastes 1 watt, when electricity costs 10 cents per kilowatt hour. In a year of con- tinuous operation, this core wastes 88 cents ofelectricity. This heat may be useful in Marengo, IL in January but it is useless in Phoenix, AZ in July. In the latter case an additional dollar must be expended for air con- ditioning to pump that dollar's worth of wasted energy outside.
When the dimensions of a core are doubled, its surface area is qua- drupled and its volume and loss in- crease eightfold. Temperature rise is proportional to the core loss to sur- face area ratio, which is twice as great in the larger core. Small cores run cooler than large cores and may be operated above efficient flux lev- els without overheating. On the other hand, cores over 3- in. diameter may require forced air cooling even though flux levels are reasonable.
Core loss causes an increase in winding temperature. Copper in- creases in resistance by 0.4%PC. Therefore, a 30°C increase in tem- perature due to core loss increases copper loss by 12%, which increases the operating temperature even more. High core temperatures also cause deterioration of winding insulation and cause thermal stresses that may lead to winding shorts.
Most heat-driven chemical reac- tions roughly double in speed for each 10°C increase. The wear out mechanisms in most electronic com- ponents are heat-driven and their life is therefore halved for each 10°C increase in operating temperature.
Figure 11. WH Curve Test Circuit.
R dB
EL=-xnxA dt
Wastedpower inside electronic equip- ment raises internal temperatures and results in reduced component life.
Excessive heat can slowly oxidize and embrittle solder joints and char circuit boards. Long-term exposure ofelectrolytic capacitors to high tem- peratures will dry them out and shorten their life. Resistors change value when operated at elevated tem- peratures for long periods. High tem- perature operation of semiconduc- tors tends to redistribute their care- fully placed impurities and increase leakage. This leakage can elevate their temperature even more result- ing in thermal runaway.
To maintain the reliability of semi- conductors at higher ambient tem- peratures, larger and more expensive heat sinks are required. In many cases the additional heat sink cost will ex- ceed the savings on a cheap core that runs hot. Frequently, a cooler run- ning more expensive core can elimi- nate a fan and reduce overall cost.
An apparent saving of $1 on a core may cost the customer $1 00 if a power supply has to be repaired in the field. The author uses a figure of $1/W to justify a higher parts cost for saving energy and reducing oper- ating temperature. The customer will accept this increased cost if the ben- efits are properly explained.
L
Measuring BIH Curves Flux densities inside cores can
only be determined indirectly by measuring the voltage induced in a winding by changes in the current through it. B/H curves are produced
'Scope Y Channel (B) EL dt BnA -- y=j-=- -- c RC RC
EL dt RC B = J - = Y ( ~ )
4 ) nA -
from these measurements, which al- low cores to be evaluated for linear- ity, saturation, permeability, and hysteresis. A core is tested by driving it from an AC power source and monitoring its current and drive volt- age on an oscilloscope.
Figure I I shows the test setup for displaying B/H curves. A O.1R cur- rent shunt allows measurement ofthe core drive current. The current re- quired per oersted of magnetizing force, H, is: I=& HIO.4.nn
Where: e= Magnetic path length of the core in centimeters n = Number of turns.
This sets the calibration factor for the H axis or x channel of the 'scope in oersteds/amp.
The voltage produced across the winding is:
Current : X = o . l x I Shunt 0.ln 'Scope X Channel (H) n(0.4~ )
X H=- b 0.1
Where: dB
= Rate of change of flux density
A = Core cross sectional area As shown in Figure I I, the driv-
ing voltage is applied to an RC inte- grator whose time constant is much longer than the period of the driving AC source. The winding essentially differentiates the core flux level and the RC network integrates the differ- entiated flux level. The original flux level is thereby restored except for any DC flux present, which is lost.
If the time constant of the core inductance with its associated wind-

Figure 12, Powerstat 1 2 5 6 ~ ~ 4 0 c d x 8 0 c m Tape Core, 70% of Normal Drive 60Hz Sine Wave. Vert = 2 kgausddiv,, Horiz. = 0.2 oerstecVdiv.
ing resistance is equal to that of the integrator, errors due to voltage drops in winding resistance will cancel. The output of the integrator is ap- plied to the scope Y channel or B- axis. The time constant sets the cali- bration factor with the core area and number ofturns. A classic B/H curve is shown in Figure 12. The core shown is a Superior Electric Powerstat model 1256DU. It is a tape wound core of 40 square cm cross section and 80 cm path length. This curve shows the large hysteresis associated with high permeability silicon steel.
This drive level is only about 70% of normal and was chosen to better display the hysteresis and avoid satu- ration. The 64-turn tap was driven, resulting in one oersted per amp of drive current. Voltage at the tap was integrated by a lOOldZ resistor and 2.56F capacitor, which yields an output of 10 kgauss/V.
Figure 12 shows that the residual flux ofthe core is about 4.6 kgauss in each direction after the drive current has returned to zero. It further re- quires a coercive force ofabout 0.35 oersteds to demagnetize the core in each direction. Maximum core flux level is about 6.5 kgauss. As the drive level is increased, the B/H loop enlarges in a corresponding manner as saturation is approached.
In Figure 13, the core is being operated at normal drive levels. Note that the scale factors have been changed and saturation is now evi- dent at about 10 kgauss. The area
Figure 13. Powerstat 1256 DU Normal Drive Figure 14. Powerstat 1256 DU Sinewave 60Hz Sine Wave (Shows Saturation). Drive Waveforms. Vert = 5 kgaus.s/div., Horiz. = loerstedldiv. Vert. = 50V/div., Sine Wave, Vert = 1Aldiv.
Peaked Wave, Horiz. = 2msecdv.
inside the loop is about 3 square divisions or 15,000 oersted x gauss. Converting to mks units yields 119 (amperedmeter) x teslas. This loop area is the hysteresis loss per cycle in joules for each cubic meter of core material. The result is 23W, which is approximately the actual power loss.
The actual drive voltage and cur- rent for this test are shown inFigure 14. The voltage is a sine wave of k99V but the current is distorted due to saturation effects. The current peaks at k2.9A when the voltage passes through zero. Most 60 Hz power transformers operate well into saturation.
BIH Curves Each of the following cores was
driven by a square wave from apower MOSFET switch as shown in Figure 1 5f31. Such a switch handles reverse current just as well as forward cur- rent. Current shunt resistors, inte- grator time constants, and scale fac- tors were changed for the following cores as required. Figure 16 shows the B/H curve on a Philips (formerly Ferroxcube) ungapped EC70170 (3C81) ferrite with 200 turns of#17 on its bobbinL4].
The inductance is about 160mH at 90mA. The residual flux is only 12% and the coercive force is only 45% as great as the silicon steel tape core in Figure 13. This means the ferrite has a much lower hysteresis loss. The same ferrite core is shown inFigure 17 with an air gap (EC70170G) in-
stalled in the center post. The drive voltage remains the same as before but the current is greatly increased. The inductance is now 4mH at 3.5A and the scale factors have been changed. The B/H curve has been made dramatically more linear by the 190 mil air gap, but saturation still occurs at 3 kgauss. An air gap, whether distributed or not, merely expands the H axis of a B/H curve. It does not affect core loss for the same frequency and flux level.
MPP, Super-MSSTM, Hi-FluxTM, and powdered iron cores were each used to wind 4mH chokes. The cores were 1.84-in. diameter toroids with 60 permeability wound with 172 turns of #17. Figure 18 shows the curve for the MPP core. It is apparent that the gapped ferrite is much more lin- ear than the MPP core before the onset of saturation.
The B/H curve for the powdered iron core is shown in Figure 19. Its hysteresis loop is massive compared to the MPP core and its loss is com- parably huge. Many types of pow- dered iron have a large permeability drop at very low drive levels. The core used here had about a 45% drop in permeability under low drive. The core ran very hot during these tests and demonstrated an objectionable sound level.
Figure 20 is a triple exposure of the right half of the BIH curves of the Super-MSSTM, MPP, and Hi-FluxTM cores. The Super-MSSTM and MPP cores have nearly identical curves except for the greater hysteresis of

0 TO +100V
SWITCH CIRCUIT EQUIVALENT CIRCUIT IRF640
DRIVE + 1 Hz TO 4OkHz -E -E @ 30A
IRF9640 ERF9640 SWITCH CONTACTS ARE BIDIRECTIONAL
0 TO - 100V
Figure 15. Drive Switch Circuit.
the MSS. These two cores saturate at about 7 kgauss. The Hi-FluxTM core has more hysteresis than the Super- MSS core and saturates more gradu- ally at amuch higher 1 1 kgauss level. The losses are so low for MPP and Super-MSSTM that their B/H curves appear to be nearly a straight line. The loop for HF can be seen but is nowhere near as prominent as the one for powdered iron in Figure 19.
Naked ear listening tests during 1 kHz B/H curve testing demonstrate that powdered iron and gapped fer- rites are equally offensive as far as producing audible noise. Hi-FluxTM was about 3db quieter. Super-MSSTM and MPP were both about 6 db lower in sound level than the powdered iron. Even these cores will cause objectionable sound when operated near 3 kHz at maximum flux levels. Because Hi-FluxTM cores ordinarily operate at very high flux levels, their noise can be objectionable. Passing a
low frequency square wave current through them produces an irritating buzz. They are sufficiently quiet for line filters.
AC of several hundred volts or more are present on cores during many typical operating conditions. Arcs will occur in unprotected cores at these voltage levels. Copper mag- net wire has burrs that sometimes penetrate the insulating coating. When high voltage is present, corona develops at burrs and cracks, which produces ozone. It causes rapid dete- rioration of organic materials and insulation and oxidizes exposed cop- per surfaces. An arc can be expected within an hour of smelling ozone.
After winding, high voltage cores can be dipped in Wacker T-84 liquid silicone. This material is thin enough to penetrate and fill the small cracks in insulation and prevent arcs. This type ofcoating does not become brittle with age and allows easy unwinding if the core must be reused.
mure 16, EC70/70 Ungapped Ferrite, 3C81 Material UE core 2.79cd x 14.4cm, 1.2kHz Square Wave Drive. Vert. = lkgauss/div., Horiz. = 0.5oerstedldiv.
Measuring Core Loss Idealized waveforms associated
with a 4mH choke driven to satura- tion by a 1 kHz square wave are shown in Figure 21. When current flows in the inductor, the energy stored in it is proportional to the inductance value and the square of the current. When the current be- comes smaller, the inductor returns energy to the drive circuit. Energy is stored in the inductor when the drive voltage is positive and the current increases from zero to maximum. This is a time of positive power be- cause energy flows from the drive source to the inductor.
When the drive voltage suddenly goes negative, energy is now returned from the inductor to the drive source. The power becomes negative at this point because the voltage is negative and current is positive. When the current crosses through zero and goes negative, energy now starts to flow
Figure IT EC70/70 0.19-in, Ga~~edFerrte, Figure 18. 1.84-in. MPP Toroid, 1.95cd x Figure 19. 1.84-in. Powdered Iron Toroid, 3c81 2'79cd 14.4cm1 11.2 cm, p-60, 1kHz Square Wave Drive. 1.95cd x 11.2 cm, p=60, lkHr Square 1.2kHz Square Wave Drive. Vert. = 2kgauss/div., Horiz. = 40 oersfed/div. Wave Drive. Vert = lkgauss/div., Horiz. = 25 oerstecl/div. Vert. = 2kgauss/div., Horiz. = 40 oerstedldiv.

Figure 20. Triple Exposure HF/MPP/MSS 1.84-in. Toroid Material Comparison 1 .95cm2 x 1 1.2cm, p=60, 1 kHz Square Wave Drive. Vert. = 2kgauss/div,, Horiz. = 50 oersteMv.
into the inductor and power again becomes positive. At this point, volt- age and current are both negative.
When the drive voltage becomes positive at the next square wave tran- sition, drive power again becomes negative with energy being returned from the inductor to the drive source. Here the voltage is positive and the current is negative. Finally, the cur- rent crosses zero in a positive direc- tion and power becomes positive again. The power waveform is a 2kHz sawtooth with a 5W DC offset corre- sponding to the core loss. To mea- sure this small core loss in the pres- ence of *400W of reactive power requires a very accurate multiplying wattmeter.
An easy way to get around the above problem is to resonate the inductor under test with an appropri- ately rated capacitor. As shown in Figure22, a 6F capacitor resonates
Figure 21. Core Loss Waveforms - (a) Drive Voltage, (b) Drive Current (c) Drive Power.
with a powdered iron inductor at 1 kHz. ~ i g u r e - 2 3 shows the switch output voltage and current. The ca- pacitor voltage versus current is shown in Figure 24. Square wave drive requirements are now greatly reduced to k10V and drive current is an in-phase *6A sine wave.
A good capacitor has a negligible effect on the overall circuit Q. Circuit Q is the ratio of the capacitor voltage to the sine wave component (411~ x peak square wave voltage) of the driving square wave. The Q is about 9.4 and X,=XL = 26R. The effective resistance of the inductor is the capacitive reactance divided by Q or 2.752. Because the winding resistance is under 0.252 , the bulk of the Equivalent Series Resistance (ESR) is due to core loss. The low Q
is indicative of the excessive loss of powdered iron.
In a typical switching power sup- ply application, the peak-to-peak smoothing choke ripple current is a hnction of the size of the core used. To make this ripple small requires a large and expensive core. Ifa smaller core is used to save money, the ripple current is higher. A higher ripple causes more heating from hysteresis loss and requires a larger filter ca- pacitor. The most economical com- promise is to use a core with a peak- to-peak ripple current of about one- fourth of the load current.
Hysteresis losses due to ripple current frequently dominate copper loss. A useful index of inductor per- formance in switching power supply service is a high level Q measure- ment at 40 kHz. This allows the ESR of the inductor to be determined. Q measurements were done for MPP, Super-MSSTM, Hi-FluxTM, powdered iron, and ferrite cores. Their DC ratings (with a 50% inductance drop) were 6, 6, 15, 13, and 3.5A. The permeability of the powdered cores was 60. Q at 40 kHz was tested at 2A peak-to-peak for the powdered cores and 1A peak-to-peak for the ferrite. The winding resistance was about 0.1852 for the powdered cores and about 0.2852 for the ferrite.
Figure 25 shows the drive circuit for the Q measurements. Resonance allows the core to be tested at a much higher voltage than can be readily
4mH - ) Output Voltage
__O
-E 6lrF iZb current Sample
- - -
X ~ = X c = 2 6 n Resonance = 1 kHz
Figure 23. Powered Iron 1.84-in. Toroid, Resonant Drive Wifh 6p F Capacitor Square Wave Drive. Vert. = Square Wave Sv/div., Vert. = Sine Wave 2Aldiv,, Horiz. = 200 secidiv.
Figure 22. Resonance Core Tester
~esonant Drive With 6p F Capacitor Square Wave Drive. Vert =Capacitor Voltage (Inside) 50V/div., Vert. = Capacitor Current (Outside) 2A/dv., Horiz. = 20Opsecldiv.
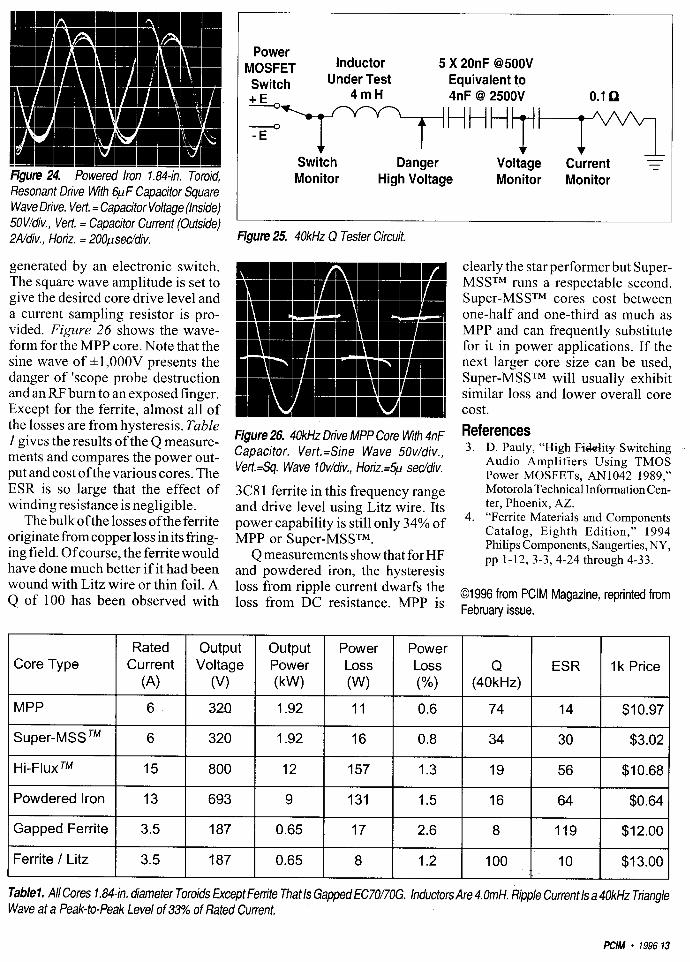
generated by an electronic switch. The square wave amplitude is set to give the desired core drive level and a current sampling resistor is pro- vided. Figure 26 shows the wave- form for the MPP core. Note that the sine wave of +1,00OV presents the danger of 'scope probe destruction and an RF burn to an exposed finger. Except for the ferrite, almost all of the losses are from hysteresis. Table I gives the results of the Q measure- ments and compares the power out- put and cost ofthe various cores. The ESR is so large that the effect of winding resistance is negligible.
The bulk ofthe losses ofthe ferrite originate from copper loss in its fiing- ing field. Of course, the ferrite would have done much better if it had been wound with Litz wire or thin foil. A Q of 100 has been observed with
Power MOSFET Inductor 5 X 20nF 8500V switch Under Test Equivalent to + E 4mH 4nF 8 2500V 0.1 n
+ I Switch Danger
+ + Voltage Current
1 - - - Monitor High Voltage Monitor Monitor
Figure 25, 40kHz Q Tester Circuit.
Fiaure 26, 40kHz Drive MPP Core With 4nF References " .. .
Capacitor. Vert.=Sjne Wave 50v/djv., 3. D. P a u l ~ , ''High f ib l i ty Switching
Vert.=Sq. Wave IOv/div., Horiz.=5p secuv. Audio Amplifiers Using 'TMOS Power MOSFETs, AN1042 1989,"
3C8 1 ferrite in this freauencv r a n ~ e Motorola Technical ~nformation en- " and drive level using Litz wire. Its ter, Phoenix, AZ.
4. "Ferrite Materials and Components power capability is still only 34% of Catalog, Eighth Edition,.. 1994 MPP or Super-MSSTM. Philips Components, Saugerties, NY,
Q measurements show that.for HF pp 1 - 12,3-3, 4-24 through 4-33. and powdered iron, the hysteresis loss from current dwarfs the 01996 from PClM Magazine, reprinted from loss from DC resistance. MPP is February issue.
Tablel. All Cores 1.84-in. diameter Toroids Except Ferrite That Is Gapped EC70nOG. Inductors Are 4.OmH. Ripple Current Is a 40kHz Triangle Wave at a Peak-to-Peak Level of 33% of Rated Current.
PClM . 1996 13
Core Type
MPP
S u p e r - ~ S S ~ ~
Hi-Flux TM
Powdered Iron
Gapped Ferrite
Ferrite / Litz
Rated Current
(A)
6
6
15
13
3.5
3.5
Output Voltage
('4
320
320
800
693
187
187
Output Power (kW)
1.92
1.92
12
9
0.65
0.65
Power Loss (w)
11
16
157
131
17
8
Power Loss (%)
0.6
0.8
1.3
1.5
2.6
1.2
Q (40kHz)
74
34
19
16
8
100
ESR
14
30
56
64
119
10
I k Price
$1 0.97
$3.02
$10.68
$0.64
$12.00
$13.00

POWER %
Power Supply Magnetics - Part Ill: Selecting High Frequency Core Material Donald E. Pauly, Consultant Sponsored by The Arnold Engineering Company, Marengo, Illinois
Many trade-offs are possible in selecting the optimum HF core materialfor a speczfic application. Factors like volume, sound level, and cost enter into the decision.
H ia FLUXTM (HF, cores can store very large amounts of en- ergy for their size. They can operate up to 14 kilogauss with moderate loss. Among their many applications are test sets, RFI power line filters, and battery line filters.
For capacitor testing, high volt- age polypropylene capacitors can be resonated with a high frequency in- ductor that employs an HF core. These capacitors have very low losses and are commonly rated at 480VRMS and 80A. Such capacitors find appli- cation in welders using SCR con- verters and as snubbers in GTO SCR power supplies for locomotive drives. The testing must be done with AC rather than DC to discover problems with lead attachments and end termi-
nations. The test circuit must be able to survive the shorting of the capaci- tor under test.
For testing, an over height version ofthe 26 permeability 5.2 inch diam- eter Arnold Hi-FLUXTM core was resonated with a 12pF polypropy- lene capacitor. This combination was driven by a power MOSFET switch operating from +25V variable sup- plies. From low to high drive levels, resonance shifts from 190 Hz to 235 Hz.
Figure 28 shows that the inductor current departs considerably from a sine wave due to reduction in AC permeability at high peak currents. The core weighs about 31bs and the
winding weighs about 51bs. At full output, the Q is about 30. The operating frequency is picked below the frequency ofmaximum Q to keep the capacitor current low. About 2 1 OW is required to drive the capaci- tor to 6OOVRMS. Forced air cooling for the windings is required for more than a few minutes operation. After dipping in T-84 silicone, the core withstood k3kV at lOkHz with no signs of corona.
To test this type of capacitor with 60 Hz AC would require a variac and transformer combination weighing about 301bs. Furthermore, a circuit breaker would be too slow to prevent capacitor destruction from momen-
Figure 28. 60nH @15A 5.2-in. HF Core Sinewave: 300V/div., Triangle Wave: ION div.; Sweep: 2:mseddiv. Figure 29a. Sodiium Vapor Lamp. 425W Ballast Load.
Line +170V
120v 60Hz
Neutral
-1 70V
T
4
+ -- --
1000 pF 425W I Sodium Vapor + Ballast Load
-- 1000 pF

Power Supply Magnetics
120v 60Hz 470nF To Power Supply
250V . 0 b
Figure 29b. Sodiium Vapor Lamp Line Filter.
tary internal arcs. Use of a resonant circuit allows the arcs to extinguish before severe internal damage takes place.
Power Line Filters Hi-FLUXTM cores are the best
choice for EMIIRFI filters and power factor correction in line operatedrec- tifier supplies.Figure29a shows the DC power supply used in a 400W electronic sodium vapor ballast. The switching amplifier in the ballast causes spikes of several volts at 20kHz on both supply polarities L31. Without a filter in the line high side, these spikes pass onto the power line during rectifier conduction and cause radio frequency interference. To be effective at high frequencies, the line filter must not saturate during the large 60Hz rectifier pulses. Because Hi-FLUXTM cores have the highest saturation level of all powderedtypes, they allow use of the largest induc- tance for a given core size.
With the shortest possible wiring run to the line circuit breaker and no choke, peak rectifier pulses can reach
23A. Figure 30 shows these pulses and the line distortion they produce. The dildt is about 50,00OA/sec for the rise of the rectifier pulses and 30,00OA/sec for their fall. Contrary to popular belief, line distortion is primarily caused by leakage induc- tance of the utility company power transformer but not its resistance. The line voltage drop in this resis- tance fiom the rectifier pulses is only about 280mV. This is invisible on an oscilloscope without special tech- niques.
Leakage inductance of a utility transformer is on the order of 60pH. When the rectifier pulse starts, the rapid current increase through that inductance lowers the line voltage near its peak by 3.OV. At the end of the pulse, the slower current decrease raises the line voltage just after the peak by 1.8V. These voltage distur- bances are easily visible inFigure 30 and pollute the line for other users. Personal computer power supplies commonly cause this problem.
A line filter using a 2mH HF choke is shown in Figure 29b. Fig- ure 31 shows that pulse currents are reduced to 18A and that all visible line distortion is eliminated. Rrns line current is reduced from 6A to 5A. The choke is a 1.84-in. diameter Hi- FLUXTM core of 125 permeability, which costs 1W power loss. The choke operates slightly beyond satu- ration at the rectifier pulse peaks but still retains about 600pH inductance there. The 470nF capacitor is con- siderably larger than usual to reduce interference to WWVB and Loran C
receivers at 60 and 100 kHz, respec- tively. At 1 OOkHz, this filter attenu- ates line interference by more than 40 db. At lMHz, its attenuation is greater than 60 db.
Figure 30 shows that the current pulses without a choke reach a maxi- mum of23A about 15 degrees before the line voltage peak. With the choke, the current peak of 18A is reached about 15 degrees after the peak, as shown in Figure 31. If the choke is reduced to about 240pH, the current andvoltage peaks will coincide. How- ever, the distortion on the line volt- age by the current pulses is still readily apparent and the rms line current is nearly as great as for no choke. The 4.7162 resistor across the choke is used to damp its ringing when the rectifier pulses end. The high Q self resonance of the choke occurs at approximately 200kHz due to its dis- tributed winding capacitance. With- out the resistor, bursts of narrow band RFI appear at that frequency with a 120Hz repetition rate.
Figure 32 shows thevoltage across the choke and the cursent through it. Just before the positive peak of the line, the voltage across the choke rapidly rises to about +18V and then falls to zero. Here the choke is hold- ing off a sudden increase of line current. During this time the current increases to 19A. The voltage now starts to reverse across the choke and the current starts to fall to zero. Here the line voltage has dropped below the voltage on the positive filter ca- pacitor and the choke is returning energy to the capacitor.
Figure 30. Line Distortion and Rectifier Pulse Figure 31. Undistorted Line and Rectifier Figure 32. Filter Choke Voltage and Current Line (1 70V Peak): 20V/div., Pulse: 5AIdiv.; Pulse Line (1 70V Peak): POVldiv., Pulse: 5 1 Choke Voltage:2OV/div., Choke Current: 1 0 1 Sweep: 1msec/div. div.; Sweep: Imsecldiv. div.; Sweep: 2mseddiv.

HF-184125-2
28pH Q 100A 1200W 12V 2OkHz
Inverter
10 Turns of 7X#13,500 micro-ohms At 100A, L = 14 p H
Figure 33a. Two-Pole Battery Line Filter, Battery Circuit.
14pH
+ Inverter Noise
Reduced lnduclance 12v From Load Current
Figure 33b. Two-Pole Battery Line Filter, Capacitor Inductance Model.
pl57125-2 *Turns 01 lX113.350 rn~erwhrns A I l W A , L = l pH
Lead Inductance
Above IMHz Anenurt~on Is
Figure 34. Four-Pole Battery Line Filter.
The capacitor continues to charge briefly even though the line voltage is now less than the capacitor voltage. This prevents a sudden decrease in line current. The choke voltage reaches a maximumnegative voltage of about -32V at the moment the current reaches zero. The maximum dildt during the rise of the current pulses is 9,000AIsec and the maxi- mum dildt during their fall is 16,000AIsec. This is a small fraction of their maximum rates without a choke.
An additional benefit of a large line choke is the reduction of the initial turn on current surge. With no line choke, it can be as high as 400A for 500psec. This imposes severe
stresses on rectifier diodes and will weld ordinary switch contacts to- gether in short order. Negative tem- perature coefficient surge resistors can be used to limit this surge. After the initial surge, these resistors heat up and greatly decrease in value. Their remaining resistance causes substantial power losses after turn on. After loss of power, they require several seconds to recover their high resistance. For briefpower intermp- tions, they provide no protectionupon the reapplication of power.
Without the HF choke, the turn on surge was 400A and the dildt was 2,800AImsec. With the choke, the surge was reduced to 250A and the dildt was reduced to 85Almsec. The choke will be deeply saturated dur- ing the later part of the surge, but by then the switch contacts will have had time to close. This prevents most switch damage and reduces rectifier stress. In many cases, an HF choke will eliminate the need for a surge resistor.
Line Filter Precautions A detailed treatment of RFI filter
design is beyond the scope of this article, but a word of caution is in order. It is easy to build a good low pass line filter and then contaminate its input with switching spikes. The capacitor and inductor must not be close to rapidly changing voltages or currents. An RFI filter able to correct line power factor is considerably larger than common line filters. It should be in a separate shielded com- partment where the line cord enters the chassis.
It is common to find a dvldt of 3,000VIpsec or more in switching power supplies. A lOpF stray ca- pacitance to such a circuit will have a 30mA displacement current. A 340V transition can then couple a 7mV spike into a 470nF line capaci- tor. The induced spikes are about the same size as the residual noise pass- ing through the line filter. Shielding will prevent this.
Transformer primaries in switch- ing supplies can have a dildt of 100AIp sec or more. If one ofthe line
conductors with a loop area of 1 cm2 is separated by 5cm from such a primary wire, every current transi- tion will induce a 40mV spike. This is easily an order ofmagnitude greater than the rms voltages passing through the filter.
External magnetic fields can be dramatically reduced by pairing high dildt leads with their return lines and twisting them together where pos- sible. FWI will be minimized if cir- cuit dvldt and dildt are designed to be as low as possible.
Battery Line Filters
Hi-FLUXTM cores are ideally suited for battery filter chokes in high power low voltage inverters. Such a choke prevents switching spikes from leaving the inverter through the battery input leads. Fig- ure33a shows a 1.84-in.125 perme- ability core used as a filter for a 12V 1 OOA inverter operating at 20kHz. A 28pH inductor rated at lOOA was wound with 10 turns ofseven twisted strands of #13 copper wire. The DC loss is about 5W at 1OOA.
A 10pF polypropylene capacitor across the battery terminals com- pletes the filter. The load current reduces the effective inductance of the choke to about 14pH. The filter produces about 19 db attenuation at 40kHz and 52 db attenuation at 200kHz. Self inductance of about 28nH in the 10pF capacitor causes the attenuation to level off at 54 db above 300kHz (Figure 33b).
Low impedance filters pose spe- cial challenges because of capacitor selfresonance. A four-pole filter (Fig- ure 34) overcomes this problem. By using two cores each of half the size and inductance, the total core cost is about the same. A second capacitor costs very little compared to the in- ductors. The effective inductance of each core is reduced to 7pH because of load current. For very little in- crease in cost, attenuation is now 26 db at 40kHz and 92 db at 200kHz. Well above 300kHz, attenuation ap- proaches 96 db. Total DC losses are about 7 W.

the dildt of the line current has been adequately controlled before this hap- pens. The choke has a 2W loss at the dimmer's rated current.
Figure 3%. Triac Dimmer, Dimmer Circuit
Figure 3%. Tnac Dimmer, Line Filter
HF-090125-2 105 Turns #20
ImH @ 5A
Line -
Light Dimmer Filters
- 120V 60Hz
Neutral
Triac lamp dimmers are infamous for causing AM radio interference. The circuit for a typical 600W incan- descent lamp dimmer is shown in Figure 35a. These dimmers control the average power supplied to the lamps in the load by varying the duty cycle of the triac switch. Figure 36
-- -- 47nF To Dimmer
shows the voltage across thevswitch for a 50% duty cycle.
At turn on, a voltage transient as great as 170V occurs across the ter- minals of the dimmer. The dvldt of this transient is about 1,700VIpsec. The current rise time is limited only by the leakage inductance ofthe util- ity transformer. With leakage induc- tance of 60pH, the dildt is 2.8Al usec. The high dvldt and dildt both radiate RFI from the lamp wiring.
Most commercial dimmers have a small inductor of about 60pH in
-
series with their terminals but this is far too small to be effective against RFI. Usually, they have no shunt capacitor. Figure 35b shows an ef- fective RFI filter for a 600W dim- mer. An 0.90-in. diameter 125 per- meability HF core is used as a line choke and is rated at l.OmH at 5A. The dimmer terminals are shunted with a 47nF capacitor.
The capacitor reduces the dvldt across the dimmer terminals at turn on to 2VIpsec. Overall voltage rise time is increased from O.1psec to 50psec. The choke reduces the dildt during turn on to 0.17AIpsec. Due to the reduced dildt, the triac can com- pletely turn on before full current is applied. This increases its reliability during the high surge currents from cold lamp filaments. The choke satu- rates at the 7A peak of the cycle, but
Smoothing Chokes MPP is the best choice for smooth-
ing chokes in switching power sup- plies where the ripple current is small compared to DC current. Where the ripple current is large, as in high power flyback type supplies, MPP losses may be too large. In that case, gapped ferrites with Litz wire are better because of their lower hyster- esis loss. For lower power flyback supplies, MPP cores are better than gapped ferrites.
Figure 3 7a shows a forward con- verter 5V, 30A supply operating at 20kHz. The waveforms shown in Figure 37b assume that the input voltage could drop by approximately 50% before regulation would be lost. The filter choke inductance will drop about 50% due to the 30A DC. This results in about 5A peak-to-peak tri- angle current in the output filter ca- pacitor (1.4Arms). This relatively low ripple current reduces heating in the output filter capacitor. The ca- pacitor should be selected for lowest possible ESR to minimize output ripple.
For small load currents, the in- ductance returns to 22pH, which re- duces the ripple current to 2.5Apeak- to-peak. The lower ripple allows the load current to go down to about 1.25A before regulation is lost. An MPP design for the filter choke is compared to a ferrite design. The cores used were a 1.06-in. diameter
Figure 36. Triac Voltage at 50% Duty Cycle Voltage: 50VIdiv.; Sweep: 2 msecldiv.

MPP core with a permeability of 60 and a EC4 114 1 G gapped ferrite core with a permeability of 74. The MPP core is rated at 22pH at 3 1A and the ferrite is rated at 21pH at 26A.
The ferrite has a gap of 60 mil and a cross section of 1.2 1 cm2. Its actual core constant is 125mHlkturn squared. If all the field of the ferrite was within the gap, its core constant wouldbe 200mH/kturn squared. The ratio of the actual to the theoretical value is the portion of the total flux that is actually within the gap. This turns out to be only 63%. The re- maining 3 7% constitutes the fringing Figure 37a. Fo~lard Converter, Circuit.
field within the winding area. To prevent excessive losses from
the fringing field, the ferrite must be wound with Litz wire. Reducing the gap will reduce the fringing field but will also reduce the energy storage capability. The losses in gapped fer- rites wound with solid wire smaller than #22 are usually acceptable. In some cases, thin foil windings have reduced losses in gapped cores to acceptable levels. The ferrite core is wound with 13 turns of #13 litz.
The MPP core is wound with 17 turns of #12. If available, rectangu- lar #12 could be used on the MPP core for greater winding efficiency. The superiority of the MPP core is evident fiom its 31A rating com- pared to 26A for the ferrite. The DC resistance of the MPP is 4 d and the ferrite is 5 d . The DC loss of the Figure 37b. Forward Converter, Waveforms. cores at 26A is 2.7W in the MPP vs 3.4W in the ferrite.
In summary, the MPP core is ca- pable of 19% more current, has 20% less DC loss at the same current, and weighs 3 1 %less. Actual circuit losses in the MPP and ferrite are about 50% greater due to hysteresis and fringing field, respectively.
Low-Level Resonant Circuits MPP cores are the best choice for
inductors in fixed tuned resonant cir- cuits operating at low level up to 200kHz. Ungapped ferrites might appear to be better because they need fewer turns. However, their induc- tance changes considerably with tem- perature. Over the 0 to 60°C range, Figure 38a. Ferrite Tuned Circuit.
2OkHz Waveforms
G,,d , -,ov , rsecondav Voltage
Gnd - - - 1-1 p?
Voltage .....- .......... ........... ------.... ......-..-- --.... 0- - 0.5V
3OA .... --... .u Choke Current
0 Amps
6.05mH 600 Q -
1 .OnF Mica --
-- 64.7kHz Z=240K
1
- -
Generator q== - -
768XT188-3C81 Ferroxcube 0.5-in. Toroid
63T
4

600 Q Generator
A-050056-2 Arnold MPP 0.5-in. Torid
Figure 39a. MPP Tuned Circuit.
the permeability of 3C8 1 ferrite will change by 25% [4]. With increased drive level, Q drops dramatically and permeability increases somewhat.
The gain oftuned amplifier stages using ungapped ferrite transformers for collector or drain loads will de- crease with increased signal level. This results in nonlinearity and intermodulation distortion. Figure 38a shows a 60kHz tuned circuit
using 3C8 1 ferrite. From 0 to 11 5 gauss, permeability increases by about 9%. This causes the circuit to detune as signal level increases. Over the same range, Q decreases by 73% (Figure 38b).
Figure 39a shows a 60 kHz tuned circuit using 125 permeability MPP. From 0 to 138 gauss, permeability increases by only 1% and Q goes down by only 19% (Figure 39b). As
the drive level increases, MPP cores minimize detuning and nonlinearity effects. The permeability of MPP cores is more stable with tempera- ture, typically within &I% at the roo111 temperature value from 0 to 60°C
Most of the problems associated with ~tngapped ferrites in tuning ap- plications can be eliminated by using pot cores with a gap. Compared to MPP, they are more expensive and fragile. Both have comparable Q and require essentially the same number of turns. For low frequency fixed tuned applications MPP cores are superior.
Conclusions Tables I and 2 summarize the
properties of the various core types covered in these articles. The losses of MPP, SUPER-MSSTM and HI- FLUXTM cores are dramatically lower than powdered iron. Best per- formance in switchingpower supply filter chokes is achieved when MPP cores are used in place of powdered iron.
However, SUPER-MSSm cores can be substituted for MPP cores in many high power applications with nearly the same level ofperformance
Figure 38b. Ferrite Performance.
Output Level (k)
40mV
200mV
500mV
1 .OV
2.0V
3.5V
Figure 39b. MPP Performance.
PClM 1996 19
Flux Gauss (k)
1.3
6.6
16
33
66
11 5
~f
0
-0.1 %
-4.6%
-1 .I%
-2.6%
-4.0%
Q 73
69
47
35
30
24
Af
0
-0.02%
-0.03%
-0.1 9%
-0.31 %
-0.52%
AQ
0
-6%
-42%
-58%
-66%
-73%
Output Level (k)
1 OOmV
200mV
400mV
2.0V
4.0V
1 OV
Q 37
35
33
32
31
30
. . FluxGauss (k)
1.4
2.8
5.5
28
55
138
AQ
0
-5.4%
-11%
-1 3%
-1 6%
-1 9%

ESR (a)
14
30
56
64
- ----- A
119
10
1 K Price ($1
10.97
3.02
10.68
.64
12.00
13.00
Table 1. All Cores Are 1.84-in. Diameter Toroids, Except For the Ferrite that Is a Gapped EC70ffOG. Inductors Are 4.0mH. Ripple Current Is a 40kHz Triangle Wave With a Peak-to-Peak Level of 33% of Rated Current. Output Power Is Theoretical and Ignores High Voltage and Core Dissipation Problems.
Table 2. Ranking of Cores Is the Author's Opinion of the Typical Suitability of the Cores for the Given Application. Generally, Smaller Cores May Be Operated at Higher Frequencies and Flux Levels and Vice Versa for the Larger Cores.
Core Type
Molypermalloy
M S S ~ ~
~ i g h - F l u x ~ ~
Powdered lrom
FerriteILitz ...
and lower cost. Where cores operate with high flux levels at a few kilo- hertz, MSS and MPP cores are the quietest and powdered iron and gapped ferrites are the loudest. HF cores can make an irritating buzz when filtering a low frequency square wave.
The most dramatic improvement in performance as a function of cost is achieved when MSS cores areused to replace powdered iron cores. HF cores are best for high energy reso- nant circuits below 1 kHz. They also make the best RFI chokes that must pass DC or line voltage. Powdered iron cores are best only where cost is extremely critical and losses are un- Important.
Iron laminated or tape cores are the best cholce for transformers op- erating below 1 kHz. Ferrites are preferred for transformers from 1 IsHz to 1 MHz. MPP cores and gapped
ferrites are both suited to low level filter and fixed tuned applications below 100 kHz. If variable tuning is needed, a gapped ferrite pot core with an adjustable center post is best.
The increase in operating frequen- cies and densities of switching power supplies has resulted in an urgent need for improved core materials. Resonant power supplies operating at 100 kHz or more place severe demands on the Q of high power resonant inductors. That demand is not well served by gapped ferrites because ofthe losses in their fringing field. New ungapped low permeabil- ity materials are needed that can operate at high flux densities in that frequency range. They should be us- able above 100kHz with a Q over 200.
Fly back Circuits
Good
Fair
Poor
Worst
Best
References 3. D. Pauly, OHigh Fidelity Switching
Audio Amplifiers Using TMOS Power MOSFETs," AN1042 1989, Motorola Technical Information Center, Phoe- nix, AZ.
4. O Ferrite Materials and Components Catalog, Eighth Edition," 1994 Philips Components, Saugerties, NY, pp 1- 12, 3-3,4-24 through 4-33.
Good
Best
Fair
Worst
0 1996 from K I M Magazine, reprinted from March 1996 isme.
Line Filter
Poor
THEARNOLD ENGINEERING
Saturation Frequency Limit (kHz)
3.5
High Energy Circuit --
Poor
Fair
Best
Good
Worst
COMPANY For More Information Call
800-545-4578
Filter Chokes
Best
1.6
1 .O
0.8
20.0
Precision Filters
Good
Good
Fair
Worst
Poor
Price
High
Fair
Poor
Worst
Best
Low
Medium
Lowest
Highest