power log - fluke corporation: fluke electronics, biomedical
TRANSCRIPT
May 2007 Rev. 2, 2/10 © 2007-2010 Fluke Corporation. All rights reserved. Specifications are subject to change without notice. All product names are trademarks of their respective companies.
Power Log PC Application Software
Users Manual

Fluke Corporation
FLUKE Power Log Software
License Agreement
BY USING THIS SOFTWARE PRODUCT IN ANY MANNER, YOU ARE AGREEING TO ACCEPT THE FOLLOWING TERMS AND CONDITIONS.
Fluke Corporation (Fluke) grants you a non-exclusive right to use Fluke Power Log software (Product) on a single PC or on multiple PCs. This grant of license does not include the right to copy, modify, rent, lease, sell, transfer or distribute the Product or any portion thereof. You may not reverse engineer, decompile, or disassemble the Product.
Fluke warrants that the Product will perform in its intended environment substantially in accordance with the accompanying written materials for a period of 90 days from the date of license acceptance. Fluke does not warrant any downloading errors or that the Product will be error free or operate without interruption.
FLUKE DISCLAIMS ALL OTHER WARRANTIES, EITHER EXPRESS OR IMPLIED, BUT NOT LIMITED TO IMPLIED WARRANTIES OF MERCHANTABILITY AND FITNESS FOR A PARTICULAR PURPOSE, WITH RESPECT TO THE SOFTWARE AND THE ACCOMPANYING WRITTEN MATERIALS. In no event shall Fluke be liable for any damages whatsoever (including, without limitation, indirect, consequential, or incidental damages, damages for loss of business profits, business interruption, loss of business information, or other pecuniary loss) arising out of the use of or inability to use this Product, even if Fluke has been advised of the possibility of such damages.
iii
Table of Contents
Title Page
Introduction........................................................................................................ 1 Contacting Fluke................................................................................................ 1 System Requirements ........................................................................................ 2 Installing Power Log.......................................................................................... 2
Installing from CD......................................................................................... 2 Installing from Fluke Website ....................................................................... 2
Connecting to a Power Quality Instrument........................................................ 3 Connecting a 345........................................................................................... 3 Connecting a 435........................................................................................... 3 Connecting a VR1710 ................................................................................... 3 Connecting a 1735......................................................................................... 4
COM Port Number............................................................................................. 4 Loading USB Drivers ........................................................................................ 4 Using Power Log ............................................................................................... 4
Starting Power Log........................................................................................ 4 Downloading Logged Data to a PC............................................................... 5 Using Saved Measurement Data.................................................................... 6 Uninstalling Power Log................................................................................. 6 Menu Options ................................................................................................ 6
Print ........................................................................................................... 6 Copy .......................................................................................................... 6 Preferences ................................................................................................ 6 Zoom ......................................................................................................... 6 Axis Vertical Scale.................................................................................... 6 Save File as EMF ...................................................................................... 6 Events........................................................................................................ 6 Data Selection ........................................................................................... 7 View Legend ............................................................................................. 7 View Cursors............................................................................................. 7
Analyzing Data .................................................................................................. 7 Summary Tab ................................................................................................ 8 Spreadsheet Tab............................................................................................. 9 Voltage and Amps Tab.................................................................................. 10 Statistics Tab ................................................................................................. 11 Harmonics Tab .............................................................................................. 12 Dips and Swells Tab...................................................................................... 14
Power Log Users Manual
iv
Frequency/Unbalance Tab............................................................................. 15 Power Tab...................................................................................................... 16 Transient Tab................................................................................................. 17 Flicker Tab..................................................................................................... 18 Screens Tab ................................................................................................... 19 Energy Tab .................................................................................................... 20 Event Profiles Tab ......................................................................................... 21 Power Harmonics Tab ................................................................................... 22 Mains Signaling Tab...................................................................................... 23
Printing Reports and Exporting Data................................................................. 24 Printing Reports............................................................................................. 24 Exporting Data............................................................................................... 25
v
List of Tables
Table Title Page
1. System Requirements............................................................................................. 2
List of Figures
Figure Title Page
1. Power Log Welcome Screen .................................................................................. 5 2. Power Log Main Screen......................................................................................... 5 3. Summary Display for User Input ........................................................................... 8 4. Spreadsheet for Saved Data.................................................................................... 9 5. Voltage and Amps Time Plot with Selected Channels Visible .............................. 10 6. Statistics with Channel A Selected......................................................................... 11 7. Harmonics Time Evolution with Selected Channels.............................................. 12 8. Histogram............................................................................................................... 13 9. Dips and Swells...................................................................................................... 14 10. Frequency/Unbalance Time Plot–Frequency Displayed........................................ 15 11. Power Time Plot with Active and Reactive Power Selected.................................. 16 12. Transient Waveform............................................................................................... 17 13. Flicker Waveforms................................................................................................. 18 14. Screens Pane with Instrument Display Image........................................................ 19 15. Energy Time Plot for Selected Period.................................................................... 20 16. Event Profiles ......................................................................................................... 21 17. Power Harmonics Displayed.................................................................................. 22 18. Mains Signaling Waveforms.................................................................................. 23 19. Report Writer Assistant Selection Options ............................................................ 24 20. Export Dialog Screen ............................................................................................. 25

Power Log Users Manual
vi

1
Introduction Power Log (the Software) is the PC software for Fluke 345, 435, VR1710 and 1735. The Fluke 433 and 434 also use Power Log if the 434 logger function is installed. These models are referred to throughout this manual as the instrument. The software accepts data downloaded from the instrument. The software is designed for Microsoft Windows® XP and verified to run with Vista.
After transferring logged data to a PC for graphical and tabular evaluation, data may be exported to a spreadsheet for generating and printing reports.
With Power Log:
• Download recorded logged data to a PC
• Generate data tables
• View, print, and export time plots of all channels
• Perform harmonic studies
• Print tables, graphs, and comprehensive, formatted reports
• Export data for manipulation in other programs (Excel, for example)
This manual provides instruction for installing and using the Software, as well as limited instruction for connecting to Fluke power quality instruments. Brief introductions to opening, viewing, filtering, and exporting data guide users through most features of Power Log.
Contacting Fluke To contact Fluke, call one of the following telephone numbers:
• Technical Support USA: 1-800-44-FLUKE (1-800-443-5853)
• Calibration/Repair USA: 1-888-99-FLUKE (1-888-993-5853)
• Canada: 1-800-36-FLUKE (1-800-363-5853)
• Europe: +31 402-675-200
• Japan: +81-3-3434-0181
• Singapore: +65-738-5655
• Anywhere in the world: +1-425-446-5500
Or, visit Fluke's website at www.fluke.com.
To register your product, visit http://register.fluke.com.
To view, print, or download the latest manual supplement, visit
Power Log Users Manual
2
http://us.fluke.com/usen/support/manuals.
To contact Technical Support: [email protected] or 888-257-9897
System Requirements The minimum computer requirements are shown in Table 1.
Table 1. System Requirements
Component Necessary Recommended
Free hard disk space 10 MB >50 MB
CD-ROM drive
Monitor 800 x 600 pixels 1024 x 768 pixels
USB or RS-232 Serial Interface, dependant on instrument
Designed for Windows® XP and verified to run with Vista
Color printer
Installing Power Log Installing from CD
Insert the instrument CD into a PC. The installation should start automatically. If not, run the launch.exe program on the CD. Follow on-screen instructions to install the Software in the desired language. The 435 uses autorun.exe to install the Software.
Note
The most recent version of Power Log is available at the Fluke website.
The manuals and all application software install in the application directory, with a shortcut in the programs menu. A Power Log quick-launch shortcut can also be added to the desktop during installation.
Installing from Fluke Website Navigate to the Fluke website at www.fluke.com and install using the on-screen instructions available from the product page for the instrument. Installing from the website requires a short registration.
PC Application Software Connecting to a Power Quality Instrument
3
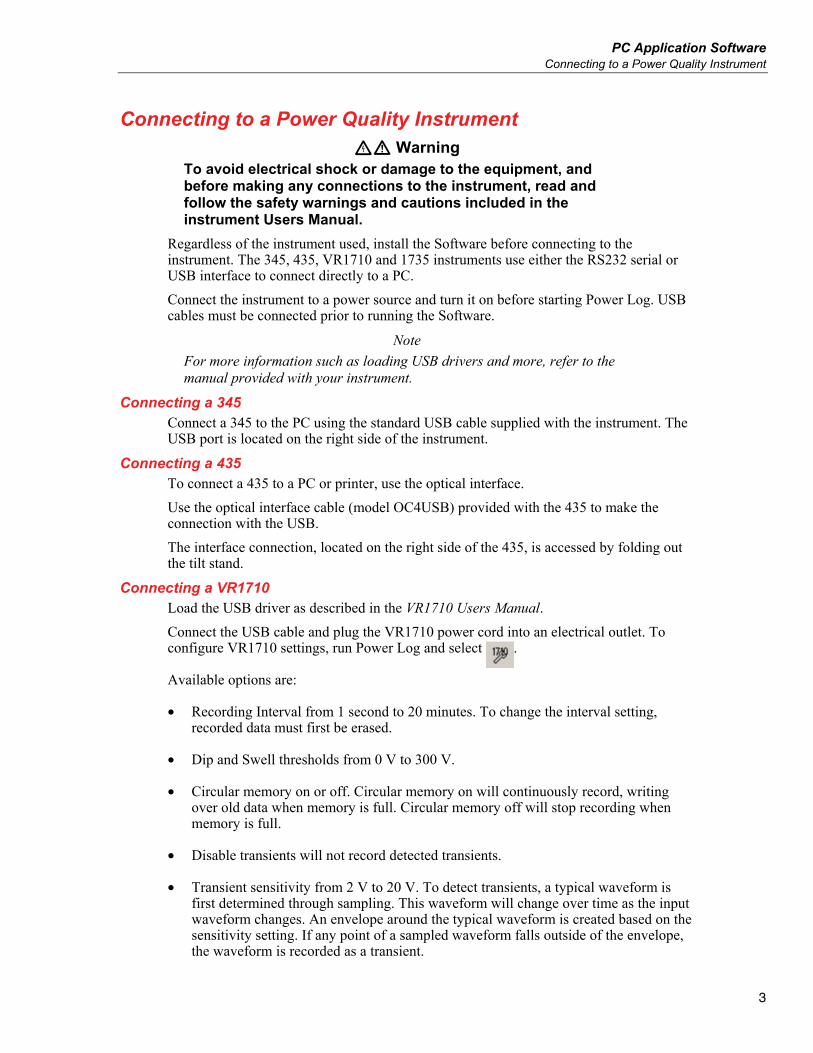
Connecting to a Power Quality Instrument XW Warning
To avoid electrical shock or damage to the equipment, and before making any connections to the instrument, read and follow the safety warnings and cautions included in the instrument Users Manual.
Regardless of the instrument used, install the Software before connecting to the instrument. The 345, 435, VR1710 and 1735 instruments use either the RS232 serial or USB interface to connect directly to a PC.
Connect the instrument to a power source and turn it on before starting Power Log. USB cables must be connected prior to running the Software.
Note
For more information such as loading USB drivers and more, refer to the manual provided with your instrument.
Connecting a 345 Connect a 345 to the PC using the standard USB cable supplied with the instrument. The USB port is located on the right side of the instrument.
Connecting a 435 To connect a 435 to a PC or printer, use the optical interface.
Use the optical interface cable (model OC4USB) provided with the 435 to make the connection with the USB.
The interface connection, located on the right side of the 435, is accessed by folding out the tilt stand.
Connecting a VR1710 Load the USB driver as described in the VR1710 Users Manual.
Connect the USB cable and plug the VR1710 power cord into an electrical outlet. To configure VR1710 settings, run Power Log and select .
Available options are:
• Recording Interval from 1 second to 20 minutes. To change the interval setting, recorded data must first be erased.
• Dip and Swell thresholds from 0 V to 300 V.
• Circular memory on or off. Circular memory on will continuously record, writing over old data when memory is full. Circular memory off will stop recording when memory is full.
• Disable transients will not record detected transients.
• Transient sensitivity from 2 V to 20 V. To detect transients, a typical waveform is first determined through sampling. This waveform will change over time as the input waveform changes. An envelope around the typical waveform is created based on the sensitivity setting. If any point of a sampled waveform falls outside of the envelope, the waveform is recorded as a transient.
Power Log Users Manual
4
• Erase stored settings
• Read stored settings
Note
VR1710 firmware version 1.15 or greater is required for circular memory and transient settings.
Connecting a 1735
Note
Turn the power on before connecting the serial/USB cable to the instrument.
Using the provided serial/USB cable, connect the instrument to an available serial/USB port on the PC.
COM Port Number The COM port number must be 9 or lower (COM1 to COM9). If a higher COM port number was selected when a USB driver was loaded, use the Windows Device Manager to change it:
1. Open the Device Manager located in Control Panel/System/Hardware/Device Manager (Windows XP).
2. Locate the device in Ports and double-click.
3. Go to Port Settings/Advanced and select COM Port 9 or lower.
4. Press OK.
5. To update the Device Manager, select Action from the menu and scan for hardware changes.
Loading USB Drivers USB drivers are located on the CD that came with the instrument. Follow the on-screen instructions and note that some drivers will automatically load twice. See instrument manuals for more details.
Using Power Log Power Log may be used with existing, saved recorded data, or with newly recorded data from a connected instrument.
Starting Power Log To start the Software:
1. If communication with an instrument is desired, refer to Connecting to a Power Quality Instrument.
2. Start the Software by selecting the Power Log program icon from the menu:
Start | Programs | Fluke | Power Log | Power Log
Alternatively, use the Power Log icon shortcut on your PC desktop.
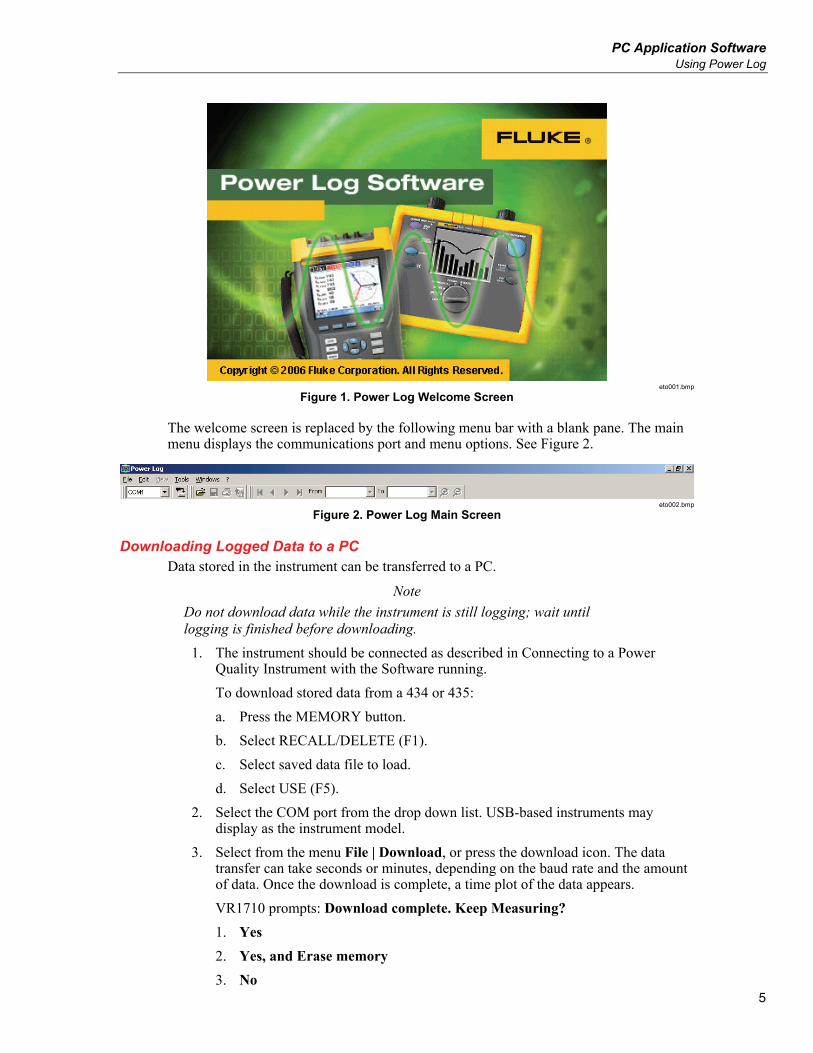
The Power Log welcome screen displays briefly during the launch sequence. See Figure 1.
PC Application Software Using Power Log
5
eto001.bmp
Figure 1. Power Log Welcome Screen
The welcome screen is replaced by the following menu bar with a blank pane. The main menu displays the communications port and menu options. See Figure 2.
eto002.bmp
Figure 2. Power Log Main Screen
Downloading Logged Data to a PC Data stored in the instrument can be transferred to a PC.
Note
Do not download data while the instrument is still logging; wait until logging is finished before downloading.
1. The instrument should be connected as described in Connecting to a Power Quality Instrument with the Software running.
To download stored data from a 434 or 435:
a. Press the MEMORY button.
b. Select RECALL/DELETE (F1).
c. Select saved data file to load.
d. Select USE (F5).
2. Select the COM port from the drop down list. USB-based instruments may display as the instrument model.
3. Select from the menu File | Download, or press the download icon. The data transfer can take seconds or minutes, depending on the baud rate and the amount of data. Once the download is complete, a time plot of the data appears.
VR1710 prompts: Download complete. Keep Measuring?
1. Yes
2. Yes, and Erase memory
3. No
Power Log Users Manual
6
Note
The window that opens on the PC desktop depends upon the mode the instrument was in when the information was recorded.
Using Saved Measurement Data Open a saved data set using Power Log with the following steps:
1. If it is not already running, start Power Log.
After the welcome screen and reminders have displayed, the menu offers limited options.
2. Select File | Open, and navigate to the DataFiles folder in the Fluke | Power Log folder. Or, if the data files are at another location on the PC, browse to the location.
3. Select a file to use and press Open.
The window that opens defaults to the mode last used, or the mode the instrument was in when the data was recorded and saved. The tabs displayed are dependant on the instrument and saved data.
Uninstalling Power Log Uninstall Power Log from a PC using the uninstall feature included with the Software.
To uninstall Power Log, follow this path from the Windows Start button:
Start | Programs | Fluke | PowerLog | Uninstall
The uninstall wizard completes the removal of the Software from the PC. The data files remain untouched.
Menu Options Menu options are available based on the Windows tab selected. The sections below briefly explain the options.
Print Prints current window view.
Copy Copies current window view to the PC clipboard which can be pasted into other applications. Not available for all windows.
Preferences Select from menu or windows that have mouse right-click menus. Select trace colors for all windows.
Zoom Select from menu, icons or windows that have mouse right-click menus. Mouse right-click menus also have a restore zoom selection.
Axis Vertical Scale Select from windows that have mouse right-click menus. Set the scale to automatic or define minimum and maximum. Scaling can also be applied to all graphs.
Save File as EMF Select from windows that have right-click menus. Saves current view as EMF (Enhanced Windows Metafile) format.
Events Windows that have events can be viewed by using the Tools menu or the arrow icons. Examples of events are dips, swells or transients.
PC Application Software Analyzing Data
7
Data Selection Data sets can be selected using dates, zooming or events. The data set selected will be used for exporting data.
View Legend Select from menu or windows that have mouse right-click menus.
View Cursors Select from menu or windows that have mouse right-click menus or double-click on the graph.
Analyzing Data Data can be viewed and printed, or exported for use in other software, such as Microsoft Excel and database programs. Whether downloaded from a connected instrument or opened from files, the same tabs and window options are visible. Tabs displayed will be dependant on the instrument and the saved data.
• Summary
• Spreadsheet
• Voltage and Amps
• Statistics
• Harmonics
• Frequency/Unbalance
• Power
• Screens
• Energy
• Transients
• Dips and Swells
• Flicker
• Mains Signaling
• Power Harmonics
• Event Profiles
Power Log Users Manual
8
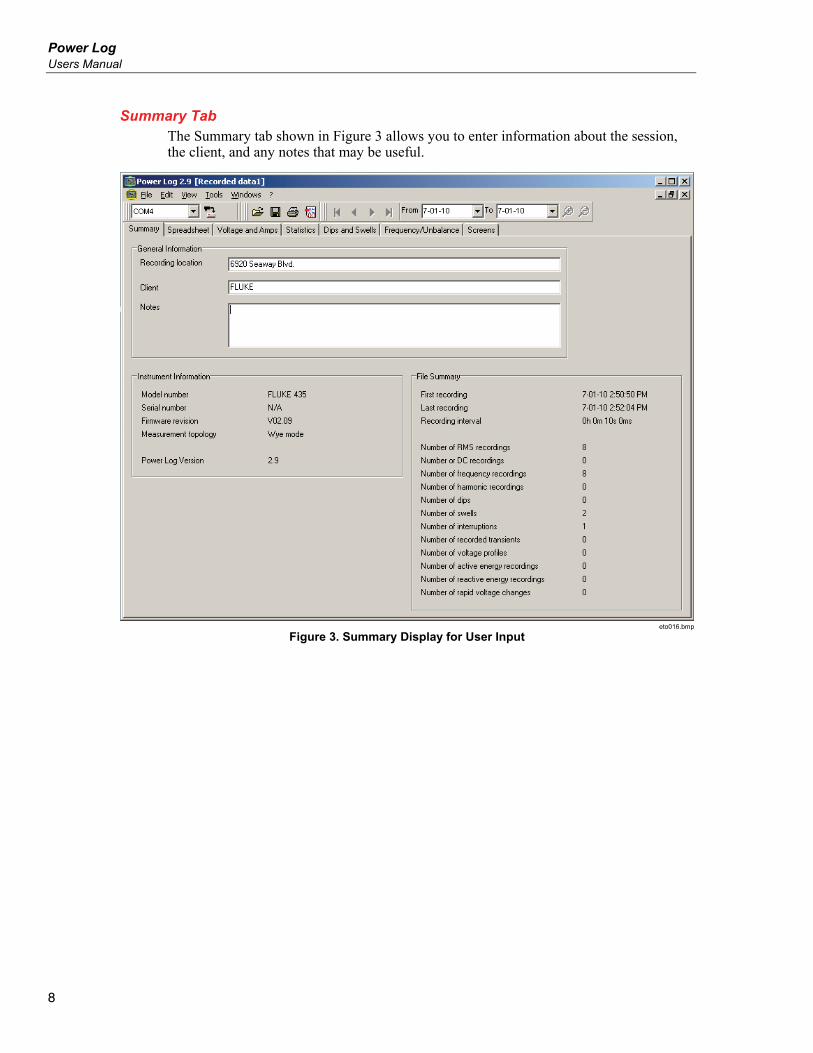
Summary Tab The Summary tab shown in Figure 3 allows you to enter information about the session, the client, and any notes that may be useful.
eto016.bmp
Figure 3. Summary Display for User Input
PC Application Software Analyzing Data
9
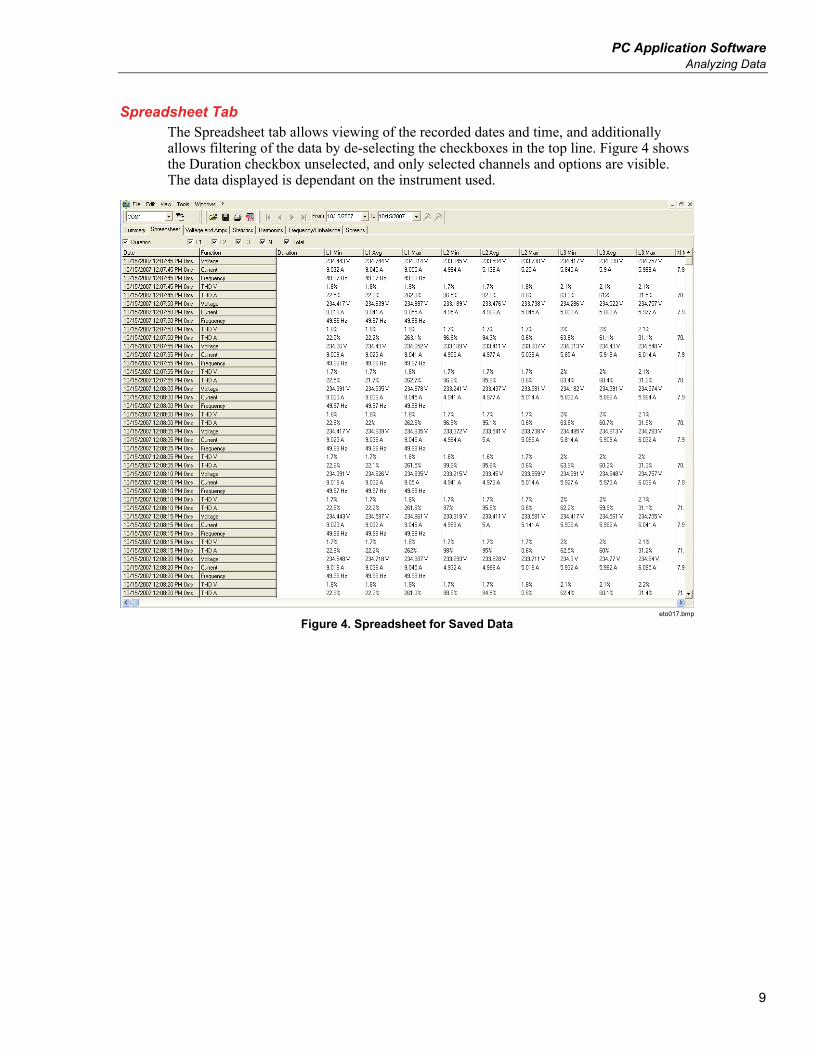
Spreadsheet Tab The Spreadsheet tab allows viewing of the recorded dates and time, and additionally allows filtering of the data by de-selecting the checkboxes in the top line. Figure 4 shows the Duration checkbox unselected, and only selected channels and options are visible. The data displayed is dependant on the instrument used.
eto017.bmp
Figure 4. Spreadsheet for Saved Data
Power Log Users Manual
10
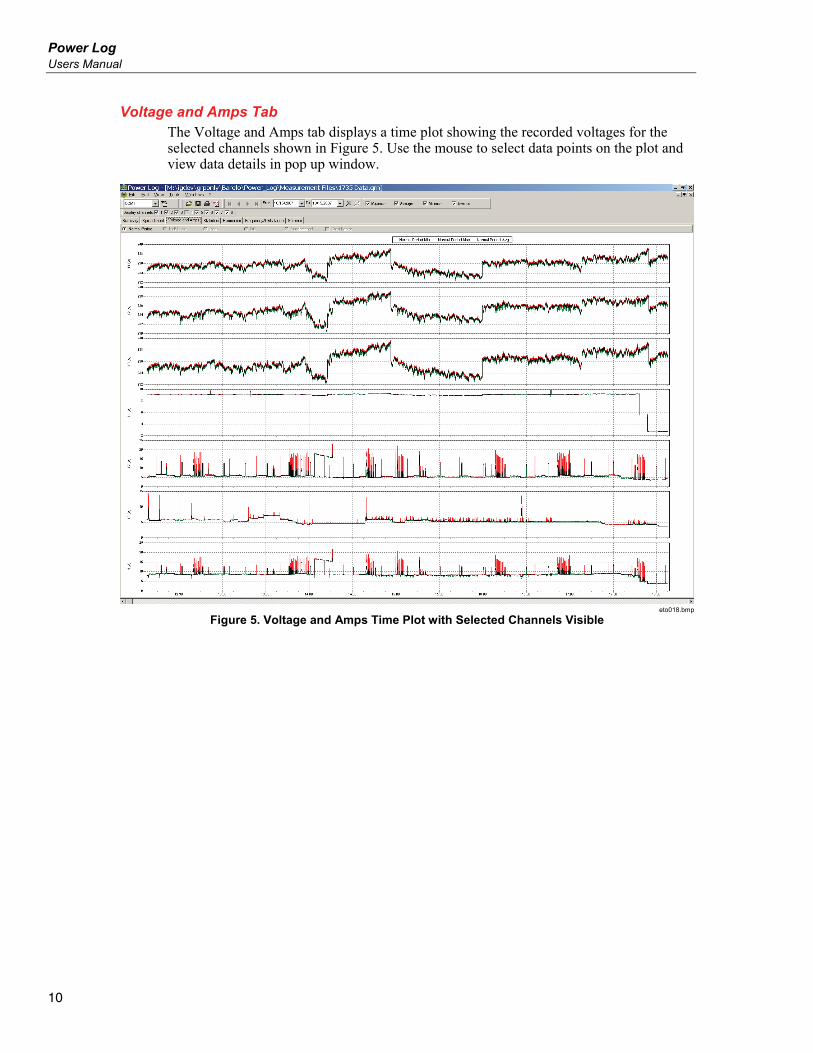
Voltage and Amps Tab The Voltage and Amps tab displays a time plot showing the recorded voltages for the selected channels shown in Figure 5. Use the mouse to select data points on the plot and view data details in pop up window.
eto018.bmp
Figure 5. Voltage and Amps Time Plot with Selected Channels Visible
PC Application Software Analyzing Data
11
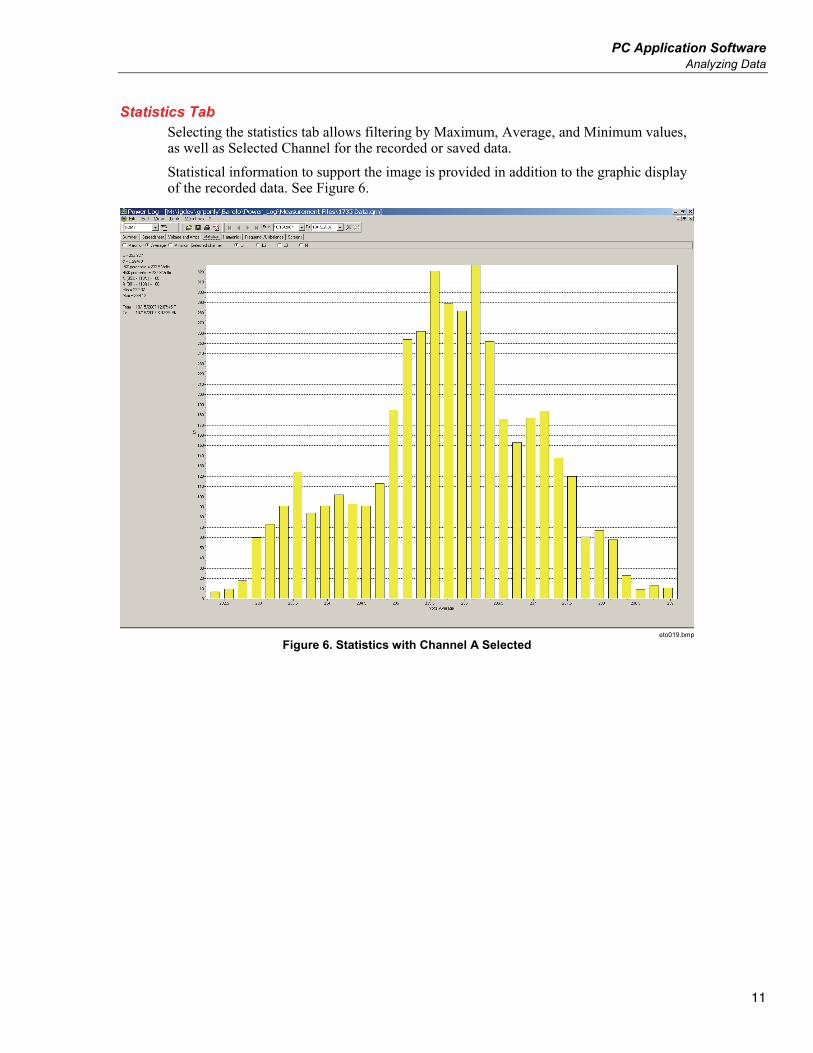
Statistics Tab Selecting the statistics tab allows filtering by Maximum, Average, and Minimum values, as well as Selected Channel for the recorded or saved data.
Statistical information to support the image is provided in addition to the graphic display of the recorded data. See Figure 6.
eto019.bmp
Figure 6. Statistics with Channel A Selected
Power Log Users Manual
12
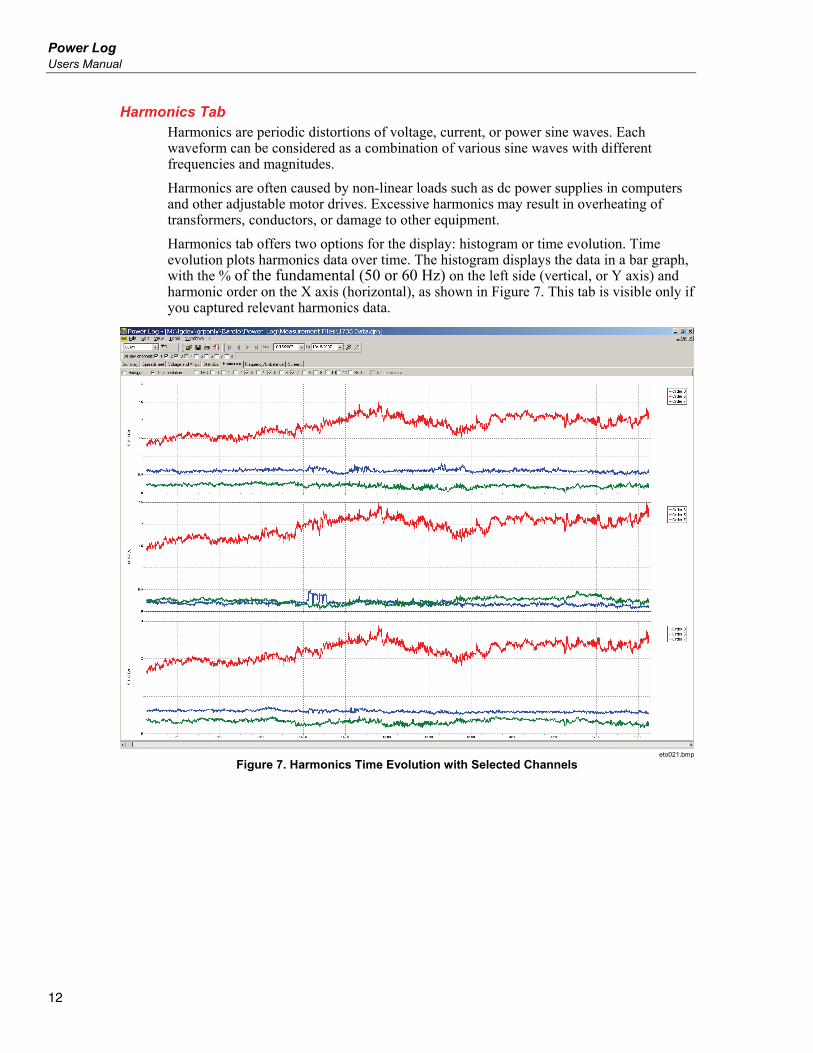
Harmonics Tab Harmonics are periodic distortions of voltage, current, or power sine waves. Each waveform can be considered as a combination of various sine waves with different frequencies and magnitudes.
Harmonics are often caused by non-linear loads such as dc power supplies in computers and other adjustable motor drives. Excessive harmonics may result in overheating of transformers, conductors, or damage to other equipment.
Harmonics tab offers two options for the display: histogram or time evolution. Time evolution plots harmonics data over time. The histogram displays the data in a bar graph, with the % of the fundamental (50 or 60 Hz) on the left side (vertical, or Y axis) and harmonic order on the X axis (horizontal), as shown in Figure 7. This tab is visible only if you captured relevant harmonics data.
eto021.bmp
Figure 7. Harmonics Time Evolution with Selected Channels
PC Application Software Analyzing Data
13
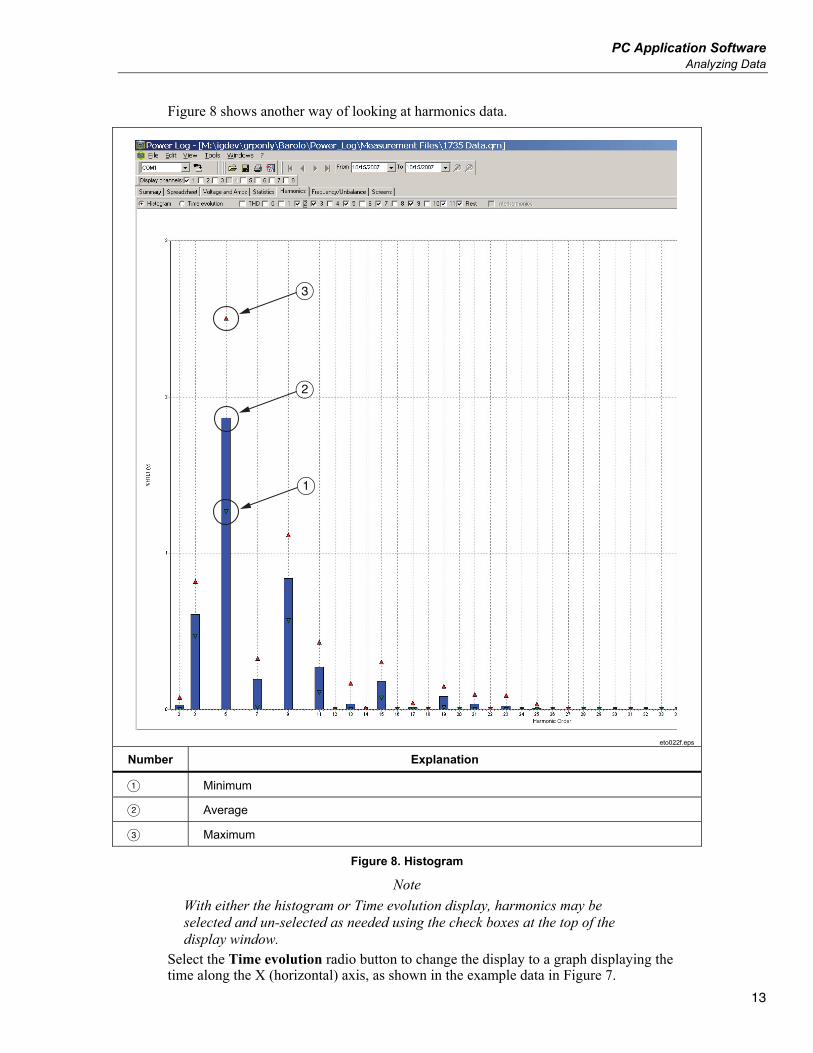
Figure 8 shows another way of looking at harmonics data.
A
B
C
eto022f.eps
Number Explanation
Minimum
Average
Maximum
Figure 8. Histogram
Note
With either the histogram or Time evolution display, harmonics may be selected and un-selected as needed using the check boxes at the top of the display window.
Select the Time evolution radio button to change the display to a graph displaying the time along the X (horizontal) axis, as shown in the example data in Figure 7.
Power Log Users Manual
14
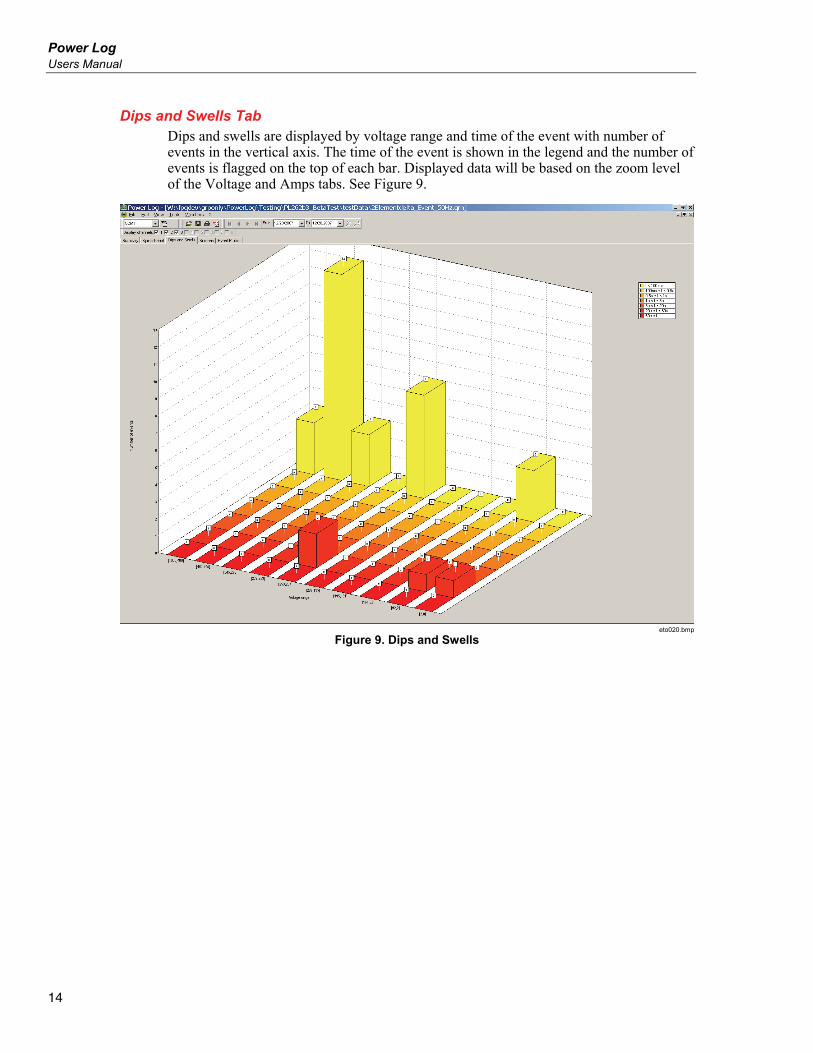
Dips and Swells Tab Dips and swells are displayed by voltage range and time of the event with number of events in the vertical axis. The time of the event is shown in the legend and the number of events is flagged on the top of each bar. Displayed data will be based on the zoom level of the Voltage and Amps tabs. See Figure 9.
eto020.bmp
Figure 9. Dips and Swells
PC Application Software Analyzing Data
15
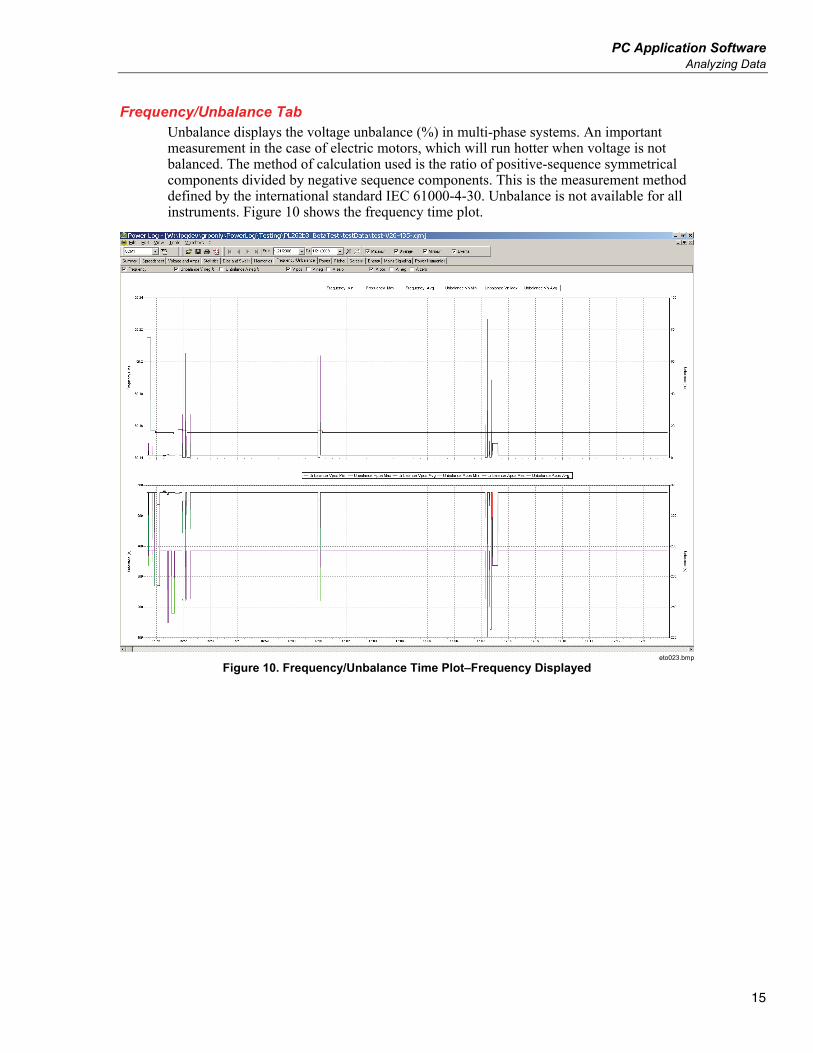
Frequency/Unbalance Tab Unbalance displays the voltage unbalance (%) in multi-phase systems. An important measurement in the case of electric motors, which will run hotter when voltage is not balanced. The method of calculation used is the ratio of positive-sequence symmetrical components divided by negative sequence components. This is the measurement method defined by the international standard IEC 61000-4-30. Unbalance is not available for all instruments. Figure 10 shows the frequency time plot.
eto023.bmp
Figure 10. Frequency/Unbalance Time Plot–Frequency Displayed
Power Log Users Manual
16
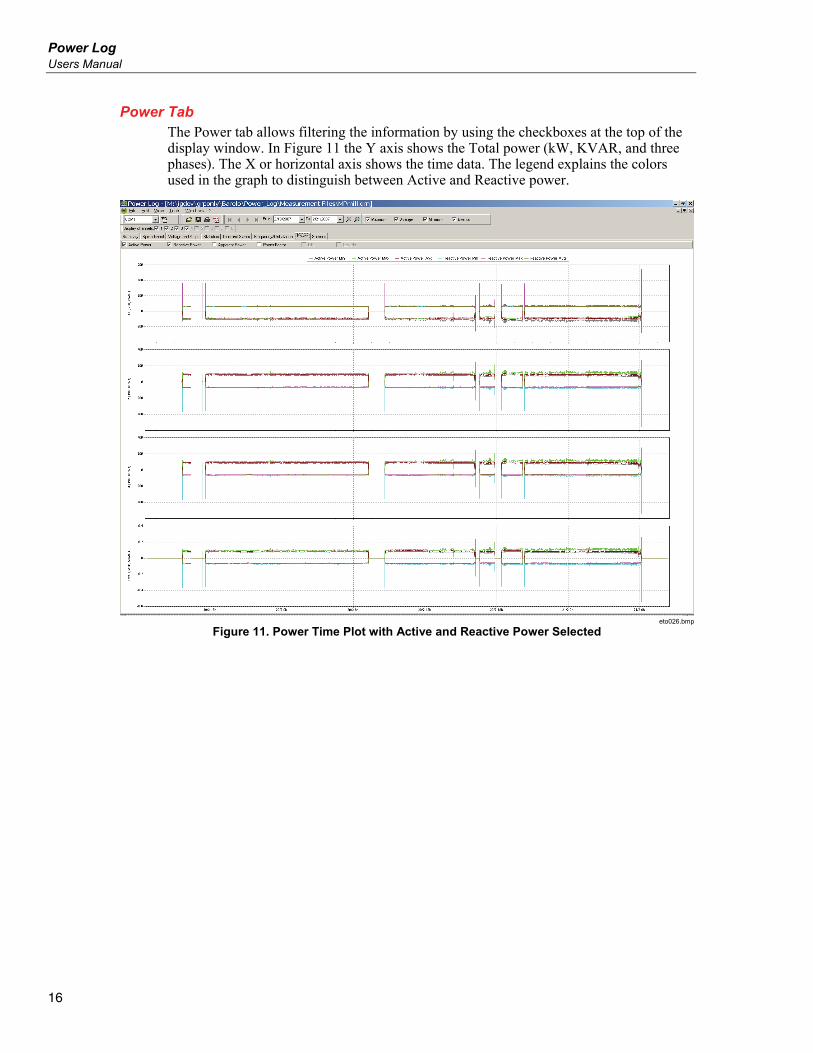
Power Tab The Power tab allows filtering the information by using the checkboxes at the top of the display window. In Figure 11 the Y axis shows the Total power (kW, KVAR, and three phases). The X or horizontal axis shows the time data. The legend explains the colors used in the graph to distinguish between Active and Reactive power.
eto026.bmp
Figure 11. Power Time Plot with Active and Reactive Power Selected
PC Application Software Analyzing Data
17
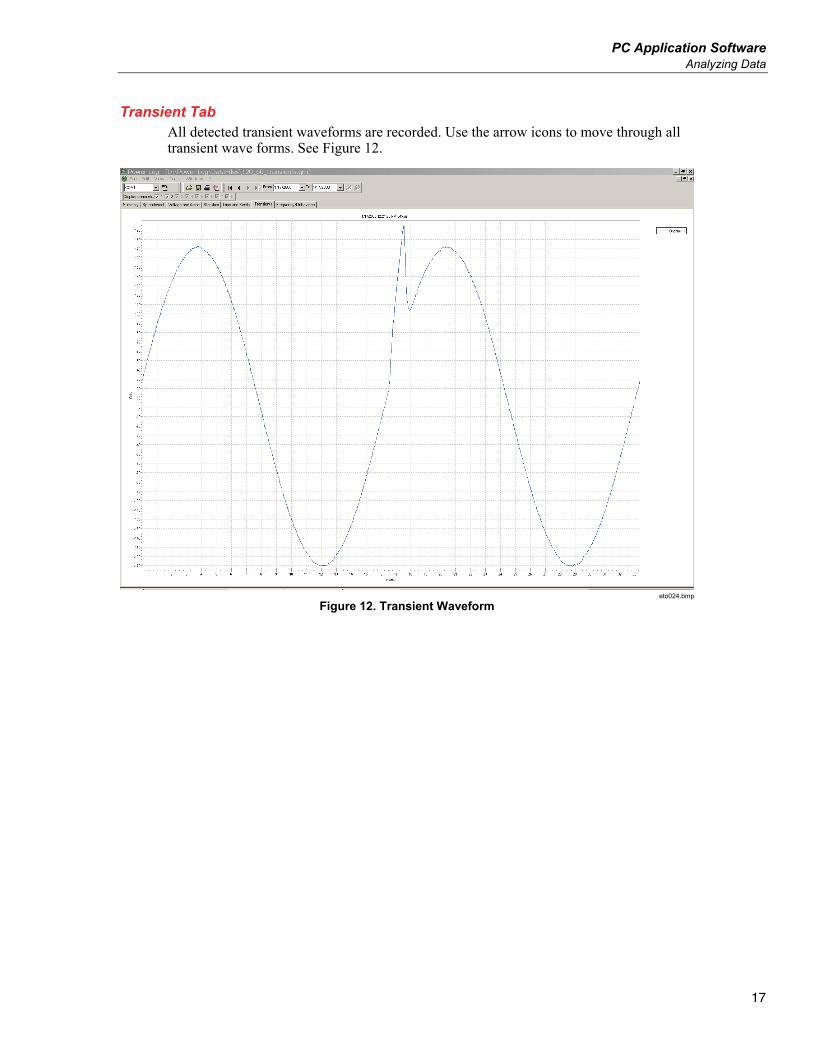
Transient Tab All detected transient waveforms are recorded. Use the arrow icons to move through all transient wave forms. See Figure 12.
eto024.bmp
Figure 12. Transient Waveform
Power Log Users Manual
18
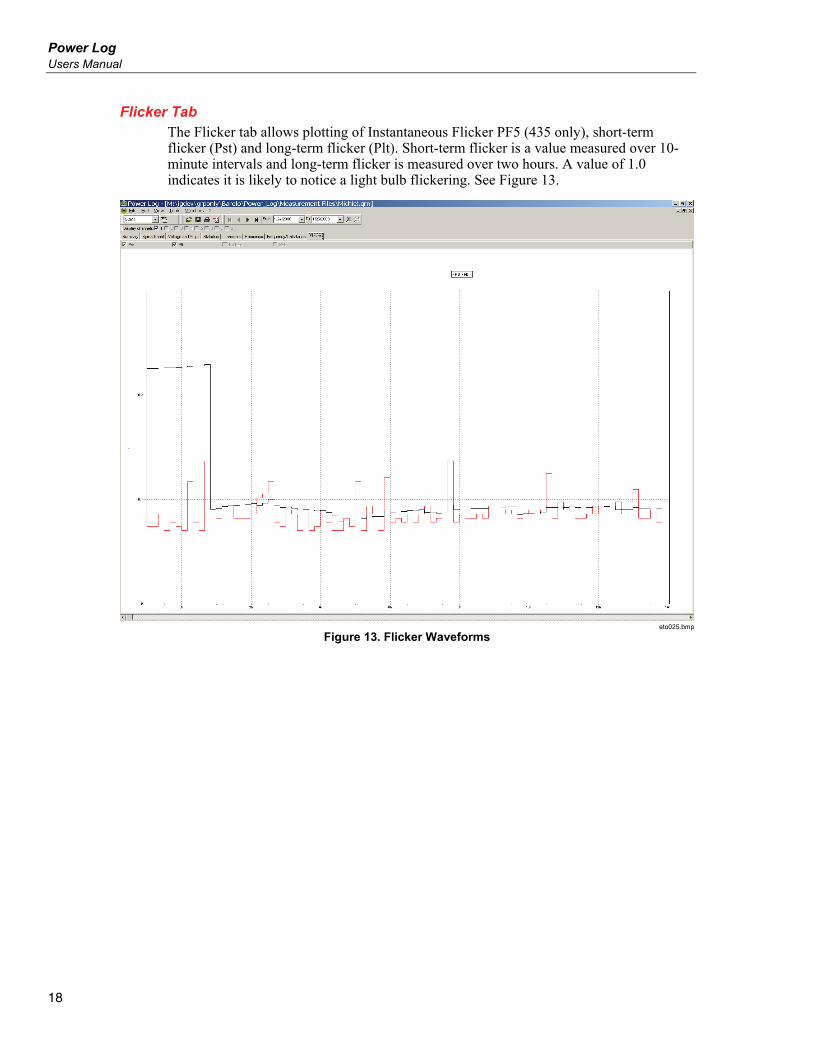
Flicker Tab The Flicker tab allows plotting of Instantaneous Flicker PF5 (435 only), short-term flicker (Pst) and long-term flicker (Plt). Short-term flicker is a value measured over 10-minute intervals and long-term flicker is measured over two hours. A value of 1.0 indicates it is likely to notice a light bulb flickering. See Figure 13.
eto025.bmp
Figure 13. Flicker Waveforms
PC Application Software Analyzing Data
19
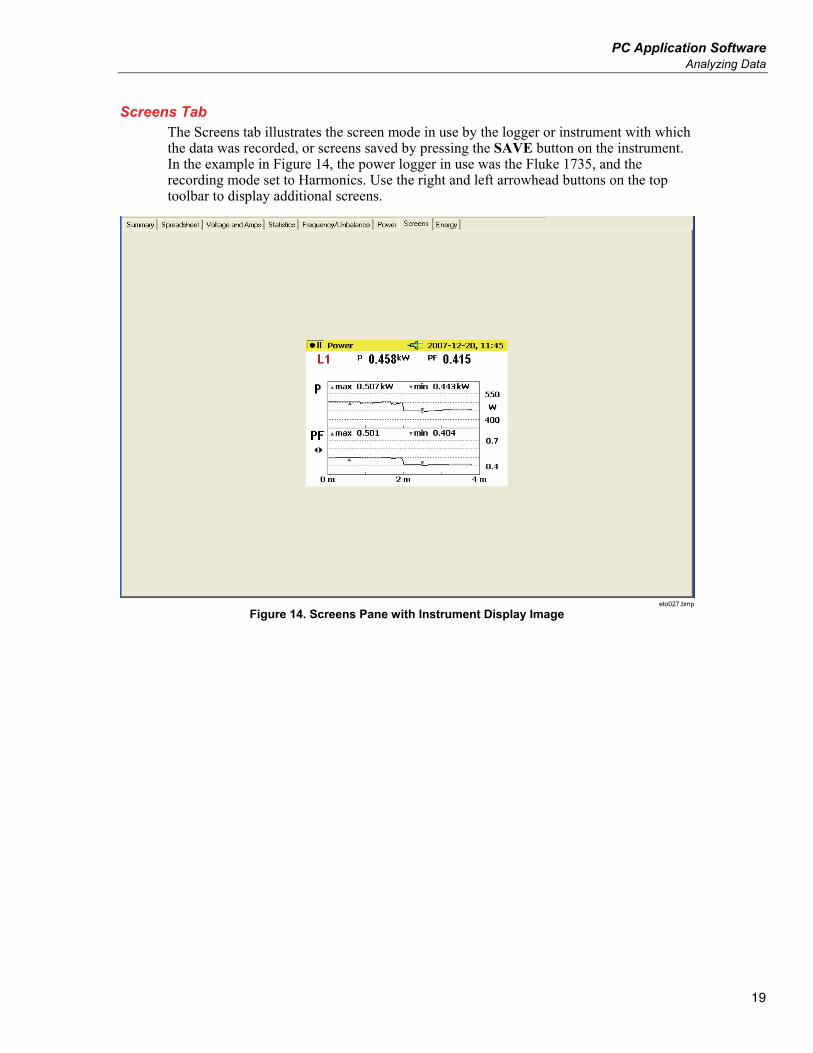
Screens Tab The Screens tab illustrates the screen mode in use by the logger or instrument with which the data was recorded, or screens saved by pressing the SAVE button on the instrument. In the example in Figure 14, the power logger in use was the Fluke 1735, and the recording mode set to Harmonics. Use the right and left arrowhead buttons on the top toolbar to display additional screens.
eto027.bmp
Figure 14. Screens Pane with Instrument Display Image
Power Log Users Manual
20
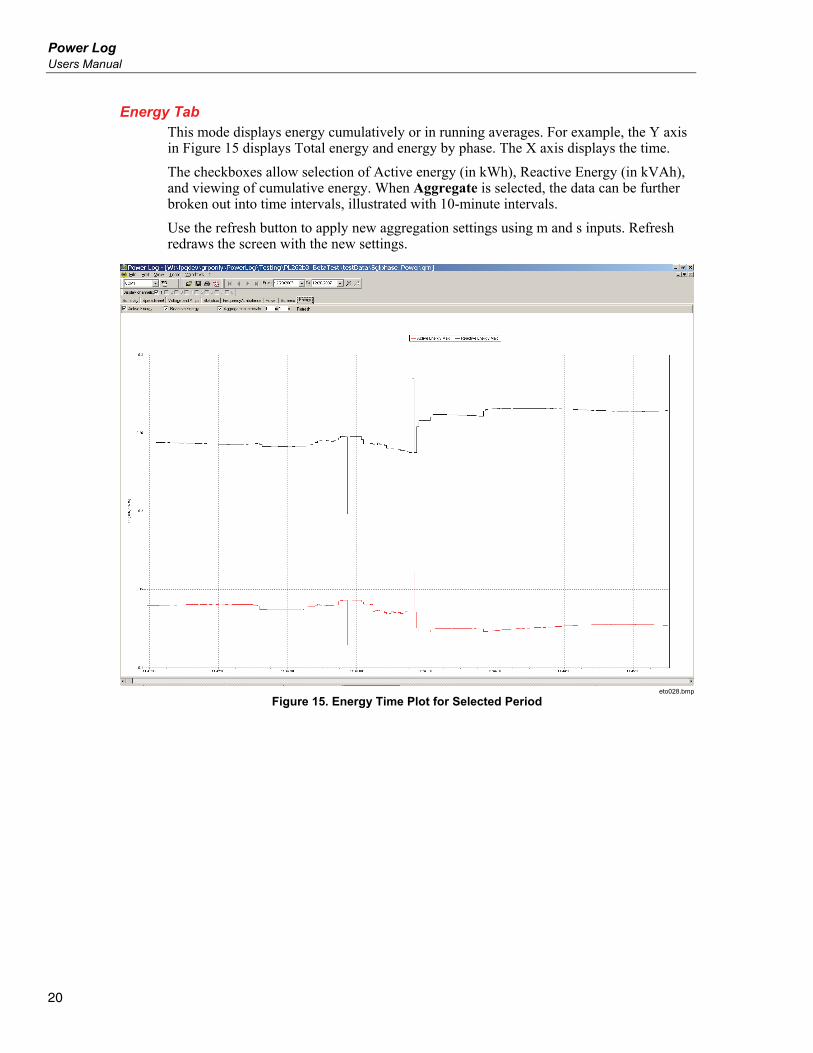
Energy Tab This mode displays energy cumulatively or in running averages. For example, the Y axis in Figure 15 displays Total energy and energy by phase. The X axis displays the time.
The checkboxes allow selection of Active energy (in kWh), Reactive Energy (in kVAh), and viewing of cumulative energy. When Aggregate is selected, the data can be further broken out into time intervals, illustrated with 10-minute intervals.
Use the refresh button to apply new aggregation settings using m and s inputs. Refresh redraws the screen with the new settings.
eto028.bmp
Figure 15. Energy Time Plot for Selected Period
PC Application Software Analyzing Data
21
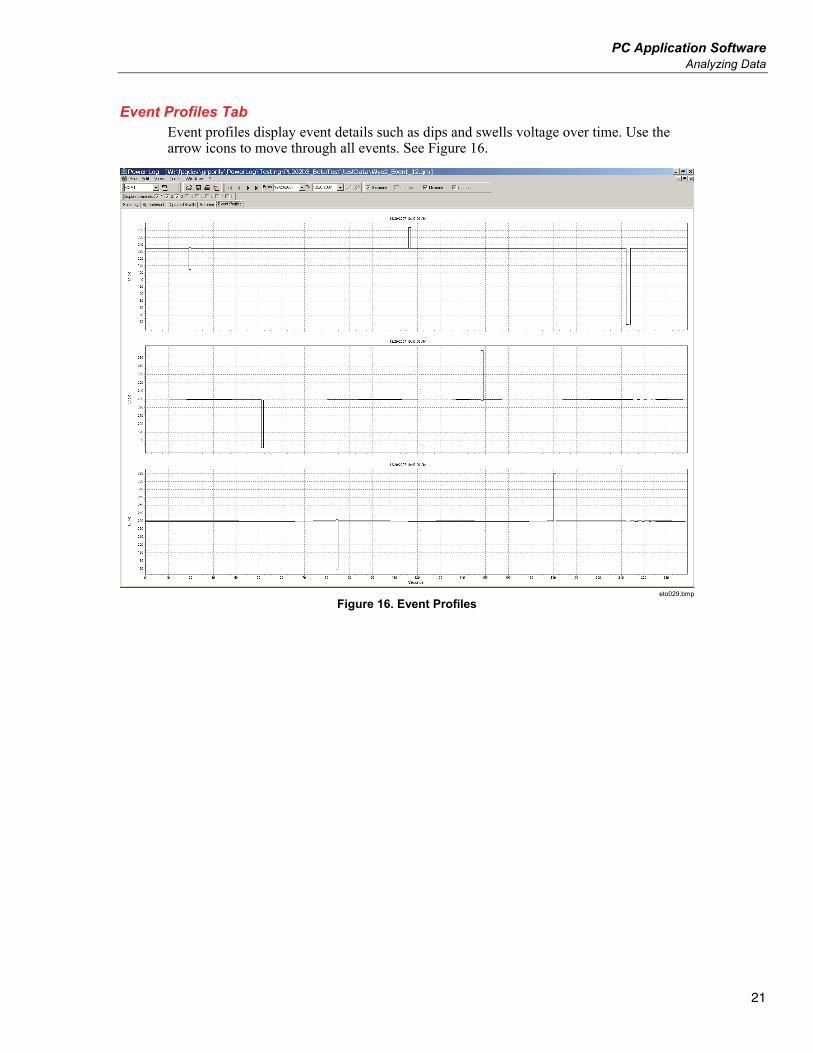
Event Profiles Tab Event profiles display event details such as dips and swells voltage over time. Use the arrow icons to move through all events. See Figure 16.
eto029.bmp
Figure 16. Event Profiles
Power Log Users Manual
22
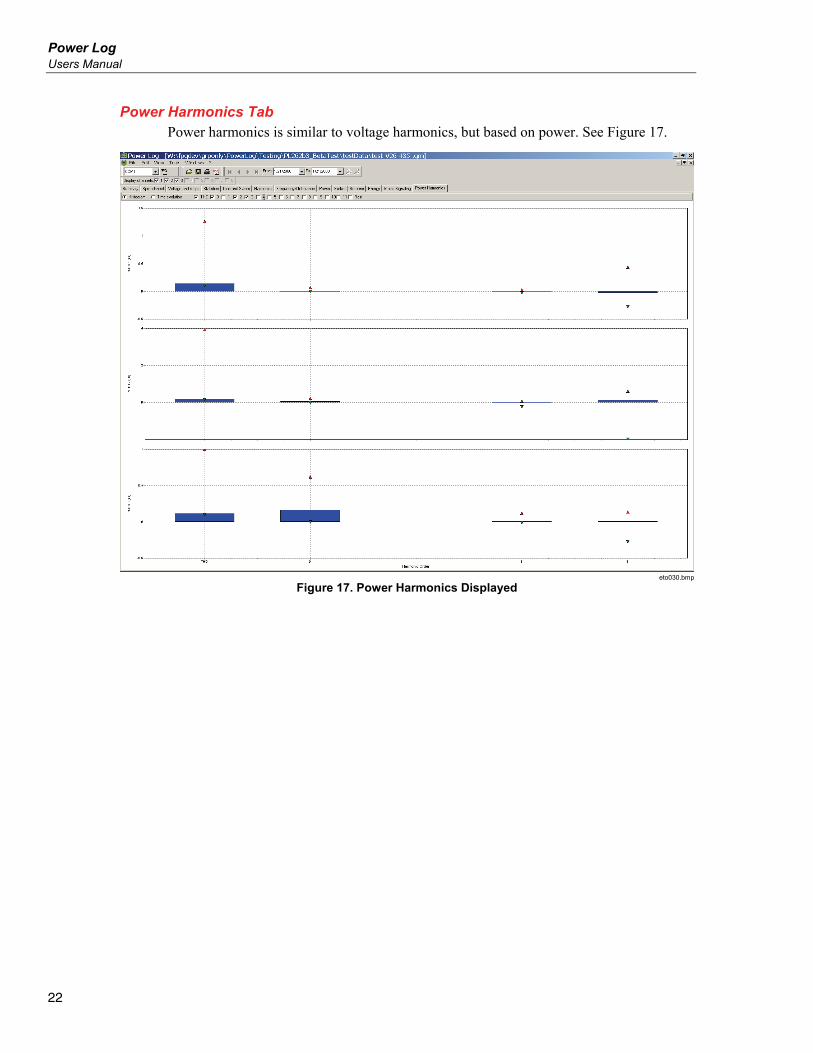
Power Harmonics Tab Power harmonics is similar to voltage harmonics, but based on power. See Figure 17.
eto030.bmp
Figure 17. Power Harmonics Displayed
PC Application Software Analyzing Data
23
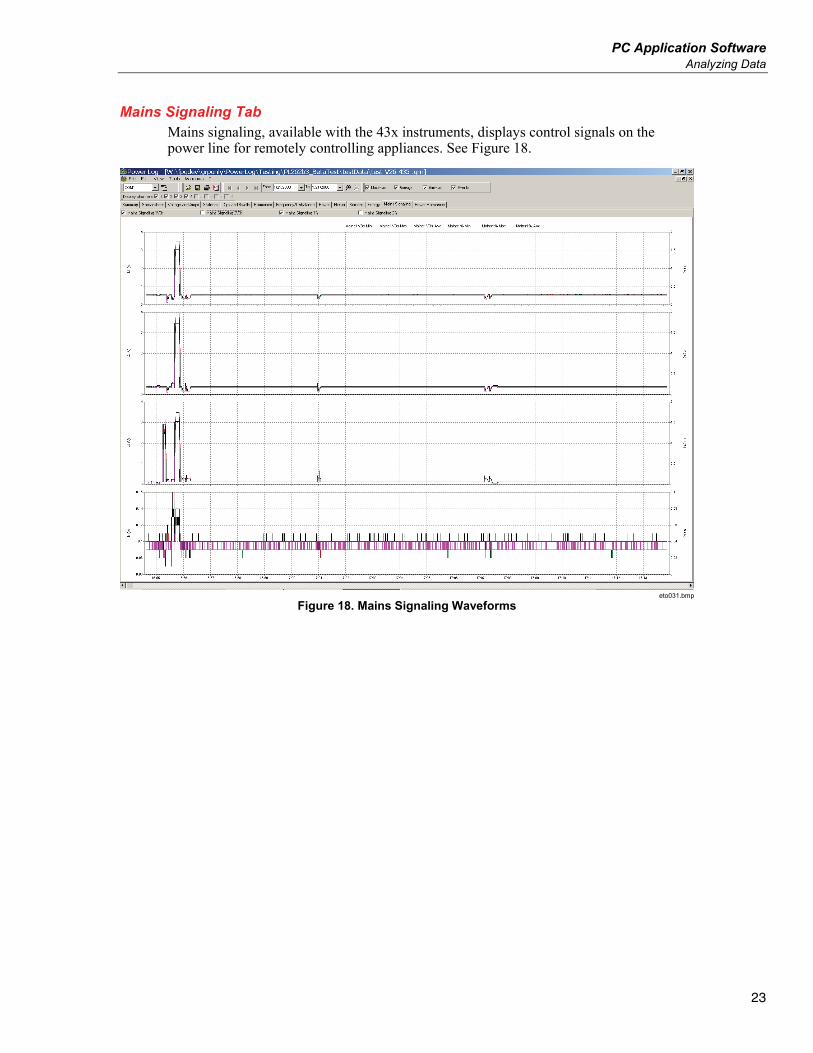
Mains Signaling Tab Mains signaling, available with the 43x instruments, displays control signals on the power line for remotely controlling appliances. See Figure 18.
eto031.bmp
Figure 18. Mains Signaling Waveforms
Power Log Users Manual
24
Printing Reports and Exporting Data In addition to viewing recorded and saved data, users have the option of printing reports for review, and exporting data for use in other software programs.
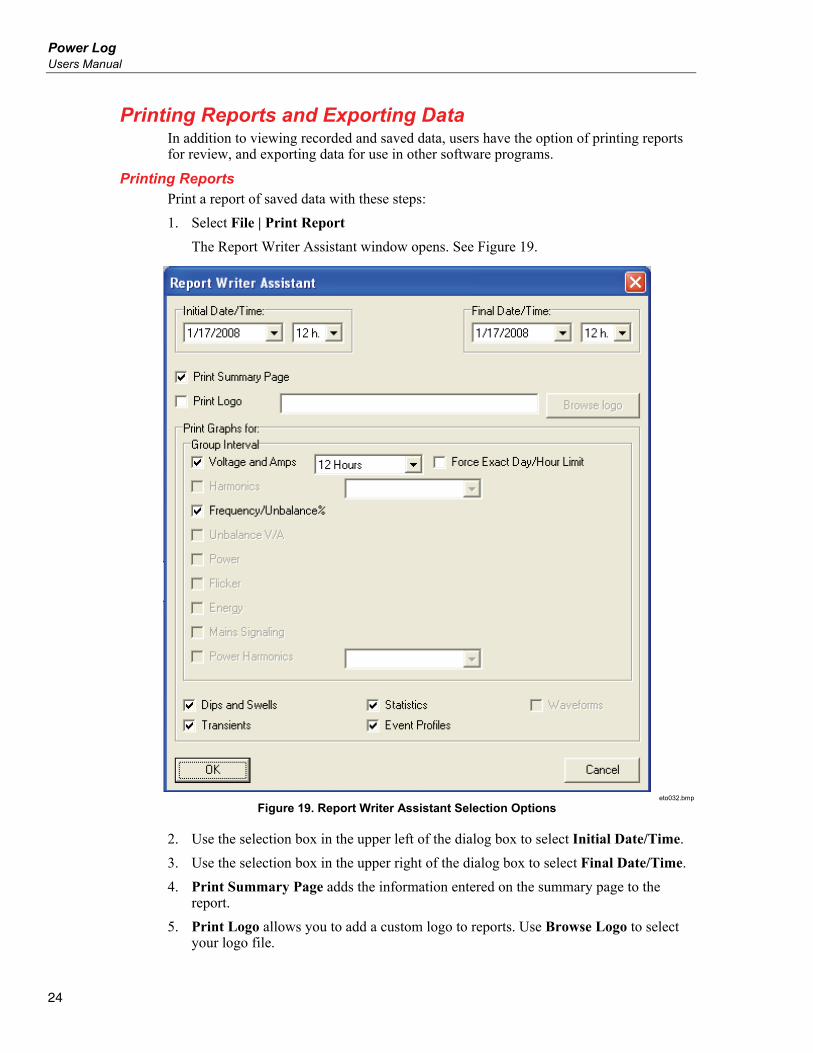
Printing Reports Print a report of saved data with these steps:
1. Select File | Print Report
The Report Writer Assistant window opens. See Figure 19.
eto032.bmp
Figure 19. Report Writer Assistant Selection Options
2. Use the selection box in the upper left of the dialog box to select Initial Date/Time.
3. Use the selection box in the upper right of the dialog box to select Final Date/Time.
4. Print Summary Page adds the information entered on the summary page to the report.
5. Print Logo allows you to add a custom logo to reports. Use Browse Logo to select your logo file.
PC Application Software Printing Reports and Exporting Data
25
Note
Data can also be selected by zooming in time plot displays prior to selecting print report.
6. Deselect any of the selected options in the Print Graphs for section to further limit the printed data.
7. Limit the time interval using the Group Interval selection box, with 1 Week as the default.
8. Click O.K.
The file is sent to the selected printer. The Print dialog box allows printer configuration (copies, landscape or portrait layout, and other Properties).
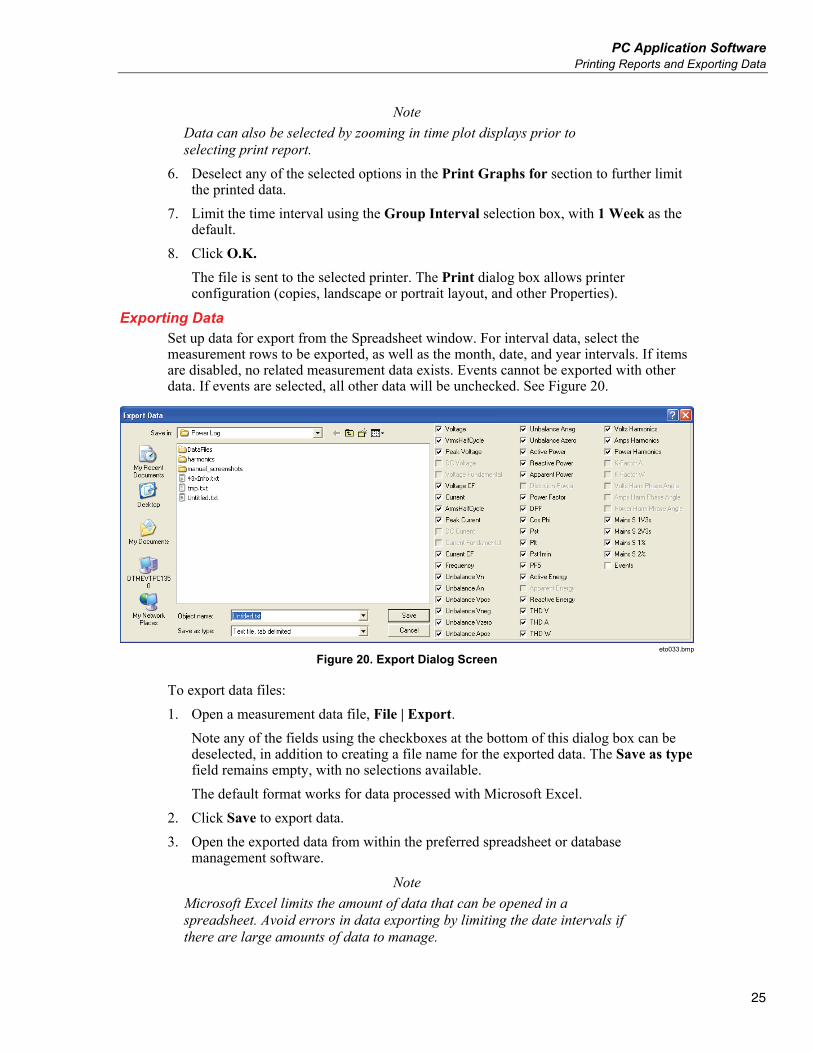
Exporting Data Set up data for export from the Spreadsheet window. For interval data, select the measurement rows to be exported, as well as the month, date, and year intervals. If items are disabled, no related measurement data exists. Events cannot be exported with other data. If events are selected, all other data will be unchecked. See Figure 20.
eto033.bmp
Figure 20. Export Dialog Screen
To export data files:
1. Open a measurement data file, File | Export.
Note any of the fields using the checkboxes at the bottom of this dialog box can be deselected, in addition to creating a file name for the exported data. The Save as type field remains empty, with no selections available.
The default format works for data processed with Microsoft Excel.
2. Click Save to export data.
3. Open the exported data from within the preferred spreadsheet or database management software.
Note
Microsoft Excel limits the amount of data that can be opened in a spreadsheet. Avoid errors in data exporting by limiting the date intervals if there are large amounts of data to manage.

Power Log Users Manual
26