power flow simulation of flywheel energy storage … · introduction load profiles of trams show a...
TRANSCRIPT

International Conference on Renewable Energies and Power Quality (ICREPQ’17)
Malaga (Spain), 4th to 6th April, 2017
exÇxãtuÄx XÇxÜzç tÇw cÉãxÜ dâtÄ|àç ]ÉâÜÇtÄ (RE&PQJ)
ISSN 2172-038 X, No.15 April 2017
Power Flow Simulation of Flywheel Energy Storage Systems for Tramways
N. Erd, X. Li, A. Binder
Institute of Electrical Energy Conversion, Graduate School of Excellence Energy Science and Engineering
Technische Universität Darmstadt
Darmstadt, Germany
[email protected] [email protected] [email protected]
Abstract
Energy storage devices, such as flywheel storages, can be
used in railway systems, especially tramways, to save
energy from being turned into heat in the braking resistor.
This paper provides a quantitative analysis for the possible
energy savings by using a flywheel energy storage system
in a tramway. For this purpose a flywheel is modeled
considering various internal losses. Based on the defined
operating strategy, the power flow of the traction system is
analyzed for a given driving cycle. The energy
consumption of a tram with a flywheel system is compared
to the consumption of a conventional tram without an
energy storage device and a tram with a storage device
based on supercaps. Finally, the influence of the grid feed-
in power limit on the energy savings is analyzed.
Key words
Flywheel, Energy Storage, Tramway, Train, Energy
Savings, Supercap
1. Introduction
Load profiles of trams show a highly fluctuating power
demand due to a driving cycle characterized by many stops
[1]. In every acceleration and deceleration period, we
observe power peaks due to the traction power needed to
accelerate the train and the recuperated power when the
train decelerates. This fluctuation causes various energy
losses compared to an ideally smooth power demand.
Firstly, most tramway grids are not able to feed energy
back into the mains, therefore the recovered braking
energy has to be consumed within the tramway grid. One
possibility is to feed the energy to other trains in vicinity
which have a simultaneous power demand. But this
preferable scenario is not guaranteed. When the recovered
energy cannot be absorbed by the other trains or if they are
too far away from the back-feeding train, a braking resistor
has to be used to convert the energy into heat.
Instead of turning the electrical energy into heat in the
resistor, an onboard energy storage device can be used in
order to store the surplus energy and feed the train in the
next acceleration period. Thereby a storage device also
smooths the power demand and avoids high grid currents,
which evoke significant ohmic losses on the catenary.
Therefore the potential energy savings are based on both,
avoiding the use of the braking resistor and reducing
peak currents drawn from the grid. The utilization of the
energy saving potential through energy storage devices is
economically interesting, since a single tram train has
energy costs of ca. 30 000 € per year [1]. Apart from the
energy savings the use of onboard energy storage devices
also offers the possibility for centenary-free operation in
order to reduce the visual impact of overhead lines [2].
Several technologies are proposed for energy storage
devices for railway systems: batteries, supercaps,
flywheels and hybrid energy storage systems, which
combine batteries with supercaps [3]. Batteries and
supercaps are commercially available technologies,
whereas flywheels are still in development. In general,
batteries have a relatively long recharge time and suffer
from significant degradation causing a lifespan of
approximately 5000 cycles. Therefore batteries are not
suitable for tramway applications, where large numbers
of charge/discharge cycles are required (approx. 500
stops/day). Energy storage systems for trams with
supercaps are commercially available, but even the
slowly degrading supercaps have to be replaced at least
one time during the lifetime of the tramway. Flywheels
have the advantages of a high power density, similar to
supercaps, but offer a higher number of cycles without
degradation over time. These are attractive characteristics
for the use in energy storage devices for railway
applications. However, flywheels are not as highly
developed as supercaps due to many technical and
economic issues, e.g. system complexity, low energy
density, high costs and safety concerns. In comparison to
other storage applications, such as domestic storages for
surplus PV energy [4], the average storage time in trams
is very short. The typical storage time is defined by the
average duration of a stop of the train, which is less than
a minute. This short storage time keeps flywheels
interesting for trams despite the fact, that they show the
highest self-discharge rate of all three technologies.
In this paper a simulation model and simulation results
are presented to quantify the benefits of an onboard
flywheel energy storage system for railway applications.
These simulations take the internal losses of the storage
devices into account in order to get a realistic estimation
https://doi.org/10.24084/repqj15.256 149 RE&PQJ, Vol.1, No.15, April 2017
of the overall energy savings. We modelled a train without
a storage device and two different storages: a flywheel
energy storage system and a supercap storage device.
Comparative results will be given for both technologies
with reference to a tram without an energy storage system.
The influence of the grid feed-in power limit on the energy
savings will be discussed as well.
2. Tram and Driving Cycle
The tramway model is set up for the Bombardier
Variobahn (Rhein-Neckar). This tram has six motors with
95 kW nominal power each. The total length of the tram is
40 m and the train is capable of max. 240 passengers. A
schematic picture of the tram is shown in Fig. 1. The
particular tram is chosen for modelling, since Bombardier
offers a configuration with an energy storage device based
on supercaps and driving cycles with overall train power
data are available in [1].
Fig. 1 Seven-car Bombardier Variobahn [5]
The driving cycle, which is used for the simulation is
shown in Fig. 2 (top). The driving cycle was measured by
Bombardier in the German city Heidelberg and covers one
hour. During this urban cycle the tram travels 17.6 km in
total and has an energy consumption of 50.8 kWh. Fig. 2
(bottom) shows the overall power demand of the tram in
the driving cycle. The train power is negative if the
recovered braking power exceeds the power needed for the
auxiliary systems, such as air conditioner or lights.
Fig. 2 Urban driving cycle and train power for a Bombardier
Variobahn (Rhein-Neckar) according to [1].
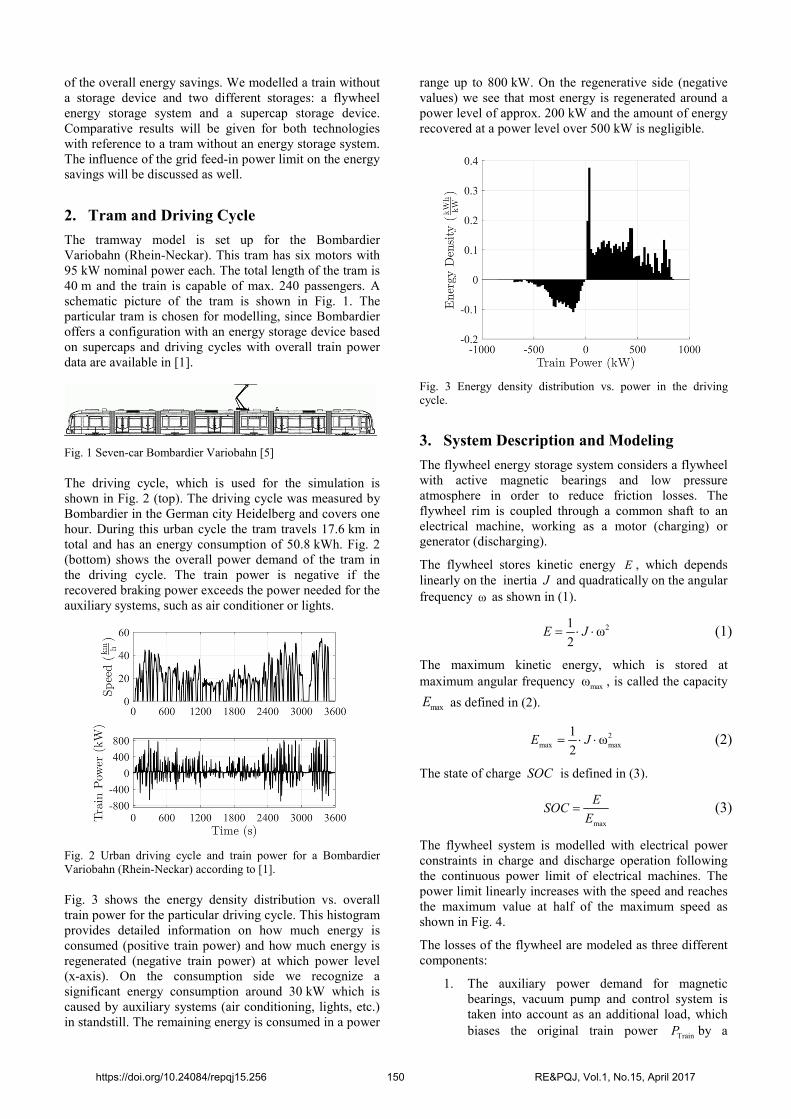
Fig. 3 shows the energy density distribution vs. overall
train power for the particular driving cycle. This histogram
provides detailed information on how much energy is
consumed (positive train power) and how much energy is
regenerated (negative train power) at which power level
(x-axis). On the consumption side we recognize a
significant energy consumption around 30 kW which is
caused by auxiliary systems (air conditioning, lights, etc.)
in standstill. The remaining energy is consumed in a power
range up to 800 kW. On the regenerative side (negative
values) we see that most energy is regenerated around a
power level of approx. 200 kW and the amount of energy
recovered at a power level over 500 kW is negligible.
Fig. 3 Energy density distribution vs. power in the driving
cycle.
3. System Description and Modeling
The flywheel energy storage system considers a flywheel
with active magnetic bearings and low pressure
atmosphere in order to reduce friction losses. The
flywheel rim is coupled through a common shaft to an
electrical machine, working as a motor (charging) or
generator (discharging).
The flywheel stores kinetic energy E , which depends
linearly on the inertia J and quadratically on the angular
frequency ω as shown in (1).
21ω
2E J= ⋅ ⋅ (1)
The maximum kinetic energy, which is stored at
maximum angular frequency max
ω , is called the capacity
maxE as defined in (2).
2
max max
1ω
2E J= ⋅ ⋅ (2)
The state of charge SOC is defined in (3).
max
ESOC
E= (3)
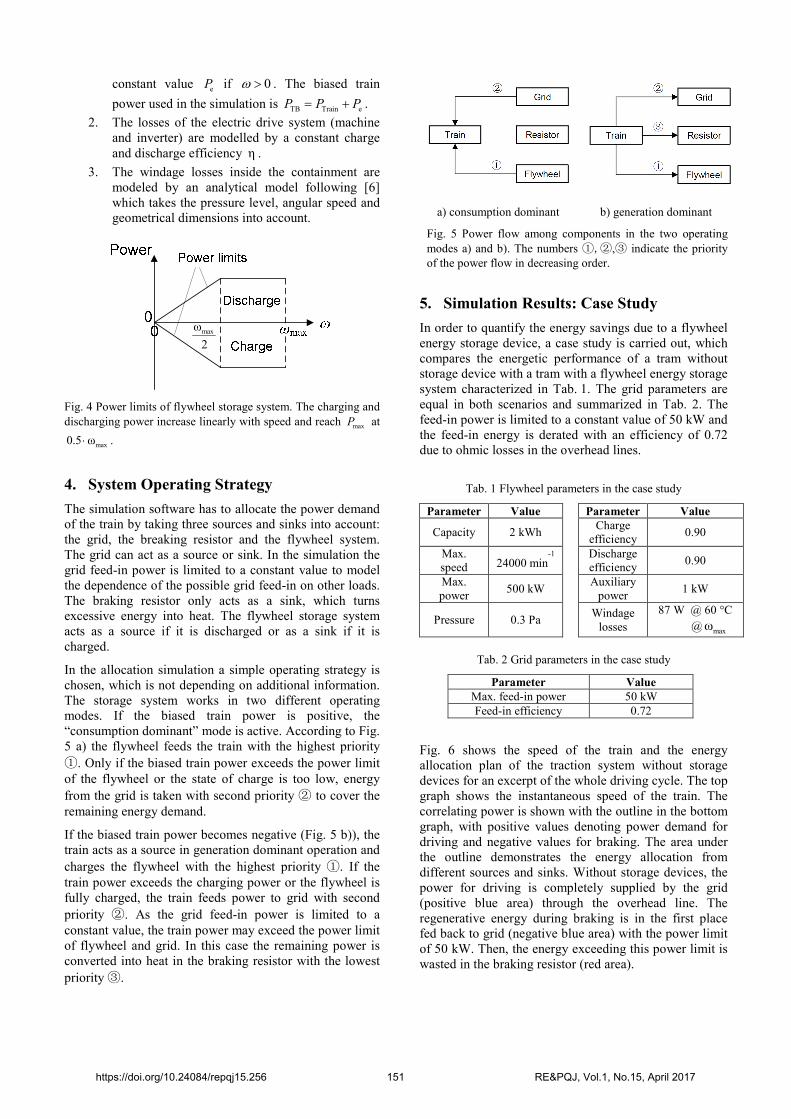
The flywheel system is modelled with electrical power
constraints in charge and discharge operation following
the continuous power limit of electrical machines. The
power limit linearly increases with the speed and reaches
the maximum value at half of the maximum speed as
shown in Fig. 4.
The losses of the flywheel are modeled as three different
components:
1. The auxiliary power demand for magnetic
bearings, vacuum pump and control system is
taken into account as an additional load, which
biases the original train power Train
P by a
https://doi.org/10.24084/repqj15.256 150 RE&PQJ, Vol.1, No.15, April 2017
constant value e
P if 0ω > . The biased train
power used in the simulation is TB Train e
P P P= + .
2. The losses of the electric drive system (machine
and inverter) are modelled by a constant charge
and discharge efficiency η .
3. The windage losses inside the containment are
modeled by an analytical model following [6]
which takes the pressure level, angular speed and
geometrical dimensions into account.
Fig. 4 Power limits of flywheel storage system. The charging and
discharging power increase linearly with speed and reach maxP at
max0.5 ω⋅ .
4. System Operating Strategy
The simulation software has to allocate the power demand
of the train by taking three sources and sinks into account:
the grid, the breaking resistor and the flywheel system.
The grid can act as a source or sink. In the simulation the
grid feed-in power is limited to a constant value to model
the dependence of the possible grid feed-in on other loads.
The braking resistor only acts as a sink, which turns
excessive energy into heat. The flywheel storage system
acts as a source if it is discharged or as a sink if it is
charged.
In the allocation simulation a simple operating strategy is
chosen, which is not depending on additional information.
The storage system works in two different operating
modes. If the biased train power is positive, the
“consumption dominant” mode is active. According to Fig.
5 a) the flywheel feeds the train with the highest priority
①. Only if the biased train power exceeds the power limit
of the flywheel or the state of charge is too low, energy
from the grid is taken with second priority ② to cover the
remaining energy demand.
If the biased train power becomes negative (Fig. 5 b)), the
train acts as a source in generation dominant operation and
charges the flywheel with the highest priority ①. If the
train power exceeds the charging power or the flywheel is
fully charged, the train feeds power to grid with second
priority ②. As the grid feed-in power is limited to a
constant value, the train power may exceed the power limit
of flywheel and grid. In this case the remaining power is
converted into heat in the braking resistor with the lowest
priority ③.
a) consumption dominant b) generation dominant
Fig. 5 Power flow among components in the two operating
modes a) and b). The numbers ①,②,③ indicate the priority
of the power flow in decreasing order.
5. Simulation Results: Case Study
In order to quantify the energy savings due to a flywheel
energy storage device, a case study is carried out, which
compares the energetic performance of a tram without
storage device with a tram with a flywheel energy storage
system characterized in Tab. 1. The grid parameters are
equal in both scenarios and summarized in Tab. 2. The
feed-in power is limited to a constant value of 50 kW and
the feed-in energy is derated with an efficiency of 0.72
due to ohmic losses in the overhead lines.
Tab. 1 Flywheel parameters in the case study
Parameter Value Parameter Value
Capacity 2 kWh Charge
efficiency 0.90
Max.
speed 24000 min-1
Discharge
efficiency 0.90
Max.
power 500 kW Auxiliary
power 1 kW
Pressure 0.3 Pa Windage
losses 87 W @ 60 °C
@max
ω
Tab. 2 Grid parameters in the case study
Parameter Value
Max. feed-in power 50 kW
Feed-in efficiency 0.72
Fig. 6 shows the speed of the train and the energy
allocation plan of the traction system without storage
devices for an excerpt of the whole driving cycle. The top
graph shows the instantaneous speed of the train. The
correlating power is shown with the outline in the bottom
graph, with positive values denoting power demand for
driving and negative values for braking. The area under
the outline demonstrates the energy allocation from
different sources and sinks. Without storage devices, the
power for driving is completely supplied by the grid
(positive blue area) through the overhead line. The
regenerative energy during braking is in the first place
fed back to grid (negative blue area) with the power limit
of 50 kW. Then, the energy exceeding this power limit is
wasted in the braking resistor (red area).
maxω
2
https://doi.org/10.24084/repqj15.256 151 RE&PQJ, Vol.1, No.15, April 2017

Fig. 6 Energy allocation plan (excerpt) for tram without flywheel
energy storage system
In comparison, Fig. 7 shows the operation of the system
with a 2 kWh flywheel for the same excerpt of the whole
driving cycle. According to the defined priority, the
regenerative energy due to deceleration is firstly used to
charge the flywheel (negative green area). When the
flywheel is full or the power limit of charging is surpassed,
the excessive regenerative energy is fed into the grid
(negative blue area). The braking resistor (negative red
area) takes over only when the power exceeds the possible
combined power of the flywheel and the grid. The energy
accumulated by the flywheel during deceleration is
released to support the train in the next acceleration period
(positive green area). The SOC of the flywheel can be seen
in the bottom graph of Fig. 7.
Fig. 7 Energy allocation plan (excerpt) for tram with flywheel
energy storage system
Taking the complete driving cycle of one hour into
account, the overall energy performance of the two
simulated systems is calculated, as shown in Tab. 3. The
use of a flywheel energy storage system reduces the
overall energy consumption from 4.21 kWh/km to
3.3 kWh/km, indicating energy savings of 20.9 %. The
energy efficiency of the flywheel is about 74.8 %, which
is close to the round-trip power efficiency of 81 %.
Tab. 3 Energy performance of the tram with and without
flywheel in the case study
Parameter With Flywheel No Flywheel
Overall Energy
Consumption 3.33 kWh/km 4.21 kWh/km
Energy Savings -20.9 % 0 %
(Reference)
Storage Energy
Efficiency 74.8 %
6. Comparison with Supercaps
A second case study is carried out based on the same load
profile and the same grid feed-in power limit of 50 kW,
but with supercaps as storage device instead of flywheel,
in order to make a comparison of the energetic
performance for these two technologies. The amount of
energy stored in an ideal capacitor is given by
2
c
1
2E C U= ⋅ ⋅ (4)
where C is capacitance and U is voltage. In practice, the
internal equivalent series resistance (ESR) causes losses
in the capacitor and the leakage current causes the
voltage to decay. The parameters of the supercaps
modelled are shown in Tab. 4 and chosen according to
the datasheet provided in [7]. The inverter efficiency and
the auxiliary power demand for cooling and control
systems are also considered in the simulation.
Tab. 4 Supercaps parameters in the case study according to [7]
Parameter Value Parameter Value
Capacity 2.5 kWh Leakage
current 0.031 A
Max.
voltage 400 V
Inverter
efficiency
0.95 (Charge)
Rated
current 2.4 kA 0.95 (Discharge)
ESR 0.0077 Ω Auxiliary
power 300 W
Tab. 5 shows the simulation results in comparison with a
tram without energy storage device and flywheel. The
overall energy consumption is reduced to 3.26 kWh/km
by using supercaps compared to 4.21 kWh for the tram
without storage device. This energy consumption is
slightly lower than the energy consumption of a tram
with a flywheel. The overall energy savings through the
supercapacitor storage are 22.6 % at an energy efficiency
of 78.6 %. Both values are slightly higher compared to
the flywheel. The slightly better performance of
supercaps comes with the downside of slow degradation
of supercaps over time and cycles.
https://doi.org/10.24084/repqj15.256 152 RE&PQJ, Vol.1, No.15, April 2017

Tab. 5 Comparison of energy performance of the tram with
flywheel and with supercaps in the case study
Parameter With
Flywheel With
Supercaps No Storage
Overall Energy
Consumption 3.33
kWh/km 3.26
kWh/km
4.21
kWh/km
Energy Savings -20.9 % - 22.6 % 0 %
(Reference)
Storage Energy
Efficiency 74.8 % 78.6 %
7. Influence of Grid Feed-in Power on
Energy Performance
In the case study we assumed a constant maximum grid
feed-in power of 50 kW. This parameter has a strong
influence on the energy consumption without an energy
storage device, since it determines how much energy will
be fed to the braking resistor if no storage device is
installed. For a large maximum grid feed-in power we
expect a decreasing energy consumption of the tram
without a storage system, since the recuperated energy will
be fed to the grid instead of being turned into heat.
In order to quantify this dependence a parametric study is
conducted. Thereby all parameters of the case study for the
tram with the flywheel are preserved (see Tab. 1), but the
maximum grid feed-in power is varied and the overall
energy consumption is calculated. The results depicted in
Fig. 8 show that the overall energy consumption without a
flywheel drops from 4.6 kWh/km at no grid feed-in to
3.4 kWh/km at 300 kW maximum grid feed-in power. In
the case of a tram with a flywheel energy storage system
the overall energy consumption is rather independent of
the max. grid feed-in power. The relative energy savings
due to the storage are given in Fig. 8 in brackets. The
energy savings vary in a broad range from 27 % to 1 %
depending on the maximum grid feed-in power.
Fig. 8 Overall energy consumption of a tram with (blue) and
without (red) flywheel energy storage system depending on the
maximum possible grid feed-in power. In brackets the relative
energy savings of a tram with a flywheel energy storage system
compared to a tram without an energy storage system are given.
The parametric study reveals that the benefit from the
storage system in terms of avoiding the use of the breaking
resistor is strongly depending on the maximum grid feed-
in power. A reasonable flywheel design for a particular
tram system therefore strongly depends on a reliable
determination of the maximum grid feed-in power.
8. Conclusions
This paper presents a parametric simulation model for
calculating the energy consumption of trams with and
without flywheel energy storage systems. The potential
energy savings through a flywheel energy storage system
strongly depend on the maximum feed-in power. For a
low maximum feed-in power a flywheel can save up to
21 % of the total energy consumption, whereas for a grid
with a high ability to receive energy the savings decrease
to 1 %.
A comparative study of using a flywheel and supercaps
in the tram shows that the flywheel has slightly lower
energy savings than the supercaps. Also the storage
energy efficiency of the flywheel (74.8 %) is lower than
the supercaps of 78.6 %. However, a complete
comparison should also take more factors into account,
e.g. the lifetime, overall costs, energy density and safety
concerns.
Further simulations are planned with a revised model,
which is capable of calculating the current depending
ohmic losses on the overhead lines. This will lead to
more precise results which take the effect of a smoother
grid power into account.
Acknowledgement
The authors appreciate the financial support by the DFG
in the framework of the Excellence Initiative, Darmstadt
Graduate School of Excellence Energy Science and
Engineering (GSC 1070).
References
[1] M. Beek and M. Klohr, "RNV und der MITRAC
Energy Saver - ein Erfahrungsbericht (RNV and
MITRAC Energy-Saver - report of experiences),"
ZEVrail, no. 137, pp. 202-209, 2013.
[2] P. Arboleya, P. Bldaguren and U. Armendariz,
"Energy is on Board," IEEE Electrification
Magazine, pp. 30-41, 2016.
[3] T. Ratniyomachai, S. Hillmansen and P. Tricoli,
"Recent developments and applications of energy
storage devices in electrified railways," IET
Electrical Systems in Transportation, vol. 4, pp. 9-20,
2014.
[4] X. Li, N. Erd und A. Binder, „Evaluation of Flywheel
Energy Storage Systems for Residential Photovoltaic
Installations,“ in International Symposium on Power
Electronics, Electrical Drives, Automation and
Motion (SPEEDAM), Capri Island, Italy, 2016.
[5] www.trampicturebook.de, 2016. [Online].
[6] H. Liu, M. Werst, J. J. Hahne and D. Bogard,
"Prediction of windage losses of an enclosed high
speed composite rotor in low air pressure
environments," in Heat Transfer Summer Conf., Las
Vegas, USA, 2003.
[7] Maxwell Technologies Inc., „Datasheet K2
Ultracapacitors,“ 2016. [Online].
https://doi.org/10.24084/repqj15.256 153 RE&PQJ, Vol.1, No.15, April 2017