power clamp-on meter · zero correction adc/aac+dc/wdc/wac+dc 2.1 3.8.2 2 selects the type of...
TRANSCRIPT

ENG
607 POWER CLAMP-ON METER
User ManualLISH

2

3
CONTENTS
RECEIVING YOUR SHIPMENT........................................................................... 8
ORDERING INFORMATION................................................................................ 8
1 PRESENTATION .......................................................................................... 9
1.1 THE ROTARY SWITCH ................................................................................101.2 THE FUNCTION BUTTONS .........................................................................111.3 THE DISPLAY ................................................................................................12
1.3.1 Display Symbols ........................................................................... 121.3.2 Measurement Capacity Exceeded (OL) ........................................ 13
1.4 THE TERMINALS...........................................................................................14
2 THE BUTTONS........................................................................................... 15
2.1 BUTTON.................................................................................................15
2.2 (YELLOW) BUTTON (second function) ...............................................162.3 BUTTON.................................................................................................16
2.4 BUTTON.................................................................................................17
2.5 BUTTON ................................................................................................182.5.1 Normal Mode ................................................................................ 182.5.2 The MAX/MIN Mode + Activation of the HOLD Mode ................... 19
2.5.3 Access to the True Inrush™ Mode ( set switch to ) ....... 192.6 BUTTON................................................................................................20
2.6.1 Normal Mode ................................................................................ 202.6.2 Harmonic Order Display or + ................................. 202.6.3 The Hz Function + Activation of the HOLD Mode ......................... 21
3 USE............................................................................................................. 22
3.1 INSTALLING THE BATTERIES....................................................................223.2 TURNING THE CLAMP-ON METER ON.....................................................223.3 TURNING THE CLAMP-ON METER OFF...................................................223.4 CONFIGURATION.........................................................................................23
3.4.1 Auto Power Off.............................................................................. 233.4.2 Configuring the Threshold for True InRush™ Measurement......... 233.4.3 Configuring the Recording Duration.............................................. 243.4.4 Erasing Recordings from Memory................................................. 243.4.5 Default Configuration .................................................................... 24
3.5 VOLTAGE MEASUREMENT (V) ..................................................................253.6 CONTINUITY TEST .................................................................................263.7 RESISTANCE MEASUREMENT ..............................................................273.8 CURRENT MEASUREMENT (A) .................................................................27
3.8.1 AC Measurement .......................................................................... 273.8.2 DC or AC+DC Measurement ........................................................ 28
3.9 STARTING CURRENT OR OVERCURRENT (True InRush™)MEASUREMENT ...........................................................................................30

4
3.10 POWER MEASUREMENTS W, VA, var AND PF .......................................323.10.1 Single-Phase Power Measurement............................................... 323.10.2 Balanced 3-Phase Power Measurement....................................... 333.10.3 Four Quadrant Diagram ................................................................ 34
3.11 ENERGY METERING MEASUREMENT.....................................................353.12 FREQUENCY MEASUREMENT (Hz) ..........................................................38
3.12.1 Frequency Measurement (V) ........................................................ 383.12.2 Frequency Measurement (A) ........................................................ 39
3.13 MEASUREMENT OF THE TOTAL HARMONIC DISTORTION (THD)AND DISPLAY OF THE ORDER OF HARMONICS ORDER.....................39
3.13.1 Measurement of the THD (V) ........................................................ 393.13.2 Measurement of the THD (A) ........................................................ 403.13.3 Display of the Individual Harmonics and of the Frequency of the
Fundamental From DC to the 25th
................................................. 413.14 RECORDING OF MEASUREMENTS..........................................................423.15 Connecting to a Computer.............................................................................42
3.15.1 Bluetooth Connection.................................................................... 423.15.2 Pairing the Instrument to the Computer ........................................ 43
3.16 Turning Bluetooth ON/OFF............................................................................493.18 Recording Data...............................................................................................50
3.17.1 Starting a Recording Session........................................................ 503.17.2 Stopping a Recording Session...................................................... 50
3.18 Downloading Recorded Data.........................................................................503.19 Erasing Data from Memory............................................................................503.20 Data Storage...................................................................................................51
3.20.1 Trend Measurements.................................................................... 513.20.2 Recording with Memory Cleared................................................... 513.20.3 Recording with a Partial or Full Memory ....................................... 513.20.4 Memory Filled During Recording Session..................................... 51
3.21 SOFTWARE INSTALLATION .......................................................................513.21.1 Installing DataView
®...................................................................... 51
3.22 Opening the DATAVIEW Control Panel........................................................543.23 Using the Control Panel .................................................................................553.24 Displaying Real-time Status Information.......................................................573.25 Resizing and Saving Real-time Window Layouts.........................................583.26 Downloading Recorded Instrument Data......................................................583.27 Power Clamp Meter Template.......................................................................60
4 SPECIFICATIONS ...................................................................................... 65
4.1 REFERENCE CONDITIONS ........................................................................654.2 SPECIFICATIONS UNDER THE REFERENCE CONDITIONS.................65
4.2.1 DC Voltage Measurement............................................................. 654.2.2 AC Voltage Measurement............................................................. 664.2.3 AC+DC Voltage Measurement...................................................... 664.2.4 DC Current Measurement............................................................. 674.2.5 AC Current Measurement ............................................................. 674.2.6 AC+DC Intensity Measurement .................................................... 684.2.7 True Inrush™ Measurement ......................................................... 684.2.8 Calculation of the crest factor (CF) ............................................... 694.2.9 Calculation of the RIPPLE in DC................................................... 69

5
4.2.10 Continuity Measurement ............................................................... 694.2.11 Resistance Measurement ............................................................. 694.2.12 Active DC Power Measurements .................................................. 704.2.13 Active AC Power Measurements .................................................. 704.2.14 Active AC+DC Power Measurements ........................................... 724.2.15 Measurement of Apparent AC Power ........................................... 724.2.16 Measurement of Apparent AC+DC Power .................................... 734.2.17 Measurement of Reactive AC Power ............................................ 734.2.18 Measurement of Reactive AC+DC Power..................................... 744.2.19 Calculation of the Power Factor (PF) ............................................ 744.2.20 Calculation of the Displacement Power Factor (DPF)................... 754.2.21 Frequency Measurements ............................................................ 754.2.22 Specifications in THDr .................................................................. 764.2.23 Specifications in THDf................................................................... 764.2.24 Harmonic Measurement Specifications......................................... 76
4.3 ENVIRONMENTAL CONDITIONS ...............................................................774.4 MECHANICAL SPECIFICATIONS ...............................................................774.5 POWER SUPPLY ..........................................................................................774.6 COMPLIANCE WITH INTERNATIONAL STANDARDS.............................784.7 ENVIRONMENTAL VARIATIONS................................................................79
5 MAINTENANCE.......................................................................................... 80
5.1 WARNING: .....................................................................................................805.2 CLEANING .....................................................................................................805.3 REPLACEMENT OF THE BATTERIES .......................................................80
6 REPAIR AND CALIBRATION .................................................................... 81
7 TECHNICAL AND SALES ASSISTANCE.................................................. 81
8 LIMITED WARRANTY ................................................................................ 82
9 WARRANTY REPAIRS .............................................................................. 82

6
Thank you for purchasing a Model 607 Clamp-on Meter.
For best results from your instrument and for your safety, read the enclosedoperating instructions carefully and comply with the precautions for use. Theseproducts must be only used by qualified and trained users.
Meanings of the symbols used on the device
CAUTION - Risk of Danger! Indicates a WARNING and that the operatormust refer to the user manual for instructions before operating theinstrument in all cases where this symbol is marked.
Risk of electric shock. The voltage at the parts marked with this symbol maybe dangerous.
Refers to a type A current sensor. This symbol signifies that applicationaround and removal from HAZARDOUS LIVE conductors is permitted.
1.5 V battery
The CE marking indicates compliance with European directives
Double insulation or reinforced insulation
In the European Union, this product is subject to a separate collectionsystem for recycling electrical and electronic components In accordancewith directive WEEE 2002/96/EC
AC – Alternating current
AC and DC – Alternating and direct current
Ground/Earth

7
PRECAUTIONS FOR USE
This device complies with safety standards IEC-61010-1 and 61010-2-032 for voltages of1000V in category IV at an altitude of less than 2000m, indoors, with a degree of pollutionnot exceeding 2.These safety instructions are intended to ensure the safety of persons and proper operationof the device.
The operator and/or the responsible authority must carefully read and clearlyunderstand the various precautions to be taken in use.
If this instrument is used other than as specified, the protection it provides may becompromised, thereby endangering you.
Do not use the instrument in an explosive atmosphere or in the presence of flammablegases or fumes.
Do not use the instrument on networks of which the voltage or category exceeds thosementioned.
Do not exceed the rated maximum voltages and currents between terminals or withrespect to earth.
Do not use the instrument if it appears to be damaged, incomplete, or not properlyclosed.
Before each use, check the condition of the insulation on the leads, housing, andaccessories. Any element of which the insulation is deteriorated (even partially) mustbe set aside for repair or scrapped.
Use leads and accessories rated for voltages and categories at least equal to those ofthe instrument. If not, an accessory of a lower category lowers the category of thecombined Clamp + accessory to that of the accessory.
Observe the environmental conditions of use.
Do not modify the instrument and only use factory replacement parts. Repairs andadjustments must be done by approved qualified personnel.
Replace the batteries as soon as the symbol appears on the display of the unit.Disconnect all leads before opening the battery compartment cover.
Use personal protective equipment when conditions require.
Keep your hands away from the unused terminals of the instrument.
When handling the test probes, alligator clips, and clamp ammeters, keep your fingersbehind the physical guard.
As a safety measure, and to avoid repeated overloads on the inputs of the device,configuration operations should only be performed when the device is disconnectedfrom all dangerous voltages.

8
MEASUREMENT CATEGORIES
Definitions of the measurement categories:
CAT II: Circuits directly connected to the low-voltage installation.Example: power supply to household electrical appliances and portable tools.
CAT III: Power supply circuits in the installation of the building.Example: distribution panel, circuit-breakers, fixed industrial machines ordevices.
CAT IV: Circuits supplying the low-voltage installation of the building.Example: power lines, meters, and protection devices.
RECEIVING YOUR SHIPMENT
Upon receiving your shipment, make sure that the contents are consistent with the
packing list. Notify your distributor of any missing items. If the equipment appears
to be damaged, file a claim immediately with the carrier and notify your distributor
at once, giving a detailed description of any damage. Save the damaged packing
container to substantiate your claim.
ORDERING INFORMATION
Clamp-on Meter Model 607 .......................................................... Cat. #2139.61
Includes set of 2 color-coded silicone insulated test leads, test probes and alligator clips,
hard carrying case, 4x1.5V AA batteries, DataView® software, Bluetooth adapter and safety
information sheet.
Replacement Parts:
Hard Carrying Case......................................................................... Cat. #2139.73
Set of 2 Color-coded Silicone Test Leads, Test Probes
and Alligator Clips ........................................................................... Cat. #2152.05

7
1 PRESENTATION
The Clamp-on Meter Model 607 is a professional electrical measuring instrumentthat combines the following functions:
Current measurement
InRush current / overcurrent (True InRush™) measurement
Voltage measurement
Frequency measurement
Harmonic distortion (THD) measurement
Harmonic rank value (A and V) up to the 25th
Continuity test with buzzer
Resistance measurement
Power (W, VA, var and PF) and Energy measurements
Crest Factor (CF), the Displacement Power Factor (DPF) and RIPPLEmeasurement
Recording of data in memory; wireless transfer via Bluetooth to a PC
Figure 1:
1Item Designation See §
1Jaws with centering marks(see connection principles)
3.5 to
3.13
2 Physical Guard -
3 Rotary Function Switch 1.1
C
2
9
3
4
5
6
4 Function Buttons 2
5 Backlit Display 1.3
6 Input Terminals 1.4
7 Trigger -
lamp-on Meter Model 607

1.1 THE ROTARY SWITCH
The rotary switch has five positions. To access the , , , functions,set the switch to the desired function. The functions are described in the tablebelow.
Item
1
2
3
4
6
2
3
4
5
10
Figure 2: The Function Rotary Switch
Function See §
OFF mode – Turns the clamp-on meter off 3.3
AC, DC, AC+DC voltage measurement (V) 3.5
Continuity test
Resistance measurement
3.6
3.7
AC, DC, AC+DC current measurement (A) 3.8
Power measurements (W, var, VA) AC, DC, AC+ DC
Power factor (PF), displacement power factor (DPF), andEnergy Calculation
3.10
1

11
1.2 THE FUNCTION BUTTONS
1 2 3
4 5 6
Figure 3: The Function Buttons
Item Function See §
1Holds the last value on the display
Zero correction ADC/AAC+DC/WDC/WAC+DC
2.1
3.8.2
2
Selects the type of measurement and configurationfunctions (AC, DC, AC+DC)
Selection of single-phase or 3-phase measurement
2.2
3
Enables/disables display backlighting
Scrolls up the of orders of harmonics or of pages of resultsin W, MAX/MIN/PEAK
Enables/disables Bluetooth wireless transfer (in combinationwith 6)
2.3
4Enables/disables the MAX/MIN/PEAK mode
Enables/disables the True InRush™ mode in A2.5
5
Measures frequency (Hz), total harmonic distortion (THD),and orders of harmonics
Enables/disables the energy metering mode
2.6
6
Scrolls down the orders of harmonics or of pages of resultsin W, MAX/MIN/PEAK
Enables/disables recording of current data in memory
Enables/disables Bluetooth wireless transfer (in combinationwith 3)
2.4

1.3 THE DISPLAY
Item
1 Mode s
2 Active m
3 Display
4 Type of
5 Low ba
1.3.1 Display S
Symbol
AC
DC
AC+DC
RMS
Max
Min
AVG
PEAK+
PEAK-
4
12
Figure 4: The Display
Function
election display
easurement value and unit display
of the MAX/MIN/PEAK modes
measurement (AC or DC)
ttery indication
ymbols
Description
Alternating current or voltage
Direct current or voltage
Alternating and direct current
Storage of the values and display hold
RMS value
Maximum DC or RMS value
Minimum DC or RMS value
Mean RMS value
Maximum peak value
Minimum peak value
5
1
3
See §
2
3.5 to 3.13
3.10
2.2
5.2
2

13
Balanced total 3-phase power measurement
V Volt
Hz Hertz
W Active power
A Ampere
% Percentage
Ω Ohm
m Milli- prefix
k Kilo- prefix
var Reactive power
VA Apparent power
PF Power factor
DPF Displacement power factor (cos φ)
CF Crest factor
RIPPLE Ripple (in DC)
THDf Total harmonic distortion with respect to the fundamental
THDrTotal harmonic distortion with respect to the true RMSvalue of the signal.
REC Recording in memory
Bluetooth wireless communication
Continuity test
Auto power off disabled
Low battery indicator
1.3.2 Measurement Capacity Exceeded (OL)
The OL (Over Load) symbol is displayed when the display capacity is exceeded.

14
1.4 THE TERMINALS
The terminals are used as follows:
1 2
Figure 5: The Terminals
Item Function
1 COM (black) Input Terminal Jack
2 + Positive (red) Input Terminal Jack

15
2 THE BUTTONS
The buttons respond differently to short, long, and sustained presses.
In this section, the icon represents the possible positions of the switch for thebutton’s functionality.
2.1 BUTTON
This button is used to:
Store and look up the last values acquired specific to each function (V, A,
, W) according to the specific modes previously activated(MAX/MIN/PEAK, Hz, THD). The present display is then maintained whilethe detection and acquisition of new values continues.
Perform automatic zero correction in ADC/AC+DC and WDC/AC+DC (see § 3.9.2).
Successivepresses on Function
First press: Holds the last value displayed
Second press: Returns to normal display mode (thevalue of each new measurement is displayed)
long(> 2 sec)
ADC
AAC+DC
WDC
WAC+DC
Performs automatic zero correction (see 3.9.2)
NOTE: This mode operates if the MAX/MIN/PEAK orHOLD modes (short press) are first de activated
See § 2.5.3 and § 2.6.3 for the button functionality in combination with the
and buttons.

16
2.2 (YELLOW) BUTTON (SECOND FUNCTION)
This button is used to select the type of measurement (AC, DC, AC+DC) and thesecond functions marked in yellow next to the relevant positions of the switch.
It can also be used to modify the default values in the configuration mode(see § 3.4).
NOTE: This button is invalid in the MAX/MIN/PEAK and HOLD modes.
Successive
presses onFunction
short
- Selects AC, DC or AC+DC. Depending onyour choice, the screen displays AC, DC orAC+DC
- Toggles the continuity and Ohm modes
long (>2 sec)
- Displays the total 3-phase power of abalanced system ( is displayed). Pressagain to return to the display of the single-phase power ( is off)
2.3 BUTTON
This button is used to:
Scroll up through the order of harmonics or successive pages up Activate the backlighting Activate the Bluetooth function
Successive
presses onFunction
short
- Scrolls through the various pages ofmeasurement results, depending on thefunction and possibly the active mode(MAX/MIN/PEAK or THD/Harmonics)
long (> 2 sec)
- Enables/disables the backlighting of thedisplay
NOTE: The backlight turns off automaticallyafter 2 minutes
combined with the
button
- Activates Bluetooth wireless communication
- The symbol is the displayed
NOTE: Activation of the Bluetooth modeautomatically stops the recording of the data

17
2.4 BUTTON
This button is used to:
Scroll down through the orders of harmonics or successive pages Activate the recording of the data Activate the Bluetooth function
Successive
presses on… serve
short
- Scrolls through the various pages ofmeasurement results, depending on thefunction and possibly the active mode(MAX/MIN/PEAK or THD/Harmonics)
long (> 2 sec)
- Enables/disables the recording of the data
- The REC symbol is then displayed
NOTE: When the recording memory is full, theREC symbol flashes
combined with the
button
- Activates Bluetooth wireless communication
- The symbol is the displayed
NOTE: Activation of the Bluetooth modeautomatically stops the recording of the data

18
2.5 BUTTON
2.5.1 Normal Mode
This button activates the detection of the MAX, MIN, PEAK+, PEAK- or AVG valuesof the measurements made.Max and Min are the extreme mean values in DC and the extreme RMS values inAC. Peak+ is the maximum instantaneous peak and Peak- is the minimuminstantaneous peak.
NOTE: In this mode, the Auto Power Off function of the device is automaticallydisabled. The symbol is displayed on the screen.
Successive presses onFunction
short
First press: Activates detection of theMAX/MIN/AVG and PEAK values anddisplays MAX/AVG and MIN values
Second press: Displays the PEAK+,AVG, and PEAK- values (on a secondscreen)
Third press: Displays MAX/AVG and MINvalues without exiting from the mode (thevalues already detected are not erased)
NOTE: Depending on the mode, AC orDC, the crest factor (CF), harmonics,frequency, and RIPPLE are also available
- Activates the detection ofMAX/MIN/AVG values
- Displays the MAX, MIN and AVG valuesuccessively
- Returns to the display of the presentmeasurement without exiting from themode (the values already detected arenot erased)
long (> 2 sec)
- Exits the MAX/MIN/PEAK mode. Thevalues previously recorded are thenerased
NOTE: If the HOLD function is enabled, itis not possible to exit from theMAX/MIN/PEAK mode. The HOLDfunction must first be disabled first.

19
2.5.2 The MAX/MIN Mode + Activation of the HOLD Mode
Successive presses onFunction
short
- Displays the MAX, AVG, MIN andPEAK+, AVG, PEAK- values detected
before the button was pressed
- When the button is pressed, thelast value is held on the display
NOTE: The HOLD function does not interrupt the acquisition of new MAX, MIN, PEAKvalues
2.5.3 Access to the True Inrush™ Mode ( set switch to )
This button allows measurement of the True Inrush™ current (starting current, orovercurrent in steady-state operation) for AC or DC current only (not operationalin AC+DC).
Successive presses onFunction
long (>2 sec)
- First press: Enters the True InRush™mode
- "Inrh" is displayed for 3s (thebacklighting blinks)
- The triggering threshold is displayed for5s (the backlighting is steady)
- "------" is displayed and the "A" symbolflashes (backlighting turns off)
- After detection and acquisition, theInRush current measurement isdisplayed, after the calculations stage"------" (backlighting off)
NOTE: The A symbol flashes to indicate"surveillance" of the signal
- Second press: Exits the True InRush™mode (returns to simple currentmeasurement)
short (<2 sec)
Note: A short pressis functional only if a True
InRush value has beendetected.
- Displays the PEAK+ value of the current
- Displays the PEAK- value of the current
- Displays the RMS True InRush™current
NOTE: The A symbol is displayed duringthis sequence

20
2.6 BUTTON
This button is used to display the frequency measurements of a signal, of power,of the levels and orders of harmonics.
NOTE: This button is not functional in the DC mode.
2.6.1 Normal Mode
Successive
presses onFunction
short
Displays:
- The frequency of the signal, the RMSmeasurement, and the DC component
- The crest factor CF, the RMS measurement,and the DC component
long (>2 sec)
- Enters or exits the THD calculation anddisplay mode
- Displays the THDf, the THDr, and the RMSvalue
- The and buttons are used to displayeach order of harmonic (25 orders, from h01to h25), with the associated harmonicdistortion (with respect to the fundamental)and the RMS value of order hxx
- NOTE: Order hdC (displayed in the DC andAC+DC modes) is the DC component; orderh01 is the fundamental
- Starts/Stops the energy metering mode
- Displays the various energy parameters
- The and buttons are used to displaythe status and energy metering measurementresults pages
2.6.2 Harmonic Order Display or +
Successive
presses on…serve
short
- First press: Displays the frequency of theharmonic order previously selected using the
or buttons, instead of order hxx
- Second press: Restores the display of order(hxx or hdC)

21
2.6.3 The Hz Function + Activation of the HOLD Mode
Successive
presses onFunction
short
- Stores and displays the frequency with theRMS value and the DC component, then ona 2nd consecutive page, the crest factor CF
- NOTE: The values displayed are those
measured before the button is pressed

22
3 USE
3.1 INSTALLING THE BATTERIES
Insert the batteries supplied with the device as follows:
1. Using a screwdriver, unscrew the battery compartment cover (item 1)from the back of the housing.
2. Insert the 4x1.5V AA batteries supplied (item 2), observing polarities.
3. Close the battery compartment cover and screw it onto the housing.
Figure 6 : The Battery Compartment
3.2 TURNING THE CLAMP-ON METER ON
With the rotary switch set in the OFF position, turn the switch to thedesired function. The display lights (all symbols) for a few seconds (see§1.3), then the screen of the function chosen is displayed.
The clamp-on meter is now ready to make measurements.
3.3 TURNING THE CLAMP-ON METER OFF
The clamp-on meter can be turned off in two ways:
Manually - Turn the switch to the OFF position.
Automatically - After ten minutes with no activity, the instrument will turnOFF. Thirty (30) seconds before the device is switched off, an audiblesignal sounds intermittently. To re-activate the device, press any buttonor turn the rotary switch.
1
2

23
3.4 CONFIGURATION
As a safety measure, and to avoid repeated overloads on the inputs of the meter,configuration operations should only be performed when the meter isdisconnected from all dangerous voltages.
3.4.1 Auto Power Off
The Auto Power Off feature is enabled by default. To disable it, perform thefollowing:
1. In the OFF position, hold the button down while turning the switchto until the "full screen" display ends and a beep is emitted. Thesymbol is displayed.
2. When the button is released, the device is in the voltmeter functionin the normal mode.
3. To return to Auto Power Off, turn the clamp-on meter OFF and thenback ON again.
3.4.2 Configuring the Current Threshold for True InRush™Measurement
To configure the triggering current threshold of the True InRush™ measurement:
1. In the OFF position, hold the button down while turning the switchto until the "full screen" display ends and a beep is emitted. Thedisplay will indicate the percentage overshoot to apply to the measuredcurrent to determine the measurement triggering threshold.
The value stored by default is 10%, representing 110% of theestablished current measured. The possible values are 5%, 10%, 20%,50%, 70%, 100%, 150%, and 200%.
2. To change the threshold, press the (yellow) button. The valueflashes; each press on the (yellow) button displays the next value.To record the chosen threshold, apply a long press (>2s) on the(yellow) button. A confirmation beep is emitted.
To exit from the configuration mode, turn the switch to another setting. Thechosen threshold is stored and a double beep is emitted.
NOTE: The starting (InRush) current measurement triggering threshold is fixed at1% of the least sensitive range. This value is 1% of 99.99A or 1A. This thresholdis not adjustable.

24
3.4.3 Configuring the Recording Duration
1. In the OFF position, hold the (yellow) button down while turningthe switch to , until the end of the "full screen" display and theemission of a beep, to enter the configuration mode. The display willthen indicate the recording interval.
NOTE: The default value is 60 seconds. Possible values range from 1 second to600 seconds (10 minutes).
2. To change the recording interval, press the (yellow) button. Theright-hand digit blinks. Each press on the (yellow) buttonincrements its value. To go to the next digit, apply a long press (>2s) tothe (yellow) button.
3. When the desired unit is displayed, turn the switch to another setting.The unit chosen is stored and a double beep is emitted.
3.4.4 Erasing Recordings from Memory
To erase a recording from memory, perform the following:
NOTE: Make sure there is no voltage on the input terminals.
1. In the OFF position, hold the (yellow) button down while turning theswitch to .
2. The device emits a beep after erasing the records in memory. The "rSt"and "rEC" symbols are displayed.
3. The device then switches to normal continuity measurement.
3.4.5 Default Configuration
To reset the clamp-on meter to its default parameters (factory configuration):
1. In the OFF position, hold the (yellow) button down while turning theswitch to , until the "full screen" display ends and a beep is emitted.The "rSt" symbol is displayed.
2. After 2 s, the clamp-on meter emits a double beep, then all of the digitalsymbols of the screen are displayed until the (yellow) button isreleased. The default parameters are then restored:
Recording interval = 60 seconds
Continuity detection threshold = 40
True InRush triggering threshold = 10%

25
3.5 VOLTAGE MEASUREMENT (V)
To measure voltage, proceed as follows:
1. Set the switch to .
2. Connect the black lead to the COM terminal and the red lead to the "+"terminal.
3. Connect the test probes or the alligator clips to the circuit to bemeasured. The device selects AC or DC automatically according towhich measured value is larger. The AC or DC symbol displays blinkingin auto detect mode.
To select AC, DC or AC+DC manually, press the (yellow) button to togglebetween them. The symbol corresponding to the choice will then display.
The measured value is displayed:In DC
Display Quantity
1st
row Voltage V RMS
2nd
row DC RIPPLE in %
3rd
row DC voltage component, VDC

26
In AC and AC+DC
Display Quantity
1st row Total RMS voltage V RMS or TRMS
2nd row Crest factor (CF)
3rd row DC voltage component, VDC
3.6 CONTINUITY TEST
Warning: Before performing the test, make sure that the circuit is off and allcapacitors have been discharged.
1. Set the switch to ; the symbol is displayed.
2. Connect the black lead to the COM terminal and the red lead to the "+"terminal.
3. Connect the test probes or the alligator clips to the circuit or componentto be measured.
An audible signal is emitted if there is continuity and the measured value isdisplayed on the screen.

27
3.7 RESISTANCE MEASUREMENT
Warning: Before making a resistance measurement, make sure that the circuit isoff and all capacitors have been discharged.
1. Set the switch to and press the (yellow) button. The symbolis displayed.
2. Connect the black lead to the COM terminal and the red lead to the "+"terminal.
3. Connect the test probes or the alligator clips to the circuit or componentto be measured.
The measured value is displayed on the screen.
3.8 CURRENT MEASUREMENT (A)
The jaws are opened by pressing the trigger on the body of the meter. The arrowon the jaws of the clamp-on meter (see the following diagram) should point in thepresumed direction of current flow, from the generator to the load. Make sure thatthe jaws have closed correctly after clamping around the conductor.
NOTE: The measurement results are optimal when the conductor is centered inthe jaws (aligned with the centering marks).
The device selects AC or DC automatically according to which measured value islarger. The AC or DC symbol displays blinking in auto detect mode.
3.8.1 AC Measurement
For an AC current measurement, proceed as follows:
1. Set the switch to and select AC by pressing the (yellowbutton). The AC symbol is displayed.
2. Clamp the jaws around the conductor to be measured. The deviceselects AC or DC automatically.

28
The measured values are displayed on the screen.
Display Quantity
1st row RMS current A RMS
2nd row Crest factor (CF)
3rd row DC current component ADC
3.8.2 DC or AC+DC Measurement
Set the switch to and select DC if the display does not indicate "0"; the DCzero must be corrected first.
Step 1: Correction of DC Zero
Important: The clamp must not be closed on the conductor during the DC zerocorrection. Hold the clamp in the same position during the whole procedure sothat the correction value will be exact.
Press the button until the device emits a double beep and displays a valuenear "0". The correction value is stored until the clamp is powered down.
NOTE: The correction is effected only if the value displayed is < ±20A, otherwisethe value displayed blinks and is not stored. The clamp must be recalibrated (see§ 5.3)

29
Step 2: Make a Measurement
1. The switch is set to . Select DC or AC+DC by pressing the(yellow) button until the desired choice is reached.
2. Clamp the jaws around the conductor to be measured.
The measured values are displayed:In DC:
Display Quantity
1st row Current A RMS
2nd row DC RIPPLE in %
3rd row DC current component ADC

30
In AC and AC+DC:
Display Quantity
1st row Total RMS current in A RMS or TRMS
2nd row Crest factor (CF)
3rd row DC current component ADC
3.9 STARTING CURRENT OR OVERCURRENT (True InRush™)MEASUREMENT
NOTE: The measurement can be made only in AC or DC mode (AC+DC modedisabled).
To measure a starting current or overcurrent, proceed as follows:
1. Set the switch to , correct the DC zero (see §3.9.2), then clamp thejaws around the conductor to be measured.
2. Perform a long press on the button. The InRh symbol isdisplayed, along with the triggering threshold. The clamp then awaitsdetection of the True InRush™ current. "------" is displayed and the Asymbol flashes.
3. After detection and acquisition for 100 ms, the RMS value of the True
InRush™ current is displayed. Pressing the button will display thePEAK+/PEAK- values subsequently.
4. A long press on the button or a change of function on the rotaryswitch will exit the True InRush™ mode.
NOTE: The triggering threshold in A is 20A if the initial current is zero (starting ofinstallation). For an established current (overload in an installation) see §3.4.2.
Display Quantity
1st row “Inrh”
2nd row True Inrush value in A
3rd row Triggering threshold in A

31
PEAK:
Display Quantity
1st row “Inrh”
2nd row PEAK+ or PEAK- value in A
3rd row Triggering threshold in A

32
3.10 POWER MEASUREMENTS W, VA, VAR AND PF
This measurement is possible in single-phase or in balanced 3-phase.
NOTE: If performing DC or AC+DC power measurements, correct the DC zero incurrent first (see § 3.8.2)
For the power factor (PF) and VA and var, the measurements possible are onlyavailable in AC or AC+DC modes.
3.10.1 Single-Phase Power Measurement
1. Set the switch to and select VA, var, or PF by pressing thebutton until the desired choice is reached.
2. The device automatically displays AC+DC. To select AC, DC, orAC+DC, press the (yellow button) until the desired choice isreached.
3. Connect the black lead to the COM terminal and the red lead to the "+"terminal.
4. Connect the test probes or the alligator clips of the black lead on theneutral (N), then those of the red lead on the L phase.
5. Clamp around only the corresponding conductor, respecting thedirection.
The measurement is displayed on screen.
Display Quantity
1st row Active power W (DC, AC or AC+DC)
2nd row Reactive power var (AC or AC+DC)
3rd row Apparent power VA (AC or AC+DC)
33
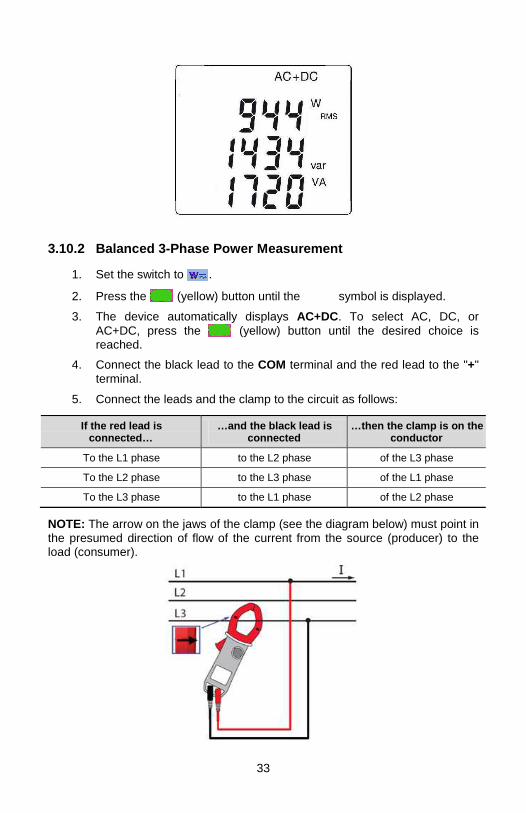
3.10.2 Balanced 3-Phase Power Measurement
1. Set the switch to .
2. Press the (yellow) button until the symbol is displayed.
3. The device automatically displays AC+DC. To select AC, DC, orAC+DC, press the (yellow) button until the desired choice isreached.
4. Connect the black lead to the COM terminal and the red lead to the "+"terminal.
5. Connect the leads and the clamp to the circuit as follows:
If the red lead isconnected…
…and the black lead isconnected
…then the clamp is on theconductor
To the L1 phase to the L2 phase of the L3 phase
To the L2 phase to the L3 phase of the L1 phase
To the L3 phase to the L1 phase of the L2 phase
NOTE: The arrow on the jaws of the clamp (see the diagram below) must point inthe presumed direction of flow of the current from the source (producer) to theload (consumer).

34
The measurement is displayed on screen.
NOTE: 3-phase power on a balanced 4-wire network can also be measured byproceeding in the same way, or by proceeding as for the measurement on asingle-phase network, then multiplying the value by three.
3.10.3 Four Quadrant Diagram
In order to correctly determine the sign of the active and reactive powers, refer tothe diagram below, which determines:
- positive active power (W) = power consumed
- negative active power = power generated
- reactive power (var) and active power of the same sign = inductivepower
- reactive power and active power of opposite signs = capacitive power
ConsumedGenerated

35
3.11 ENERGY METERING MEASUREMENT
The Energy Metering measurement is available in W for the AC and AC+DCquantities.The energy meters start and totalize the various types of energy (the eightenergy meters - 4 meters of energy consumed and 4 meters of energy generated- are started).
To measure the energy metering, proceed as follows:
1. Set the switch to .
2. Press the (long press). Start-up screen 1 in the Energy Meteringmode appears. The display reads “Counting Off”.
3. Connect the black lead to the COM terminal and the red lead to the “+”terminals.
4. Place the test probes or the alligator clips of the black lead on theneutral (N), then those of the red lead on the L phase.
5. Clamp around only the corresponding conductor, respecting thedirection of current flow (see §3.10).
6. To start the metering, press the (yellow) button. The display reads“Counting On".
The metering sequence is as follows:
I- ---> ---> --->II<-------------------------------------|

36
The status of each meter is:- On <=> metering in operation- Off <=> metering stopped (values of the meters 0)- Stop <=> metering stopped (values of the meters preserved)
Hour meter page:
The duration of the metering uses the following format: XXXh (for hours) XXm(for minutes) XXs (for seconds)
NOTE: Beyond 999h 59m 59s "---h--m--s" is displayed, but the internal meteringduration keeps running correctly.
View of the set of screens concerning Energy measurement by short presses onor buttons:
1 : hours (h)
2 : minutes (n)
3 : seconds (s)

37
Conventions:Load designates the consumed energy by the load (W+)Load C designates the capacitive reactive energy (W+ and var-)Load L designates the inductive reactive energy (W+ and var+)Supp designates the energy generated by the load (W-)Supp C designates the capacitive reactive energy (W- and var-)Supp L designates the inductive reactive energy (W- and var+)
7. To access the screens concerning the energies received by the load(« Load side »), press the button to view each screen that has theterm “LoAd at the bottom of the screen.
The sequence of use is as follows:I- Load h W ---> Load L h VAR ---> Load C h VAR ---> Load h VA ---> II <----------------------------------------------------------------------------------------- I
Example of « LOAD side » screen
8. To access the screens concerning the energies generated by the loadand therefore received by the source ("Supply side"), press the
button to view the screens that have the term “SuPP at the bottomof the screen.
The sequence of use is as follows:I - Supp h W ---> Supp L h VAR ---> Supp C h VAR ---> Supp h VA ---> II <------------------------------------------------------------------------------------------- |

38
Example of « SUPP side » screen
The energy displays use the following formats:- [000.1 ; 999.9]- [1.000 k ; 9999 k]- [10.0 M ; 999 M]- [1.00 G ; 999 G]
3.12 FREQUENCY MEASUREMENT (HZ)
The frequency measurement is available in V, W and A for AC and AC+DCmeasurements. The measurement is based on a count of zero crossings(positive-going edges).
3.12.1 Frequency Measurement (V)
To measure the frequency in voltage, proceed as follows:
1. Set the switch to and press the button. The Hz symbol is displayed.
2. Select AC by pressing the (yellow) button until the desired choiceis reached.
3. Connect the black lead to the COM terminal and the red lead to the "+"terminal.
4. Connect the test probes or the alligator clips to the circuit to bemeasured.
The measured value is displayed on the screen.

39
3.12.2 Frequency Measurement (A)
1. Set the switch to and press the button. The Hz symbol isdisplayed.
2. Select AC or AC+DC by pressing the (yellow) button until desiredchoice is reached.
3. Clamp the jaws around the conductor to be measured.
The measured value is displayed on the screen.
3.13 MEASUREMENT OF THE TOTAL HARMONIC DISTORTION(THD) AND DISPLAY OF THE ORDER OF HARMONICS ORDER
The device measures the total harmonic distortion with respect to thefundamental (THDf), the total harmonic distortion with respect to the true RMSvalue of the signal (THDr) in voltage and in current, then the level (with respect tothe fundamental), frequency, and RMS value of each order of harmonic.The frequency of the fundamental is determined by digital filtering and FFT forthe network frequencies of 50, 60, 400, and 800Hz.
3.13.1 Measurement of the THD (V)
1. Set the switch to and press and hold (>2s) the button. TheTHDf, THDr and V RMS symbols are displayed.
2. Connect the black lead to the COM terminal and the red lead to the "+"terminal.
3. Place the test probes or the alligator clips on the terminals of the circuitto be measured.

40
The measurement is displayed on screen.
3.13.2 Measurement of the THD (A)
1. Set the switch to and press and hold (>2s) the button. TheTHDf, THDr and A RMS symbols are displayed.
NOTE: first press the yellow button to place the meter in AC currentmeasurement mode.
2. Apply the clamp to only the conductor concerned.
The measurement is displayed on screen.

41
3.13.3 Display of the Individual Harmonics and of the Frequency ofthe Fundamental From DC to the 25
th.
In the context of measurement of the THDs in voltage (§ 3.13.1) and in current(§ 3.13.2):
1. Press the button. Order “hdC” is displayed (DC component), only inDC or AC+DC. The harmonics of higher orders are displayedsequentially as the button is pressed repeatedly. The buttoncan be pressed to return to the previous order.
2. The button can be pressed to display the frequency of the order ofharmonic concerned.
42
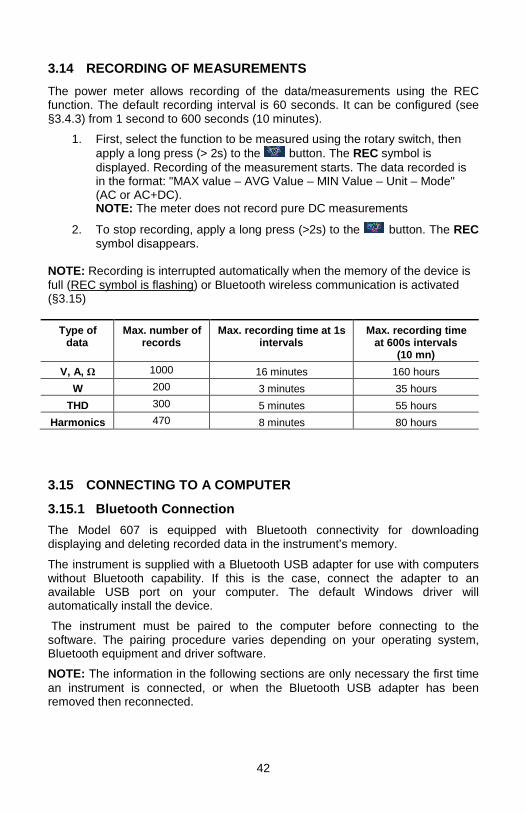
3.14 RECORDING OF MEASUREMENTS
The power meter allows recording of the data/measurements using the RECfunction. The default recording interval is 60 seconds. It can be configured (see§3.4.3) from 1 second to 600 seconds (10 minutes).
1. First, select the function to be measured using the rotary switch, thenapply a long press (> 2s) to the button. The REC symbol isdisplayed. Recording of the measurement starts. The data recorded isin the format: "MAX value – AVG Value – MIN Value – Unit – Mode"(AC or AC+DC).NOTE: The meter does not record pure DC measurements
2. To stop recording, apply a long press (>2s) to the button. The RECsymbol disappears.
NOTE: Recording is interrupted automatically when the memory of the device isfull (REC symbol is flashing) or Bluetooth wireless communication is activated(§3.15)
Type ofdata
Max. number ofrecords
Max. recording time at 1sintervals
Max. recording timeat 600s intervals
(10 mn)
V, A, Ω 1000 16 minutes 160 hours
W 200 3 minutes 35 hours
THD 300 5 minutes 55 hours
Harmonics 470 8 minutes 80 hours
3.15 CONNECTING TO A COMPUTER
3.15.1 Bluetooth Connection
The Model 607 is equipped with Bluetooth connectivity for downloadingdisplaying and deleting recorded data in the instrument’s memory.
The instrument is supplied with a Bluetooth USB adapter for use with computerswithout Bluetooth capability. If this is the case, connect the adapter to anavailable USB port on your computer. The default Windows driver willautomatically install the device.
The instrument must be paired to the computer before connecting to thesoftware. The pairing procedure varies depending on your operating system,Bluetooth equipment and driver software.
NOTE: The information in the following sections are only necessary the first timean instrument is connected, or when the Bluetooth USB adapter has beenremoved then reconnected.

43
3.15.2 Pairing the Instrument to the Computer
3.15.2.1 Pairing Using Windows Vista/Windows 7
1. In the active measurement function, press the and buttons
simultaneously. The symbol will appear in the upper right corner ofthe display.
2. Connect the supplied Bluetooth USB Adapter into an available USBport. Windows will install any necessary drivers automatically.
3. A Bluetooth symbol, similar to this , will appear in the system tray atthe bottom of your screen once the driver is installed.
4. Right click on the icon and select “Add a Device”.
5. In the “Add a Device” window, select the instrument you wish to connectto and select “Next”.
6 7
0
44
NOTE: Depending on the Bluetooth setup and operating system, it may benecessary to enter a passkey to finalize the instrument connection. If so, thedefault passkey is: 0000.
1. If asked for a pairing code select the “Enter the Device’s pairingcode”.
2. Enter the pairing code as shown below and select “Next”

45
3. Once the instrument has been successfully added to the computer, awindow similar to the one below will be displayed. Select “Close”.
4. You should see the Device listed in the Bluetooth devices window.

46
1. Launch the Dataview®
Control Panel using the icon placed on thedesktop during software installation. Refer to section 3.22 for DataView
®
software installation. The instrument should automatically connect ifonly one power meter is paired. If more than one instrument is paired,select the instrument you wish to connect to from the drop-down list inthe connection window.
2. Selecting OK will establish the connection between the power meterand the DataView
®software. It is now possible to view the instrument
status and downloaded data. If data is present in the instrument’smemory, the software will automatically start downloading onceconnected.
3.15.2.2 Pairing using Windows XP
1. In the active measurement function, press the and buttons
simultaneously. The symbol will appear in the upper right corner ofthe display.
2. Connect the supplied Bluetooth USB Adapter into an available USBport. Windows will install any necessary drivers automatically.
3. From the “Start” menu select Settings > Control Panel > Bluetoothdevices.

47
4. In the “Bluetooth Devices” window select “Add…”.

48
5. In the “Add Bluetooth Device Wizard” window, check the box next to“My device is set up and ready to be found”, then select “Next”.
6. The computer will search for any available Bluetooth equipment to pairwith. Once the software locates the instrument, select the device youwish to pair with and select “Next”.
607

49
7. When prompted for a passkey, select “Let me choose my ownpasskey” and enter the default code 0000.
8. When the computer is finished pairing with the instrument, a windowindicating its success will be displayed. The computer is now set up tocommunicate via Bluetooth. Select “Finish” to close the window.
9. Launch the DataView®
Control Panel using the icon placed on thedesktop during the Dataview
®software installation. Refer to section 3.22
for DataView®
software installation. The power meter shouldautomatically connect if only one instrument is paired. If more than oneinstrument is paired, select the instrument you wish to connect to fromthe drop-down list in the connection window.
10. Selecting OK will establish the connection between the power meterand the DataView
®software. It is now possible to view the instrument
status and downloaded data. If data is present in the instrumentsmemory then the software will automatically start downloading onceconnected.
3.16 TURNING BLUETOOTH ON/OFF
The Bluetooth can only be turned on or off when the instrument is not recording.
To enable the Bluetooth press the and keys simultaneously. Thesymbol should be displayed in the upper right corner of the display. To disable
Bluetooth press the and keys simultaneously the symbol will turn off.

50
3.18 RECORDING DATA
3.17.1 Starting a Recording Session
NOTE: A new recording cannot be started if the memory is full or if the Bluetoothis active.
1. Configure the instrument as described in section 3.4.
2. Select the measurement function to be recorded using the rotary switchand connect the instrument to the measurement source
3. Press the REC button for >2s to start a recording.
4. The REC indication will remain solid when there is available memory orit will blink if the memory is full.
5. If the memory is partially full then it is possible to start anotherrecording. The duration of the recording will depend on the availablememory.
3.17.2 Stopping a Recording Session
1. Press and hold the REC button for >2s
2. The REC indication will not be displayed if a recording is not active.
3.18 DOWNLOADING RECORDED DATA
Recorded measurements stored in the instrument are transferred to a computervia the download command in the DataView
®Control Panel.
3.19 ERASING DATA FROM MEMORY
Erasing data from the instrument’s memory can be performed in two ways.
Erasing the Memory using the YELLOW button and rotary
switch:
1. Turn the instrument “OFF”.
2. Press and hold the YELLOW button while rotating the rotary switch tothe “” position.
3. Release the YELLOW button when RST REC is displayed to erase thememory.
Erasing the Memory using the DataView®
Control Panel:
1. Connect the instrument to the computer and launch the Power ClampMeter Control Panel.
2. Select View Recorded Data from the Instrument menu.
3. In the “Recorded Data in Instrument” window select the “Select All”button and click on “Delete All” to erase the memory.

51
3.20 DATA STORAGE
The Model 607 captures Trend measurements at a user specified interval.
The approximate number of data points that can be recorded with the memorycleared
3.20.1 Trend Measurements
The Model 607 stores the measurement of each of the inputs. In addition, theuser can define the storage rate and type of measurement.
3.20.2 Recording with Memory Cleared
When a recording starts, the power meter will continue to record until one of thefollowing occurs:
• The memory becomes full.
• A manual press of the REC button for >2s is performed.
• The battery voltage is not sufficient to keep the instrument powered.
3.20.3 Recording with a Partial or Full Memory
It is possible to have more than one recording provided there is sufficientmemory. The duration of the additional recording will depend on the sample rateof the recording, amount of memory left and type of recording.
3.20.4 Memory Filled During Recording Session
If the memory becomes full, the REC indication on the display will blink. It will benecessary to download and erase the memory before a new recording can bestarted.
3.21 SOFTWARE INSTALLATION
3.21.1 Installing DataView®
Minimum Computer Requirements:
• Windows XP / Windows Vista & Windows 7 (32/64 bit)
• 256MB of RAM for Windows XP
• 1GB of RAM for Windows Vista & Windows 7 (32 bit)
• 2GB or RAM for Windows Vista & Windows 7 (64 bit)
• 80MB of hard disk space (200MB recommended)
• USB port
Windows is a registered trademark of Microsoft Corporation in the United States and other countries.

52
USB Flash Drive Install
1. Insert the USB stick into an available USB port (wait for driver to beinstalled).
2. If Autorun is enabled then an AutoPlay window should appear as shown.).
3. A Set-up window will appear.
NOTE: If Autorun is disabled, it will be necessary to open Windows Explorer,then locate and open the USB stick drive labeled “DataView” to view the files onthe drive.
4. In the AutoPlay window, select “Open folder to view files”.
5. Double-click on Setup.exe from the opened folder view to launch theDataView setup program. A Set-up window, similar to the one below, willappear.
There are several different options to choose from. Some options(*) require aninternet connection.
• DataView, Version x.xx.xxxx - Installs DataView®
onto the PC.
• *Adobe Reader - Links to the Adobe®
website to download themost recent version of Adobe
®Reader to the computer. Adobe
®
Reader is required for viewing PDF documents supplied withDataView
®.
• *DataView Updates - Links to the online DataView®
softwareupdates to check for new software version releases.
• *Firmware Upgrades - Links to the online firmware updates tocheck for new firmware version releases.
• Documents - Shows a list of instrument related documents thatyou can view. Adobe
®Reader is required for viewing PDF
documents supplied with DataView®.

53
6. DataView, Version x.xx.xxxx option should be selected by default.Select the desired language and then click on Install.
7. The Installation Wizard window will appear. Click Next.
8. To proceed, accept the terms of the license agreement and click Next.
9. In the Customer Information window, enter a Name and Company, thenclick Next.
10. In the Setup Type window that appears, select the “Complete” radiobutton option, then click Next.
11. In the Select Features window that appears, select the instrument’scontrol panel that you want to install, then click Next.
NOTE: The PDF-XChange option must be selected to be able to generate PDFreports from within DataView
®.
12. In the Ready to Install the Program window, click on Install.
13. If the instrument selected for installation requires the use of a USB port,a warning box will appear, similar to below. Click OK.
407 and 607
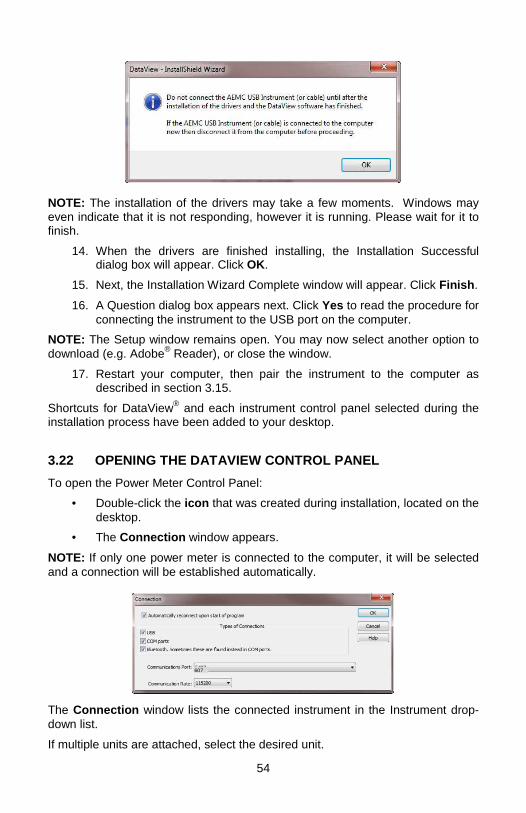
NOTE: The installation of the drivers may take a few moments. Windows mayeven indicate that it is not responding, however it is running. Please wait for it tofinish.
14. When the drivers are finished installing, the Installation Successfuldialog box will appear. Click OK.
15. Next, the Installation Wizard Complete window will appear. Click Finish.
16. A Question dialog box appears next. Click Yes to read the procedure forconnecting the instrument to the USB port on the computer.
NOTE: The Setup window remains open. You may now select another option todownload (e.g. Adobe
®Reader), or close the window.
17. Restart your computer, then pair the instrument to the computer asdescribed in section 3.15.
Shortcuts for DataView®
and each instrument control panel selected during theinstallation process have been added to your desktop.
3.22 OPENING THE DATAVIEW CONTROL PANEL
To open the Power Meter Control Panel:
• Double-click the icon that was created during installation, located on thedesktop.
• The Connection window appears.
NOTE: If only one power meter is connected to the computer, it will be selectedand a connection will be established automatically.
The Connection window lisdown list.
If multiple units are attached
607
54
ts the connected instrument in the Instrument drop-
, select the desired unit.

Once the desired instrument has been selected, click OK and the Control Panelwill attempt to connect to the instrument and download any data.
NOTE: The default layout can be changed by moving and resizing each window.
3.23 USING THE CONTROL PANEL
The Control Panel is used to view the instrument status, download, view anderase the memory. It is also used to generate reports in DataView
®and export
the recorded data into an excel format.
To open the Control Panel, either click on the Control Panel option fromDataView’s Instrument menu or select the control panel icon placed on thedesktop during the installation.
The
File
607
m
•
•
•
•
•
•
•
•
•
7
6055
ain menu at the top of the screen lists the following commands:
Open
Save As
Create DataView Report
Create Spreadsheet
Edit Session Properties
Print - prints the selected real-time window.
Print Preview - provides a preview of the real-time window to beprinted.
Print Setup - displays a Print Setup window allowing you to select adestination printer and change various printing options.
Exit - closes the control panel.

56
View
• Trend – N/A
• Waveform – N/A
• Harmonic – N/A
• Power – N/A
• Toolbar – Basic<>Advanced – Displays or hides the toolbar iconscommonly used or shows all icons
• Status Bar – Shows the toolbar at the bottom of the control panelwindow which displays connection status
• Status Screen – Opens a window that displays the instrument status
Instrument
• Connect - establishes a connection.
• Disconnect - closes a connection.
• Configure – N/A
• View Recorded Data – Open a window to display the recordingspresent in the instrument.
• Download All Recorded Data – Downloads the instruments memory tothe PC
• Set Clock – N/A
Tools
• Colors - allows the user to specify the default colors to be assigned tograph traces associated with specific trend measurements and changethe graph background color.
• Options - allows the user to specify default parameters when displayingdata.
• Recover Data - allows the user to load an instrument specific .icp file.

57
Window
• Cascade - arrange all windows into a stack, with each window offsetslightly.
• Tile - display all windows equally sized without overlapping.
• Load Layout - Loads a user saved layout
• Save Layout – Allows the user to save a custom layout for later use.
• Restore Default Layout – Arranges the windows to a default layout.
NOTE: In addition, a list of open real-time windows is displayed at the bottom ofthe Window menu. Selecting one of these options will activate the associatedreal-time window. This is useful when other windows hide a desired window.
Help
• Help topics - display the main Control Panel help topic.
• Help About - displays the About dialog box.
3.24 DISPLAYING REAL-TIME STATUS INFORMATION
Downloaded data and instrument status is displayed in the Control Panel.
Figure 4-10
Recorded Data from the Instrument
Status:
• Connection - shows if instrument is connected/disconnected
• Model - instrument’s model identification number
• Communication – shows connection type and baud rate
• ID – displays the Model, Serial #, Firmware and Hardware Version
607

58
3.25 RESIZING AND SAVING REAL-TIME WINDOW LAYOUTS
The windows can also be resized and arranged to suit your needs by using themouse pointer. To move a window, simply click and hold on the title bar, thendrag to the desired location. To resize a window, click and drag the corner of thewindow.
Once you have all of your windows in a desired location, you can save yourlayout for future use.
To Save a Layout:
• Go to Window > Save Layout. Type in a name for the layout and selectthe folder that you wish to save it in. Click on Save.
To Load a Layout:
• Go to Window > Load Layout. Locate and select a previously savedlayout file. Click on Open.
3.26 DOWNLOADING RECORDED INSTRUMENT DATA
Recorded measurements stored in the instrument are transferred to a computervia the download command in the Control Panel. Assuming a recording sessionhas been started and stopped, the instrument should have at least one recordedmeasurement inside it.
To Download a Recording:
• Select Download All Recorded Data from the Instrument menu. Thisbegins the transfer of recorded data to the computer. A windowdisplaying the transfer progress will be displayed.
• Once the transfer is complete, a Date/Time window appears. Enter theDate and start time of the recording. Note: This can be changed at alater time using the Recording Parameter button in the viewed datawindow.

59
• Once a Date/Time is written, the Recorded Data in Instrument windowwill display the recording. To display the data in a graph or list format,select the desired recording and select View.
• From the “View” window you can select what to view using the radiobuttons and view the data in a list format by selecting the “View as List”checkbox. There are other options to Print the data directly, export toexcel or Create a Dataview report.
• The Start Date and Time of the recording can also be modified
using the Recording Parameters button.

3.27 POWER CLAMP METER TEMPLATE
Refer to the DataView®
Help files for detailed information about using thetemplates.
607 Template
The Trend Summary Report template generates a view with a worksheet foreach recorded parameter and a cover page.
You can move between the worksheets by selecting the desired worksheet fromthe worksheet tabs at the bottom of the view (just above the status bar).
The first worksheet is the Cover Sheet and provides information about therecording session. The following illustrates the Cover Sheet:
607
60
607

61
The Cover Sheet is used as a cover sheet for the report and contains thefollowing frames:
• Text Box - containing the text “Trend Summary Report”.
• Session Summary - containing the name of the database used togenerate the report.
• Session Summary - containing operator information.
• Session Summary - containing test site information.
• Session Summary - containing operator comments.
• OLE - containing the AEMC®
Instruments logo.
Using the associated properties window customizes each of these frames. Theproperties window for a frame is displayed by selecting the frame, then selectingthe Properties command from the Frame menu.
The next few worksheets are used to view the recorded trend channels andcontains the following frames:
• Channel List
• Channel Graph
• Trend Summary
• Meter
The following figure illustrates the Trend List worksheet.

62
Channel Graph Frame
A Channel Graph frame provides a graphical look into the database it is attachedto. The database is attached to the Trend Graph frame when it is created. Thiscan be done manually by placing a graph frame or automatically when using atemplate.
The graph frame provides additional tools for viewing the underlying database.These tools provide zoom and pan operations. In addition, individual traces andwaveform snapshots can be selected using the Select Frame tool.
Normally, the Select Frame tool is used to select a frame for modification. Inaddition to selecting the Graph frame, this tool is used to select individual traces.A trace is selected if any part of it is drawn within a few screen pixels of wherethe selection tool is when the left mouse button is pressed.
When a trace is selected, handles similar to those of the frame handles aredrawn over the trace. If more than one trace is drawn within the proximity of theselection tool, when clicked again, the next trace will be selected. This willcontinue until all traces within the selection tools proximity have been selected.

63
At which point, clicking the left mouse button again will select the first trace andthe process will repeat.
Frames can be linked together so that when you select a trace or line in oneframe another frame shows additional information about the selection. Forexample when selecting a trace in the graph the trend summary list will beupdated to list the sample points for the selected trace.
Linking frames can create a complex interaction between frames. For additionalinformation refer to the DataView
®users guide accessible from the help menu of
the main DataView®
application.
This template contains the following linked frame types:
Session Summary
Channel List
Meter
Trend Summary List
The channels selected for display and the display properties can be changed atany time using the Channel Graph Properties window. The Channel GraphProperties window can be displayed by right-clicking the mouse pointer whilepositioned over the Graph frame, then selecting Properties from the pop-upmenu.
The display extents of the Channel Graph frame can be changed by using zoomand pan operations. By zooming and panning you change the starting andending times of the displayed data. By changing the starting and ending displaytimes, you can zoom in, zoom out, pan left and right, pan to start and pan to theend of the measurement data.
To change the display extents of a graph frame, select the frame using either the
frame selection tool or Zoom Tool . Next, use a zoom or pancommand from the Zoom menu, or from the toolbar. By clicking and dragging theZoom Tool across the desired area of the graph, you can select an area to zoomin on.
Channel List Frame
The Channel List frame is a frame attached to either a Channel Graph or Micro-Graph frame. In the case of this template, the parent is a Channel Graph frame.The Channel List frame displays a textual list summary of the channels availablein the recording. Each summary line contains user-specified parameters of aspecific channel recording.
You can specify the displayed parameters and general display options using theChannel List Properties dialog box.
You can step between list entries. Selecting Pan To Start, displays the first listentry. Selecting Pan To End, displays the last list entry. Selecting the Step Rightor Step Left, displays the next or previous list entry. When stepping through the

64
list entries, the selection will move from each entry for the associated channel.
In addition to stepping through the list with the tool bar, you can select a specificentry listed using the mouse pointer. The text for the selected entry will behighlighted, indicating which entry in the list is currently selected.
Session Summary Frame
The Session Summary frame is a frame attached to the Channel Graph frame.This frame displays a textual summary of its parent frame. You can customizethe summary text displayed, using the Session Summary Properties dialogbox. This dialog box is displayed by right-clicking on the frame and selectingProperties from the pop-up menu, or by double-clicking on the frame.
The Trend template contains Session Summary frames displaying the followinginformation:
• Start time and duration of the recorded data and the instrument’sidentification codes. This frame is in the upper right corner of the firstworksheet.
• Database containing the file name and location of the recording data
• Operator information
• Test site information
• Operator comments
The text displayed in the session summary frames is static as long as the datawithin the associated database remains static. Session Summary frames do notprovide the interactive operations available in the Channel Graph and TrendSummary List frames.
Meter Frame
The Meter frame is a frame linked to the Channel Graph frame. The Meter framedisplays the values of samples at a specific location on the graph. Left-clicking onthe graph displays a black vertical bar. The sample values displayed in the meterframe are associated with the time at the location of this vertical bar. Left-clickingat other areas of the graph will move the vertical bar and update the Meter frameaccordingly.
Text Box Frame
A Text Box frame displays text at a given location on the page. The text withinthe frame is static, in that it does not change. It only changes when you changeit. This template contains a Text Box located at the top of the worksheet. The textdisplayed within this frame is the title of this report (Trend Summary Report). Thetext, font and other frame properties can be changed using the Text BoxProperties dialog box.

65
4 SPECIFICATIONS
4.1 REFERENCE CONDITIONS
Quantities of Influence Reference Conditions
Temperature: 23°C ±2°C
Relative humidity: 45% to 75%
Supply voltage: 6.0V ±0.5V
Frequency range of the applied signal: 45 to 65Hz
Sine wave: pure
Peak factor of the applied alternating signal: √2
Position of the conductor in the clamp: centered
Adjacent conductors: none
Alternating magnetic field: none
Electric field: none
4.2 SPECIFICATIONS UNDER THE REFERENCE CONDITIONS
Accuracy is expressed in ± (x% of the reading (R) + y counts (ct)).
4.2.1 DC Voltage Measurement
Measurement Range 0.00 to 99.99V 100.0 to 999.9V 1000V (1)
Specified MeasurementRange
0 to 100% of the measurement range
Accuracy
0.00 to 9.99V± (1% R +10cts)10.00 to 99.99V± (1% R +3cts)
± (1% R +3cts)
Resolution 0.01V 0.1V 1V
Input Impedance 10M
Note (1) Above 1000V, a repetitive beep indicates that the voltage beingmeasured is greater than the safety voltage for which the device isguaranteed. The display indicates "OL".

66
4.2.2 AC Voltage Measurement
MeasurementRange
0.15 to99.99V
100.0 to999.9V
1000V RMS1400V peak (1)
SpecifiedMeasurementRange (2)
0 to 100% of the measurement range
Accuracy
0.15 to 9.99V± (1% R +10cts)10.00 to 99.99V± (1% R +3cts)
± (1% R +3cts)
Resolution 0.01V 0.1V 1V
Input Impedance 10M
Note (1) Above 1000V (RMS), a repetitive beep indicates that the voltagebeing measured is greater than the safety voltage for which thedevice is guaranteed. The display indicates "OL".- Bandwidth in AC = 3 kHz
Note (2) Any value between zero and the min. threshold of the measurementrange (0.15V) is forced to show "----" on the display.
Specific Specifications in MAX/MIN mode (from 10Hz to 1kHz, and from0.30V in AC):
Accuracy: add 1% R to the values of the table above.
Capture of the extreme: approximately 100ms.
4.2.3 AC+DC Voltage Measurement
Measurement Range (2)0.15 to99.99V
100.0 to999.9V
1000V RMS (1)1400V peak
Specified MeasurementRange
0 to 100% of the measurement range
Accuracy 0.15 to 9.99V± (1% R +10cts)
10 to 99.99V± (1% R +3cts)
± (1% R +3cts)
Resolution 0.01V 0.1V 1VInput impedance 10M
Note (1) The display indicates "OL" above 1000V (1400V in PEAK mode).Above 1000V (DC or RMS), a repetitive beep indicates that thevoltage being measured is greater than the safety voltage for whichthe device is guaranteed.- Bandwidth in AC = 3 kHz
Note (2) Any value between zero and the min. threshold of the measurementrange (0.15V) is forced to "----" on the display.

67
Specific Specifications in MAX/MIN mode in Voltage(from 10Hz to 1kHz in AC and AC+DC):
Accuracy: add 1% R to the values of the previous table.
Capture of the extreme: approximately 100ms.
Specific Specifications in PEAK mode in voltage(from 10Hz to 1kHz in AC and AC+DC):
Accuracy: add 1.5% R to the values in the previous table.
PEAK capture time: 1ms min. to 1.5ms max.
4.2.4 DC Current Measurement
MeasurementRange (2)
0.00 to99.99A
100.0 to999.9A
1000 to3000A (1)
SpecifiedMeasurementRange
0 to 100% of the measurement range
Accuracy (2)(zero corrected)
± (1% R +10cts) ± (1% R +3cts)
2000A± (1.5% R +3 pt)2000 to 2500ADC
± (2.5% R +3 pt)2500 to 3000ADC
± (3.5% R +3 pt)Resolution 0.01A 0.1A 1A
Note (1) The display indicates “+OL” above 3000A.
Note (2) The residual current at zero depends on the remanence. It can becorrected by the “DC zero” function of the HOLD button.
4.2.5 AC Current Measurement
MeasurementRange (2)
0.15 to99.99A
100.0 to999.9A
1000 to2000A (1)
SpecifiedMeasurementRange
0 to 100% of the measurement range
Accuracy ± (1% R +10cts) ± (1% R +3cts)
1000 to 1500A± (1.5% R +3cts)1500 to 2000A± (2% R +5cts)
Resolution 0.01A 0.1A 1A
Note (1) The display indicates "OL" above 3000A (in PEAK mode). The "-" and"+" signs are not managed.- Bandwidth in AC = 1 kHz
Note (2) In AC, any value between zero and the min. threshold of themeasurement range (0.15A) is forced to show “----“ on the display.
- Residual current at zero <150mA.

68
4.2.6 AC+DC Intensity Measurement
MeasurementRange (2)
0.15 to99.99A
100.0 to999.9A
AC: 1000 to 2000ADC or PEAK:
1000 to 3000A (1)SpecifiedMeasurementRange
0 to 100% of the measurement range
Accuracy (2)(zero corrected)
± (1% R +10cts) ± (1% R +3cts)
2000A± (1.5% R +3cts)2000 to 2500ADC
± (2.5% R +3cts)2500 to 3000ADC
± (3.5% R +3cts)Resolution 0.01A 0.1A 1A
Note (1) The display indicates "+OL" above 3000A (in PEAK mode). The "-"and "+" signs are not managed.- Bandwidth in AC = 1 kHz
Note (2) In AC, any value between zero and the min. threshold of themeasurement range (0.15A) is forced to show "----" on the display.- Residual current at zero:- In DC: depends on the remanence. This can be corrected by the
"DC zero" function of the HOLD button- In AC: <150mA
Specific Specifications in MAX/MIN mode(from 10Hz to 1kHz in AC and AC+DC):
Accuracy: add 1% R to the values of the table above.
Capture of the extreme: approximately 100ms.
Specific characteristics in PEAK mode in current(from 10Hz to 1kHz in AC and AC+DC):
Accuracy: add 1.5% R to the values in the tables above.
PEAK capture time: 1ms min. to 1.5ms max.
4.2.7 True Inrush™ Measurement
Measurement Range 20 to 2000AAC 20 to 3000ADC
Specified Measurement Range 0 to 100% of the measurement rangeAccuracy ± (5% R +5cts)Resolution 1A
Specific Specifications in PEAK mode in True InRush™(from 10Hz to 1kHz in AC):
Accuracy: add ± (1.5% R +0.5A) to the values in the table above.
PEAK capture time: 1ms min. to 1.5ms max.

69
4.2.8 Calculation of the crest factor (CF)
Measurement range 1.00 to 3.50 3.51 to 5.99 6.00 to 10.00SpecifiedMeasurement Range(from 5V or 5A)
0 to 100% of the measurement range
Accuracy (zerocorrected in ADC)
± (2% R +2cts) ± (5% R +2cts) ± (10% R +2cts)
Resolution 1ct
NOTE: Peak values limited to 1500V or 3000A
4.2.9 Calculation of the RIPPLE in DC
Measurement range 0.1 to 99.9% 100.0 to 1000%Specified MeasurementRange (from 3ADC and2VDC)
2 to 100% of themeasurement range
0 to 100% of themeasurement range
Accuracy ± (5% R +10cts)Resolution 0.1
NOTE: If one of the terms for the calculation of the RIPPLE is displayed as "OL",or forced to zero, the RIPPLE displayed is an indeterminate value, "----".
4.2.10 Continuity Measurement
Measurement Range 0.0 to 999.9
Open-circuit Voltage 3.6VMeasurement Current 550µAAccuracy ± (1% R +3cts)
Buzzer Triggering Threshold 40
4.2.11 Resistance Measurement
Measurement Range (1)0.0 to
999.91000 to9999
10.00 to99.99k
Specified MeasurementRange
1 to 100% of themeasurement range
0 to 100% of themeasurement range
Accuracy ± (1% R +3cts)
Resolution 0.1 1 10
Open-circuit Voltage 3.6VMeasurement Current 550µA 100µA 10µA
Note (1) Above the maximum display value, the display unit indicates "OL".The "-" and "+" signs are not managed.

70
Specific Specifications in MAX/MIN mode:
Accuracy: add 1% R to the values of the previous table
Capture of the extreme: approximately 100ms.
4.2.12 Active DC Power Measurements
MeasurementRange (2)
0 to9999W
10.00 to99.99kW
100.0 to999.9kW
1000 to3000kW (1)
SpecifiedMeasurementRange
1 to 100% of themeasurement range
0 to 100% of themeasurement range
Accuracy (3) 1000A± (2% R +10cts)1000 to 2000A
± (2.5% R +10cts)2000 to 2500ADC
± (3.5% R +10cts)2500 to 3000ADC
± (4.5% R +10cts)
1000A± (2% R +3cts)1000 to 2000A
± (2.5% R +3cts)2000 to 2500ADC:
± (3.5% R +3cts)2500 to 3000ADC:
± (4.5% R +3cts)Resolution 1W 10W 100W 1000W
Note (1) - Display of OL or ± OL- Above 3000kW in single-phase (1000V x 3000A).
Note (2) Any applied voltage greater than 1000V causes the emission of anintermittent alarm beep to report a dangerous overload.
Note (3) The measurement result may be affected by an instability linked to thecurrent measurement (approximately 0.1A).
Example: For a power measurement made at 10A, the instability of themeasurement will be 0.1A/10A or 1%.
4.2.13 Active AC Power Measurements
MeasurementRange (2) (4)
5 to9999W
10.00 to99.99kW
100.0 to999.9kW
1000kW (1)
SpecifiedMeasurementRange
1 to 100% of themeasurement
range
0 to 100%of the measurement range
Accuracy (3)1000A
± (2% R +10cts)1000A
± (2% R +3cts)Resolution 1W 10W 100W 1000W
Note (1) - Display of OL above 2000kW in single-phase (1000V x 3000A).- Bandwidth in AC in voltage = 3 kHz, in current = 1 kHz
Notes (2) and (3) of the previous § apply.

71
Note (4) Any power measured less than 5W is regarded as zero and causes thedisplay of dashes "----"If the voltage is less than 0.15V or if the current is less than 0.15A, thepower measured is regarded as zero and causes the display of "----"
Note 5 The active powers are positive for power consumed and negative forpower generated.
Note 6 The signs of the active and reactive powers and power factor aredefined by the four-quadrant rule:The diagram below sums up the signs of the power as a function of thephase angle between V and I:
Quadrant 1: Active power P sign + (power consumed)
Quadrant 2: Active power P sign - (power generated)
Quadrant 3: Active power P sign - (power generated)
Quadrant 4: Active power P sign + (power consumed)
Note (7) In balanced three-phases, with deformed signals (THD andharmonics), uncertainties are guaranteed since Ф > 30°. Additional errors are following, depending of THD:
Add +1% for 10% < THD < 20%
Add +3% for 20% < THD < 30%
Add +5% for 30% < THD < 40%
ConsumedGenerated

72
4.2.14 Active AC+DC Power Measurements
MeasurementRange (2) (4)
5 to9999W
10.00 to99.99kW
100.0 to999.9kW
1000 to3000kW (1)
SpecifiedMeasurementRange
1 to 100% of themeasurement range
0 to 100% of the measurement range
Accuracy (3) 1000A± (2% R +10cts)1000 to 2000A
± (2.5% R +10cts)2000 to 2500ADC
± (3.5% R +10cts)2500 to 3000ADC
± (4.5% R +10cts)
1000A± (2% R +3cts)1000 to 2000A
± (2.5% R +3cts)2000 to 2500ADC
± (3.5% R +3cts)2500 to 3000ADC
± (4.5% R +3cts)Resolution 1W 10W 100W 1000W
Note (1) - Display of OL above 3000kW in single-phase (1000V x 3000A)- Bandwidth in AC in voltage = 3 kHz, in current = 1 kHz
Notes (2), (3), (4), (5) (6) and (7) of the previous § apply
4.2.15 Measurement of Apparent AC Power
MeasurementRange (2) (4)
5VA to9999VA
10.00kVAto
99.99kVA
100.0kVAto
999.9kVA
1000 kVAto
2000 kVA (1)SpecifiedMeasurementRange
1 to 100% of themeasurement range
0 to 100%of the measurement range
Accuracy (3) 1000A± (2% R +10cts)1000 to 2000A
± (2.5% R +10cts)
1000A± (2% R +3cts)1000 to 2000A
± (2.5% R +3cts)Resolution 1VA 10VA 100VA 1000VA
Note (1) - Display of O.L above 2000 kVA in single-phase (1000V x 2000A).- Bandwidth in AC in voltage = 3 kHz, in current = 1 kHz
Notes (2), (3) and (4) of the previous § apply

73
4.2.16 Measurement of Apparent AC+DC Power
MeasurementRange (2) (4)
5 to9999VA
10.00 to99.99kVA
100.0 to999.9kVA
1000 to3000kVA (1)
SpecifiedMeasurementRange
1 to 100% of themeasurement range
0 to 100%of the measurement range
Accuracy (3) 1000A± (2% R +10cts)1000 to 2000A
± (2.5% R +10cts)2000 to 2500ADC
± (3.5% R +10cts)2500 to 3000ADC
± (4.5% R +10cts)
1000A± (2% R +3cts)1000 to 2000A
± (2.5% R +3cts)2000 to 2500ADC
± (3.5% R + 3cts)2500 to 3000ADC
± (4.5% R + 3cts)Resolution 1VA 10VA 100VA 1000VA
Note (1) - Display of OL above 3000 kVA in single-phase (1000V x 3000A).- Bandwidth in AC in voltage = 3 kHz, in current = 1 kHz
Notes (2), (3) and (4) of the previous § apply
4.2.17 Measurement of Reactive AC Power
MeasurementRange (2) (4)
5 to9999 var
10.00 to99.99 kvar
100.0 to999.9 kvar
1000 to2000 kvar (1)
SpecifiedMeasurementRange
1 to 100% of themeasurement range
0 to 100%of the measurement range
Accuracy(3) (7)
1000A± (2% R +10cts)1000 to 2000A
± (2.5% R +10cts)
1000A± (2% R +3cts)1000 to 2000A
± (2.5% R +3cts)Resolution 1 var 10 var 100 var 1 kvar
Note (1) - Display of OL above 2000 kvar in single-phase (1000V x 2000A).- Bandwidth in AC in voltage = 3 kHz, in current = 1 kHz
Notes (2), (3) and (4) of the previous § apply
Note 5 In single-phase, the sign of the reactive power is determined by thephase lead or lag between the V and I signs, while in balanced three-phase, it is determined by the calculation on the samples.
Note 6 - Signs of reactive powers according to the four-quadrant rule (§4.2.12):Quadrant 1: Reactive power Q sign +Quadrant 2: Reactive power Q sign +Quadrant 3: Reactive power Q sign -Quadrant 4: Reactive power Q sign –
Note (7) Measurement stabilization ~8 sec

74
4.2.18 Measurement of Reactive AC+DC Power
MeasurementRange (2) (4)
5 to9999 var
10.00 to99.99 kvar
100.0 to999.9 kvar
1000 to3000 kvar
(1)SpecifiedMeasurementRange
1 to 100% of themeasurement range
0 to 100% of the measurement range
Accuracy (3)(7)
1000A± (2% R +10cts)1000 to 2000A
± (2.5% R +10cts)2000 to 2500ADC
± (3.5% R+10cts)2500 to 3000ADC
± (4.5% R+10cts)
1000A± (2% R +3cts)1000 to 2000A
± (2.5% R +3cts)2000 to 2500ADC
± (3.5% R+3cts)2500 to 3000ADC
± (4.5% R+3cts)Resolution 1 var 10 var 100 var 1 kvar
Note (1) - Display of OL above 3000 kvar in single-phase (1000V x 3000A).- Bandwidth in AC in voltage = 3 kHz, in current = 1 kHz
Notes (2), (3) , (4), (5), (6) and (7) of the previous § apply
Specific characteristics in MAX/MIN mode in power(from 10Hz to 1kHz in AC and AC+DC):
Accuracy: add 1% R to the values in the table above. Capture time: approximately 100ms
4.2.19 Calculation of the Power Factor (PF)
Measurement Range (1) 0.00 to +1.00Specified MeasurementRange
0 to 50% of themeasurement range
50 to 100% of themeasurement range
Accuracy (2) ± (3% R +3cts) ± (2% R +3cts)Resolution 0.01
Note (1) If one of the terms in the calculation of the power factor is displayedas "OL", or forced to zero, the display of the power factor is anindeterminate value "----".
Note (2) In balanced three-phases, with deformed signals (THD andharmonics), uncertainties are guaranteed since Ф > 30°. Additional errors are following, depending of THD:
Add +1% for 10% < THD < 20%Add +3% for 20% < THD < 30%Add +5% for 30% < THD < 40%
NOTE: The PF is always positive
Specific characteristics in MAX/MIN mode (from 10Hz to 1kHz): Accuracy: add 1% R to the values in the table above. Capture time: approximately 100ms.

75
4.2.20 Calculation of the Displacement Power Factor (DPF)
Measurement Range (1) 0.00 to +1.00Specified measurement Range(from 1AAC)
0 to 100% of the measurement range
Accuracy (2) (3) ± (5% R +2cts)Resolution 0.01
Note (1) If one of the terms in the calculation of the DPF is displayed as "OL", orforced to zero, the display of the DPF is an indeterminate value "----".
Note (2) of the previous § apply
Note (3) Measurement stabilization ~8 sec
NOTE: The DPF is always positive. It’s equivalent to |cos Φ|
Specific characteristics in MAX/MIN mode (from 10Hz to 1kHz): Uncertainties: add 1% R to the values in the table above. Capture time: approximately 100ms.
4.2.21 Frequency Measurements
4.2.21.1 Voltage
MeasurementRange (1)
5.0 to999.9Hz
1000 to9999Hz
10.00 to19.99kHz
SpecifiedMeasurementRange
1 to 100% of themeasurement range
0 to 100% of themeasurement range
Accuracy ± (0.4% R + 1ct)Resolution 0.1Hz 1Hz 10Hz
4.2.21.2 Current
Measurement Range (1) 5.0 to 1999Hz
Specified Measurement Range 1 to 100% of the measurement range
Accuracy ± (0.4% R + 1ct)
Resolution 0.1Hz
Note (1) In MAX/MIN mode, the operating range is limited to 1kHz.If the level of the signal is too low (<10% of the range, or V<8V or
I<9A) or if the frequency is less than 5Hz, the device cannotdetermine the frequency and displays "----".
Specific Specifications in MAX/MIN mode (from 10Hz to 1kHz):
Accuracy: add 1% R to the values of the table above.
Capture of the extreme: approximately 100ms.

76
4.2.22 Specifications in THDr
Measurement Range 0.0 to 100%Specified MeasurementRange
0 to 100%of the measurement range
Accuracy ± (5% R ±2cts) in voltage± (5% R ±5cts) in current
Resolution 1%
4.2.23 Specifications in THDf
Measurement Range 0.0 to 1000%Specified MeasurementRange
0 to 100%of the measurement range
Accuracy ± (5% R ±2cts) in voltage± (5% R ±5cts) in current
Resolution 1%
Note : The display is "----" if the input signal is too low (V<8V or I<9A) or ifthe frequency is less than 5Hz.
Specific characteristics in MAX/MIN mode in THD (from 10Hz to 1kHz): Accuracy: add 1% R to the values in the table above. Capture of the extreme: approximately 100ms
4.2.24 Harmonic Measurement Specifications
Measurement Range in Voltage Per §4.2.2 and §4.2.3Measurement Range in Current Per §4.2.5 and §4.2.6
Harmonic RangeAC: harmonics of orders 1 to 25AC+DC: all orders from 1 to 25, plus the DCcomponent
Frequency Analysis Band
- 0 to 25 times the fundamental frequency,from among the network frequencies 50,60, and 400Hz
- 0 to 12 times the fundamental frequencyof an 800Hz network
Stability of the Current and VoltageDisplay
± (1% R ±2cts)
Accuracy on the RMS value of theharmonic (zero corrected in ADC)
Level >10% and order <13: ±(5% R ±2cts)Level >10% and order >13: ±(10% R ±2cts)Level <10% and order <13: ±(10% R ±2cts)Level <10% and order >13: ±(15% R ±2cts)
Note: The display is "----" if the input signal is too low (U<8V or I<9A) or if thefrequency is less than 5Hz.

77
- Specific characteristics in MAX/MIN mode in THD (from 10Hz to 1kHz):
Accuracy: add 1% R to the values in the tables above.
Capture time of the extreme: approximately 100ms
4.3 ENVIRONMENTAL CONDITIONS
Conditions Operating Storage
Temperature -4° to +131°F(-20° to +55°C)
-40° to +158°F(-40° to +70°C)
Relative humidity (RH) ≤90% up to 131°F (55°C) ≤90% up to 158°F (70°C)
4.4 MECHANICAL SPECIFICATIONS
HousingRigid polycarbonate shell with over-molded elastomercovering; UL94 V1
Jaws
Polycarbonate
Opening: 2.36" (60mm)
Clamping diameter: 2.36" (60mm)
Screen
LCD display unit
Blue backlighting
Dimension: 1.6 x 1.9" (41 x 48mm)
Dimension 11.65 x 4.37 x 1.61" (296 x 111 x 41mm)
Weight 1.4 lbs (640g) with batteries
4.5 POWER SUPPLY
Batteries 4x1.5V AA LR6
Battery Life >350 hours (without backlighting and Bluetooth)
Auto Power Off After 10 minutes with no switch and/or button activity

78
4.6 COMPLIANCE WITH INTERNATIONAL STANDARDS
Electric safetyCompliant with standards IEC-61010-1,IEC-61010-2-30, and IEC-61010-2-32:1000V CAT IV.
Electromagneticcompatibility
Compliant with standard EN-61326-1Classification: residential environment
Mechanical strength Free fall: 2m (in accordance with standard IEC-68-2-32)
Level of protection ofthe housing
Housing: IP54 (per standard IEC-60529)Jaws: IP40

79
4.7 ENVIRONMENTAL VARIATIONS
Condition ofInfluence
Range ofInfluence
MeasurementInfluenced
Influence
Typical MAX
Temperature-4° to +131°F
(-20° to +55°C)
VAC
VDC
AT°C
Hz
-0.1% R/10°C1% R/10°C
(0.2% R +1°C)/10°C0.1% R/10°C + 2ct
0.1% R/10°C
0.5% R/10°C + 2ct
1.5% R/10°C + 2ct(0.3% R +2°C)/10°C0.1% R/10°C + 3ct
Humidity 10 to 90% RHVA
0.1% R 0.1% R + 1ct
Frequency
10Hz to 1kHz1kHz to 3kHz
10Hz to 400Hz400Hz to 2kHz
V
A
1% R8% R1% R4% R
1% R + 1ct9% R + 1ct1% R + 1ct5% R + 1ct
Position of theconductor in
thejaws (f400Hz)
Any positionon the internalperimeter of
the jaws
A 2% R 4% R + 1ct
Adjacentconductorcarrying acurrent of150ADC or
RMS
Conductortouching the
externalperimeter of
the jaws
A 40 dB 45 dB
Conductorenclosed bythe clamp
0 to 500ARMS V 1ct 1ct
Application of avoltage on the
clamp
0 to 1000VDC
or RMSA 1ct 3% R + 1ct
Peak factor
1.4 to 3.5,limited
to 1500A peak1400V peak
A (AC)V (AC)
1% R1% R
3% R + 1ct
PF (inductiveand capacitive)
0.7 and I 5A0.5 and I 10A0.2 and I 20A
W 0.5%R1%R + 1 pt
3%R + 1 pt8%R + 1 pt

80
5 MAINTENANCE
5.1 WARNING:
Remove the test leads on any input before opening the case.
Do not operate the clamp-on meter without a battery case cover.
To avoid electrical shock, do not attempt to perform any servicingunless you are qualified to do so.
To avoid electrical shock and/or damage to the instrument, do not getwater or other foreign agents into the probe.
5.2 CLEANING
Disconnect everything connected to the device and set the switch to
OFF.
Use a soft cloth moistened with soapy water. Rinse with a damp clothand dry quickly using a dry cloth or forced air.
Dry completely before putting back into use.
5.3 REPLACEMENT OF THE BATTERIES
The symbol indicates that the batteries are low. When this symbol appearson the display unit, the batteries must be replaced. The measurements andspecifications are no longer guaranteed.
To replace the batteries, proceed as follows:
1. Disconnect the measurement leads from the input terminals.
2. Set the switch to OFF.
3. Using a screwdriver, unscrew the battery compartment cover from theback of the housing (see §3.1).
4. Remove the used batteries and replace them with 4x1.5V AA batteries,observing the polarities.
5. Close the battery compartment cover and screw it onto the housing.

81
6 REPAIR AND CALIBRATION
To ensure that your instrument meets factory specifications, we recommendthat it be submitted to our factory Service Center at one-year intervals forrecalibration, or as required by other standards or internal procedures.
For instrument repair and calibration:
You must contact our Service Center for a Customer Service Authorizationnumber (CSA#). This will ensure that when your instrument arrives, it will betracked and processed promptly. Please write the CSA# on the outside ofthe shipping container. If the instrument is returned for calibration, we needto know if you want a standard calibration, or a calibration traceable toN.I.S.T. (includes calibration certificate plus recorded calibration data).
Chauvin Arnoux®, Inc. d.b.a. AEMC® Instruments15 Faraday DriveDover, NH 03820 USA
Tel: (800) 945-2362 (Ext. 360)(603) 749-6434 (Ext. 360)
Fax: (603) 742-2346 or (603) 749-6309
(Or contact your authorized distributor)
Costs for repair, standard calibration, and calibration traceable to N.I.S.T. areavailable.
NOTE: All customers must obtain a CSA# before returning anyinstrument.
7 TECHNICAL AND SALES ASSISTANCE
If you are experiencing any technical problems, or require any assistancewith the proper operation or application of your instrument, please call, mail,fax or e-mail our technical support hotline:
Chauvin Arnoux®, Inc. d.b.a. AEMC® Instruments200 Foxborough BoulevardFoxborough, MA 02035, USA
Phone: (800) 343-1391(508) 698-2115
Fax: (508) 698-2118
NOTE: Do not ship instruments to our Foxborough, MA address.

82
8 LIMITED WARRANTY
The Model 607 is warranted to the owner for a period of three years fromthe date of original purchase against defects in manufacture. This limitedwarranty is given by AEMC
®Instruments, not by the distributor from
whom it was purchased. This warranty is void if the unit has beentampered with, abused or if the defect is related to service not performedby AEMC
®Instruments.
Full warranty coverage and product registration is available on ourwebsite at www.aemc.com/warranty.html.
Please print the online Warranty Coverage Information for yourrecords.
If a malfunction occurs within the three-year period, you may return theinstrument to us for repair, provided we have your warranty registrationinformation on file or a proof of purchase. AEMC
®Instruments will, at its
option, repair or replace the faulty material.
REGISTER ONLINE AT: www.aemc.com
9 WARRANTY REPAIRS
What you must do to return an Instrument for Warranty Repair:
First, request a Customer Service Authorization Number (CSA#) byphone or by fax from our Service Department (see address below), thenreturn the instrument along with the signed CSA Form. Please write theCSA# on the outside of the shipping container. Return the instrument,postage or shipment pre-paid to:
Chauvin Arnoux®, Inc. d.b.a. AEMC
®Instruments
15 Faraday Drive • Dover, NH 03820 USA
Tel: (800) 945-2362 (Ext. 360)(603) 749-6434 (Ext. 360)
Fax: (603) 742-2346 or (603) 749-6309
Caution: To protect yourself against in-transit loss, we recommend youinsure your returned material.
NOTE: All customers must obtain a CSA# before returning anyinstrument.


Chauvin Arnoux®, Inc. d.b.a AEMC
®Instruments
15 Faraday Drive • Dover, NH 03820 USA
www.aemc.com
99-MAN 100371 v2 10/12