power, avionics and software—phase 1.0: … report describes power, avionics and software (pas )...
TRANSCRIPT

William D. Ivancic, Obed S. Sands, Casey J. Bakula, Daniel R. Oldham, Ted Wright, and Martin A. Bradish Glenn Research Center, Cleveland, Ohio
Joseph M. KlebauScience Applications International Corporation, Cleveland, Ohio
Power, Avionics and Software—Phase 1.0: Subsystem Integration Test Report
NASA/TM—2014-216664
August 2014
https://ntrs.nasa.gov/search.jsp?R=20150000247 2018-05-26T14:17:54+00:00Z


William D. Ivancic, Obed S. Sands, Casey J. Bakula, Daniel R. Oldham, Ted Wright, and Martin A. Bradish Glenn Research Center, Cleveland, Ohio
Joseph M. KlebauScience Applications International Corporation, Cleveland, Ohio
Power, Avionics and Software—Phase 1.0: Subsystem Integration Test Report
NASA/TM—2014-216664
August 2014

Level of Review

Power, Avionics and Software - Phase 1.0: Subsystem Integration Test Report
William D. Ivancica,∗, Obed S. Sandsa, Casey J. Bakulaa, Daniel R. Oldhama, Ted Wrighta, Martin A. Bradisha,
Joseph M. Klebaub
aNASA Glenn Research Center, 21000 Brookpark Road, Cleveland, Ohio 44135 USAbScience Applications International Corporation (SAIC) , Cleveland, Ohio USA
Abstract
This report describes Power, Avionics and Software (PAS) 1.0 subsystem integration testing and test results that oc-
curred in August and September of 2013. This report covers the capabilities of each PAS assembly to meet integration
test objectives for non-safety critical, non-flight, non-human-rated hardware and software development. This test re-
port is the outcome of the first integration of the PAS subsystem and is meant to provide data for subsequent designs,
development and testing of the future PAS subsystems. The two main objectives were to assess the ability of the PAS
assemblies to exchange messages and to perform audio testing of both inbound and outbound channels. This report
describes each test performed, defines the test, the data, and provides conclusions and recommendations.
Keywords: Communication Architecture, Protocols, Telemetry, Avionics
Contents
1 Background 2
2 Introduction 2
3 Test System 3
4 Assembly Descriptions: 44.1 Communications Assembly (Router/Radios) . . . . . . . . . . . . . . . . . . . . . . . . . . . . . . . 4
4.2 Audio Assembly . . . . . . . . . . . . . . . . . . . . . . . . . . . . . . . . . . . . . . . . . . . . . 4
4.3 Informatics Assembly . . . . . . . . . . . . . . . . . . . . . . . . . . . . . . . . . . . . . . . . . . . 5
4.4 Caution, Warning and Control Assembly . . . . . . . . . . . . . . . . . . . . . . . . . . . . . . . . . 5
4.5 Video Assembly . . . . . . . . . . . . . . . . . . . . . . . . . . . . . . . . . . . . . . . . . . . . . . 6
5 Interface Test Summary 75.1 Network Connectivity . . . . . . . . . . . . . . . . . . . . . . . . . . . . . . . . . . . . . . . . . . . 7
5.2 Network Time Protocol . . . . . . . . . . . . . . . . . . . . . . . . . . . . . . . . . . . . . . . . . . 7
5.3 Assembly Status . . . . . . . . . . . . . . . . . . . . . . . . . . . . . . . . . . . . . . . . . . . . . . 8
5.4 Configuration and Performance Measurement Telemetry . . . . . . . . . . . . . . . . . . . . . . . . 8
5.4.1 Consumables . . . . . . . . . . . . . . . . . . . . . . . . . . . . . . . . . . . . . . . . . . . 9
5.4.2 Physiological . . . . . . . . . . . . . . . . . . . . . . . . . . . . . . . . . . . . . . . . . . . 9
5.4.3 Basics . . . . . . . . . . . . . . . . . . . . . . . . . . . . . . . . . . . . . . . . . . . . . . . 9
5.4.4 CWCS Two Line Display . . . . . . . . . . . . . . . . . . . . . . . . . . . . . . . . . . . . 9
5.5 Audio Tests . . . . . . . . . . . . . . . . . . . . . . . . . . . . . . . . . . . . . . . . . . . . . . . . 10∗Corresponding author
Email addresses: [email protected] (William D. Ivancic), [email protected] (Obed S. Sands),
[email protected] (Casey J. Bakula), [email protected] (Daniel R. Oldham), [email protected] (Ted Wright),
[email protected] (Martin A. Bradish), [email protected] (Joseph M. Klebau)

5.5.1 Streaming Audio to Off-suit Nodes . . . . . . . . . . . . . . . . . . . . . . . . . . . . . . . 11
5.5.2 Streaming Audio to Informatics Assembly . . . . . . . . . . . . . . . . . . . . . . . . . . . . 11
5.5.3 Streaming Audio Latency . . . . . . . . . . . . . . . . . . . . . . . . . . . . . . . . . . . . 12
5.5.4 Inbound Audio Stream Mixing . . . . . . . . . . . . . . . . . . . . . . . . . . . . . . . . . . 16
5.5.5 Audio Tones . . . . . . . . . . . . . . . . . . . . . . . . . . . . . . . . . . . . . . . . . . . 17
5.5.6 Audio Outbound Pressure Compensation . . . . . . . . . . . . . . . . . . . . . . . . . . . . 19
5.5.7 Transmit Mode Functions . . . . . . . . . . . . . . . . . . . . . . . . . . . . . . . . . . . . 20
5.5.8 Audio Post Test Results . . . . . . . . . . . . . . . . . . . . . . . . . . . . . . . . . . . . . 21
5.6 Video Stress Test . . . . . . . . . . . . . . . . . . . . . . . . . . . . . . . . . . . . . . . . . . . . . 23
5.7 Network Performance . . . . . . . . . . . . . . . . . . . . . . . . . . . . . . . . . . . . . . . . . . . 24
5.8 Bus Traffic Analysis . . . . . . . . . . . . . . . . . . . . . . . . . . . . . . . . . . . . . . . . . . . . 27
6 Summary and Conclusions 31
Appendix A Test Data 37
1. Background
The current Extravehicular Mobility Unit (EMU) suites (space suits) are still using technology from the 1970’s and
1980’s, particularly regarding the communications system. These systems work well, and there is always a reluctance
to change space systems. There is nearly always the desire to be backwards compatible with proven systems, to reduce
risk. Unfortunately, this backwards compatibility often occurs to the detriment of new technologies infusion, the same
technologies that may actually reduce cost while dramatically improving capability.
In order to infuse new technologies into the EMUs and prepare for future National Aeronautics and Space Ad-
ministration (NASA) missions, NASA is currently developing an Advanced Extravehicular Mobility Unit (AEMU)1.
This is being performed within the Advanced EVA Systems Development Project under the Advanced Exploration
Systems (AES) Program. A key part of this development is the spacesuit Primary Life Support Subsystem (PLSS)
technology unit for long-duration microgravity or planetary missions and vacuum or low-pressure environments.
NASA Glenn Research Center (GRC)’s role is to develop the Power, Avionics and Software (PAS) subsystem.
The PAS subsystem being developed at GRC supports the AEMU program at NASA’s Johnson Space Center
(JSC). GRC’s role is to develop a prototype suite avionics subsystem and to research new technologies for the AEMU.
The results will be used to refine requirements for the AEMU as well as to potentially integrate new technologies into
the AEMU.
2. Introduction
This report describes PAS 1.0 subsystem integration testing and test results that occurred in August and September
of 2013. This report covers the capabilities of each PAS assembly to meet integration test objectives for non-safety
critical, non-flight, non-human-rated hardware and software development. The reported upon activities were per-
formed with regard to applicable requirements to ensure design goals and objectives are satisfied. For an in-depth
look at the PAS system network architecture for this test refer to the Power, Avionics and Software Communication
Network Architecture publication [1]. This test report is the outcome of the first integration of the PAS subsystem
and is meant to provide data for subsequent designs, development and testing of the future PAS subsystems. The test
results presented in this document are from a developmental subsystem that consists of an integration of assembly
level developmental breadboards. Note that this is developmental hardware and does not represent flight hardware or
its final configuration. The two main objectives were to assess the ability of the PAS assemblies to exchange messages
and to perform audio testing of both inbound and outbound channels. These two objectives were meet. This report
discusses each test performed, defines the test, the data, and provides conclusions and recommendations.
1 A spacesuit that provides environmental protection, mobility, life support, and communications for astronauts performing an Extravehicular
Activity (EVA)

3. Test System
The PAS 1.0 subsystem interface test configuration is shown in Figure 1: Test Configuration. It consists of a
caution warning and control assembly, a graphical user interface for the caution warning and control subsystem, a
high definition video camera, informatics (INFO), the communication assembly, an audio processing unit and a
Measurement, Test and Validation (MTV) computer. All assemblies are connected through a NetGear ProSafe®
GS724T Gigabit Ethernet (GigE) managed switch. Although, technically, the PAS bus used in the test is GigE,
the Avnet board (outbound audio), all of the netbooks, Radio, and the Informatics assembly are only FastEthernet
compatible (10/100 Mbps). Fortunately, the Netgear GS724T is 10/100/1000 compatible. The switch was configured
such that all connected ports transmit signals were mirrored to a single monitoring port. The MTV was connected to
that mirrored port.
Figure 1: Test Configuration
All communication for these tests used Internet Protocol version 4 (IPv4) addressing. All subsystems are on
class-C subnet 192.168.1.0. All external audio sources are on class-C subnet 192.168.3.0. All routing was statically
configured. The Communication Subassembly (COMM) is attached to both networks. Thus, all routes off suit use
COMM address 192.168.1.105 as the default gateway while all external systems use COMM address 192.168.3.105
as the default gateway. It is important to note that this static routing technique was done simply to test the messaging
between assemblies. This would not be done for a multi-homed radio system such as would be required on an AEMU
deployed for terrestrial sorties. Furthermore, if one had multiple AEMUs deployed, the routing for example from the
informatics system on suit A to the informatics system on suit B, would be from the internal subnet on suit A to the
internal subnet on suit B. It would not be from the internal subnet on suit A to the common radio subnet of which both

suit A and suit B belong.
The amount of traffic generated was insignificant relative to the bandwidth available on the GigE bus, even when
including our High Definition Television (HDTV) video. All assemblies were connected over GigE through a GigE
switch. An Ethernet switch ensures that only data destined to a particular device will be seen by that device (unless,
one overrides this by port mirroring). All other traffic with the exception of multicast and broadcast traffic is filtered.
Request/Respond is discouraged as it requires maintaining state. Instead, subsystem communications is via a Pub-
lish/Subscribe mechanism using ZeroMQ [2]. One feature of ZeroMQ is that there is no “daemon” or broker process
that runs in the background. ZeroMQ messages are defined using Google Protocol Buffers (GPB)or simply protocol
buffers [3] in a common aemu.proto file. This file can be found in the appendix of Power, Avionics and Software
Communication Network Architecture publication [1]. Each message type has specific parameters associated with
it. Those parameters are also defined in the aemu.proto file. There are two basic message types: TELEMETRY and
EVENT. TELEMETRY provides status whereas an EVENT reports that something has happened or to relay that an
assembly needs some attention. The term "command" is intentionally avoided as "command" implies request/respond
which requires systems to maintain states. Only publish/subscribe is implemented which does not require systems to
maintain states.
4. Assembly Descriptions:
The following section provides a brief description of each assembly. It is important to note that many of the
assemblies in PAS 1.0 are implemented using development boards. More often than not with such boards, the pro-
cessors and supporting tools are reasonably adequate, but peripheral support is lacking. For example, buffers may be
rather small on Ethernet interfaces resulting in reduced throughput between devices. Many of the test results related
to throughput are a direct result of limited peripheral support.
4.1. Communications Assembly (Router/Radios)
The Communication Subassembly (COMM) for this testing consists of a wireless interface between various PAS
assemblies and the rest of the off-suit EVA network. It is essentially a router between the on-suit network and the ex-
ternal wireless network. The COMM Assembly hardware consists of a Beaglebone processor board (manufactured by
Circuitco) which uses a Texas Instruments AM335x “Sitara” CPU (1 GHz ARM Cortex A8 core) and a Commercial-
Off-The-Shelf (COTS) 802.11n adapter. The COMM assembly performs the routing of information between the PAS
Subsystems and between AEMUs via the radio network. The COMM assembly also performs configuration control
of the attached 802.11n radio.
All audio streams are unicast because the chosen Linux operating system version on the current netbooks does not
support multicast. The PAS subsystem is on the 192.168.1.xxx subnet (subnet mask 255.255.255.0) and the Wireless
Fidelity (a.k.a. Wireless Internet) (WiFi) radios are on the 192.168.3.xxx subnet (subnet mask 255.255.255.0). Internet
Protocol (IP) addresses are statically routed during this test. For simplicity during initial testing, the GStreamer
audio [4] was transmitted between assemblies using User Datagram Protocol (UDP) and unicast addressing using
different destination ports to identify the different sources. The drawback is that n number of streams from each source
requires n number of destinations. Since there is only one inbound destination this was not as issue on the inbound
side. For the outbound audio, there were four off suit destinations (plus the Linear Pulse Code Modulation (LPCM)
stream to Informatics). Thus, four unicast streams were sent over the wireless link instead of one multicast stream.
The GStreamer audio can also be run over UDP using a simple multicast address with different ports to identify
different sources. The COMM assembly provides this result in one multicast stream per source instead of mxn unicast
streams where m are the number of sources and n the number of destinations.
4.2. Audio Assembly
Originally the Audio assembly was envisioned as consisting of one, Avnet Spartan®-6/OMAP development kit.
However, when attempting to process one outbound audio stream and 4 inbound audio streams using GStreamer and
G.711 encoding and processing these in software (rather than utilizing the DSP support chip), it was determined that
this Avnet card did not have sufficient processing capability to move between encoding the outbound streams and
decoding the four inbound streams2. In order to meet the test schedule, a decision was made to split the outbound
processing and inbound processing by using one Avnet development board for outbound audio and one Avnet de-
velopment board for processing the four inbound streams. Unfortunately the Avnet development kit did not have
sufficient processing to simultaneously decode four inbound streams. It could barely decode two inbound streams in
real-time. Thus, the second Avnet development kit was replaced with an Acer Ze7 netbook computer having an Intel
N2600 Atom 1.6 GHz Dual-core processor running Linux. The netbook was able to handle four inbound streams.
Thus, all the Audio tests were performed using on Avnet Spartan®-6 development board for outbound traffic and one
netbook for inbound traffic.
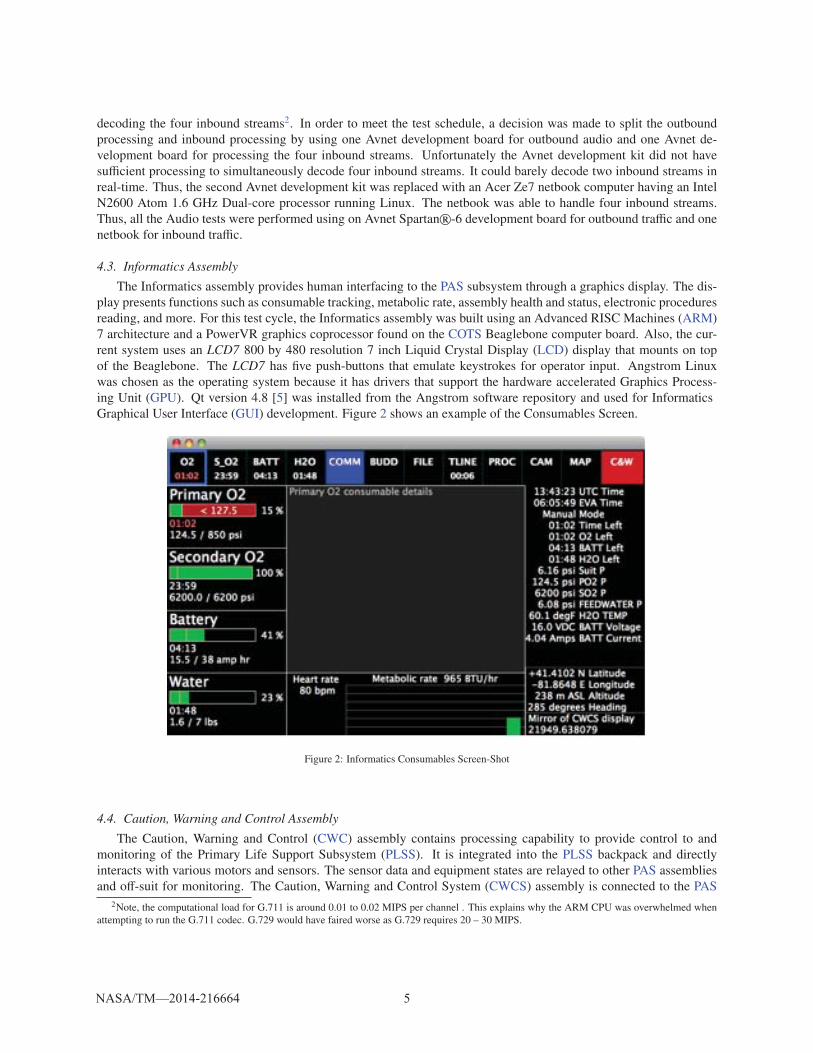
4.3. Informatics Assembly
The Informatics assembly provides human interfacing to the PAS subsystem through a graphics display. The dis-
play presents functions such as consumable tracking, metabolic rate, assembly health and status, electronic procedures
reading, and more. For this test cycle, the Informatics assembly was built using an Advanced RISC Machines (ARM)
7 architecture and a PowerVR graphics coprocessor found on the COTS Beaglebone computer board. Also, the cur-
rent system uses an LCD7 800 by 480 resolution 7 inch Liquid Crystal Display (LCD) display that mounts on top
of the Beaglebone. The LCD7 has five push-buttons that emulate keystrokes for operator input. Angstrom Linux
was chosen as the operating system because it has drivers that support the hardware accelerated Graphics Process-
ing Unit (GPU). Qt version 4.8 [5] was installed from the Angstrom software repository and used for Informatics
Graphical User Interface (GUI) development. Figure 2 shows an example of the Consumables Screen.
Figure 2: Informatics Consumables Screen-Shot
4.4. Caution, Warning and Control Assembly
The Caution, Warning and Control (CWC) assembly contains processing capability to provide control to and
monitoring of the Primary Life Support Subsystem (PLSS). It is integrated into the PLSS backpack and directly
interacts with various motors and sensors. The sensor data and equipment states are relayed to other PAS assemblies
and off-suit for monitoring. The Caution, Warning and Control System (CWCS) assembly is connected to the PAS
2Note, the computational load for G.711 is around 0.01 to 0.02 MIPS per channel . This explains why the ARM CPU was overwhelmed when
attempting to run the G.711 codec. G.729 would have faired worse as G.729 requires 20 – 30 MIPS.

subsystem via the PAS Ethernet bus and communicates with other assemblies uses ZeroMQ over Transmission Control
Protocol (TCP).
The CWCS GUI provides the ability to monitor the telemetry from the CWCS as well as emulate switches the
CWCS. Communication between the CWCS and CWCS GUI is over a separate Ethernet bus using TCP/IP protocols
in a server/client arrangement.
For these tests, a CWCS GUI PAS Audio page was added to emulate switches and controls related to the audio
subsystem. Examples of the types of events being sent are CWCS status, master volume, inbound channel volume,
the caution and warning tone event messages, and the in-suit pressure. A screen-shot of the CWCS GUI page can be
seen in Figure 3.
Figure 3: CWCS GUI Screen-Shot
4.5. Video Assembly
The current PAS 1.0 architecture calls for a suit mounted video camera that will interface directly with the PAS
system data bus. The purpose of the suit camera is to provide record keeping as well as situational awareness to
ground support and other mission assets during EVA. Thus with a wide range of uses, the camera must have broad
flexibility in resolution, frame rate, and the ability to generate multiple video streams simultaneously. Video stream
rates are expected to be as high as 15 Mbps for high quality High Definition (HD) at 30 fps. These rates are orders
of magnitude higher than all other bus traffic that may exist in the currently envisioned PAS 1.0 subsystem. As
such, video has a greater potential to interfere with other system traffic. In order to identify possible interactions,
a video stream was sent over the GigE bus to ensure there is sufficient bandwidth on the bus to allow all necessary
communication between assemblies occurs and that the quality of communications remains intact. For PAS 1.0 the
video source was a SANYO VCC-HD4600 high definition IP Camera. The Sanyo camera was chosen as a close
functional and performance approximation to the camera currently envisioned for the suit. The Sanyo camera was
attached to the NetGear Gigabit switch, the PAS bus, on one of the available ports. It was given address 192.168.1.106.
The video sink (or destination) was displayed on a computer attached to the NetGear Gigabit Ethernet switch on one
of the ports. It was given address 192.168.1.116. The SANYO camera provided client software to both configure the
camera and display the video via a Web-based application interface.

5. Interface Test Summary
The section describes the various tests performed in August and September of 2013 as well the results and con-
clusions. The detail test procedures and data can be found in Appendix A
5.1. Network Connectivity
The most basic function of the COMM assembly is to connect the assemblies on the suit to the EVA wireless net-
work allowing the suit to communicate with other suits and a spacecraft. The network connectivity test demonstrated
that each assembly on the PAS bus can communicate through the radio to a computer or device that is connected to
the EVA wireless network, and vice versa. This test consists of a series of network pings3 [6] between every PAS
assembly and every wireless node to insure all combinations of connectivity are intact. The network connectivity test
was performed many times during the course of the test campaign, both as a test in and of itself and as a precursor test
to many other tests to ensure that the subsystem is operating properly. This test consistently passed during nominal
test conditions with the exception of the failures identified under the following conditions:
• A PAS device was “locked up” due to circumstances unrelated to this test and needed to be rebooted
• During the Network Performance Tests, when the network was flooded with more traffic than the COMM
hardware could handle, causing the network interfaces to fail. This condition was corrected by power cycling
the devices being tested.
In preliminary PAS testing, the Informatics software would quit unexpectedly with a ZeroMQ error message when the
CWCS was restarted. Ideally this should not happen. After updating to the latest ZeroMQ software, the Informatics
software would no longer quit unexpectedly and would continue to receiving messages after a CWCS restart, but the
Informatics assembly would not reestablish communication with CWCS (receiving its published messages) automati-
cally as it should have. To start receiving CWCS messages again, the Informatics software would have to be restarted.
It is believed that the Audio software exhibited the same behavior (rebooting the CWCS required restarting software
on the Audio assembly in order to receive new messages from CWCS). Both assemblies were never "locked up", but
they were not receiving all the messages they should have been until the application using the ZeroMQ socket was
restarted. The consensus is that this is most likely caused by the Ethernet software on the CWCS VxWorks operating
system and some incompatibility with the Portable Operating System Interface for Unix (application programming
interface) (POSIX) assumptions made by ZeroMQ causing socket reinitialization failures when CWCS is restarted.
There is supposed to be some automatic handshaking that allows sockets to be connected in any order and reconnect
properly after disconnects, but that handshaking was not working correctly when the CWCS assembly was involved.
Also, note that VxWorks is not officially supported by ZeroMQ, but the PAS avionics team managed to compile it and
it seemed to work well otherwise.
5.2. Network Time Protocol
Network Time Protocol (NTP) [7] was used to maintain clock synchronization between the PAS assemblies. The
Radio Testbed was used as the master clock, and all other PAS assemblies were configured to use the Radio Testbed
as their sole time source. Since the Radio Testbed did not have another device available to use as its master clock, an
arbitrary time was provided to the testbed during its boot process. Because NTP generally has a very slow conver-
gence rate, to avoid significant time-stepping in the assemblies all PAS assemblies were forced to step to the Radio
Testbed’s time during their boot process. Without this forced step, the PAS assembly clocks will not synchronize to
the Radio Testbed clock due to the large difference in system times. The convergence rate is adjustable, but EVA’s are
projected to be last 8 hours or less, which is not enough time to properly synchronize the assemblies’ clocks. Thus, if
NTP is deployed, there will be a need to pre-synchronize the assemblies’ clocks at power-up.
The convergence properties of NTP were tested by the following process:
1. Obtain time synchronization among all PAS assemblies
3Ping is a computer network administration utility used to test the reachability of a host on an Internet Protocol (IP) network
2. Manually step the system time on the Radio Testbed by various time increments
3. Observe the behavior of the other PAS assemblies as they attempt to resynchronize with the Radio Testbed
The following general observations were made:
• After the system time on the Radio Testbed was stepped, the NTP slave devices temporarily refused to attempt
re-synchronization for periods on the order of 30-60 minutes. This was due to logic in the NTP software that
profiles each master clock source and assigns a trusted value to it based on observations of the clock. In this
case, the time-stepping on the Radio Testbed appeared to the slave devices as erratic, untrustworthy behavior,
and therefore the slave devices refused to re-synchronize until the behavior of the Radio Testbed clock stabilized
and the trust factor was improved. This functionality is very useful to maintain network clock stability when
large banks of master clock sources are used across the globe, but a better way to synchronize clocks may need
to be investigated for a distributed PAS architecture.
• Even for sub-second discrepancies between assembly clock times, NTP can often take hours to obtain re-
synchronization. Although many of NTP’s performance parameters can be adjusted via configuration files,
NTP remains heavy-weight for a PAS-like subsystem. Another, solution may be to add a battery backed clock
and to preset each assemblies’ initial time which would lessen the time delta thereby reducing the synchroniza-
tion time. Lack of time synchronization between telemetry sources will complicate inter-subsystem commu-
nications. Thus, one conclusion is that assembly clocks will need to be synchronized in some fashion when
assemblies are networked.
• The behavior of NTP can be and was modified to suit the needs of PAS, but most of these modifications simply
disabled a lot of the advanced functionality of NTP.
Therefore, if NTP is deployed, periodic, forced synchronizations with the Communication timestamp might be
sufficient to maintain clock synchronization between the PAS assemblies over the duration of an EVA. The same is
true between the COMM assembly and its higher-tier clock (Access Point, Mission Control, etc.).
5.3. Assembly Status
The Assembly Status Test verifies that all assemblies are operational and are publishing information. It also
verifies that the status message adheres to both the format and the transport protocol used by the PAS assemblies.
Google Protocol Buffers (GPB) [3] were used to define the message formats, and ZeroMQ [2] was used to facilitate
the transfer of these messages over the PAS bus. The verification was performed by examining the Informatics COMM
screen, which is divided into four quadrants (one for each assembly) as shown in Figure 4. The background color of
the quadrant changes to green indicating that current status information has been received by the Informatics assembly
(for PAS 1.0), status is updated once per second). There is also a timestamp field in each assembly quadrant that is
updated with the time of the latest received status message. The Informatics, Audio, and CWCS assemblies showed
green status and had updating timestamps throughout the integration testing. Initially, the COMM assembly was not
showing up as operational on the Informatics display. But an examination of the “Cyclical Redundancy Check (CRC)
error” field on the Informatics COMM screen indicated that the number of network messages being rejected for
CRC failures was being incremented every second that the COMM assembly was turned on. A short investigation
determined that the COMM assembly was sending data using an outdated version of the wire format. After updating
the packet formatting code on the COMM assembly, it showed green on the Informatics display. All assemblies were
then verified as operational, and no more CRC errors were found during the integration testing.
5.4. Configuration and Performance Measurement Telemetry
Often telemetry refers to ALL data coming from a spacecraft to the ground. For the AEMU, telemetry only refers
to system and subsystem status, configuration and performance measurement data (e.g. suit internal pressure, suit
internal temperature, power supply voltage, power supply current and radio transmission rate). All other data flows
such as file transfers, and streaming video and audio are considered data flow and not telemetry.

Figure 4: Informatics Communication Screen
The Configuration and Performance Telemetry tests verify that the CWCS assembly is sending required telemetry
messages and that they are being received and displayed properly by the Informatics assembly. These telemetry mes-
sages include consumables measurements, physiological readings (i.e. heart rate and metabolic rate), basic telemetry
(i.e. mode setting, suit pressure, etc.) and messaging that reflects what will be displayed on the PAS CWCS high-
critical display. A display sample can be seen in Figure 2: Informatics Consumables Screen-Shot.
5.4.1. ConsumablesThere are four consumable levels that are computed on the CWCS and monitored by Informatics: Primary Oxygen
(PO2), Secondary Oxygen (SO2), Battery Life (BATT), and Water (H2O). There are four consumable display screens
on the Informatics display – one for each monitored consumable. Consumables telemetry is verified by checking that
the consumable levels as displayed by Informatics are decreasing. All four consumable displays showed decreasing
values during the tests.
5.4.2. PhysiologicalHeart Rate and Metabolic Rate information is sent by the CWCS and displayed on each of the Informatics consum-
ables screens. These displays showed slightly varying values updated once per second during the testing, indicating
that telemetry was being sent and received.
5.4.3. BasicsThe Basics telemetry consists of suit information that appears on all Informatics screens: EVA time, CWCS mode,
suit pressure, feed water pressure, water temperature, battery voltage, and battery current. All displayed values on
Informatics were verified to match the values sent by CWCS. The suit pressure value was changed during audio
testing, and the Informatics display of this value was verified to track the changes.
5.4.4. CWCS Two Line DisplayThe Informatics display has a small section that is intended to mirror the contents of the two-line text display
driven by the CWCS. There was no two-line display attached to the CWCS during the integration tests, but telemetry
showing a count (incremented once per second) was sent for testing. The two-line text mirror on Informatics was
verified to be displaying an incrementing count - shown in the bottom right corner of Figure 4.

5.5. Audio Tests
These tests demonstrated movement of compressed streaming audio between AEMUs through the COMM assem-
bly. The Audio assembly functions for this test include: 1) transmit one outbound G.711 audio stream to four external
systems; 2) transmit one outbound LPCM audio stream to Informatics; 3) receive and process G.711 encoded inbound
audio streams from four external entities (off-suit assets like other EMUs, Mission Control, etc.); and 4) activate the
necessary caution and warning tones. External off-suit nodes were emulated using netbooks running Ubuntu 12.04
with GStreamer 0.10.36. They each used a Wireless Local Area Network (WLAN) adapter to join an 802.11 Ad Hoc
WLAN network that included the COMM assembly and four netbooks directly addressed to the WLAN network,
192.168.3.0. The COMM assembly routed the streaming audio packets between the two networks, the internal PAS
network, 192.168.1.0 and the WLAN, 192.168.3.0.
In order to understand the test results it is important to understand the basic workings of GStreamer [4].
“GStreamer’s development framework makes it possible to write any type of streaming multimedia ap-
plication. The GStreamer framework is designed to make it relatively easy to write applications that
handle audio or video or both or any kind of data flow. The applications it supports range from simple
Ogg/Vorbis playback, audio/video streaming to complex audio (mixing) and video (non-linear editing)
processing. GStreamer is made up of Elements, Pads, Bins and pipelines, and Communication. An el-
ement is the most important class of objects in GStreamer. You will usually create a chain of elements
linked together and let data flow through this chain of elements. By chaining together several such ele-
ments, you create a pipeline that can do a specific task. Pads are element’s input and output, where you
can connect other elements. A bin is a container for a collection of elements. A pipeline is a top-level
bin. It provides a bus for the application and manages the synchronization for its children. Once started,
pipelines will run in a separate thread until you stop them or the end of the data stream is reached.
The data flowing through a pipeline consists of a combination of buffers and events. Buffers contain the
data that will flow through the pipeline you have created. A source element will typically create a new
buffer and pass it through a pad to the next element in the chain. The simple case is that a buffer is
created, memory allocated, data put in it, and passed to the next element. That element reads the data,
does something (like creating a new buffer and decoding into it), and unreferences the buffer. This causes
the data to be freed and the buffer to be destroyed.
The rtpjitterbuffer (jitter buffer) will wait for missing packets up to a configurable time limit using the
"latency" property. Packets arriving too late are considered to be lost packets. The lost packet events are
usually used by a depayloader or other element to create concealment data or some other logic to grace-
fully handle the missing packets. The jitterbuffer will use the Decode Time Stamp (DTS) or Presentation
Time Stamp (PTS) if no DTS is set of the incoming buffer and the rtptime inside the Real-time Transport
Protocol (RTP) packet to create a PTS on the outgoing buffer.”
Buffer size is basically the size of memory allocation whereas Block size is the size of the chunks of data acted
upon within the buffer.
The particular GStreamer pipeline implemented for this series of tests is shown in Figure 5. In this architecture,
each of the four input channels can be muted or audio adjusted individually via four separate pipelines. They are
then audio-mixed in the summing function. Here the four pipes are combined time-aligned and everything synchro-
nized. This is all done in software and requires significant processing capability. A second master volume control is
implemented along the new input chain and sent to a second combiner where the Audio Tones and Combined Audio
Channels are mixed, again synchronized and time-aligned. The output of the second audio mixer is passed on to the
Linux audio system, Advanced Linux Sound Architecture (ALSA) 4
Architecturally, this implementation mirrors the audio requirement for mixing four independent audio communi-
cations streams and having the Audio Tones volume and controls independent of the communication channels as well
4ALSA is part of the Linux kernel that provides an Application Program Interface (API) for sound card device drivers.

as ensuring the Audio Tones are 13 dB above the background noise. However, due to the processing necessary to sup-
port the interaction of the Ethernet buffer drivers, the four audio communication channels and the mixing functions,
the software was unable to keep up. The results are presented in 5.5.1 through 5.5.7.
Figure 5: GStreamer Inbound Audio Processing Pipeline
5.5.1. Streaming Audio to Off-suit NodesThe purpose of this test was to demonstrate effective movement of compressed streaming audio from the PAS Au-
dio assembly to four off-suit radio nodes through the COMM assembly. Compressed streaming audio data created in
the PAS Audio assembly, moves across the PAS bus through the PAS radio, across the Radio Frequency (RF) interface
and into four radio nodes where it is decoded and played through the speakers of the off-suit nodes (192.168.3.111
- 3.114). This test demonstrated only the out bound direction of the bidirectional audio requirement of R2.1.420.
Inbound is tested in another test.
• R2.1.420: (PAS2009) Full Duplex Voice Communication. The PAS Audio Assembly shall provide full-duplex
voice communications to the crewmember.
Subsystem components (including PAS Audio assembly, COMM assembly, radio nodes, etc.) were powered-on
and set-up per standard procedures including using a commanded suit pressure of 10 psia, 500 ms for jitter buffer size
and 4096 bytes for GStreamer Block size. Wireshark software [8] was used for monitoring network traffic. Speech
was input to the outbound PAS Audio assembly and was heard at each of the off-suit nodes. The speech produced
at each off-suit node was intelligible. No discernible artifacts or distortion were observed. The test was considered
successful and no issues were identified by the test. Successful test of outbound PAS audio assembly was based on
GStreamer software and it is recommended that continued development should leverage this software.
5.5.2. Streaming Audio to Informatics AssemblyThis test demonstrated effective movement of uncompressed streaming audio from PAS Audio assembly to the
Informatics assembly. Uncompressed streaming audio data created in the PAS Audio assembly, moves across the
PAS bus to the Informatics assembly, where it is archived. Uncompressed streaming audio data provides assurance
of the highest possible level of audio fidelity is being sent to informatics for storage. This test demonstrated that the
assembly is capable of meeting requirement R3.1.634 which pertains to voice field notes.
• R3.1.634: Field notes. The Informatics assembly shall record a crew field note consisting of: audio, still image
or video data, location coordinates and timestamp.
The Subsystem components (including PAS Audio assembly, COMM assembly, radio nodes, etc.) were powered-
on and set-up per standard procedures including using a commanded suit pressure of 10 psia, 500 ms for jitter buffer

size and 4096 bytes for GStreamer Block size. Wireshark® software [8] was used for monitoring network condition.
Speech was input to the outbound PAS Audio assembly and captured by the Informatics assembly in full-fidelity
LPCM format [9]. Successful testing of the outbound PAS Audio assembly was based on GStreamer software and
it is recommended that continued development should leverage this software. Audio spoken into the outbound PAS
Audio assembly was recorded on Informatics assembly and successfully played back.
5.5.3. Streaming Audio LatencyAudio latency testing characterizes the amount of end-to-end delay in the inbound and outbound PAS audio chan-
nels. Latency encompasses all delays in the channel including those associated with audio processing, coding and
decoding of streaming audio data in the outbound and the inbound assemblies as well as the movement of the data
through the PAS bus and the RF network. Applicable requirements for streaming audio latency include:
• R2.1.308: (PAS1218) Latency tolerance. This requirement limits overall PAS audio latency to be less than 100
ms delay for surface-to-surface crew-to-crew voice. This requirement is further decomposed into the following
requirements:
• R3.1.512: Latency tolerance—radio. This requirement limits latency associated with the radio to < 20 ms.
• R3.1.513: Latency tolerance—system bus. This requirement limits latency associated with the PAS bus to < 50
ms.
• R3.1.514: Latency tolerance—Audio assembly. This requirement limits latency associated with the Audio
assembly bus to < 30 ms.
One-way latencies of 200ms or less are considered acceptable for normal conversation. An allocation of 100ms total
to each PAS subsystem on a voice loop will support a total voice-loop latency of 200ms, not including speed-of-light
travel times associated with radio wave propagation. The test conducted here measured the amount of end-to-end
Audio assembly latency including PAS bus and RF network. Latencies associated with the different components of
the audio stream (i.e. Communication assembly, Audio assembly and the PAS bus) were not separately measured.
End-to-end latency was measured using a computer with two microphones and a device that creates a distinctive
pulse. To conduct a latency test a distinctive pulse was made at the microphone of one end of the voice loop and
simultaneously observed by one of the microphones of the latency measurement system. The second microphone of
the latency measurement system was placed at the speaker on the receiving end of the voice loop where the delayed
pulse was observed. End-to-end latency was measured by observing the amount of time that elapsed between the
pulses observed by the two microphones. The latency measurement system was performed using a netbook computer
running Audacity, a multi-track audio editor and recorder. Pulses were observed graphically. The distinctive pulse
was created by snapping fingers and the latency measurements appeared to be accurate to within a few milliseconds.
This is shown in Figure 6 with the source tone on the bottom trace and the received pulse on the top trace. The delay
is the measure time between to bottom and top pulse. The observed latencies, themselves, appeared to be subject to a
significant amount of variation over time. A brief test procedure is provided below.
1. The Measurement, Test and Validation (MTV) netbook was used to measure latency. Microphones were con-
nected to the MTV netbook, software was started and the ability to measure latency was validated
2. The subsystem (including PAS audio sub-assembly, COMM assembly, radio nodes, etc.) was powered-on and
set-up per standard procedures including using a commanded suit pressure of 10 psia.
3. Latency measurements were made for both inbound and outbound channels for each of the radio nodes. In
each case, six distinct latency measurements were made for purposes of averaging and collecting statistics on
the measurements. Nominal values of 500 ms for GStreamer Jitter Buffer Size (gJBS) and 4096 bytes for
GStreamer Block Size (gBS) were used in this test.
4. Latency measurements were made for different combinations of gBS and gBS to determine effect of these
quantities on latency. These measurements were taken for a single radio node.

Figure 6: Audacity: Latency Measurement
Measured latency data from Step 3 are given in Table 1(a) for inbound channels and in Table 1(b) for outbound
channels. Measurements of latency were made in direct succession in which all six measurements associated with a
particular inbound or outbound channel were made sequentially (e.g. measurement 2 was made right after measure-
ment 1 and measurement 3 was made right after measurement 2, etc.). In each case all six measurements associated
with a particular channel were made over a period of about five minutes. There was no video or other high rate data
going through the PAS bus during the time when these measurements were made. In Table 1(a) and Table 1(b) the
average latency and standard deviation of the latency measurements are calculated in the penultimate and final rows
of these tables, respectively.
Table 1: Latency measurements for inbound 1(a) and outbound 1(b) channels. Jitter buffer size and GStreamer
block size are fixed at 500 ms and 4096 bytes, respectively. Measurements are given in milliseconds. Off-suit nodes
are identified by the final octet of their network IP address.
Due to the large discrepancy between other data sets and the inbound channel to the PAS receive assembly from
off-suit node 3.111 a second set of six datum were collected. This second data collection yielded an average latency
of 914 ms with a standard deviation of 2.2 ms. Measured latency data from step 2 of the test procedure are displayed
graphically in Figure 7(a) for the inbound channel of the PAS Audio assembly and in Figure 7(b) for the outbound
channel of the PAS Audio assembly.
Figure 7: Latency measurements for inbound (a) and outbound (b) channels. Data represent single latency mea-
surements for different levels of jitter buffer size and GStreamer block size. Data are for off-suit node 3.113. Mea-
surements are given in milliseconds.
Averaging the data in Table 1 over off-suit nodes, the inbound latency is 832 ms with a standard deviation of
83.0 ms and the outbound latency is 846 ms with a standard deviation of 9.8 ms. Thus, the latency of inbound and
outbound channels appears to be the same from a statistical perspective. A detailed examination of the data in Table
1 and Figure 7 reveals that there is a strong temporal dependence in the latency numbers. For example, examining the
latency numbers for the channel between node 3.111 and the PAS inbound node 1.107 there is a significant jump in
latency measurements between the first latency measurement and the remaining five measurements (a jump of about
20 ms). If the standard deviation estimate for these data is restricted to the last five latency measurements it drops from
9.8 ms to 1.9 ms. Similar jumps occur in each set of latency measurements. In particular data taken for the link from
PAS Audio (outbound) to radio node 3.113 and the link from PAS Audio outbound to radio node 3.114 each have two
jumps of approximately 20 ms. As discussed above, the second set of latency measurements for the inbound link from
node 3.111 showed a discrepancy in average latency of nearly 200 ms while the second set of measurements had a
very low spread. Further note that comparing average latency numbers for node 3.113 to those in Figure 7 (for gJBS =

Table 1: Audio for Off-Suit Nodes
(a) Inbound Audio
Off-Suit Nodes
Msmt# 3.111 3.112 3.113
1 751 837 853
2 730 822 854
3 725 817 859
4 729 819 853
5 729 819 836
6 729 792 816
Avg 732.2 817.7 845.2
Std 9.4 14.5 16.3
(b) Outbound Audio
Off-Suit Nodes
Msmt# 3.111 3.112 3.113
1 872 837 845
2 831 837 849
3 830 862 875
4 829 861 873
5 829 864 842
6 808 856 841
Avg 833.2 852.8 854.2
Std 20.4 12.5 15.6
500 ms, gBS = 4096 bytes) shows discrepancies of approximately 60 ms for the inbound channel and approximately
40 ms for the outbound channel. Channel latency appears to be very stable over a period of some tens of seconds with
latency measurements varying only a few milliseconds over such a period of time. However, over time, significant
jumps in the latency associated with a particular channel are observed. These observed jumps range from 20 ms to
nearly 200 ms.
Examining the data in Figure 7 reveals that, with a few notable exceptions, there is a general increase in latency
with block size and jitter buffer size. This is true for both inbound and outbound channels. A casual fit of the latency
data in Figure 7 to gJBS and gBS results in expressions for the inbound latency (Lin) and outbound latency (Lout) in
milliseconds:
Lin ≈ gJBS +(gBS
20
)+ 200 (1) Lout ≈ 0.7gJBS +
(gBS30
)+ 360 (2)
These formulae produce an RMS fit error of approximately 41 ms for and 88 ms for which are within the variability
in latency measurements observed over time, presumably due to networking and buffering issues. The data, together
with the formulae, indicate that there are no possible combinations of gJBS and gBS that will produce an end-to-end

(a) Inbound Audio
(b) Outbound Audio
Figure 7: Audio Latency
latency of less than 200 ms. For the outbound channel of the PAS Audio assembly, the audio signals were intelligible.
No discernible artifacts or distortion were observed at the off-suit nodes outputs. However, significant degradations in
audio quality occurred for the inbound channel of the PAS Audio assembly. The degradation in the inbound channel
is a progressive ‘breaking-up’ of the audio in which gaps in the audio signal became progressively more frequent
until the signal became unintelligible and, eventually, the inbound channel of the PAS Audio assembly became silent.
The amount of time for the inbound audio signal to degrade was mainly a function of gJBS and is shown in Table 2.

However, a value of gBS of less than 320 bytes also causes significant degradations in audio quality for the inbound
PAS subsystem regardless of gJBS. Note, these results are specifically for the GStreamer architecture implementation
shown in Figure 5
Table 2: Degradation time of Inbound audio signal as a function of gJBS
Buffer size (ms) 20 50 100 200 500
Time to Break-up (minutes) <1 <1 ˜1 ˜5 30
As noted above, the overall end-to-end latency requirements were not met. It is not clear which portion(s) of the
PAS Subsystem are deficient. Additionally, large jumps in channel latency are observed in the data. Changes in PAS
bus and RF network congestion are candidate causes for the variable latency. Internal issues with GStreamer and or
the Linux operating system buffers are suspects for both the oversized latency numbers as well as the variability of the
latency numbers. It is worth noting that the end-to-end streaming audio data delivery was accomplished using UDP
(without retries) yet the RF network uses significant amounts of Automatic Repeat-reQuest (ARQ). Therefore, sig-
nificant potential exists for inter-network interactions that may compound problems with network congestion. Future
testing should include monitoring the RF network. Suggest using AirPcap ® for monitoring the RF network.
Additionally, in order to diagnose the issues with latency, these tests could be repeated without the RF network.
In this case the “off-suit nodes” could be connected directly to the PAS bus and latency would be measured. Also,
monitoring of the network conditions using Wireshark or other devices could eliminate the PAS bus network and
the RF network from consideration as the cause of the large end-to-end system latencies. Such devices may prove
useful in determining if the PAS bus and the radio are meeting their allocations of the overall end-to-end latency
requirements.
The current version of GStreamer used in the off-suit nodes and on the PAS Audio assemblies is version 0.10.
However, version 1.2 of GStreamer software now exists. Reports indicate that the newer version of GStreamer has
fixed many bugs in the GStreamer buffering system. The older version should be replaced with the newer version.
Finally, moving to a different set of software or hardware may be needed in order to resolve system latency issues
in the current Audio assembly. The GStreamer software is intended for use with ‘generic’ streaming media and is
intended to work well with either video streams, audio streams, or blended streams. Moving to a set of software that
is more specific to only streaming audio may produce better results. For example, the BIONET ® software [10] used
in the radio network for the Desert Research and Technology Studies (DRATS) assembly was written specifically
for streaming audio. System latencies in the DRATS subsystem were not considered to be excessive [11]. Alternate
hardware technology includes consideration of an alternate processor, or more likely, an alternate set of peripheral
chips (e.g. Ethernet Physical Transceiver (PHY) chips) or an Field Programmable Gate Array (FPGA) implementation
of streaming audio for the PAS assemblies. Such software changes may provide a remedy for the gradual degradation
that is observed with audio quality as well as the eventual crashing of the audio streams on the inbound PAS audio
assembly. As large, yet infrequent, variations in channel latency may not be detected by speech intelligibility testing,
further investigation is needed to determine if these variations are tolerable and, if not, changes in channel latency
should be addressed by separate requirements.
5.5.4. Inbound Audio Stream MixingThe purpose of this test was to demonstrate effective movement of compressed streaming audio from the off-suit
nodes to the PAS Audio assembly and that these streams are properly mixed and muted according to switch settings
sent from the CWCS assembly. Compressed streaming audio data created in each of the off-suit nodes, moves through
the wireless network and RF interface and then through the PAS bus to the PAS Audio assembly, where it is decoded,
mixed with other streams and played through the speakers of the inbound portion of the PAS Audio assembly. This
test demonstrated that the PAS Audio assembly meets both the inbound portion of requirement R2.1.420, but not the
outbound portion, and meets R2.1.413 requirement with a modification to four channels instead of five.
• R2.1.420 (PAS2009) Full Duplex Voice Communication The PAS Audio Assembly shall provide full-duplex
voice communications to the crewmember.

• R2.1.413 (PAS2002) Audio Mixing. The PAS Audio Assembly shall mix audio signals from up to five separate
sources - To Be Resolved (TBR) <TBR-PAS-005>
Subsystem components (including the PAS Audio assembly, COMM assembly, radio nodes, etc.) were powered-
on and set-up per standard procedures including using a commanded suit pressure of 10 psia, 500 ms for jitter buffer
size and 4096 bytes for GStreamer Block size. Wireshark software was used for monitoring network traffic. Audio
streams were created by each off-suit node and the mute flags and volume controls were exercised using the CWCS
GUI for each inbound channel.
Audio from each off-suit node was observed. Response to changes in volume controls and muting buttons in
each of the channels was appropriate. The audio signals were intelligible. No discernible artifacts or distortion were
observed on the PAS audio output under nominal conditions. The test is considered successful. However, during
subsystem setup it was observed that the entire inbound PAS Audio assembly would cease to function in cases where
a stream from an off-suit node would cease for reasons such as unintentional power-down or disconnection from the
network. Such a lack of robustness in the overall audio function is not desired.
In order to remedy the crashing of the inbound audio processing the addition of messaging from the off-suit nodes
or COMM assembly to the inbound audio process indicating the absence of transmissions may help. General changes
of inbound audio GStreamer configuration may also help here. The crashing of the inbound audio processing was
unexpected. Therefore, it is recommended that a requirement be added for robust operation of the audio system
in cases where inbound audio streams stop and start spontaneously. Alternately, existing requirements regarding
streaming audio could be rephrased to explicitly include cases in which operation must seamlessly resume and recover
following network interruption. The mixing tests included no cases in which combinations of inbound streams are
observed. In the future, the audio mixing tests should not be restricted to observing a single audio stream at a time.
For four channels there are 15 different non-trivial combinations of audio streams. Some subset of these combinations
should be tested.
5.5.5. Audio TonesThe purpose of this test was to demonstrate effective creation of tones as commanded by the CWCS assembly.
Various conditions exist where starting and stopping of the tones is commanded by the CWCS assembly5. This test
demonstrated that the PAS audio assembly meets requirement R1.110.
• R1.110 Performance Warnings. The AEMU shall detect the following failure conditions and alert the crewmem-
ber of the failure by a simultaneous audible tone and display. The tone shall deactivate after 10 seconds and
shall be common to all warning conditions: 1) High oxygen flow, 2) Low Suit pressure, 3) Low vent flow,
4) Low water flow, 5) Low feed-water quantity, 6) High CO2 and 7) Battery Volts low.
For the Tone Control tests, all tones should be generated per Table 3. Testing of tones was done with all inbound
audio channels muted. The tone priority function was also tested during this test. Tones of a higher priority must
preempt tones of a lower priority and tones of a lower priority must not preempt tones of a higher priority. Note, that
a redundant interface between the audio sub-assembly and the CWCS sub-assembly was not implemented. As such,
the function of a second communications pathway between CWCS and audio was not tested.
Tone volume should be about 13 dB higher than the assumed NC60 noise profile for inside of the suit, yielding
a required Sound Pressure Level (SPL) of approximately 73 dBA [12]. This was accomplished using an SPL meter
with the volume control set by the CWCS GUI. Data were collected using Wireshark. The volume of the tones
was adjusted to ensure that tones were generated with sufficient volume so that they can be heard above suit noise
level. A shell script program was used on the CWCS GUI computer and the off-suit nodes to generate the appropriate
messages and audio streams for the test. The appropriate responses to tone messages received by the inbound PAS
Audio assembly is observed by listening to the inbound PAS audio.
The subsystem setup was performed according to test procedure found in the Appendix A. The required SPL of
the tones was achieved. With the exception of the stopping of the warning tone, all tones were observed as expected.
For the particular GStreamer pipeline architecture used during this test, the warning tone seemed to “slow down” and
stop at about 3.5 minutes into its required duration of 5 minutes. Status tones were able to pre-empt information tones
and alert tones were able to pre-empt status tones.
5NOTE: The warning and alert tones characteristics are from Table 10.8-3 Shuttle Specifications for Class 1-3 Alerts.

Table 3: Implementation of audio alert tones for PAS audio assembly
Tone (Priority
Order is Low
to High)
Type Duration When Activated
Information
Single single
tone, 400Hz,
with 50%
duty cycle (on
1s, off 1s)
30 seconds,
interrupt-able
by
acknowledge
message
Fault message from buddy crew member displayed on
Informatics display
(30 seconds unless unless acknowledged by crew mem-
ber)
Status
Continuous
single tone of
1100Hz,
5 seconds
• Failed Leak Check
• Failed Automated Checkout
• Secondary O2 Time Left < 6 Minutes
Alert
Continuous
single tone of
550Hz
0.5 seconds
• Start of Leak Check
• Start of Automated Checkout
• Successful Leak Check
• Successful Automated Checkout
• Airlock pressure, P = 6.0 during depress
• Airlock pressure, P= 4.0 during repress
• Airlock pressure, depress & repress start/stop
Warning
Warble,
Siren, varying
frequency
from 666Hz
to 1470Hz
and return
over 5 second
period
5 minutes,
interrupt-able
by acknowl-
edge message
• BITE Circuitry Activated
• Fault message displayed on text display
(5 min. unless DISPL switch is pressed to PROC
position or anomaly disappears)
It is recommended to debug the warning tone duration issue. General changes to inbound audio GStreamer con-
figuration may help here. It is also recommended that requirements for SPL of tones and tone priority be developed.
Consideration of a second communications path between the audio sub-assembly and CWCS should be developed
and tested. Testing of the redundant interface should include disabling each interface, in turn, and checking for proper
operations of the tone function. Procedures for disabling the Audio/CWCS interface should, at a minimum, include a
physical disconnection of the each cable that carries data between CWCS and the audio sub-assembly.

5.5.6. Audio Outbound Pressure CompensationThe purpose of this test was to demonstrate effective compensation for variations in suit static pressure. Compen-
sation for the effects of static pressure on crewmember vocalization is required by requirement R2.1.412.
• R2.1.412 (PAS2001) Suit Pressure Audio Compensation: The PAS Audio Assembly shall compensate for vari-
ations in crewmember speech level associated with changing suit pressure levels.
Data in Clark et. al.r “The Effects of High Altitude on Speech” [12] indicate that the crewmembers speech in
SPL reduces by about 15 dB as the altitude changes from sea level to an altitude of 30000 ft. The corresponding
change in static pressure is 14.7 − 4.3 ≈ 10 psia. Data discussed in the Clark paper also indicate that changes in
vocalization level vary in direct proportion with changes in static pressure. The pressure compensation function, Gpc,
counteract losses in vocalization level for static pressure levels below atmospheric and pass signals unchanged at
normal atmospheric conditions. The gain (in dB) needed to counteract the reduced SPL brought on by lower static
pressure is, therefore: Gpc = (14.7 − P) ∗ 15/10, where P is the in-suit pressure (in psia). The essential feature of
this function is that a drop of 1 psi in static pressure produces a 1.5 dB increase in signal gain. Extension of this
function beyond hyperbaric conditions provides attenuation, but data is not available for vocalization in hyperbaric
environments. As such, providing attenuation is not an unreasonable approach. This pressure compensation gain is
implemented in the outbound audio stream of the PAS Audio assembly. While pressure compensation is, currently,
only implemented as a broadband gain (not frequency-dependent) future versions will include linear filtering of the
outbound signal to more fully compensate for the effects of varying static pressure on crewmember vocalizations.
Testing was accomplished by simulating changes of the in-suit static pressure level. In this test the CWCS as-
sembly sent suit pressure messages to the PAS Audio assembly. The changes in the level of the audio stream coming
from the PAS outbound Audio assembly were observed with every CWCS GUI pressure change. During the test, a
constant tone at a constant SPL into the PAS outbound audio stream was maintained by placing the microphone of the
PAS outbound Audio assembly in a microphone calibrator shown in Figure 8(a). The microphone calibrator produces
a 1 kHz tone at 94 dB SPL. Also, the volume control of the off-suit node was kept at a fixed level. The level of the
outbound signal was, therefore, only dependent on the pressure compensating gain applied to the outbound channel by
the PAS assembly. Again, the gain applied to the microphone varied inversely with suit pressure. If the suit pressure
is reduced, the gain of the microphone is increased to compensate. If the suit pressure is increased, the gain of the
microphone is reduced. This is intended to provide a constant SPL from the microphone, regardless of suit pressure.
Observations showed a good correlation of speaker SPL versus commanded static suit pressure that closely matched
the expected results from the Clark paper.
A sound pressure meter shown in Figure 8(b) was used to measure the level of the outbound signal at a distance of
1m from the four off-suit nodes (192.168.3.111 through 192.168.3.114) that produced the aural signal. The measured
SPL of output audio produced by the off-suit node is shown by the blue line, with measured data points, in Figure 9.
Also included on Figure 9 is an affine (linear) function that is fit to the data and its associated formula.
The observed pressure compensation system response follows the expected affine function and provides a slope of
-1.4464 dB/psi which is very close to the slope of the pressure compensation gain function of -1.5 dB/psi. The essential
feature of the pressure compensation function is, thereby, demonstrated. The “intercept” of +98.2 dB depends on
internal system gains internal to the PAS Audio assembly and the off-suit node and volume control of the audio output
of the off-suit node. In spite of the high level of acoustic SPL used for the outbound PAS signal (94 dBA) there is no
evidence that the pressure compensation has saturated the dynamic range of the system.
This test successfully demonstrated gain-only pressure compensation for sub-atmospheric static pressure levels.
Follow-on development will include frequency-dependent pressure compensation. Testing of the frequency-dependent
compensation function will need to be developed and performed to demonstrate compliance. Future testing should
include better testing for saturation (e.g. measurement of Total Harmonic Distortion (THD)). However, such testing
may be included in speech quality testing. Also, verification of the extension of the pressure compensation law
to hyperbaric conditions should be made. Requirements for pressure compensation should be modified to discuss
hyperbaric conditions (if appropriate). Detailed requirements on processing could be developed based on the Clark
paper6 and/or additional testing with people in altitude chambers.
6The Clark paper is more than 65 years old.

(a) Microphone Calibrator (b) Pressure Sensor Meter
Figure 8: Audio Test Equipment
Figure 9: Commanded Audio assembly output level. Acoustic SPL input to PAS Subsystem and output volume control were held constant
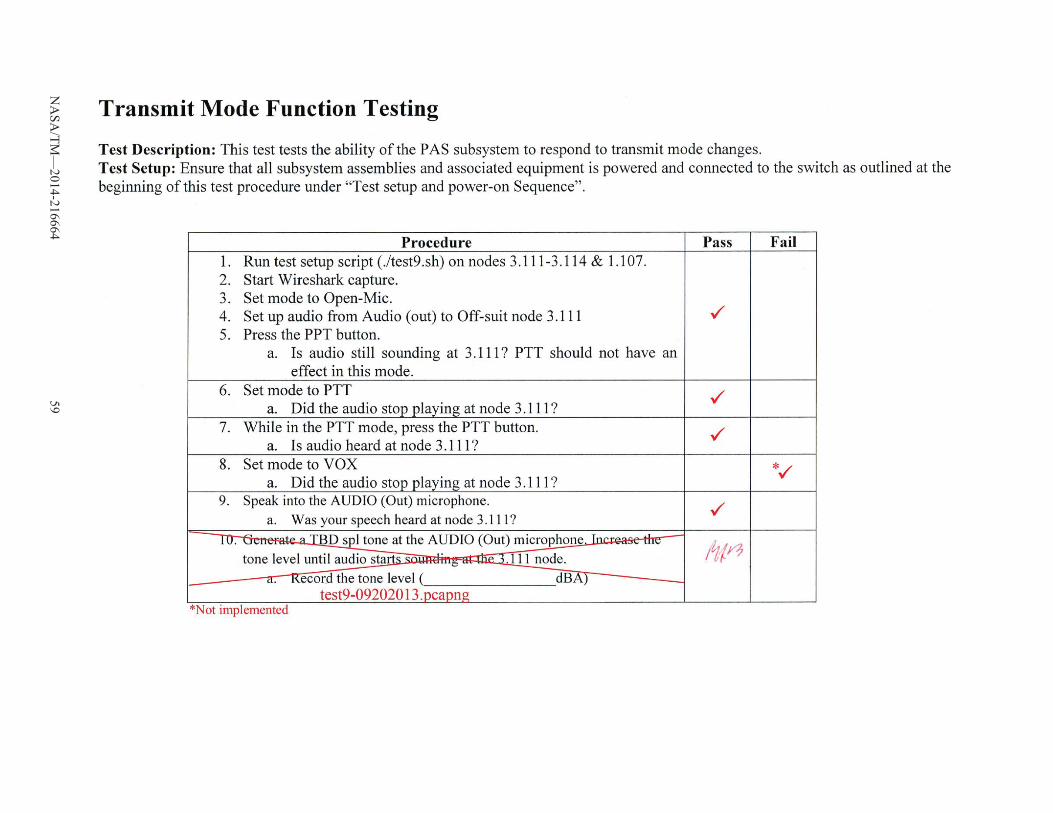
5.5.7. Transmit Mode FunctionsThe purpose of this test was to demonstrate effective voice mode functioning of the outbound PAS Audio assembly
per requirement R1.103.1.
• R1.103.1 Voice Modes: The voice transmission system shall have push-to-talk, voice activated, and off (receive
only) modes that are controllable by the crewmember.
Three different modes of the audio are required including Voice Operated Switch (VOX), Push-To-Talk (PTT)
and Off (receive only) mode. The outbound audio mode is controlled through switches on the Audio assembly. The
testing consists of generating audio streams on the outbound PAS Audio assembly and observing the audio stream
at an off-suit node while exercising the transmit modes and PTT switches. Implementation of the transmit mode
in the outbound audio assembly included a PTT mode as required. However the Off (receive only) mode was not
implemented. In place of the Off (receive only) mode, an ‘Open Mic’ mode was implemented. This was done because

of the fact that an Offmode would be redundant to the PTT mode for the case in which the PTT switch (or microphone
switch) was not depressed.
Also, as the PTT switch is considered to be a momentary (push button) type of switch (as would be the case
for a mobile radio), the default position is the unpressed (or unkeyed) position. Therefore, it was decided to adopt a
keyed-mic mode function switch position to account for situations when one needs to key the microphone for extended
periods without holding the momentary push-button down for those extended periods and freeing one’s hand for other
uses. In the case where the PTT switch is of the push-push or toggle variety (as is normally the case for a speaker
phone) the third (keyed-mic) mode is unnecessary.
When the audio mode was set to the open-mic mode the PTT switch had no effect on the observed audio stream.
When the transmit mode switch was set to the PTT mode setting the PTT switch blocked the audio stream when it
was not engaged and allowed audio to be played on the off-suit nodes when engaged. When the transmit mode was
set to VOX, audio flowed regardless of speech level. The testing for the keyed-mic and PTT modes was successful.
For these PAS 1.0 subsystem integration tests, VOX mode had not yet been implemented. Thus, testing of the VOX
function indicated a failure.
With the advent of a modern Voice-Over-IP (VOIP) style of digital voice transmission implemented on a modern
space suit, there are numerous possibilities for transmit mode control. Indeed the use of digital telephony allows
for the case that appropriate control of the suit audio outbound stream is accomplished entirely on the receive side
of the loop and on a receiver-by-receiver basis albeit at the expense of using additional bandwidth (i.e. more and
continuous bits on the RF link). For such a system there would be no need for on-suit controls like the transmit mode
switch or the PTT switch. Alternately, a wide array of transmit mode control possibilities could be implemented
with mode selecting using a soft-switch (or menu) in combination with a single, hardwired transmit control switch.
Therefore, Requirement R1.103.1 should be revisited and considerations taken to modernize the capabilities to reflect
those available in newer VOIP technologies.
5.5.8. Audio Post Test ResultsMany of the audio tests were unsatisfactory. Many of those results had to do with misunderstanding of the
GStreamer framework and the particular implementation used. Following the initial tests, the audio pipeline was
redesigned. The final architecture is shown in Figure 10.
For the audio voice streams, instead of having two audio mixers inline as in the original implementation shown
in Figure 5, four independent audio pipelines were implemented along with one pipeline for the caution and warning
tones. These pipelines consisted of a UDP receiver and filter element followed by a jitter buffer and simple queue.
The jitter buffer smooths out any delay variations that may occur in the network. In our case, most of those variations
would be a result of packet retries and congestion on the wireless link. The GSteamer depayload element removes
Ethernet framing and presents the raw payload to the uLaw decoder which decodes the G.711 audio stream. The
volume is then adjusted and the individual pipeline passed to the Linux kernel.
The caution and warning tone pipeline consists of a Tone Source module, Ts, to generate caution and warning
tones and a volume control module. The Tone Source module is a program written in C that generates tones using
the GStreamer audiotestsrc plugin. The audiotestsrc plugin can be used to create audio test signals of given frequency
and volume.
With this implementation, there were no distortions or breakups of voice or audio tones over time. Thus, almost
every anomaly for the implementation in Figure 5 was fixed with the exception of delay. The implementation still
required a significant jitter buffer resulting in unacceptable delay. Furthermore, there were still intermittent disconti-
nuities in delay where a jump of 20 msec would periodically occur.
A few questions remain:
1. Why did the alternate inbound implementation work better than the original? and
2. Why are there still problems with delay and delay discontinuity?
Regarding the first question, it appears that the GStreamer audio mixer takes each separate pipeline and time aligns
the audio streams then recombines them into a single stream. This takes significant processing - particularly when
done in software as is the case here. It appears the hardware used did not have sufficient processing power to handle the

audio mixing. The explanation for delays and jumps in delay remains the same as presented in the latency discussion
of section 5.5.3 Also note, that a search of user groups and bug reports indicated that there were numerous known
bugs in the GStreamer jitter buffer implementation in the software version utilized, GStreamer 0.10.36. Whether or
not this contributed to the problems originally observed is purely conjecture.
Figure 10: Alternate Inbound Implementation
5.6. Video Stress Test
The intent of the Video Stress Test was to examine network behavior during periods of highest data loading
caused by video streaming. Video stream rates are expected to be as high as 15 Mbps for high quality HD at 30
fps. These rates are orders of magnitude higher than all other bus traffic that may exist in the currently envisioned
PAS 1.0 subsystem. As such, video has a greater potential to interfere with other system traffic. In order to identify
possible interactions, a video stream was sent over the GigE bus while other test are being performed to ensure there
is sufficient bandwidth on the bus to allow all necessary communication between subsystems and that the quality of
communications remains intact.
The video source was a SANYO VCC-HD4600 high definition IP Camera. The Sanyo camera was chosen as a
close functional and performance approximation to the camera currently envisioned for the suit. The purpose of the
suit camera is for record keeping and to provide situational awareness to ground support and other mission assets
during EVA. It could also be used for public relation events and potentially for procedure close out verification of
EVAs. Thus with a wide range of uses, the camera must have broad flexibility in resolution, frame rate, and the ability
to generate multiple video streams simultaneously.
The Sanyo camera was attached to the NetGear Gigabit switch, the PAS bus, on one of the available ports. It was
given address 192.168.1.106. The video sink (or destination) was displayed on a computer attached to the NetGear
Gigabit Ethernet switch on another port. It was given address 192.168.1.116. The SANYO camera provided client
software both to configure the camera and to display the video via a Web-based application interface.
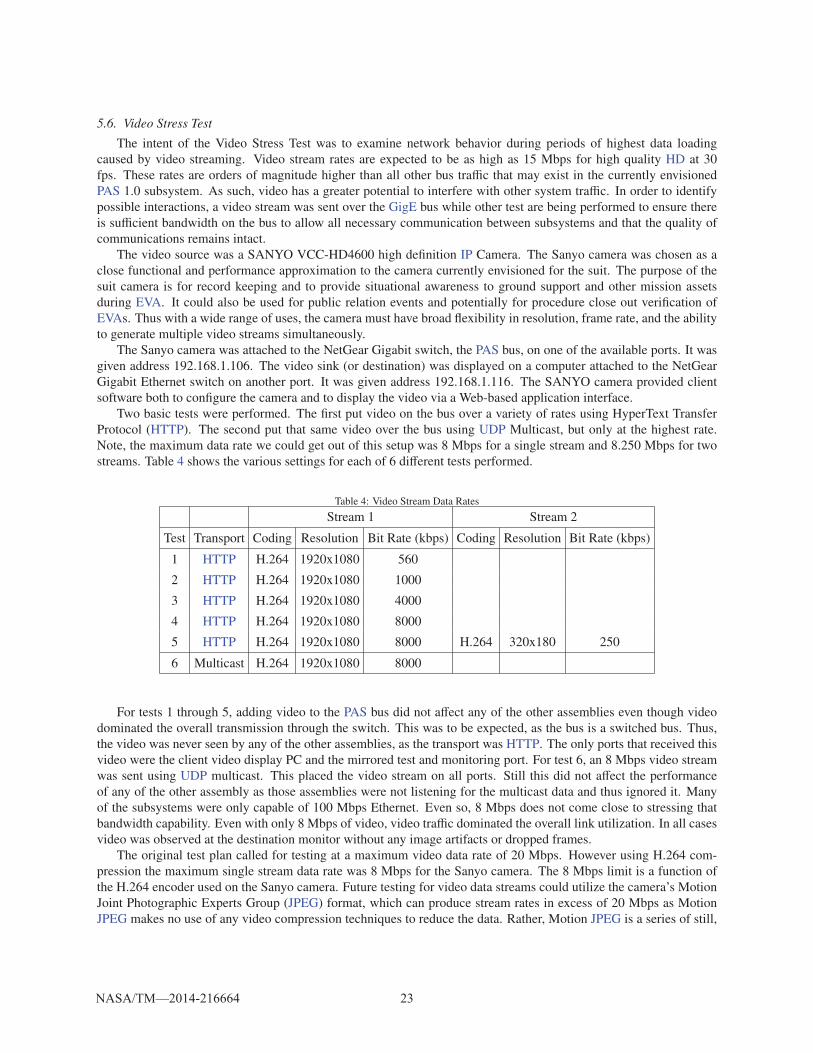
Two basic tests were performed. The first put video on the bus over a variety of rates using HyperText Transfer
Protocol (HTTP). The second put that same video over the bus using UDP Multicast, but only at the highest rate.
Note, the maximum data rate we could get out of this setup was 8 Mbps for a single stream and 8.250 Mbps for two
streams. Table 4 shows the various settings for each of 6 different tests performed.
Table 4: Video Stream Data Rates
Stream 1 Stream 2
Test Transport Coding Resolution Bit Rate (kbps) Coding Resolution Bit Rate (kbps)
1 HTTP H.264 1920x1080 560
2 HTTP H.264 1920x1080 1000
3 HTTP H.264 1920x1080 4000
4 HTTP H.264 1920x1080 8000
5 HTTP H.264 1920x1080 8000 H.264 320x180 250
6 Multicast H.264 1920x1080 8000
For tests 1 through 5, adding video to the PAS bus did not affect any of the other assemblies even though video
dominated the overall transmission through the switch. This was to be expected, as the bus is a switched bus. Thus,
the video was never seen by any of the other assemblies, as the transport was HTTP. The only ports that received this
video were the client video display PC and the mirrored test and monitoring port. For test 6, an 8 Mbps video stream
was sent using UDP multicast. This placed the video stream on all ports. Still this did not affect the performance
of any of the other assembly as those assemblies were not listening for the multicast data and thus ignored it. Many
of the subsystems were only capable of 100 Mbps Ethernet. Even so, 8 Mbps does not come close to stressing that
bandwidth capability. Even with only 8 Mbps of video, video traffic dominated the overall link utilization. In all cases
video was observed at the destination monitor without any image artifacts or dropped frames.
The original test plan called for testing at a maximum video data rate of 20 Mbps. However using H.264 com-
pression the maximum single stream data rate was 8 Mbps for the Sanyo camera. The 8 Mbps limit is a function of
the H.264 encoder used on the Sanyo camera. Future testing for video data streams could utilize the camera’s Motion
Joint Photographic Experts Group (JPEG) format, which can produce stream rates in excess of 20 Mbps as Motion
JPEG makes no use of any video compression techniques to reduce the data. Rather, Motion JPEG is a series of still,

complete images. The resultant data stream has a relatively high bit rate or low compression ratio for the delivered
quality compared with video compression standards such as Motion Picture Experts Group (MPEG)-4 and H.264 [13].
The original test plan called for evaluation using two simultaneous video streams on the network, which would
simulate a configuration where the camera is streaming video to more than one node. Attempts to establish two
simultaneous video stream links was not successful, due to a procedural misunderstanding and was not tested. If the
PAS architecture continues to evolve with configurations where two simultaneous video steam links are likely, then
the test could be repeated.
The video source was a relatively inexpensive IP camera used mainly for commercial surveillance. It was con-
venient to use as it has an Ethernet connection and web-based applications for display and configuration. But, it has
limitations in simulating the maximum desired data rates in H.264 format. As an alternative to using an IP Camera,
basic bus stress testing could be done using IPerf [14], nuttcp [15] or ttcp [16] sending UDP multicast traffic. This
would provide better control regarding data rates and data-rate range. A switched fabric will definitely isolate the
video traffic from subsystems that do not need to see it. In future iterations of the PAS data bus, it may be more ap-
propriate to simply put the video traffic on its own link, as high definition video will likely be sent directly to storage
for retrieval at the conclusion of the sortie. A dedicated link between video and storage may allow the voice and
messaging traffic to be sent between subsystem over a much lower-speed and lower-power bus.
5.7. Network PerformanceNetwork throughput, jitter, and packet/datagram loss are primary metrics for evaluating the performance of a
network. Network throughput is a measure of the maximum data rate that may be achieved over the network. Jitter
is the time-derivative of the arrival time of the network packets/datagrams, which is important for streaming data.
Datagram loss is also measured, which is a percentage of the UDP datagrams [17] that were lost during transmission.
The following network performance tests used an open-source tool called IPerf [14] to obtain these values for the PAS
system, which flooded the network with various prescribed amounts of UDP/IP traffic in order to compute the metrics.
Three machines were used for these tests; the radio testbed, a computer on the wireless network that represents another
suit or an access point, and a computer on the PAS bus that represents any PAS assembly. Note, the 802.11 wireless
network was in ad hoc mode (a.k.a independent basic service set (IBSS)) [18]. Various configurations of client/server
pairs were tested.
The following tables contain the network performance measurements for the various configurations of tests. For
each network configuration, several throughput levels were attempted, and these levels were selected to demonstrate
the limits of each link.
Table 5 contains the measurements of the Ethernet link from the computer that emulated a PAS assembly to the
Radio Testbed. As expected of any Ethernet link, the jitter and loss increase as the network traffic is increased due
to the buffering and receive processing of the data (e.g. between 192.168.1.122 and 192.168.1.105 in Figure 1). The
relatively low throughput for this test shows that the BeagleBone is not capable of receiving data from the network
at the full advertised rate of 100 Mbps. Table 6 shows the same measurements as the first test, but in the reverse
direction. The limiting factor in this test was how fast the BeagleBone can generate network traffic. The Personal
Computer (PC) on the receiving end had no issues processing the traffic. Table 7 is a test in which the first two tests
are performed simultaneously. Since these links are full-duplex, the network traffic flowing in one direction does not
affect the network performance in the other direction.
Table 5: Network Performance Results, PAS Assembly to Radio Testbed
Attmp’d Throughput (Mbits/s) 15 30 45 60
Measured Throughput (Mbits/s) 13.1 24.7 34.7 6.0
Jitter (ms) 0.02 0.02 8.30 493.10
Datagram Loss 12% 18% 21% 89%
Tables 8-10 show the results of tests similar to those in the first three tables, but these three tests use a PC connected
to the Radio Testbed over the wireless link instead of the PAS bus (e.g. between 192.168.3.111 and 192.168.3.105

Table 6: Network Performance Results, Radio Testbed to PAS Assembly
Attmp’d Throughput (Mbits/s) 15 30 45 60
Actual Throughput (Mbits/s) 14.9 29.2 42.1 50.9
Jitter (ms) 0.04 0.04 0.03 0.07
Datagram Loss 0% 0% 0% 0%
Table 7: Network Performance Results, Bi-directional between Radio Testbed and PAS Assembly
Attmp’d Throughput (Mbits/s) 15 30 45 60
Fwd. Throughput (Mbits/s) 13.4 23.6 35.8 4.31
Return Throughput (Mbits/s) 15.0 30.0 45.0 60.0
Jitter (ms) 0.02 8.98 0.02 555.90
Datagram Loss 11% 19% 21% 93%
(COMM) in Figure 1). Notice that the jitter values are generally higher over wireless links and the throughput
is limited by the mode in which wireless network is operating. This was expected due to the nature of wireless
networking and 802.11. Jitter is introduced because datagram transmissions are often delayed by random periods
of time while the wireless channel is occupied by another wireless device. The throughput is limited by the signal
strength of the links. The higher attempted throughput cases in Table 9 indicate that the BeagleBone platform was not
as efficient in handling heavy traffic loads as were the more computationally powerful netbooks.
Table 8: Network Performance Results, Wireless Node to Radio Testbed
Attmp’d Throughput (Mbits/s) 5 15 30
Actual Throughput (Mbits/s) 4.2 4.5 4.39
Jitter (ms) 0.90 9.96 14.18
Datagram Loss 2% 30% 6.3%
Table 9: Network Performance Results, Radio Testbed to Wireless Node
Attmp’d Throughput (Mbits/s) 5 15 30
Actual Throughput (Mbits/s) 5.1 0.93 0.71
Jitter (ms) 6.09 50.82 48.50
Datagram Loss 0% 6% 4.8%
Tables 11-13 show the results of testing the system end-to-end with the Radio Testbed as the middle node between
the wireless netbooks and the PAS bus PC (e.g. between 192.168.3.111 and 192.168.1.122 in Figure 1). The lower
data rates of the wireless interface limit the end-to-end throughput. An interesting case is shown in Table 12. When
12 Mbps of traffic was sent over the bus to the radio for re-transmission over the wireless link, the data was lost due
to the mismatch between wired and wireless data rates. Information was being sent to the Radio Testbed faster than it
could re-transmit it over the wireless link, therefore the Radio Testbed experienced buffer overflows.

Table 10: Network Performance Results, Bi-Directional between Radio Testbed and Wireless Node
Attmp’d Throughput (Mbits/s) 5 15 30
Fwd. Throughput (Mbits/s) 4.3 3.8 5.1
Return Throughput (Mbits/s) 4.5 4.0 5.3
Jitter (ms) 21.35 14.01 13.03
Datagram Loss 3.4% 4.6% 2.8%
Table 11: Network Performance Results, Wireless Node to PAS Assembly (through Radio Testbed)
Attmp’d Throughput (Mbits/s) 4 8 12
Actual Throughput (Mbits/s) 4.1 5.3 5.1
Jitter (ms) 3.05 0.09 12.01
Datagram Loss 0.76% 0.49% 0.50%
Table 12: Network Performance Results, PAS Assembly to Wireless Node (through Radio Testbed)
Attmp’d Throughput (Mbits/s) 4 8 12
Actual Throughput (Mbits/s) 4.0 7.9 0.5
Jitter (ms) 7.06 6.52 31.71
Datagram Loss 0.24% 0.03% 78%
Table 13: Network Performance Results, Bi-Directional between PAS Assembly and Wireless Node (through Radio Testbed)
Attmp’d Throughput (Mbits/s) 4 8 12
Fwd. Throughput (Mbits/s) 4.0 4.2 4.8
Return Throughput (Mbits/s) 4.0 4.23 4.86
Jitter (ms) 3.92 12.83 0.95
Datagram Loss 0.47% 1.9% 1%
Overall, the Radio Testbed successfully exercised all of the functionality that was required during the integration
testing campaign. The PAS bus and the wireless network were successfully bridged, and the Radio Testbed hardware
was more than sufficient to handle the network traffic flows that were presented to it during these tests. The Google
protocol buffers and ZeroMQ software worked well and were a very efficient means of providing a PAS telemetry
capability to the subsystem.
The following general conclusions can be drawn from the tables above:
• The wireless link has a much smaller bandwidth than the PAS switched Gigabit Ethernet bus, but at this point
in the project’s development, it would be wise to provide for growth capabilities for both the PAS bus and the
wireless link. It is not clear if 802.11 wireless will be fast enough, and the PAS bus might require significantly
higher data rates than the COMM assembly or the Radio. The current implementation has not demonstrated a
need for higher bus rates, but potential unknowns that may require more bandwidth include high and low rate

video streams, streaming audio, and any high speed controls that may need to be addressed.
• The wireless network deployed was configured to automatically adjust link speed. It was operated at a raw bit
rate between 5 Mbps and 11 Mbps. Actual wireless network throughput is less than the raw bit rate.
• The implementation details of the Ethernet protocol in hardware and software play a significant role in deter-
mining network performance. Special attention needs to be paid in multi-system configurations to ensure that all
implementations are performing as expected. It is not enough to just specify that the project is using Ethernet.
Variations in buffer sizing, clock speed, and power management, for example, need close attention. Tables 5
and 6 show that the computer used to emulate a PAS assembly was able to successfully receive as much data as
the 100MB/s Ethernet link can provide, whereas the Radio testbed, while supporting 100MB/s Ethernet, begins
to drop datagrams as traffic increases. It is recommended for future testing that these performance measures be
examined, and if possible potential bottlenecks should be eliminated by adjustment of implementation specific
parameters.
• The Ethernet link is susceptible to significant data loss during high traffic loading. This is most likely due to
the implementation issues described in the previous conclusion. The wireless link did not show this property
because the limited data rates of the 802.11 protocol were small enough as to not stress the processor and data
buffers on the receiver side. It is important to note, however, that this may not be true for future versions of the
radio testbed if the processing capability is reduced.
• The 2-hop test results in Tables 11 - 13 show that the network retains the worst properties of both links; namely,
reduced throughput when the traffic originates over the wireless network and high datagram loss when the PAS
bus sources much more data than the wireless network can handle.
• A wireless interface should be included to emulate a habitat, spacecraft, or another suit and serve as a data sink
for PAS telemetry that is meant to be sent off-suit.
• This round of tests featured a single 802.11 wireless interface. The addition of a second wireless interface will
be necessary in order to follow the current AEMU Radio design concept. A lower-rate interface will carry voice
and telemetry traffic flows to and from the suit, and the higher-rate 802.11 interface will handle video, data
transfers, and act as a contingency interface if the lower rate interface is not operating properly. This would
also facilitate the testing of actual suit network traffic, which was not fully tested during these tests. Future tests
should include the simultaneous wireless transmission of suit telemetry, multiple voice streams, and video.
5.8. Bus Traffic Analysis
For each major test performed for the PAS Interface Testing, data was capture on the Gigabit Ethernet Bus (GigE)
using Wireshark® [8] and saved in a file for analysis and, if so desired, playback. Wireshark is a network protocol
analyzer that enables a view into what is happening on a network. For convenience and ease of use, analysis was
performed using a third party software package, Cascade Pilot® from Riverbed Technology, Inc.
Only three tests are of interest for this analysis: Network Connectivity Tests, Audio Inbound Tests, and Video
Tests. All other tests had similar traffic patterns to at least one of these three tests.
The Network Connectivity Test consisted of each assembly performing Ping tests. The point of this test is to
ensure all assemblies can communicate bidirectionally to each other.
Rather than showing Network Connectivity Tests, which would have all traffic between hosts about equal, Fig-
ure 11 shows the various IP conversations that occurred during the Unicast Video Test. It shows all IP hosts that were
communicating. The size of the host is relative to the amount of data it has transmitted and the size of the connection
line is relative to the amount of data transmitted between those hosts. In this example, the HTTP video is being
transmitted between the camera, 192.168.1.106 and the display computer, 192.168.1.116.
The next test of interest is the Inbound Audio Stream Mixing Test found in section 2.8. In Figure 12, four G.711
channels of inbound audio and one G.711 channel of outbound audio are shown being transmitted over the bus as well
as one LPCM audio stream from the audio processing outbound board to Informatics. No video is running during
this test. Note in Figure 12 that the five channels of audio only consume approximately 700 kbps of bandwidth. The

Figure 11: Unicast Video Test
“Unknown” traffic here is the various ZeroMQ Event and Status messaging being transmitted between each of the
PAS assemblies. Thus, the overall total bandwidth on the bus, minus video is less than 1 Mbps.
Figure 13 shows all the traffic on the bus over time. Here, two video streams are being sent, one is 8 Mbps while
the other is 250 kbps. It is obvious from Figures 13 and Figure 11 that the video data dominates in the PAS bus traffic.
This particular video data was sent via multicast whereas the video data from Figure 11 was sent via unicast. The
purpose of sending multicast traffic was to ensure it arrived on every switch port and was therefore seen by every
assembly. This exercise was performed to determine if the streaming video on the bus would have any adverse effects
on the assembly data traffic. It did not. This was because even though the traffic was on each link, except for the video
monitoring system, all other assemblies were not subscribed to this multicast traffic and thus ignored it. The audio
traffic was running simultaneously during this test and was also unaffected by the video traffic.

Figure 12: Inbound Audio Stream Mixing Test

Figure 13: Subsystem traffic and Two Multicast Video streams

6. Summary and Conclusions
These subsystem integration tests provide useful input and insight into the next iteration of the AEMU. Following
are some of the major conclusions:
• The types of information flow (i.e. messages and telemetry) that need to be passed between subsystems were
identified.
– Google Protocol Buffers (GPB) worked well for construction messages.
– ZeroMQ over TCP worked well as our publish/subscribe middleware.
– Use of GPB and ZeroMQ saved significant programing time as we did not have to reinvent and recode
what was already available.
– GPB and ZeroMQ require significant library support that may not be available for embedded processor or
operating systems that are available on radiation hardened processors.
• Use of GStreamer allowed us to implement a Voice-Over-IP (VOIP) operational system with the time and
resource allocation provided and then test out much of the audio requirements.
– GStreamer requires a reasonable learning curve and has many nuances regarding pipeline construction.
– GStreamer, like many open source software projects, has limited documentation with most support avail-
able via user groups and mail lists.
– GStreamer is quite powerful, but probably but rather code intensive.
• Using a standard bus such as Ethernet, simplifies application layer programming as the drivers and libraries
exist that abstract the datalink layer away.
• Using a share Ethernet bus meant each subsystem had to manage only one interface with the exception of
COMM which, by design, is multi-homed (i.e. it has interfaces on two distinct subnetworks).
• Using a shared Ethernet bus and Internet Protocols (IPs) allowed use of widely available and proven debugging
and analysis tools such as Wireshark.
– Bus debugging, dissecting and analysis tools will be required for whatever future bus architectures may
be deployed. Thus, information must flow in a standardize form in order to develop these tools and have
them work across any deployment.
• More often than not, peripheral support is lacking on development boards processors such as those used in many
of the PAS 1.0 assemblies, thereby reducing the speed and throughput information flow between subsystems.
There following recommendations are a direct result of this testing:
• Investigate other VOIP methods besides GStreamer such as using a simple G.729 encoder and decoder written
in C.
• If GPB and ZeroMQ prove to be too complex for flight implementation, other publish/subscribe methods can
be used.
• Network Time Protocol (NTP) proved to be inappropriate for the AEMU. NTP operates under the assumption
that higher tiered clock data is available to the lower-tiered clocks for long periods of time [7]. Since the
suit electronics are only powered up for several hours at a time, this process is too long and involved for this
application. The behavior of NTP was modified to suit the needs of PAS, but most of these modifications simply
disabled a lot of the advanced functionality of NTP. Thus, the recommendation is to investigate use of the time-
stamp field in the telemetry packet from the COMM subsystem to synchronize the other subsystems as highly
precise time-synchronization currently is not a requirement.

• Consider moving video to its own dedicated high-speed bus thereby allowing all other traffic to flow over a
much slower, low-power bus.
• If using IP, use multicast (one-to-many) instead of unicast (one-to-one) to dramatically reduce voice traffic over
the RF link. In the PAS 1.0 testing, with four end systems, there would be a four times improvement as each
end system only has to send one multicast voice packet destined to four systems instead of four separate unicast
voice packets.

References
[1] W. Ivancic, O. S. Sands, C. J. Bakula, D. Oldham, T. Wright, M. Bradish, J. Klebau, Power, avionics and software communication network
architecture, Technical Memorandum NASA/TM—2014-216628, NASA Glenn Research Center (February 2014).
[2] The intelligent transport layer [cited 13-July-2013].
URL http://www.zeromq.org/[3] Google protocol buffers.
URL https://developers.google.com/protocol-buffers/docs/overview[4] gstreamer.freedesktop.org, Gstreamer open source multimedia framework [cited 2013].
URL http://gstreamer.freedesktop.org/[5] Qt project [cited February 2014].
URL https://qt-project.org/[6] J. Postel, Internet Control Message Protocol, RFC 792 (INTERNET STANDARD), updated by RFCs 950, 4884, 6633, 6918 (Sep. 1981).
URL http://www.ietf.org/rfc/rfc792.txt[7] D. Mills, J. Martin, J. Burbank, W. Kasch, Network Time Protocol Version 4: Protocol and Algorithms Specification, RFC 5905 (Proposed
Standard) (Jun. 2010).
URL http://www.ietf.org/rfc/rfc5905.txt[8] Wireshark [online] (2014 February) [cited February 2014].
[9] Linear pulse code modulation [online] (2014 February) [cited February 2014].
[10] S. Williams, S. Kuzminsky, K. Gifford, Bionet digital communications framework, NASA Tech Briefs 41 (8439).
URL http://www.techbriefs.com/component/content/article/8439[11] A. J. Swank, C. J. Bakula, Eva radio drats 2011 report (NASA/TM—2012-217635).
URL http://ntrs.nasa.gov/archive/nasa/casi.ntrs.nasa.gov/20120013211.pdf[12] K. Clark, H. Rudmose, J. Eisenstein, F. Carlson, R. Walker, The effects of high altitude on speech, The Journal of the Acoustical Society of
America 20 (1948) 776.
[13] Video compression formats [online] (February 2014) [cited February 2014].
[14] Iperf- internet performance (network measurement tool) [online] (2014 February) [cited February 2014].
[15] Nuttcp - new test tcp (network measurement tool) [online] (2014 February) [cited February 2014].
[16] Ttcp - test tcp (network measurement tool) [online] (2014 February) [cited February 2014].
[17] J. Postel, User Datagram Protocol, RFC 768 (INTERNET STANDARD) (Aug. 1980).
URL http://www.ietf.org/rfc/rfc768.txt[18] I. . L. S. Committee, et al., Part 11: Wireless lan medium access control (mac) and physical layer (phy) specifications, IEEE Standard 802 (11).

List of Acronyms
AEMU Advanced Extravehicular Mobility Unit
AES Advanced Exploration Systems
ALSA Advanced Linux Sound Architecture
ARM Advanced RISC Machines
ARQ Automatic Repeat-reQuest
API Application Program Interface
COMM Communication Subassembly
COTS Commercial-Off-The-Shelf
CRC Cyclical Redundancy Check
CWC Caution, Warning and Control
CWCS Caution, Warning and Control System
DRATS Desert Research and Technology Studies
DTS Decode Time Stamp
EMU Extravehicular Mobility Unit
EVA Extravehicular Activity
FPGA Field Programmable Gate Array
GigE Gigabit Ethernet
GPB Google Protocol Buffers
GPU Graphics Processing Unit
GRC Glenn Research Center
GUI Graphical User Interface
gBS GStreamer Block Size
gJBS GStreamer Jitter Buffer Size
HD High Definition
HDTV High Definition Television
HTTP HyperText Transfer Protocol
IP Internet Protocol
IPv4 Internet Protocol version 4
JPEG Joint Photographic Experts Group
JSC Johnson Space Center
LCD Liquid Crystal Display

LPCM Linear Pulse Code Modulation
MPEG Motion Picture Experts Group
MTV Measurement, Test and Validation
NASA National Aeronautics and Space Administration
NTP Network Time Protocol
PAS Power, Avionics and Software
PC Personal Computer
PHY Physical Transceiver
PLSS Primary Life Support Subsystem
POSIX Portable Operating System Interface for Unix (application programming interface)
PTS Presentation Time Stamp
PTT Push-To-Talk
RF Radio Frequency
RTP Real-time Transport Protocol
SPL Sound Pressure Level
TBR To Be Resolved
TCP Transmission Control Protocol
THD Total Harmonic Distortion
UDP User Datagram Protocol
VOX Voice Operated Switch
VOIP Voice-Over-IP
WiFi Wireless Fidelity (a.k.a. Wireless Internet)
WLAN Wireless Local Area Network


Appendix A
Test D
ata


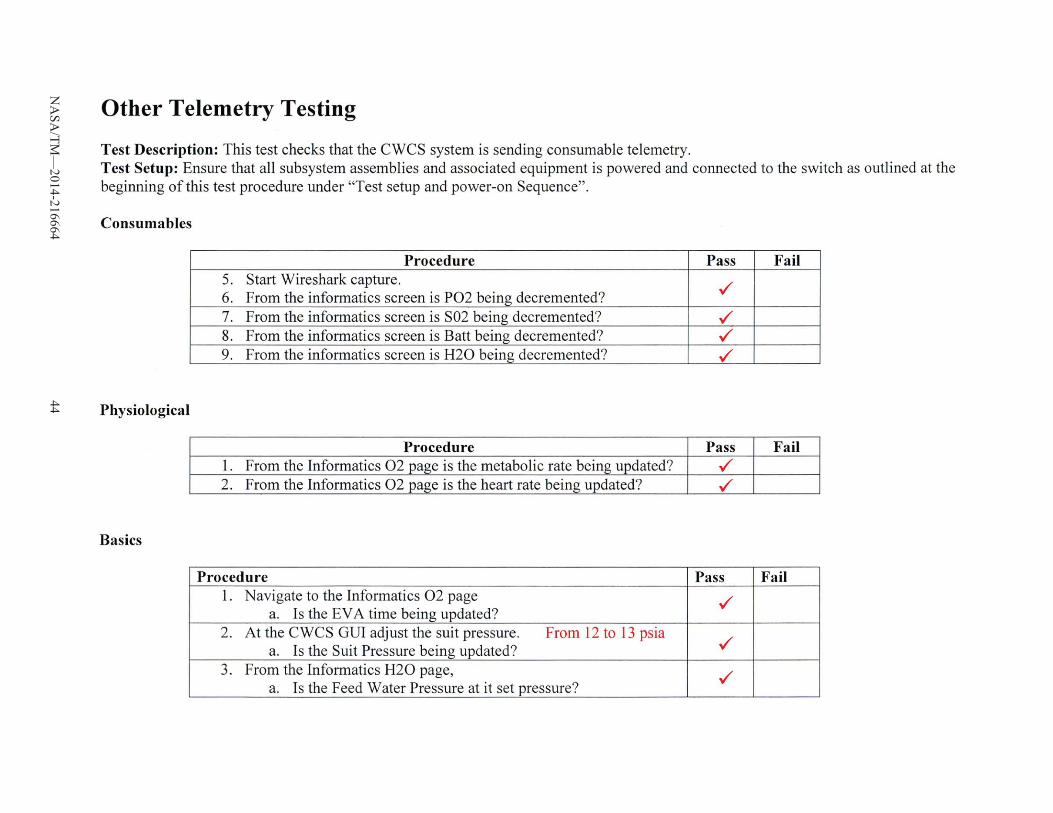


Radio PA2
Block size (Bytes)
Jitte
r Buf
fer S
ize
(ms)
1280 (160 ms)
2560 (370 ms)
4096 (640 ms)
20 283 BU
417 BUB
502 Burst and echo
200 459 Good
480 Good
536 Good
500 736 Good / 909
1.103 3.113
PAS Radio Block size (Bytes)
Jitte
r Buf
fer S
ize
(ms)
1280 (160 ms)
2560 (370 ms)
4096 (640 ms)
20 336 Good
450 Good
538 Good
200 427 Overdrive
571 Good
545 Good
500 762 Good / 817

Jitter Buffer Size (ms)
200 100 100
100
Block size (Bytes)
240 240 280 320
PAS Radio Not bad Not bad Not bad 337 Good
Radio PAS Good Good Good 347 Good
Radio PAS Block size (Bytes)
Jitte
r Buf
fer S
ize
(ms)
160 320 640
50 340 BU
274 Good
328 Good
100 338 BUB
356 Good /
200 286 BUB / /

Block size, 4094 Bytes—Jitter Buffer size, 500 ms
Radio PAS 111 112 113 114
M1 751/917 837 853 898
M2 730/915 822 854 89?
M3 725/915 817 859 955
M4 729/914 819 853 949
M5 729/911 819 836 952
M6 729/912 792 816 950
PAS Radio 111 112 113 114
M1 872 837 845 837
M2 831 837 849 814
M3 830 862 875 848
M4 829 861 873 856
M5 829 864 842 853
M6 808 856 841 851

Latency Measurements from the off-suit nodes to the PAS nodes
Block size 20 50 100 200 500
Rad
io
PAS
160 268,279 281 262 416 753
320 247 235 353 385 743
640 230 303 311 425 748
1280 283 < 1 min 290 393 459 736
2560 417 < 1 min 418 470 480 905
4096 502 < 1 min 488 420 536 909
PAS
Rad
io
160 537,570 425 328 479 890
320 565 ? 309 345 462 731
640 542 ? 327 347 463 764
1280 366 < 1 min 568 363 427 762
2560 450 < 1 min 558 488 571 776
4096 538 < 1 min 606 653 545 817