power and cooling capacity management for data centers systems/wp-150... · power and cooling...
TRANSCRIPT

Power and Cooling Capacity Management for Data Centers
By Neil Rasmussen
White Paper #150

Executive Summary High density IT equipment stresses the power density capability of modern data centers.
Installation and unmanaged proliferation of this equipment can lead to unexpected
problems with power and cooling infrastructure including overheating, overloads, and loss
of redundancy. The ability to measure and predict power and cooling capability at the rack
enclosure level is required to ensure predictable performance and optimize use of the
physical infrastructure resource. This paper describes the principles for achieving power
and cooling capacity management.
©2007 American Power Conversion. All rights reserved. No part of this publication may be used, reproduced, photocopied, transmitted, or stored in any retrieval system of any nature, without the written permission of the copyright owner. www.apc.com WP #150 Rev 0
2

Introduction According to Gartner Inc., most data center operators are unaware of the loading and current power and
cooling capability of their data centers, even at a total bulk level. Installing equipment that exceeds the
design density of the data center, and the resultant stresses on the power and cooling systems, are causing
downtime from overloads, overheating, and loss of redundancy.
CAPACITY MANAGEMENT
ITIL Definition
Providing infrastructure...
At the RRIIGGHHTT TTIIMMEE In the RRIIGGHHTT AAMMOOUUNNTT At the RRIIGGHHTT PPRRIICCEE AND UUSSEEDD EEFFFFIICCIIEENNTTLLYY
The IT Infrastructure Library (ITIL) defines capacity management
as the discipline that ensures infrastructure is provided at the right
time in the right volume at the right price, and that it is used in the
most efficient manner. The critical success factors are:
• Providing accurate capacity forecasts
• Providing appropriate capacity to meet business needs
This involves input from many areas of the business to identify what IT systems are (or will be) required,
what power and cooling infrastructure is required to support these IT loads, what level of contingency will be
needed, and what the cost of this infrastructure will be.
This paper applies the ITIL view of capacity management specifically to the problem of power, cooling, and
space capacity of data centers. A model is described for the quantification of power and cooling supply,
demand, and the different types of capacity that must be managed. This model can serve as a framework
for describing a capacity management system, or for establishing service level management guidelines.
Figure 1 – Capacity management is an ITIL service process
ITIL Service SupportService Support processesFocused on end users
ITIL Service DeliveryService Delivery processesFocused on business owners
Incident Management
Problem Management
Change Management
Release Management
Configuration Management
Service Level Management
Availability Management
Capacity Management
IT Service Community
Management
IT Financial Management
©2007 American Power Conversion. All rights reserved. No part of this publication may be used, reproduced, photocopied, transmitted, or stored in any retrieval system of any nature, without the written permission of the copyright owner. www.apc.com WP #150 Rev 0
3

Background The ability to establish the power and cooling capability at a specific rack is extremely rare. Data center
operators typically do not have the information they need to effectively deploy new equipment at the rate
required by the business, and are unable to answer simple questions such as:
• Where in my data center should I deploy the next server so I don’t impact the availability of existing
equipment?
• From a power and cooling availability standpoint, where is the best location to deploy the proposed
IT equipment?
• Will I be able to install new equipment without negatively impacting my safety margins such as
redundancy and backup runtime?
• Will I still have power or cooling redundancy under fault or maintenance conditions?
Can I deploy new hardw• are technology, such as blade servers, using my existing power and
• reach the limits of my current power and cooling infrastructure and require additional
capacity?
e
of
acing stresses on data centers which are in
rn exposing the inadequacies of current operating methods:
p (TCO) and more fully utilize data centers
• The rapid change and refresh of IT equipment
ach of these factors leads to pressure to operate data centers in a more predictable manner.
a
cooling infrastructure?
• Do I need to spread out my blade servers to get reliable operation?
When will I
The inability to answer these simple questions is common but unacceptable. For data centers which ar
grossly over-designed or under-utilized, the safety margins can allow successful operation with only a
primitive understanding of overall system performance. The compromise in availability due to this lack
knowledge may result in a small but tolerable amount of downtime. While not the most economically
efficient, in the short term oversizing provides a safety margin until such a time as the available capacity
equals capacity utilized. However, three factors are currently pl
tu
• Ultra high density IT equipment
• The requirement to control total cost of ownershi
E
High-density IT equipment IT equipment drawing more than 10 kW per rack enclosure can
be considered high density. Fully populated racks of servers can
draw from 6 kW to 35 kW per rack. Yet the vast majority of dat
centers today are designed for a power density of less than 2
kW per rack. As mentioned earlier, more and more users are
installing equipment that exceeds the design density of their data centers and the resultant stresses on the
Data center stress #1 High-density IT equipment
Overloads Overheating Loss of redundancy
©2007 American Power Conversion. All rights reserved. No part of this publication may be used, reproduced, photocopied, transmitted, or stored in any retrieval system of any nature, without the written permission of the copyright owner. www.apc.com WP #150 Rev 0
4

power and cooling systems can cause downtime from overloads, overheating, and loss of redundancy. Data
center operators need better inf
Data center stress #3 Rapid change
3-year refresh cycle Day-to-day equipment changes Minute-by-minute load changes
Data center stress #2TCO pressure
Unused capacity Reduced efficiency Unseen waste
ormation regarding how and where to reliably deploy this equipment in both
xisting and new data centers.
ter today could hold up to 30% more IT
0% or
e power and
ooling resources and reduce electrical consumption.
er
t vendors. The historic “try it and see if it
these
ffective, easy-to-install, easy-to-use, pre-engineered form.
pacity management is the ability to quantify the
upply and the demand for both power and cooling.
, it does
budget power and cooling capacity is at the rack level, and this paper utilizes that approach (Figure
2).
e
Total cost of ownership Most businesses cannot accept gross over-design or oversizing of data centers. The waste of capital and
operating costs is significant. It is estimated that the typical data cen
equipment using the same facility power and cooling capacity if the
capacity was properly managed. The typical data center today is not able
to fully utilize its available power and cooling capacity, which reduces the
system efficiency and drives up electrical power consumption by 2
more when compared to a system where the capacity is properly
managed. Capacity management tools can better utiliz
c
Rapid pace of change IT equipment in a typical data center is constantly changing. Equipment refresh cycles are typically below
three years and equipment is constantly being added or removed on a daily basis. Furthermore, the pow
and cooling requirements of the IT devices themselves are not constant but vary minute-by-minute as a
result of power management features implemented by IT equipmen
works” method of deploying IT equipment is no longer viable, with
overheating a common result. Capacity management tools must
provide both real time and planning capabilities to address
challenges, and they must provide this capability in a cost
e
Capacity Supply and Demand To provide simple answers to the basic questions users have about capacity, a systematic approach to
capacity management is required. The foundation of ca
s
While having power and cooling supply and demand information at the room or facility level helps
not provide sufficiently detailed information to answer the questions about specific IT equipment
deployments. On the other hand, providing power and cooling supply and demand information at the IT
device level is unnecessarily detailed and intractable. An effective and practical level at which to measure
and
©2007 American Power Conversion. All rights reserved. No part of this publication may be used, reproduced, photocopied, transmitted, or stored in any retrieval system of any nature, without the written permission of the copyright owner. www.apc.com WP #150 Rev 0
5

Figure 2 – Level of control for capacity management
Row Row Row Row
ROOM (top view)
The model described in this paper quantifies power and cooling supply and demand at the rack level in four
important ways:
• As-configured maximum potential demand
• Current actual demand
• As-configured potential supply
• Current actual supply
This information allows a complete description of the current status of a data center power and cooling at
the rack level.
The as-configured power and cooling maximum POTENTIAL DEMAND The power management systems in modern servers can cause the power to vary by 2 to 1 or more during
typical operation. The maximum “as configured” power and cooling demand represents the peak values that
can be caused by this variance in the rack. This information can be established at the time of system
configuration via trending, it may be reported directly by the IT equipment, or it may be derived by other
means.
The maximum power and cooling demand is always greater than or equal to the actual power and cooling
ion for capacity management. demand and is critical informat
The current power and cooling ACTUAL DEMAND This is the value of power consumed and heat generated at each rack at any given point in time. Ideally,
this is done by real-time measurement of electrical power consumption at the rack level. For virtually all
devices, power consumed in watts equals the heat generated in watts. For other devices – including
uninterruptible power systems (UPS), power distribution units (PDU), air conditioners, and VoIP routers –
the heat output in watts is not equal to the power consumed, but can be mathematically derived. Rack
power consumption can be measured by the power distribution system or it can be measured by the IT
Rack
Rack
ck
Rack
ck
ck
Ra
Ra
Ra
Row Row Row Row
ROOM (top view)
ck
ck
ck
Rack
ck
ck
Ra
Ra
Ra
Ra
Ra
ROOM level Too broad
RACK level DEVICE level Too specific Best for
capacity management
©2007 American Power Conversion. All rights reserved. No part of this publication may be used, reproduced, photocopied, transmitted, or stored in any retrieval system of any nature, without the written permission of the copyright owner. www.apc.com WP #150 Rev 0
6

equipment itself, and the reported power consumed by the set of IT devices within a rack can be summed to
obtain the rack power.
The as-configured power and cooling maximum POTENTIAL SUPPLY The as-configured power and cooling supply is defined as the amount of power and cooling that could
potentially be delivered to the rack level by the installed infrastructure equipment. The potential power and
cooling supply will always be greater than or equal to the actual power and cooling supply. If the potential
supply is greater than the actual supply, this indicates that the system is in a degraded state. This can be
caused by a number of factors, such as:
• Blocked air filters in the cooling system
• A decrease in outdoor heat rejection capability due to extreme environmental conditions (
• The loss of a power module in a modular UPS
It is an important function of a capacity management system to recognize when the current actual supply is
not the same as the design value, and to diagnose the source of the constraints of the system that are
preventing realization of the design supply capacity.
The current power and cooling ACTUAL SUPPLY The actual power and cooling supply at a rack is determined using information about the power and cooling
distribution architecture of the data center power and cooling system, the actual current capacities of the
bulk powering and cooling sources, and the effects on the available capacity of other loads.
The actual power supply at a given rack is determined by knowing the available branch circuit capacity to
the rack, constrained by the availability of unutilized power of upstream sources such as PDUs and UPS. In
some cases, the available capacity is further constrained by the design or configuration of the power
system. For example, a modular system might not be fully populated or the design may call for dual power
feeds.
Determining the actual cooling supply at a rack is typically more complex than determining the power
supply, and is highly dependent on the air distribution architecture. Unlike the power architecture, where the
flow of power is constrained by wires, airflow is typically delivered to an approximate group of racks, where
it spreads among the racks based on the draw of the fans in the IT equipment. This makes the computation
of available air capacity more complex and sophisticated computer models are required. In cases where the
supply or return air are directly ducted to racks, the cooling supply at a rack is better defined and therefore
can be computed with improved accuracy.
©2007 American Power Conversion. All rights reserved. No part of this publication may be used, reproduced, photocopied, transmitted, or stored in any retrieval system of any nature, without the written permission of the copyright owner. www.apc.com WP #150 Rev 0
7

Figure 3 – Quantifying demand and supply at the rack level
Actual Actual
from rack equipment
provided by infrastructure
Actual
Levels shown represent the general concept, not actual levels
Design max Some of this difference may represent infrastructure problems that can be fixed (typically worse for COOLING)
This difference represents unused computing capacityin the rack
With virtualization, the rack’s actual will rise and fall as loads shift from rack to rack
Design max
Design maxDesign max
Power and cooling DEMAND is typically the same – kW of power IN produces the same kW of heat OUT
Actual
Over-sizing
OPTIMIZE On the SUPPLY side, reduce the gap between actual and design max – i.e., get the best to-the-rack delivery from installed power/cooling infrastructure
RIGHT-SIZEReduce the gap between design max SUPPLY and design max DEMAND – i.e., match power/cooling to load, to increase efficiency and reduce waste
Use CAPACITY MANAGEMENT data to • Reduce TCO• Increase efficiency
System-level Capacities The demand on power and cooling is established at the rack. The supply, as described in the previous
section, must also be understood and quantified at the rack. However, the power and cooling supply system
is not established rack-by-rack but is hierarchical, with supply devices such as UPSs, PDUs, and air
conditioners supplying groups of racks. Bulk supply devices such as the power service entrance and
cooling towers also represent sources of capacity supply that must be sufficient for the demand. Therefore,
in addition to quantifying power and cooling supply capacity at the rack, it must also be quantified at the
aggregate levels aligned with the supply devices.
©2007 American Power Conversion. All rights reserved. No part of this publication may be used, reproduced, photocopied, transmitted, or stored in any retrieval system of any nature, without the written permission of the copyright owner. www.apc.com WP #150 Rev 0
8

originates at the RACK
is provided by a system-wide hierarchy of infrastructure
is provided by a system-wide hierarchy of infrastructure
In-row infrastructure supplies a GROUP OF RACKS
Chiller plant
Service entrance
Cooling tower
Bulk infrastructure supplies the ROOM
Figure 4 – Source of demand vs source of supply
Supply must always be greater than or equal to demand to prevent the data center from experiencing a
failure. This must be true at each rack, and it must also be true for each supply device supplying groups of
racks. Therefore, at any given time, there is always excess capacity. Excess capacity comes in four
different forms for purposes of capacity management, which are:
• Spare capacity
• Idle capacity
• Safety margin capacity
• Stranded capacity
ach of these types of excess capacity is explained in the following sections. E
Spare capacity Spare capacity is the current actual excess capacity that can be utilized "right now” for new IT equipment.
Carrying spare capacity has significant capital and operating costs related to the purchase and
maintenance of the power and cooling equipment. Furthermore, spare capacity always brings down the
of a data center and increases its electrical consumption. operating efficiency
In an effective capacity management architecture for a growing and changing data center, certain types of
spare capacity, such as spare utility connection capacity, are cost effective. However, power and cooling
be installed only when and where needed to meet growing demand. equipment should ideally
©2007 American Power Conversion. All rights reserved. No part of this publication may be used, reproduced, photocopied, transmitted, or stored in any retrieval system of any nature, without the written permission of the copyright owner. www.apc.com WP #150 Rev 0
9

An effective capacity management system must comprehend and quantify growth plans. For more
information on quantifying growth plans see APC White Paper #143, “Data Center Projects: Growth Model.”
Idle capacity Idle capacity is the current actual excess capacity that is held available to meet the as-configured maximum
potential power or cooling demand. The existing IT equipment might need this capacity under peak load
conditions, so this idle capacity cannot be used to supply new IT equipment deployments.
Idle capacity is a growing problem caused by power management functions within IT equipment. The idle
capacity must be maintained for the times when power-managed IT equipment switches to high power
modes.
Safety margin capacity Safety margin capacity is planned excess capacity that is held available above and beyond the as-
configured maximum potential power or cooling demand. Providing a safety margin allows system operation
in the event of small errors in setting the maximum potential power and cooling demand, or in the event of
some unauthorized IT equipment being added to the system. Safety margins in the range of 10% to 20%
are typical, with up to 30% or more used in data centers with weak change control procedures. This
represents capacity that cannot be used for IT deployments.
Stranded capacity Stranded capacity is capacity that cannot be utilized by IT loads due to the design or configuration of the
system. The presence of stranded capacity indicates an imbalance between two or more of the following
capacities:
• Floor and rack space
• Power
• Power distribution
• Cooling
• Cooling distribution
nd
st data centers have significant
tranded capacity issues, including the following common examples:
A specific IT device requires sufficient capacity of all of the five above elements. Yet these elements are
almost never available in an exact balance of capacity to match a specific IT load. Invariably, there are
locations with rack space but without available cooling, or spaces with available power but with no available
rack space. Capacity of one type that cannot be used because one of the other four capacities listed above
has been used to its maximum capacity is called stranded capacity. Stranded capacity is undesirable a
can seriously limit the performance of a data center. Unfortunately, mo
s
©2007 American Power Conversion. All rights reserved. No part of this publication may be used, reproduced, photocopied, transmitted, or stored in any retrieval system of any nature, without the written permission of the copyright owner. www.apc.com WP #150 Rev 0
10

• An air conditioner has sufficient capacity but inadequate air distribution to the IT load
sitions
aining power
• Some PDUs are overloaded while others are lightly loaded
e stranded capacity so
at it can be effectively used. By definition, utilizing stranded capacity comes at a cost. It is often necessary
tors because it
very hard to explain to users or management that a data center with 1 MW of installed power and cooling
n effective capacity management system not only identifies and highlights stranded capacity, but also
elps customers avoid creating it in the f
• A PDU has sufficient capacity but no available breaker po
• Floor space is available but there is no rem
• Air conditioners are in the wrong location
• Some areas are overheated while others are cold
Depending on the situation and the architecture of the power and cooling system, it might be impossible to
utilize stranded capacity or it might be that only minor investments are needed to fre
th
to take down part of the installation or install new power and cooling components.
Stranded capacity is a very frustrating capacity management problem for data center opera
is
capacity can’t cool the new blade servers when it is only operating at 200 kW of total load.
A
h irst place.
Figure 5 – Types of excess capacity
IDLEIDLEcapacitycapacity
On standby for peak loading of existing IT equipment
● Unusable because of system design flaws
● Caused by imbalance of the three capacities (power, cooling, rack space) at a location – enough of one or two, but not all three
● Capacity management can identify or prevent stranded capacity
●Significant capital and operating cost to carry it● Brings down overall data center efficiency● Increases electric bill
● Capacity management can optimize use of IDLE capacity – even turn some into SPARE capacity
● Held in reserve above the as-configured maximum demand
● Insurance against errors in calculation of as-configured maximum demand
● Insurance against unauthorized IT equipment being added to system
● 10-20% is typical, 30% if weak change control
● Capacity management can reduce the need forthe SAFETY MARGIN and recover it to become SPARE capacity for additional IT deployments
ACTIVEACTIVEcapacitycapacity
In use right nowsupporting IT equipment
STRANDEDSTRANDEDcapacitycapacity
Available for use by new IT equipment
Unavailable(by mistake)
Off limits to intentional use
SAFETY SAFETY MARGINMARGIN
SPAREcapacity
©2007 American Power Conversion. All rights reserved. No part of this publication may be used, reproduced, photocopied, transmitted, or stored in any retrieval system of any nature, without the written permission of the copyright owner. www.apc.com WP #150 Rev 0
11

Managing Capacity
The previous sections have established the framework for quantifying power and cooling supply and
emand. The ITIL framework specifies the functions which take place within the capacity management
proce
ring
a centers.
t changes its own power and cooling
emand dynamically, the use of networked power and cooling instrumentation combined with power and
coolin is the only practical and feasible solution. From a user’s
persp provide the following functionality:
• Setting the capacity plan
capacity plan
resentation of capacity data The c d
other ca
-
when rack-level details about configuration of specific racks are not yet known.
d
ss, including:
• Performance monito
• Workload monitoring
• Supply forecasting
• Demand forecasting
• Modeling
The above tools are to serve the ITIL-defined capacity management goals of providing accurate capacity
forecasts and providing appropriate capacity to meet business needs.
A power and cooling capacity management system based on measurement by technicians combined with
paper calculations could be envisioned, and in fact this method is used in crude form in some dat
However, with the advent of server virtualization and IT equipment tha
d
g capacity management software
ective, such a system would
• Presentation of capacity data
• Alerting on violations of the
• Modeling proposed changes
Purrent supply and demand conditions of the data center, including spare and stranded capacity an
pacity attributes described earlier in this paper should be presented at three levels:
• Room level: The bulk level supply and demand as well as the various capacities for the entire
room. Typically focuses on facility level UPS, generator, chiller, cooling tower, and service entrance
equipment.
• Row level: Power and cooling supply and demand associated with a row or other logical zone
within the data center. Often associated with cooling or power distribution equipment that is row
oriented, such as PDUs, or row-oriented cooling systems. Particularly valuable for planning
purposes
©2007 American Power Conversion. All rights reserved. No part of this publication may be used, reproduced, photocopied, transmitted, or stored in any retrieval system of any nature, without the written permission of the copyright owner. www.apc.com WP #150 Rev 0
12
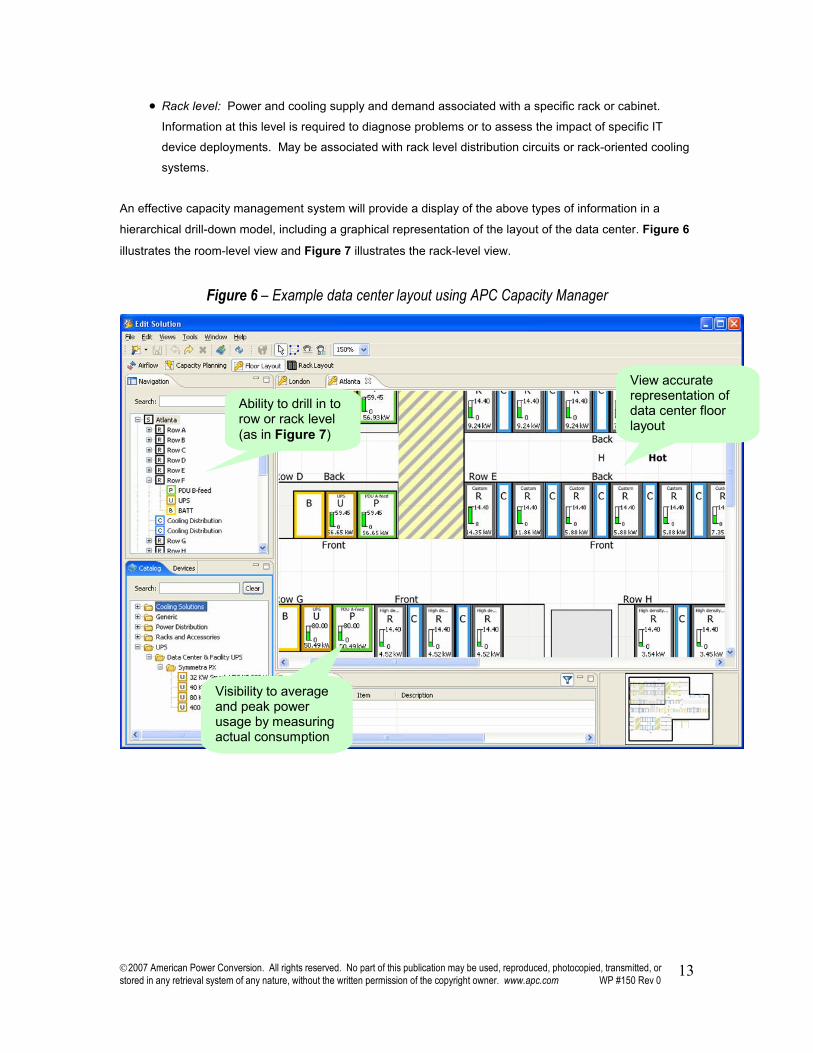
• Rack level: Power and cooling supply and demand associated with a specific rack or cabinet.
Information at this level is required to diagnose problems or to assess the impact of specific IT
device deployments. May be associated with rack level distribution circuits or rack-oriented cooling
systems.
center layout using APC Capacity Manager
An effective capacity management system will provide a display of the above types of information in a
hierarchical drill-down model, including a graphical representation of the layout of the data center. Figure 6
illustrates the room-level view and Figure 7 illustrates the rack-level view.
Figure 6 – Example data
View accurate representation of data center floor layout
Ability to drill in to row or rack level (as in Figure 7)
Visibility to average and peak power usage by measuring actual consumption
©2007 American Power Conversion. All rights reserved. No part of this publication may be used, reproduced, photocopied, transmitted, or stored in any retrieval system of any nature, without the written permission of the copyright owner. www.apc.com WP #150 Rev 0
13

Figure 7 – Example rack level view using APC Capacity Manager
Create work ordersand automaticalgenerate tascarry out adds, moves and
ly
ks to
removes of IT equipment
that can adapt to IT growth plans in order to optimize capacity expense and electrical
.
zing with the associated waste of capital expenditures, energy, service
ontracts, and water consumption.
Quickly locate theoptimum spot for that next server based on
space, cooling, and power needs
Setting the capacity plan A capacity plan must be established during the design of the data center. Once the power and cooling
devices are installed in the data center, they constrain and in many ways “become” the supply side of the
capacity plan. With today’s scalable data center power and cooling solutions, it is possible to have a
capacity plan
efficiency
ITIL specifically focuses on the issue of not just ensuring sufficient capacity, but ensuring appropriate
capacity. Too often the focus is on assuring sufficient capacity without regard for right-sizing to the actual IT
needs. The common result is oversi
c
©2007 American Power Conversion. All rights reserved. No part of this publication may be used, reproduced, photocopied, transmitted, or stored in any retrieval system of any nature, without the written permission of the copyright owner. www.apc.com WP #150 Rev 0
14

Data center design tools help establish capacity plans and therefore should integrate into the capacity
data
r.
lerting on violations of the capacity plan s are outside the boundaries of the
apacity management plan. These warnings can take the form of local, visual, or audible alerts, or can
escala
Capac
e
, or the room
Reduction in available cooling or power capacity at the row, rack, or room level due to loss or
n fact, most alerts provided by a capacity management system are
edictive in nature. Note that in an actual data center, the capacity management system complements
ther monitoring tools such as real time fault, security, water leak, and temperature monitoring. An example
f a monitoring system that provides both real time alerts as well as capacity management alerts is the APC
fraStruXure Central (Figure 8).
management system. An example of such a suite of software tools is the APC InfraStruXure Designer
center design tool, the APC InfraStruXure Central management platform, and the APC Capacity Manage
ACapacity related alerts should be triggered when actual condition
c
te via the management system as pages, e-mails, etc.
ity alarms are generated in response to events such as:
• Increase of power consumption of installed equipment in a rack beyond the peak specified in th
capacity management plan for a rack, a row
• degradation of a power or cooling sub-system
• Cooling or power systems entering a state where they are not able to provide the redundancy
specified in the capacity management plan
For many of these events, no actual hardware fault has occurred and hence no events would be triggered
by traditional monitoring systems. I
pr
o
o
In
©2007 American Power Conversion. All rights reserved. No part of this publication may be used, reproduced, photocopied, transmitted, or stored in any retrieval system of any nature, without the written permission of the copyright owner. www.apc.com WP #150 Rev 0
15

Figure 8 – APC InfraStruXure Central as an example of a centralized monitoring system
Real-time device monitoring including advanced security and instant event notification enable quick assessment and resolution of critical situations.
n to the determination of current conditions, an effective capacity management system must
rovide the ability to analyze the capacity in historical and hypothetical situations. These scenarios may
include:
ower or cooling devices
usage
The capacity management system should allow these scenarios to be evaluated against the current
capacity management plan. An effective model would guide the user to select the best scenario from
options, for example to maximize electrical efficiency or minimize floor space consumption.
Modeling proposed changes In additio
p
• Simulating fault conditions, such as loss of one or more p
• Analyzing plan growth versus actual capacity
• Proposals of equipment adds, removes, and relocations
• Trending based on historic data
©2007 American Power Conversion. All rights reserved. No part of this publication may be used, reproduced, photocopied, transmitted, or stored in any retrieval system of any nature, without the written permission of the copyright owner. www.apc.com WP #150 Rev 0
16

Monitoring Power and Cooling for IT DevicesFor most purposes, a rack may be viewed as a black box consuming power without awareness of the
quantity, type, or location of the IT devices in the rack. The capacity management system as described is
only weakly dependent on device-specific information, as long as the power consumed at the rack level
can be directly specified or measured. When the power consumption is known, the cooling requirements
can be estimated with high accuracy. When these rack level values are inside the boundaries of the
capacity plan, no additional information is needed to ensure that the power and cooling systems can meet
the demand. Therefore, with the right tools, capacity management offers many advantages to IT operations
without the requirement of detailed inventory management of the IT devices. However, there are
advantages to having information about the IT devices in the rack, or directly communicating with the IT
devices. These advantages include:
• Awareness of power consumption characteristics of individual IT components
• Awareness of minimum and maximum time-varying power characteristics of the devices
• Awareness of unusual airflow requirements, or other unusual fan operating modes
• U-space utilization at the rack level (space capacity)
• Ability to give accurate assessments of the effects associated with adds, removes, or changes
d from detailed inventory management, the data must be understood
y a capacity management system.
o
he
nt is highly dependent on capacity management information to predict the impact of proposed
hanges.
To effectively utilize knowledge gaine
b
In general, most small to medium data centers do not have the process maturity and staffing needed t
maintain rack-related IT equipment installation inventories and change history. Therefore, a capacity
management system cannot depend on the presence of this information, but should be able to take
advantage of it when available. As organizations mature, they can migrate from simplified capacity
management to a more detailed solution that incorporates change and inventory management. T
interaction between change management and capacity management is bi-directional as change
manageme
c
©2007 American Power Conversion. All rights reserved. No part of this publication may be used, reproduced, photocopied, transmitted, or stored in any retrieval system of any nature, without the written permission of the copyright owner. www.apc.com WP #150 Rev 0
17

logy
aper,
nformation about the state of the data center which is not provided by traditional
onitoring systems.
Figure 9 – Summary of a robust capacity management system
Conclusion Capacity management is an essential part of the efficient planning and operation of data centers. The need
for capacity management grows with the density, size, and complexity of the data center. A methodo
for capacity management has been described. It has been shown that capacity management is not
dependant on detailed information about the IT devices at the rack level and requires less effort to
implement and maintain, compared to traditional detailed inventory management systems, while still
providing most of the key benefits. If capacity management is implemented as described in this white p
it can provide critical i
m
Monitor IT workload
Monitor infrastructure
HARDWARE InterfaceHARDWARE Interface
Performance monitoringWorkload monitoringSupply forecastingDemand forecastingM ling
ProcessProcess
GoalsGoals
Provide accurate CAPACITY FORECASTS
Provide APPROPRIATE CAPACITY
to meet business needs
Present capacity data
Set capacity plan
ode Model proposed changes
Alert on violations of capacity plan
USER InterfaceUSER Interface
©2007 American Power Conversion. All rights reserved. No part of this publication may be used, reproduced, photocopied, transmitted, or stored in any retrieval system of any nature, without the written permission of the copyright owner. www.apc.com WP #150 Rev 0
18

About the Author: Neil Rasmussen is the Chief Technical Officer of APC-MGE. He establishes the technology direction for
the world’s largest R&D budget devoted to power, cooling, and rack infrastructure for critical networks. Neil
is currently leading the effort at APC to develop high-efficiency, modular, scalable data center infrastructure
olutions and is the principal architect of the APC InfraStruXure system.
.
orked at MIT Lincoln Laboratories on flywheel energy storage systems and solar
electric power systems.
s
Prior to founding APC in 1981, Neil received his Bachelors and Masters degrees from MIT in electrical
engineering where he did his thesis on the analysis of a 200MW power supply for a tokamak fusion reactor
From 1979 to 1981, he w
©2007 American Power Conversion. All rights reserved. No part of this publication may be used, reproduced, photocopied, transmitted, or stored in any retrieval system of any nature, without the written permission of the copyright owner. www.apc.com WP #150 Rev 0
19