poverty mapping in vietnam - world banksiteresources.worldbank.org/intpgi/resources/... · poverty...
TRANSCRIPT

261
14Poverty Mapping in Vietnam
ROB SWINKELS AND CARRIE TURK
Background
Over the past decade, Vietnam has witnessed a rapid reduction in poverty. Data fromthe Vietnam Living Standards Survey (VLSS) and the Vietnam Household Living
Standards Survey (VHLSS), conducted by the General Statistics Office (GSO) in 1993,1998, 2002, and 2004, show that the poverty rate fell by almost two-thirds, from 58 per-cent in 1993 to 20 percent in 2004. This was largely due to the sound propoor policiesadopted by the government. But these successes have been achieved without a mecha-nism for targeting assistance to the poor that would meet international standards.
A C R O N Y M S A N D A B B R E V I A T I O N S
CEM Committee for Ethnic MinoritiesD Dong, the Vietnamese currencyGSO General Statistics OfficeICARD Information Center for Agricultural and Rural DevelopmentILSSA Institute of Labor Science and Social AffairsMolisa Ministry of Labor, War Invalids, and Social AffairsNEU National Economics UniversityVHLSS Vietnam Household Living Standards SurveyVLSS Vietnam Living Standards Survey
Tara Bedi, Aline Coudouel, Peter Lanjouw, and Roy van der Weide have supplied substantial andhelpful comments on this chapter.
10412-14_Ch14.qxd 8/16/07 2:58 PM Page 261

A continuation of such rapid poverty reduction is likely to require better targeting oftransfers to poor areas and poor people. While a number of targeted programs are in place,there is increased recognition in Vietnam that the targeting procedures used in theseprograms need to be strengthened. Weak targeting mechanisms mattered less in thepast, when poverty levels were high and even flawed targeting processes were likelyto capture large numbers of poor people. As poverty rates decline, however, targetingbecomes more challenging. The government is therefore enthusiastic about exploringmore sophisticated techniques to improve the impact of targeted expenditures. In recentyears, efforts have been undertaken to test one such promising tool: the small area esti-mation methodology and the production of highly disaggregated poverty maps. Thischapter aims to document the experiences in Vietnam with poverty mapping based onthis methodology and assess the impact of the resulting poverty maps on policy makingand targeting.
Various government agencies and other stakeholder agencies have shown interest inpoverty mapping using the small area estimation methodology. This is so for two broadreasons. First, they have desired to see whether local poverty estimates produced by theMinistry of Labor, War Invalids, and Social Affairs (Molisa) might be verified throughalternative and, possibly, more reliable methods. Second, they have wished to determinewhether such local poverty estimates might then be used to improve targeting.
The VLSS and VHLSS have enabled reliable estimates of trends in poverty at thenational and regional levels, as well as trends in social outcomes among various groupsin society. Still, the size of the samples in the 1993 and 1998 VLSS were insufficient togenerate poverty estimates for each of Vietnam’s 64 provinces. This changed when thenumber of enumeration areas and the sample size were expanded for the 2002 and 2004surveys, making it possible to estimate poverty rates in the provinces, albeit with largestandard errors ranging from 1.5 percent to 5.5 percent. However, no mechanismexisted for producing reliable and comparable poverty estimates for each of the 625 orso districts and each of the 10,000 or so rural communes and urban wards.
While VHLSS data have played an important role by serving as a source of informationin the poverty policy debate, official government poverty estimates have not (until veryrecently) been based on the VHLSS. Instead, poverty estimates were based on nation-wide annual counting exercises, whereby the number of poor people was counted byMolisa officials in each commune and ward across the country, and lists with the namesof the poor were drawn up. A household was declared poor if its income was less thana low rice-based poverty line, and incomes were supposed to be measured using adetailed household questionnaire.
In reality, however, the number of people who were declared poor depended signif-icantly on the poverty reduction targets for that particular year. These targets were setin advance for each administrative unit (usually a standard 2 percent reduction per year).The number of poor people actually listed also depended on the resources that wereavailable for assisting the poor under national targeted programs. The official povertyline that was applied tended to differ across provinces because the provinces were given
262 S W I N K E L S A N D T U R K
10412-14_Ch14.qxd 8/16/07 2:58 PM Page 262

the freedom to set higher poverty lines if they had the resources available to addresspoverty among larger numbers of people.
Lists were updated annually, and local community meetings were frequently held todecide who would be declared poor and who had moved out of poverty. These meetingsoften made household income measurements unnecessary. The commune and wardpoverty rates that emerged from this exercise were aggregated at the district level, thenat the provincial level, and, finally, at the national level.
Because these poverty counts were not based on one standard methodology appliedthroughout the country using an independent measurement tool, such as the VHLSS,but were subjectively defined through a political process driven by targets set by higherauthorities, the poverty rates were not comparable across administrative units. As a con-sequence, the data on local and national poverty rates used in official government reportswere not reliable, a finding which has been confirmed by recent research (see Nguyenand Rama 2006).
Not only did the local poverty rates distort intercommune differences, but they werealso generally too low. The poverty line that was applied reflected only the minimumamount of rice necessary for survival. It did not reflect other food and nonfood consump-tion needs. In 2002, the value of the official poverty line used in the Molisa methodologywas roughly D 90,000 per person per day, which is US$0.19, or US$0.92 valued at apurchasing power parity of 4.9. This is insufficient to meet minimum basic needs inVietnam. The VHLSS 2002 used a poverty line of D 159,788, which is approximately1.8 times higher.
The difference in official and VHLSS-based poverty rates may be easily demonstratedby provincial poverty maps derived according to the Molisa or the GSO methodology.Figure 14.1 illustrates how the Molisa data result in lower levels of poverty and a morecompressed range of poverty rates across the country.
The lack of reliable poverty rates at the provincial and subprovincial levels that arecompatible with the VHLSS estimates stimulated an interest in alternative approachesfor estimating poverty rates at these levels.
During the 1990s, the government was placing greater emphasis on two nationaltargeted antipoverty programs through which it was channeling increasing resources.These were the Hunger Eradication and Poverty Reduction Program and a programtargeting poor communes that has come to be known as Program 135 after the num-ber of the decision that established it. The former, coordinated by Molisa, wasdesigned to deliver benefits such as subsidized credit, school fee exemptions, and freehealth care to individuals who live in households defined as poor through the Molisa-led process described above. Program 135 is coordinated by the Committee for Eth-nic Minorities (CEM) and makes grants to communes in exceptionally difficultcircumstances. The grants are provided mainly for investment in small-scale infra-structure. Communes are identified using a number of criteria, including local geog-raphy, the concentration of poor households, the presence of ethnic minorities, anddeficiencies in infrastructure.
P O V E R T Y M A P P I N G 263
10412-14_Ch14.qxd 8/16/07 2:58 PM Page 263

This chapter will next discuss the preparations and the process for the production ofsmall area estimation poverty maps. Thereafter, it offers an overview of the main technicalaspects, the key findings, the impact of the maps, missed opportunities, and the sus-tainability of the process. The chapter concludes with a summary of the lessons learned.
Arrangements and Process
During 1997, the International Food Policy Research Institute developed a povertymap of rural districts in Vietnam using techniques related to the small area estimationmethodology. This map relied on the 1993 VLSS to estimate the likelihood of povertyamong rural households as a function of a series of household and farm characteristicsand then calculated district averages for these characteristics from the 1994 agriculturalcensus to predict district poverty rates (see Minot 2000). In 1999, a census was completedby the GSO. The World Bank and the International Food Policy Research Institute madeuse of a 3 percent sample from this census, together with the 1998 VLSS, to develop aprovincial poverty map using the small area estimation methodology (see Minot and
264 S W I N K E L S A N D T U R K
Molisa, 2003GSO, 2002
Figure 14.1 Provincial Poverty Incidence by Molisa and the GSO, Vietnam 2002 and 2003
Sources: Administrative data from Molisa; GSO estimates.Note: The GSO estimates rely on the VHLSS; the GSO data (right) have standard errors ranging between 1.5 and 5.5 percent.
10412-14_Ch14.qxd 8/16/07 2:58 PM Page 264

Baulch 2002, 2004). This generated the first reliable set of provincial poverty estimatesfor Vietnam and demonstrated that the small area estimation methodology might be madeto work using the available data sets and that the generation of more disaggregatedpoverty estimates and maps was possible if a larger portion of the census became accessible.
Institutional arrangements
In 2002, the International Food Policy Research Institute and the Institute of Devel-opment Studies, in partnership with the Information Center for Agricultural and RuralDevelopment (ICARD), submitted a proposal to the World Bank on a collaborative effortto generate disaggregated poverty estimates. This would include district and, possibly,commune poverty estimates and district poverty gap and inequality estimates and maps.The proposal would require a 33 percent sample of the 1999 census. Eventually, fundingwas arranged through the New Zealand Agency for International Development. At thesuggestion of ICARD, the proposal included a large capacity-building component forVietnamese researchers and government officials. It required that the participatinginternational researchers, instead of doing most of the work themselves, as they haddone during the earlier provincial mapping exercise, would take a step back this timeand play the role of mentor.
A poverty mapping steering committee was established, led by the director of ICARD.The committee included representatives from the key agencies that are involved in anti-poverty programs, such as Molisa, the Ministry of Finance, and the Ministry of Planningand Investment, in addition to the GSO. Each agency was asked to send three English-speaking representatives to form the 12-member Interministerial Poverty MappingTask Force. The members were to be trained in poverty mapping techniques. The GSOwas asked to send one local staff member experienced in quantitative analysis to act asa cotrainer during some of the training sessions, together with two local economists:one from the National Economics University (NEU) and one from the Institute ofEconomics. One local geographic information systems specialist from Hanoi Agricul-tural University was also recruited for the training program.
Training and capacity building
Over the first six months of the project, three one-week training sessions were organizedby ICARD and the international experts: one on statistical analysis using the Statasoftware package, one on geographic information systems using ArcView, and one onpoverty mapping. Between these training sessions, subgroups of participants were givenassignments to practice what they had learned. Supervision over these assignments wasprovided by the international experts over the Internet and by the World Bank in Hanoi.Following the final training session, a somewhat smaller group was formed consistingof the analysts who had performed well during the final training. This smaller groupworked together to generate the remaining detailed estimates and to produce the mapsand a report. The result of this capacity-building approach was a capable local expert
P O V E R T Y M A P P I N G 265
10412-14_Ch14.qxd 8/16/07 2:58 PM Page 265

on the small area estimation methodology and a wider group of people who understoodand, with some help, would be able to produce poverty maps.
Attempts to update the original analysis
In the course of 2003, data from a new household living standards survey, the 2002VHLSS, became available. This made it possible to reestimate the coefficients repre-senting the relationship between household characteristics and consumption expenditure.These coefficients might then be used to revise the household expenditures estimatedon the basis of the household characteristics covered in the 1999 census. The Instituteof Labor Science and Social Affairs (ILSSA), which is affiliated with Molisa, submitteda proposal to the World Bank to investigate the possibility of updating the maps usingreestimated coefficients. The World Bank provided support, mainly through a localpoverty mapping specialist from the NEU who guided the ILSSA team through thevarious analytical steps (see Nguyen et al. 2004a).
Later in 2004, the ILSSA requested help from the World Bank in a renewed effortto test a method for updating the poverty map. This was to be done by using a mini-census in pilot communes to update the household characteristics covered in the 1999census and on which the poverty mapping estimates were based. This involved testinga bottom-up approach, whereby data would be collected on household characteristicslocally to update poverty rates using poverty mapping techniques. The ILSSA alsoproposed exploring whether the census variables might be applied as proxy indicatorsto identify poor households. If the test proved successful, then the cumbersome andunreliable Molisa poor household income census would be replaced by a much simplerminicensus to collect data on only 10–15 household characteristics.
In the field, a simple questionnaire on asset ownership was used to identify all richand all very poor households. These two extreme sorts of households were eliminated fromthe sample. The remaining households were subjected to a more detailed questionnairecovering household characteristics that was used to estimate household expenditures.To verify these estimates, data were also collected on household expenditures and incomesusing simplified versions of the VHLSS questionnaire. Nine communes were includedin the field test. Separate tests were run using the 2004 VHLSS to estimate regionaland provincial poverty rates directly through expenditures and through estimated expen-ditures using household characteristics. The results of this work were presented at aWorld Bank conference in Cambodia on the uses and impact of poverty maps in February2006 (see Nguyen et al. 2006).
Overlaying the poverty map with other information
The team that originally produced the national poverty map also produced variousoverlays for this map, including information on market access. Subsequently, the ILSSAteam and the NEU economist overlaid the poverty map with information on the 2,500 or
266 S W I N K E L S A N D T U R K
10412-14_Ch14.qxd 8/16/07 2:58 PM Page 266

so communes where Program 135 funds had been distributed. The results of this exercisewere presented to Program 135 officials (at CEM) by the local research team during aworkshop. The CEM officials subsequently requested training in poverty mappingtechniques for 10 CEM staff. A three-week training session was provided by the localpoverty mapping specialist from the NEU and was completed in the summer of 2004.
Producing an updated provincial map
When the provincial authorities of Ho Chi Minh City decided to conduct a midterm pop-ulation census in 2004, the provincial statistics office approached the World Bank for helpwith data tabulations and analysis. The idea of using this census, in combination with the2002 VHLSS, to develop a provincial poverty map quickly emerged. The relevant infor-mation for poverty mapping was collected for 10 percent of the sample. It was hoped thatthe map would be completed in time to feed into the next Ho Chi Minh City five-yearplan (2006–10). A collaborative effort was undertaken that included the Institute of Eco-nomic Research of Ho Chi Minh City and the provincial statistics office, with technicalleadership and training provided by the poverty mapping specialist from the NEU.
Technical Aspects
Accounting for regional differences
Seventeen household characteristics that appear in both the 1998 VLSS and the 1999census were adopted for use in the poverty mapping analysis. Separate regression modelswere estimated for urban and rural Vietnam. Earlier attempts to derive separate estimatesfor seven rural strata and two urban strata had produced unconvincing results, and thisapproach was dropped. The team considered that this use of only two consumptionmodels, one rural and one urban, for the whole country was somewhat unsatisfactory;it seems unlikely that returns to each of the rural (or urban) household characteristicswould be the same across the entire country. As an alternative, the regression modelsincluded dummy variables for each of the regions to account for regional differences. Asa result, the estimated poverty rates for neighboring districts or communes with simi-lar characteristics, but on opposing sides of a regional boundary, sometimes showedunrealistically large differences. This is especially so on the border between the poorCentral Highlands and the rich Southeast.
Large confidence intervals for small communes
The national poverty estimates derived through the poverty mapping exercise using a33 percent sample of the census were very close to those using a 3 percent sample of thecensus, as well as to those estimates derived directly from the 1998 VLSS. The 95 percentconfidence intervals of the provincial poverty estimates using 33 percent of the sample
P O V E R T Y M A P P I N G 267
10412-14_Ch14.qxd 8/16/07 2:58 PM Page 267

averaged ±5.2 percent. This figure was only slightly higher for the district estimates,at ±5.8 percent, but significantly higher for the commune estimates, at ±8.1 percent.Half the commune estimates showed a confidence interval between ±6.6 percent and±10 percent. One-quarter of the communes (mostly the smaller ones) showed confidenceintervals greater than ±10 percent. Clearly, the commune estimates should be treatedwith caution and should not be used as the sole criterion in targeting resources.
Intracluster correlation
One of the weaknesses of the poverty mapping methodology applied in Vietnam is thefailure to account for the possibility of intracluster correlation in the disturbance termsfrom the first-stage regression model estimated using the VLSS data. Failure to accom-modate for this possibility may mean that standard errors are underestimated. Elbers,Lanjouw, and Lanjouw (2003) recommend that specific steps be taken to minimize theinfluence of location effects by incorporating into the underlying consumption modelvariables that are explicitly intended to control for such effects. For example, they rec-ommend that a set of means calculated on the basis of the unit record census data at thelevel of the primary sampling unit be inserted into the estimation model. The internationalexperts who led the Vietnam poverty mapping exercise adopted this method at a laterstage and found that it did not have an important impact on the estimates.
Access to census data
Raw data from the 1999 Population and Housing Census are not available to the public.However, samples of the data may be purchased from the GSO following submission andacceptance of a formal request spelling out in detail the variables needed and the purposefor which the data will be used. To keep costs down at first, only a 3 percent systematicsample was bought from the GSO, which was deemed sufficient for generating estimatesat the provincial level. When the data appeared suitable for the application of the smallarea estimation methodology, the interest in producing more disaggregated poverty mapsgrew. This meant a much larger sample of the census data was needed. The poverty map-ping proposal submitted to the World Bank by the International Food Policy ResearchInstitute, the Institute of Development Studies, and ICARD to produce higher-resolutionpoverty maps therefore included a budget item for purchasing a 33 percent systematicsample from the GSO. This was the largest proportion of the population census the GSOwas willing to make available. This is unlikely to change in the near future.
Outdated census data
An important weakness of the national high-resolution poverty maps relates to the factthat the census and survey data on which they have been based were collected in 1999and were thus four years old at the time the mapping results were made available and
268 S W I N K E L S A N D T U R K
10412-14_Ch14.qxd 8/16/07 2:58 PM Page 268

distributed in 2003. In a country where poverty has been declining at an average of3.5 percentage points per year, such poverty data may no longer be regarded as relevant(see below). In addition, because Vietnam is witnessing rapid migration, in particularfrom rural to urban areas, population data from the census are also likely to become outof date quickly. The 2004 midterm population census in Ho Chi Minh City showedthat immigration there had been much more significant than originally thought andthat administrative records on this phenomenon were incomplete.
Incomplete survey coverage of mobile urban population groups
The poverty maps estimated for Ho Chi Minh City in 2005 were based on the 2004provincial census and the 2002 VHLSS. The estimation models were based on the 2002VHLSS data from the urban sample in the Southeast (the region in which Ho Chi MinhCity is located). Given the uniqueness of Ho Chi Minh City, it would have been better touse only the data from urban Ho Chi Minh City, rather than data from the whole region,to estimate the regression coefficients. But the urban data provided unsatisfactory results.One of the key problems is the failure of the VHLSS survey to capture urban poverty suf-ficiently accurately. Although the survey sample is based on household lists from the cen-sus and is, in principle, updated using local administrative records, this approach might beproblematic in reality given that these records are incomplete and seem to miss large partsof population groups that are more mobile. This is corroborated by the 2004 Ho Chi MinhCity population census. Given that these mobile groups are likely to constitute a large frac-tion of the urban poor, omitting them from the living standards survey sample would haveled to biased estimates of the regression coefficients and thus, ultimately, of the small areapoverty estimates on this city. Unless the VHLSS is able to cover urban poverty adequately,producing reliable poverty maps for urban areas will be difficult.
Conflicting methods for measuring poverty
Official poverty rates in Vietnam are not based on the VHLSS, which is used, in com-bination with the population census, to produce the poverty maps (see elsewhere above).Given the unofficial nature of the VHLSS poverty estimates, the poverty maps havesuffered from a similar unofficial status. However, Molisa has come under increasingcriticism from various parts of the government for its approach to poverty measurement,and the VHLSS approach is finding gradual acceptance as a more reliable methodamong planners and policy makers at the national level. This represents an opportunityto seek more official recognition for subnational small area poverty estimates and maps.
Explaining the methods to nonspecialists
Lastly, the poverty mapping techniques follow rather complex procedures that are difficultto explain to policy makers. The estimation techniques tend to be regarded as a blackbox, and this has led to doubts about the validity of the estimates.
P O V E R T Y M A P P I N G 269
10412-14_Ch14.qxd 8/16/07 2:58 PM Page 269

The Findings of the Poverty Mapping Exercise
Dissemination
The small area poverty estimates on districts and communes using the 33 percent sampleof the 1999 Population and Housing Census and the 1998 VLSS became available inmid-2003. They were presented to the poverty mapping steering committee by membersof the Interministerial Poverty Mapping Task Force at a workshop held at the Ministryof Agriculture and Rural Development. Later that year, the results were presented at alarger forum to which all members of the Poverty Task Force were invited. At that time,the Poverty Task Force constituted the main mechanism for interaction among the gov-ernment, donors, and nongovernmental organizations on poverty policy work.
Reports in Vietnamese and English that described the methodology and the mainfindings were distributed at these events (see Minot, Baulch, and Epprecht 2003). Variouslarge, colorful, poster-sized poverty maps were also distributed. Compact discs wereproduced that included all the poverty, poverty gap, and inequality estimates and otherdata on communes, districts, and provinces. The discs allowed users to make their ownmaps for areas of the country that were of particular interest to them.
Since the workshop, the maps, reports, and compact discs have been reissued manytimes and circulated widely. Several of the maps have been reproduced in other documents,including publications of the World Bank, other donors, and NGOs. They have alsobeen reproduced in a national newspaper and shown on television. The maps were pre-sented to a large number of researchers and officials in various places throughout thecountry as part of an exercise to disseminate the 2003 World Bank poverty assessment.Currently, the maps are available on the Web site of the Institute of Policy and Strategyfor Agriculture and Rural Development as part of an online socioeconomic atlas ofVietnam (see http://agro.gov.vn/news/default.asp).
Key findings
The poverty maps provide estimates of poverty headcounts for provinces, districts, andcommunes. Large color maps have been reproduced using these estimates. The mapsprovide a striking visual account of the depth of poverty in the mountains to the north,the upland areas along the coast, and the Central Highlands. They show much lowerlevels of poverty in the Southeast (where Ho Chi Minh City is located), other lowlandareas, the Mekong River Delta, and the Red River Delta. These findings may not besurprising to those already familiar with the VHLSS data. Nonetheless, there appearsto be a strong correlation between poverty and geography rather than between povertyand administrative boundaries, a link that is not evident from a list of provincial povertyheadcounts. The maps also provided a visual account of inequality in Vietnam for the firsttime, a topic of much concern to policy makers. The maps showed differences in povertylevels that were much starker than the differences indicated by the data that had been
270 S W I N K E L S A N D T U R K
10412-14_Ch14.qxd 8/16/07 2:58 PM Page 270

circulated previously. The district and com-mune poverty maps strongly support the argu-ment that assistance should be targeted on lessdensely populated, largely forested, ethnicminority areas (for example, see figure 14.2).The poverty team at the World Bank routinelyuses these maps, alongside a map of ethnicityfrom the population census, to show the cor-relation between ethnicity and poverty.
A second map was produced showing thedensity of poverty in Vietnam (see figure 14.3).This map indicates that the density of povertyis highest where the population density is high-est, that is, in the two delta areas of Vietnamand along the coastal lowland areas. This mapis almost an inverse of the map showing theincidence of poverty in that the poverty head-counts are highest in more sparsely populatedareas. Some actors consulted as part of thisreview of the impact of poverty maps recalledthe map on poverty density more clearly thanthe map on poverty incidence. When used onits own, this map supports an entirely differentargument for resource allocation. When anobjective is set to reach the maximum numberof people living under the poverty line, thedensity map used alone suggests a pattern ofresource allocation that would be targeted at themore accessible and more rapidly growing partsof the country. A third map, depicting thepoverty gap across Vietnam, demonstrates thatpoverty is not deep in the areas of greatest poverty density (see figure 14.3).
The poverty team in the World Bank uses these three maps together to demonstratethe message that, though large numbers of poor people reside in the deltas, their povertyis not extreme and is likely to be substantially reduced through continued rapid economicgrowth. By contrast, the areas with high poverty headcounts are experiencing muchdeeper poverty that is unlikely to be addressed in the medium term by continued growthalone. This message is reinforced by a map developed by World Bank staff in Vietnamfrom the same data set that shows the cumulative poverty gap, which multiplies the num-ber of poor people in a district by the average poverty gap of that district (see figure 14.4).The poverty density maps are in the public domain and may be (and are) used individuallyto support alternative arguments for targeting.
P O V E R T Y M A P P I N G 271
Figure 14.2 Incidence of Poverty in Communes, Vietnam
Sources: Minot, Baulch, and Epprecht 2003.
10412-14_Ch14.qxd 8/16/07 2:58 PM Page 271

A further finding arises from the comparison of maps depicting the poverty headcountsin the provinces, districts, and communes (see figure 14.5). This shows the considerableheterogeneity within provinces in many parts of the country. Many rich provinces haveseveral poor districts, while the reverse is true for several poor provinces. By extension,many richer districts include a large number of poor communes. A significant share of thebudget is allocated by provincial governments, often using little more than populationfigures as a basis for determining the distribution across districts. We use these mapsto show that more sophisticated criteria might be appropriate as a basis for allocatingresources designed to tackle poverty.
Reactions to the initial findings
Reactions to the poverty maps were mixed across government authorities. Many researchersand officials found it helpful to have a visual account of inequality, an issue of great con-cern to the central government. Because the levels of poverty illustrated by the poverty
272 S W I N K E L S A N D T U R K
Figure 14.3 Density of Poverty and Poverty Gap by District, Vietnam
Sources: Minot, Baulch, and Epprecht 2003.
10412-14_Ch14.qxd 8/16/07 2:58 PM Page 272

maps closely agreed with the fieldwork of researchers, many agencies found the mapsquite credible and convincing. The least positive feedback came from Molisa, wheremisgivings about the maps arose from the following factors. First, the data used for thepoverty maps came from sources that were different from the official poverty data. Theofficial data were not, at that time, derived from the VHLSS, but through an entirelydifferent process involving local counts of poor people (see elsewhere above). Despitemisgivings about this traditional poverty measurement method in some parts of the gov-ernment, most officials were reluctant to accept any method that deviated radically fromofficial measures. The rather technical nature of the small area calculations also did nothelp win over the acceptance of government officials.
The two maps in figure 14.6 show the extent of the differences between the officialpoverty rates and the rates based on the small area estimation methodology. Both mapsshow estimates of poverty for 1999. The first picture comes from official Molisa sources.The second shows the poverty mapping estimates using the 1999 census and the 1998VLSS. The levels of poverty indicated through the mapping exercise are much higher
P O V E R T Y M A P P I N G 273
Dong (millions)
Province
Dong (millions)
District
Figure 14.4 Cumulative Distance below the Poverty Line by Province and District, Vietnam
Sources: World Bank estimates.
10412-14_Ch14.qxd 8/16/07 2:58 PM Page 273

274 S W I N K E L S A N D T U R K
Prov
ince
Dis
tric
tC
omm
une
Figu
re 1
4.5
Pove
rty
Inci
denc
e by
Pro
vinc
e, D
istr
ict,
and
Com
mun
e, V
ietn
am
Sour
ces:
Min
ot, B
aulc
h, a
nd E
ppre
cht 2
003.
10412-14_Ch14.qxd 8/16/07 2:58 PM Page 274
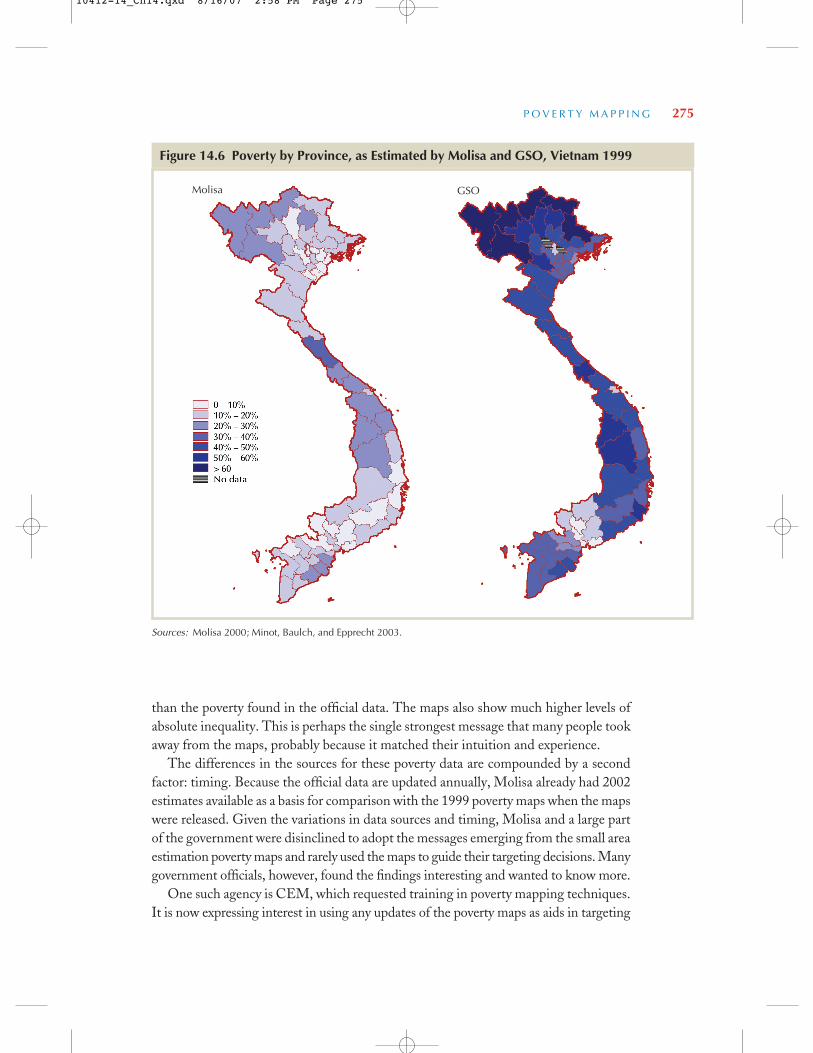
than the poverty found in the official data. The maps also show much higher levels ofabsolute inequality. This is perhaps the single strongest message that many people tookaway from the maps, probably because it matched their intuition and experience.
The differences in the sources for these poverty data are compounded by a secondfactor: timing. Because the official data are updated annually, Molisa already had 2002estimates available as a basis for comparison with the 1999 poverty maps when the mapswere released. Given the variations in data sources and timing, Molisa and a large partof the government were disinclined to adopt the messages emerging from the small areaestimation poverty maps and rarely used the maps to guide their targeting decisions. Manygovernment officials, however, found the findings interesting and wanted to know more.
One such agency is CEM, which requested training in poverty mapping techniques.It is now expressing interest in using any updates of the poverty maps as aids in targeting
P O V E R T Y M A P P I N G 275
Molisa GSO
Sources: Molisa 2000; Minot, Baulch, and Epprecht 2003.
Figure 14.6 Poverty by Province, as Estimated by Molisa and GSO, Vietnam 1999
10412-14_Ch14.qxd 8/16/07 2:58 PM Page 275

resources under its support efforts for poor communities. The GSO has included in thenext agricultural census the variables used for the poverty mapping so that updates ofthe poverty maps may be produced ahead of the next full census.
Updating the poverty maps
The high level of interest of planners and policy makers in the poverty mappingmethodology, especially if this methodology may lead to updated estimates, promptedthe World Bank to support two attempts to update the poverty maps (see the sectionon Technical Aspects for a detailed description of the process). One attempt consistedof updating the maps using a new household survey that had become available. The sec-ond attempt tried to arrive at new poverty estimates by updating the census variablesthrough fieldwork.
The team involved in the first attempt combined the 1999 census with the 2002VHLSS. They found this approach unproductive. The estimated poverty rates wereapproximately the same as those based on the combination of the census and the 1998VLSS. Given that, according to the direct measurements of consumption expenditurein the 2002 VHLSS, poverty had declined by 8.5 percentage points since 1998, thefinding that poverty had remained constant was not credible. Although the relationshipbetween expenditure and many of the household characteristics had changed, this hadnot led to a change in the estimated poverty rates. Clearly, lower levels of poverty hadbecome manifest in changes in household characteristics. Without updates on the house-hold characteristics, the new estimates would lead to the same poverty rates because thenew estimates continued to rely on the same 1999 census data. However, the regressionestimates showed that, between 1998 and 2002, rural poverty had become more stronglyassociated with a number of household characteristics. These included status as part ofan ethnic minority and low educational attainment of the spouse. Also, for both rural andurban areas, some of the regional dummies became less strongly associated with higherhousehold expenditures. Factors that are less region specific had obviously become moreimportant in explaining poverty (see Nguyen et al. 2004a).
The effort to update the poverty maps through local data collection was conductedin nine communes. In all communes, the poverty rates estimated on the basis of expen-diture measures gauged through household characteristics were much lower than thepoverty rates estimated on the basis of the collected expenditure data. One reason for thisappeared to be that the collected expenditure data were lower than the actual expendituressince the data were collected using simplified questionnaires (see Nguyen et al. 2006).This is likely to have led to an overestimation of poverty, making a comparison with thepoverty mapping method impossible.
Looking forward, efforts to update the maps regularly will focus on ways to updatethe data on household characteristics (the census variables) because new surveys andupdated estimates of coefficients seem to have little impact on the poverty estimates.Efforts to test methods to update the data on household characteristics so as to calcu-late new commune or district poverty rates should include more rigorous verification of
276 S W I N K E L S A N D T U R K
10412-14_Ch14.qxd 8/16/07 2:58 PM Page 276

the test results. This should include (1) direct poverty estimates calculated from reliableexpenditure or income data on a large number of households in the area and (2) discussionwith key local informants on the relative ranking of communes or districts by povertylevel. Use might also be made of data from the 2006 agricultural census.
Using poverty mapping to identify proxy indicators
The use of household characteristics from the census as proxy indicators for povertycaught the imagination of staff at the ILSSA and Molisa. The targeted programs man-aged by Molisa are aimed at households or individuals, rather than small areas. The staffthere wanted to test whether these household characteristics might be used to predictwhether a household is poor or not. This test was conducted using data from the 2004VHLSS. The results showed that the coverage rate of this method is only 57 percent,excluding 43 percent of poor households. The leakage rate is lower, suggesting that aboutone-quarter of the households are miscategorized as poor (see Nguyen et al. 2006). Inshort, this analysis showed that selecting poor households through poverty indicatorsmight not be as straightforward as was thought.
Overlaying the poverty maps with information on program coverage
The overlay of the poor communes selected by the government for special assistance underProgram 135 showed that nearly all selected communes were in poor areas and that nearlyall poor areas were included, but that some gaps existed, particularly in the Northwest(see figure 14.7). The good coverage is partly caused by the fact that Program 135 focuseson remote communes, most of which are poor. In addition to remoteness from infrastruc-ture and services, the selection criteria also include the proportion of ethnic minoritiesin the communes, which is also strongly associated with poverty. The gaps exist espe-cially in areas that are to be flooded once a new hydropower dam is completed nearby.However, CEM was somewhat disturbed by the exposure of these gaps and wanted tostudy them more before commenting.
Producing an urban poverty map
The research team that produced the poverty mapping estimates for Ho Chi Minh Cityusing the city’s 2004 midterm provincial census found that there are very few people inthe city who are living below the national poverty line. The use of a poverty line estab-lished by the Ho Chi Minh City authorities that is about two times higher than thenational poverty line resulted in higher levels of poverty (2.6 percent, on average). Thehighest poverty rates were found in the outlying rural areas of Ho Chi Minh City. Dif-ferences in poverty among city districts were low and insignificant (Institute of EconomicResearch 2005). This is not in line with observations and other data that show thatpockets of poverty exist in some urban wards of the city, especially in areas with largenumbers of migrants. This finding is probably related to the difficulty in estimating an
P O V E R T Y M A P P I N G 277
10412-14_Ch14.qxd 8/16/07 2:58 PM Page 277

expenditure equation for urban Ho Chi Minh City from the VHLSS, which, in turn, islikely to be caused by insufficient VHLSS coverage of urban migrants. In fact, the midtermcensus for Ho Chi Minh City indicated that the proportion of people with temporaryregistration status is 30 percent, whereas only 10 percent of urban residents in the urbansoutheast sample of the VHLSS (which is heavily dominated by Ho Chi Minh City)have temporary registration status, providing more evidence that the VHLSS leaves outgreater proportions of more mobile population groups. This issue is now receiving theattention of the GSO.
Impact
Impact of the national poverty maps
The poverty maps were introduced primarily to promote well-informed debate on povertyand inequality by producing poverty estimates disaggregated at the subprovincial level.
278 S W I N K E L S A N D T U R K
Program 135 status
Communes with Program 135 Communes without Program 135
Sources: Nguyen et al. 2004b.Note: On left map, communes without Program 135 are shown in blue. On right map, communes with Program 135 are in blue.
Figure 14.7 Poverty Incidence in Communes with and without Program 135, Vietnam
10412-14_Ch14.qxd 8/16/07 2:58 PM Page 278

The results showed that it was possible to use high-quality survey and census data togenerate poverty estimates for provinces, districts, and communes and that the method-ology might be used to aid in decisions about targeting. This demonstrated that there waspotential to replace the cumbersome and unreliable annual income surveys and the countsof poor people conducted across the country by Molisa. There was no explicit objectiveto use the poverty maps to encourage revisions to any specific government policies.
As a preliminary step to drafting this chapter, the World Bank conducted a numberof interviews and sent a brief questionnaire to people who had seen the poverty maps.The questions covered the exposure of these people to and use of the maps and their recallon the main messages of the maps. The questionnaire was sent to 17 donors, 12 jour-nalists, 9 researchers, 5 NGO representatives, 3 independent development professionals,and 9 officials in Ho Chi Minh City. There were 46 respondents, who answered thatthey had used the poverty maps in the following ways:
� Improving their understanding of poverty. Most respondents stated that they had usedthe main messages of the poverty maps in explaining poverty to their own organiza-tions, in their dialogue with the government, and (particularly the NGOs) in theirdiscussions with development professionals seeking to learn more about poverty inVietnam. The journalists said they had used the maps as background for articles,sometimes reproducing the maps. Several researchers had used the maps in lecturesor in publications. The maps were used as an aid in discussions in a number of organ-ized forums, including the Poverty Task Force and the Partnership to Assist thePoorest Communes.
� Targeting resources. A number of respondents at donor organizations and NGOs saidthey had used the poverty maps in allocating resources. This involved setting prioritiesfor new programs, adjusting the allocation of resources in ongoing programs, andarguing for more propoor public expenditures within sectors where these organizationsare active. One donor used the poverty map overlay of the communes selected forProgram 135, which are actually the poorest communes and include nearly all poorcommunes in Vietnam, as a basis for providing budget support for one of the gov-ernment programs that channels additional resources to poor communes. NGOs, inparticular, used the maps as an advocacy tool to influence others to allocate resourcesin a more propoor manner. The Office of the National Assembly reported that it, too,had used the poverty maps to argue for more resources for poorer areas. Some respon-dents had used the maps to argue for the targeting of areas of dense poverty, ratherthan deep poverty.
� Rethinking poverty measurement techniques. As a powerful instrument for generatingdebate about the different results from the use of different poverty data, the povertymaps have encouraged recognition that the official poverty measurement and target-ing techniques relying on Molisa data are flawed. This was confirmed by subsequentresearch (see Nguyen and Rama 2004). The debate has led to the definition of a newpoverty line that brings official poverty estimates much closer to the estimates derived
P O V E R T Y M A P P I N G 279
10412-14_Ch14.qxd 8/16/07 2:58 PM Page 279

from the household surveys. The debate has also prompted a series of investigationsinto new targeting techniques and demonstrated the need for more independent datasources, a need that had not been previously recognized.
Discussions with government agencies about the value of the poverty map exercisesuggest that there have been a number of benefits arising from the process of preparingthe maps. The institute leading the research argues that the approach to the work—theestablishment of a multistakeholder task force—set a precedent for cross-agency col-laboration that has since become normal in government operations. There had previouslybeen little collaboration across government agencies in the production of analytical work,particularly in poverty analysis. Poverty analysis had previously been associated with thetargeted Hunger Eradication and Poverty Reduction Program coordinated by Molisa,rather than with policy development across a range of sectors.
In addition, government agencies noted the capacity that the poverty mapping exer-cise had built. There are now a number of Vietnamese experts able to construct povertymaps with minimal outside support, indicating a sustainable improvement in the capacityto use poverty data to influence debate (see below on Sustainability). One governmentagency also argued that the poverty mapping exercise had changed the government’sapproach to presenting data more generally. The poverty maps were an inspiration fora whole range of other mapping exercises, which vividly illustrate a number of socialtrends and other trends. For example, following the success of the poverty maps, ICARDand the GSO collaborated to produce a socioeconomic atlas of Vietnam using the 1999data. This atlas, which includes the poverty maps, allows easy, visual cross-referencingbetween the poverty headcount and other indicators, such as the presence of forestcover. Helvetas, the Swiss Association for International Cooperation, is now usingmapping techniques in Vietnam to motivate discussion at a subnational level in supportof a provincial planning process to develop a more sound evidence base and to becomemore propoor by mapping a range of administrative and other data.
Impact of the Ho Chi Minh City poverty maps
The results of the Ho Chi Minh City mapping exercise were made available at a dis-semination workshop hosted by the Institute of Economic Research in December 2005.Representatives from the People’s Council and from city departments, district officials,and researchers attended. Feedback from the attendees suggests that they found thepoverty maps either “very useful” or “quite useful.” Those most interested in using themaps as an instrument for policy design or resource allocation voiced concerns aboutthe errors resulting from the absence of nonpermanent migrants from the Ho Chi MinhCity sample of the VHLSS. They were interested in encouraging follow-up work thatwould reduce the likelihood of errors and that would investigate links between povertyand other indicators, such as access to basic services. Several officials mentioned thatthey had used the maps in internal reports, district plans, and research.
280 S W I N K E L S A N D T U R K
10412-14_Ch14.qxd 8/16/07 2:58 PM Page 280

Missed Opportunities for Influence
A number of factors constrain the level of influence that the poverty maps have had inpolicy- and decision-making processes. The two most significant limitations relate tothe timeliness of the maps and their relationship to official poverty data. The focus ofthe dialogue at the national level rather than locally and, perhaps, the failure to engagewith certain organizations as early and as energetically as might have been desirable havealso been important.
The timeliness of the maps and the conflict with official data
The poverty maps became available in 2003, around the time that the 2002 VHLSS dataalso became available. The 2002 VHLSS data showed clearly that rapid poverty reductionhad continued and emphasized that the levels of poverty (though not the overall patternsof distribution) illustrated in the 1999 poverty maps were no longer accurate. Whileappreciating the higher levels of disaggregation available in the poverty maps, plannersand policy makers within government were frustrated by the prospect of using old dataas a basis for planning. Moreover, the fact that the poverty maps used nonofficial povertydata was an additional reason for reluctance to use the poverty maps formally in decisionmaking or in government documents. These factors did not mean that the poverty mapswere not used informally (even within the government) in framing debate and in iden-tifying issues to be tackled. But they certainly inhibited the degree to which the mapswere used formally, a problem that was recognized at the outset of the exercise. Evenwith hindsight, it is not clear what more might have been done. Arguably, the mapsmight have been produced more quickly had the balance of the work taken place out-side the country, with less iteration and interaction with local officials. But this wouldhave required trade-offs in capacity building and local ownership.
The maps are now well out of date and are used less frequently in presentations andpublications. There is an urgent need to update them. The poverty team in the World Bankoffice in Vietnam is supporting a number of activities to produce updated maps. Officialdata at the national level might now be more closely aligned to the VHLSS, suggestingthat the problems caused by the difference between the stories of poverty described inthe VHLSS and the official data are less likely to arise in the future. Furthermore, thegreater familiarity that now exists with poverty mapping techniques and the higher lev-els of enthusiasm for representing poverty data graphically suggest that updated mapswould be well received.
Engagement at subnational levels
Though one of the most significant potential uses of the poverty mapping methodologylies in the ability to provide decentralized, subnational government agencies with reliablepoverty estimates, little effort has gone into validating and promoting the poverty maps
P O V E R T Y M A P P I N G 281
10412-14_Ch14.qxd 8/16/07 2:58 PM Page 281

in the provinces. Large poverty maps may be found in central government and civilsociety offices in Hanoi, but they are very much less visible in offices in the provinces.Discussions on the poverty maps have generally taken place in Hanoi and are veryfrequently related to how the disaggregated picture of poverty should influence nationaldecision making: for example, how the targeting of lagging regions by national agenciesmight be refined; how resource allocation criteria in the Ministry of Finance might beamended; and how inequality might be tackled more effectively.
The poverty maps were discussed at regional workshops as part of efforts to dissem-inate the poverty assessment produced in 2003. But the audience at these workshopsconsisted primarily of local researchers based at regional universities. A systematicattempt to disseminate the findings of the poverty maps to 64 provinces in a meaning-ful way would require considerable resources.
There might also have been a process to work with provinces to tackle the disparitybetween the districts and to reflect on improved resource allocation at the subprovinciallevel. This was not actively pursued, partly because the problems arising from the con-flict between official poverty data and the VHLSS poverty data are compounded in theprovinces because provincial officials have generally had less exposure to the VHLSSdata. The Molisa estimates on poverty in the provinces and districts are available toprovincial officials, but these officials are less likely to recognize an estimate derived fromthe VHLSS or the poverty maps. When discussions have taken place with local officialsabout the poverty maps, the officials have been disinclined to base their work on povertydata that they have not been authorized to use. Had some kind of validation exercisetaken place in collaboration with local officials, the understanding of and commitmentto the maps might have been more substantial.
The work carried out in 2005 in Ho Chi Minh City to combine the 2004 midtermHo Chi Minh City census data and the 2004 VHLSS data has nonetheless gener-ated considerable enthusiasm. This exercise produced poverty maps based on boththe GSO poverty line and the higher, city-defined poverty line, and officials wereable to compare the different views on poverty that resulted from the use of the dif-ferent lines.
Engagement with key national agencies
One important national process that the poverty mapping exercise might have influencedwas the targeting work that has directed the flow of resources for Program 135. CEMis responsible for identifying poor communes to be included in the program. It there-fore has an institutional interest in assessing commune poverty levels. CEM did notparticipate in the poverty mapping exercise. The value of engaging with CEM and thepotential for assisting CEM in developing more robust means of targeting poor com-munes were recognized about 18 months after the poverty maps had been released. Bythat time, the data on which the maps are based was five years old. CEM is now engagedin some of the follow-up work.
282 S W I N K E L S A N D T U R K
10412-14_Ch14.qxd 8/16/07 2:58 PM Page 282

Though the Ministry of Finance was part of the multiagency task force that wasestablished as a governance structure for the poverty mapping exercise, there was littleeffort put into following up on the main messages of the poverty maps with the ministry.The poverty focus of public expenditure has improved quite remarkably over recentyears, whether or not poverty maps have played a role. In any case, the ministry remainsreceptive to new ideas and suggestions on the allocation of resources across provincesin ways that promote social equity.
Lastly, although GSO staff members have been trained as trainers in poverty map-ping techniques and contributed to many of the subsequent training sessions for otheragencies, the GSO has never been central to the actual production of the poverty maps.A more central role for the GSO might have facilitated access to census and other data.But the decision to move the production of poverty mapping estimates closer to theusers, that is, the sector ministries, was deliberate. It aimed at making sure the effortswould more easily feed into decision making.
Sustainability
The 12 analysts of the Interministerial Poverty Mapping Task Force were closely involvedin all the analytical work leading up to the preparation of the district and communemaps. As a consequence, they were able to explain the poverty mapping methodologyto their colleagues and superiors in the respective ministries. However, only one of them,the NEU researcher, was able to conduct poverty mapping calculations without supportfrom international experts. After the district and commune poverty mapping work wascompleted, the task force was no longer active. However, a series of follow-up activitieshave taken place since then. The original lead agency, ICARD, continued to producemaps of socioeconomic information from the census. But it was ILSSA that requestedfurther training in poverty mapping techniques and in testing methods for updating themaps. Over the past two years, the NEU researcher has worked with a team of ILSSAresearchers on a number of research topics. Foreign expertise was hired on only oneoccasion for this. The poverty work in Ho Chi Minh City was conducted entirely byVietnamese experts.
In Vietnam, there is now a strong demand for poverty maps that may be updatedregularly and that reflect local realities. Molisa wants to improve its targeting methodsto address the weaknesses that have been exposed. It is interested in a method thatenables the poverty maps to be updated from the bottom up through local data collectionon household characteristics. Such a method might replace the ineffective income surveysand the reliance of Molisa on poverty reporting by local officials that is easily manipulated.CEM has communicated that it needs an updated map to conduct a midterm evaluationof its program to assist the poorest communes. This may perhaps be accomplished usingthe 2006 agricultural census. Little foreign expertise will be needed to meet these demands.However, support from international experts might still be required to test new approachessuch as exploiting the panel component of expenditure surveys to update maps, using
P O V E R T Y M A P P I N G 283
10412-14_Ch14.qxd 8/16/07 2:58 PM Page 283

administrative data on population movements to take account of migration trends innew poverty maps, and verifying the methods for bottom-up poverty mapping techniques.External help might also be required to apply the small area estimation methodology tomap other indicators such as vulnerability or nutrition.
The Lessons Learned
Together with other poverty analyses, the poverty maps have undoubtedly stimulateddebates on trends in poverty, on the methodology underpinning poverty measurement,on the geographical dimensions of poverty and inequality, and on national resource allo-cation across provinces. The maps have led to increased demand for more independentdata on poverty especially at the local level. The poverty team at the World Bank willcontinue to support efforts that provide reliable poverty data, disaggregated to the levelwhere decisions are made. Future work in this area will respond to the lessons of the past10 years of experience with poverty mapping. These lessons cover the following issues.
Keeping up with changes and developing second-generation poverty maps
Vietnam is a rapidly changing country. Poverty has fallen by more than 3.5 percent peryear over the last 10 years. The population is becoming increasingly mobile. In this con-text, techniques that depend on census data that become available only every 10 yearsare not going to provide a dependable flow of updated information for policy makers.Though past attempts to update the poverty maps have not been successful, ongoingwork that is focused on updating the data on household characteristics and correctingfor past technical errors will likely deliver interesting results.
Improving outreach and use at subnational levels
The last few years have seen a growing focus on public expenditures to influence poverty.In particular, the Ministry of Finance has made efforts to revise the criteria and coefficientsit uses in determining allocations across provinces. Remote and upland areas are increas-ingly favored in the allocation of the recurrent budget. However, little progress has beenmade below the provincial level. Population figures still seem to dominate in the calcu-lations that determine how provinces allocate funds across districts and how districtsallocate funds across communes. At these levels of decision making, access to reliablepoverty data that local officials feel permitted to use and that they feel they may trustmight make a difference in the way resources flow to poor areas.
Strengthening the validation process
Future activities in producing second-generation poverty maps will include a process thatmay generate more effective technical and political validation of the small area estimates,
284 S W I N K E L S A N D T U R K
10412-14_Ch14.qxd 8/16/07 2:58 PM Page 284

as well as a better local understanding and ownership of the numbers behind the maps.It is a significant challenge to reach out to 64 provinces in a meaningful manner usingthis kind of analysis. Nonetheless, the research with the ILSSA that sought to test theupdating of poverty maps by collecting new data on household characteristics might haveincluded an exercise to verify the results informally with key local informants. This wouldhave been better than trying to compare the results with poverty estimates calculatedfrom detailed income and expenditure data that appeared unreliable.
Improving the coverage of urban migrants in household surveys
The poverty mapping work in Ho Chi Minh City demonstrated how the incompletecapture of nonpermanent migrants in the VHLSS might influence poverty mappingestimates. There is a need to examine how the sample for the VHLSS may be made moreinclusive of mobile populations. The extension of the work to ward-level differences hasbeen important in improving the understanding of urban poverty. This work has alsotaught us that there might be a useful collaboration between statistics offices and researchinstitutes outside Hanoi.
Maintaining the emphasis on capacity building
There has been a significant emphasis on capacity building throughout the povertymapping work and among the team. This has paid off in the development of a smallpool of Vietnamese experts who are confident in their ability to use poverty mappingtechniques and a larger pool of Vietnamese experts who understand enough about thetechniques to feel at ease with the products. Though working with local experts hasmeant that the maps have perhaps taken longer to produce than might have been thecase had they been produced by a team of international experts, this approach has hadbenefits. It has meant that there is a team of experts available to explain the techniquesin Vietnamese to more skeptical audiences. It means that dissemination and outreachmay be carried out in Vietnamese and that requests for technical information may besatisfied quickly. If the people’s committee of a province contacts the World Bankasking for a training course so as to understand and use the poverty maps, the exis-tence of skilled local researchers means that it is possible to respond quickly andappropriately. Future work will continue to emphasize the need to build the skills oflocal researchers in these techniques.
Strengthening engagement with national agencies where it has been deficient
Future activities will engage more directly with CEM, an agency that has a functionalrole in identifying poor communes. CEM staff are currently defining a revised list of poorcommunes, but they are hopeful they will be able to use any updated poverty maps thatbecome available as they review this list in 2008.
P O V E R T Y M A P P I N G 285
10412-14_Ch14.qxd 8/16/07 2:58 PM Page 285

Continue responding to the demand for credible local poverty measurements
Replacing the currently flawed official poverty measurement approach with the povertymapping methodology has never been a realistic objective. But the methodology hashelped crystallize the debate at the local level and even at the level of national povertymeasurement. The poverty mapping exercise has led to a search for reliable alternativesfor the measurement of poverty to replace the current approach. The Ministry of Financehas expressed an interest in making subnational poverty rates part of its criteria for budgetallocations. But it will do this only after a robust, reliable method has been identifiedthat is accepted by subnational governments.
ReferencesElbers, Chris, Jean O. Lanjouw, and Peter F. Lanjouw. 2003. “Micro-Level Estimation of Poverty
and Inequality.” Econometrica 71 (1): 355–64.Institute of Economic Research. 2005. “Report on Poverty Mapping for Ho Chi Minh City.” Report,
Institute of Economic Research, Ho Chi Minh City and World Bank, Hanoi.Minot, Nicholas W. 2000. “Generating Disaggregated Poverty Maps: An Application to Vietnam.”
World Development 28 (2): 319–31.Minot, Nicholas W., and Bob Baulch. 2002. “The Spatial Distribution of Poverty in Vietnam and the
Potential for Targeting.” Policy Research Working Paper 2829, World Bank, Washington, DC.———. 2004. “The Spatial Distribution of Poverty in Vietnam and the Potential for Targeting.” In
Economic Growth, Poverty, and Household Welfare in Vietnam, ed. Paul Glewwe, Nisha Agrawal, andDavid Dollar, 229–72. World Bank Regional and Sectoral Studies. Washington, DC: WorldBank.
Minot, Nicholas W., Bob Baulch, and Michael Epprecht. 2003. Poverty and Inequality in Vietnam:Spatial Patterns and Geographic Determinants. In collaboration with the Interministerial PovertyMapping Task Force. Washington, DC: International Food Policy Research Institute; Brighton,United Kingdom: Institute of Development Studies.
Nguyen Nguyet Nga and Martin Rama. 2006. “Combining Quantitative and Qualitative Informationto Assess Poverty Targeting Methods in Vietnam.” Unpublished monograph, World Bank, Hanoi.
Nguyen Viet Cuong, Do Anh Kiem, Pham Minh Thu, Nguyen Bao Cuong, and Nguyen Thi Lan.2004a. “Estimating Poverty Rates Using the 1999 Census and the 2002 VHLSS.” Unpublishedworking paper, Institute of Labor Science and Social Affairs, General Statistics Office, andNational Economics University, Hanoi.
———. 2004b. “Statistics Analysis and Mapping of the Relationship between Poverty Indicators andCommunes Selected for Assistance under Program 135.” Unpublished working paper, Institute ofLabor Science and Social Affairs, General Statistics Office, and National Economics University,Hanoi.
Nguyen Viet Cuong, Nguyen Lan Huong, Lo Thi Duc, and Institute of Labor Science and SocialAffairs. 2006. “Using Poverty-Proxy-Indicator Surveys to Update Poverty Maps and Identify thePoor: Evidence from Household Surveys in Vietnam.” Paper presented at the Conference “PovertyMapping: Impacts and Uses,” Siem Reap, Cambodia, February 8–9.
286 S W I N K E L S A N D T U R K
10412-14_Ch14.qxd 8/16/07 2:58 PM Page 286