poverty and deprivation in west cornwall in the 1990s
TRANSCRIPT

POVERTY AND DEPRIVATION IN
WEST CORNWALL IN THE 1990s
By Sarah Payne, Brenda Henson, David Gordon &Ray Forrest,
June 1996 Statistical Monitoring Unit School For Policy Studies University of Bristol 8 Woodland Road Bristol BS8 1TH

POVERTY AND DEPRIVATION IN WEST CORNWALL IN THE 1990s
CONTENTS
ACKNOWLEDGEMENTS INTRODUCTION EXECUTIVE SUMMARY
1 3
CHAPTER ONE: THE DEFINITION OF POVERTY, DEPRIVATION AND RURALITY
5
CHAPTER TWO: POVERTY AND DEPRIVATION IN A CORNISH CONTEXT
28
CHAPTER THREE: POVERTY AND DEPRIVATION IN WEST CORNWALL
48
CHAPTER FOUR: HOUSING AND POVERTY IN WEST CORNWALL
78
CHAPTER FIVE: POVERTY, DEPRIVATION AND HEALTH IN WEST CORNWALL
94
CHAPTER SIX: ANTI-POVERTY STRATEGIES: CONCLUSIONS AND RECOMMENDATIONS FOR WEST CORNWALL
111
APPENDIX 1: Poverty and Deprivation in West Cornwall. D. Gordon and B. Henson (1994)
APPENDIX 2: 1991 Census statistics for Cornish wards - selected socio-demographic variables
APPENDIX 3: Comparisons between wage rates in Cornwall and Devon District Council areas BIBLIOGRAPHY

ACKNOWLEDGEMENTS: This research has benefited greatly from the support and expertise of the steering committee. In particular, the researchers would like to thank the following people for their help in the preparation of this report: John Barkham; Malcolm Bell; Ursula Bentley; Susanne Bond; Alan Bruce; Ken Buckingham; Valerie Douglas; Andrew George; Ingrid Heseltine; Stephen Horscroft; Carrie Hughes; Joy Lennon; John Lindfield; Des Maddocks; David Miles; Roger Radcliffe; Valerie Rowe; Jill Shuker; Margaret Sommerville; Sandra Whitehead. We acknowledge the advice and help of Virginia Knight and Keith Cole of the Census Dissemination Unit, Manchester Computing Centre, and the help of Ed Thomas of the Department of Geography, Bristol University with GIMMS. The programming and work involved in creating the estimated mean weekly income was undertaken jointly with Peter Lee at CURS, Birmingham University. Data from The Breadline Britain in the 1990's Survey were used to create the weightings used in estimating the percentage of Poor Households. This survey was funded by London Weekend Television (LWT) with additional funding from the Joseph Rowntree Foundation and was carried out by Marketing and Opinion Research International (MORI). It was conceived and designed by Joanna Mack and Stewart Lansley for Domino Films, with the help of Brian Gosschalk of MORI. Research for the six television programmes was by Harold Frayman with additional research by David Gordon and John Hills. Christina Pantazis has done extensive work on the data to make it easy to use. The source of the Census data are the 1991 Local Base Statistics (100% and 10%) which are Crown Copyright. The Breadline Britain in the 1990’s Survey is Copyright of MORI and Domino
Films. The 1995 Welsh Omnibus Survey is Copyright of Beaufort Research and BBC Wales. The 1991 Family Expenditure Survey is Crown Copyright. The 1991 Census Local Base Statistics and Small Area Statistics (100% and 10%) are
Crown Copyright This report has been financially supported by: Rural Development Commission Devon & Cornwall Training and Enterprise Council Royal Cornwall Hospitals Trust Carrick District Council Kerrier District Council Penwith District Council Cornwall County Council

INTRODUCTION
If Cornwall's poverty were more visible, if a more authentic picture of Cornwall was available, then arguments for a different economic strategy to tourism and 'light industry' might be more successful. Meanwhile in the absence of an authentic picture the media and the tourist industry have constructed a public face of quaint West Country charm, with the Cornish themselves relegated to the role of exhibits in a cosy theme park (Williams, 1992). Poverty affects between twenty and thirty percent of people living in the British countryside. It is usually hidden from view, but it is real, with low pay, isolation and an increasing lack of public services among its starkest characteristics (Simmons, 1996).
This report is about poverty in Cornwall, specifically in West Cornwall in the 1990s. In particular we are interested in the evidence relating to the experience of poverty, deprivation and social exclusion in Cornwall, and the extent to which this experience relates to poor health and early mortality in the county. The objective of the report, however, is not only to present evidence relating to the existence of poverty, but also to suggest mechanisms for the reduction of poverty in Cornwall. This takes different directions. One important area is the development of anti-poverty strategies as these have been used in other rural areas. A second, related, theme is that of service delivery - commentators on urban poverty have largely failed to appreciate the importance of public services in the experience of and reduction in poverty. However, in rural areas, public services are crucial - both in terms of what is delivered and how it is delivered, and in this report we highlight the impact of public services on the distribution of poverty in Cornwall and the way such poverty is experienced. A third issue is that of the measurement of poverty. If poverty, deprivation and social exclusion are measured using indicators developed by commentators in urban areas based on the experience of people living in urban areas, these indicators are unable to truly explore poverty in rural areas. This means that the poor in rural areas remain invisible behind what Williams (1992) calls the 'picture postcard image' of Cornwall. However, the problem is more than the invisibility of the poor in rural areas. Where official statistics do not capture the depth of poverty, this contributes to that poverty, by influencing regional and national policy and by understating the financial needs of the area. The objectives for this report, then, are as follows. Firstly, the report aims to document the extent of poverty in West Cornwall, to provide the evidence which might reduce this invisibility of those who are poor in the area. The evidence relating to poverty is
explored intially in the context of the county as a whole, in Chapter Two, followed by a more detailed discussion of poverty at ward level within West Cornwall in Chapter Three. In doing this we discuss the problems of measurement and the ways in which it might be possible to develop an index of poverty based on rural conditions and rural needs and necessities. Two further chapters explore specific aspects of the experience of poverty - Chapter Four looks at housing and housing poverty in West Cornwall, whilst Chapter Five focuses on the evidence relating to the impact of poverty on health. A second objective of the report is to review the relevance of anti-poverty strategies and the opportunities for District Councils to utilise suitable anti-poverty strategies in their own work. This review, together with recommendations for action, is to be found in the final chapter, Chapter Six. As a whole, the report aims to decrease the invisibility of Cornish poverty and deprivation, particularly in West Cornwall; to provide useful data for District Councils in their efforts to increase central recognition of the problems faced in their area, and to suggest some means which may be immediately available to Districts to decrease poverty and the effects of poverty in their area.
POVERTY AND DEPRIVATION IN
WEST CORNWALL IN THE 1990S
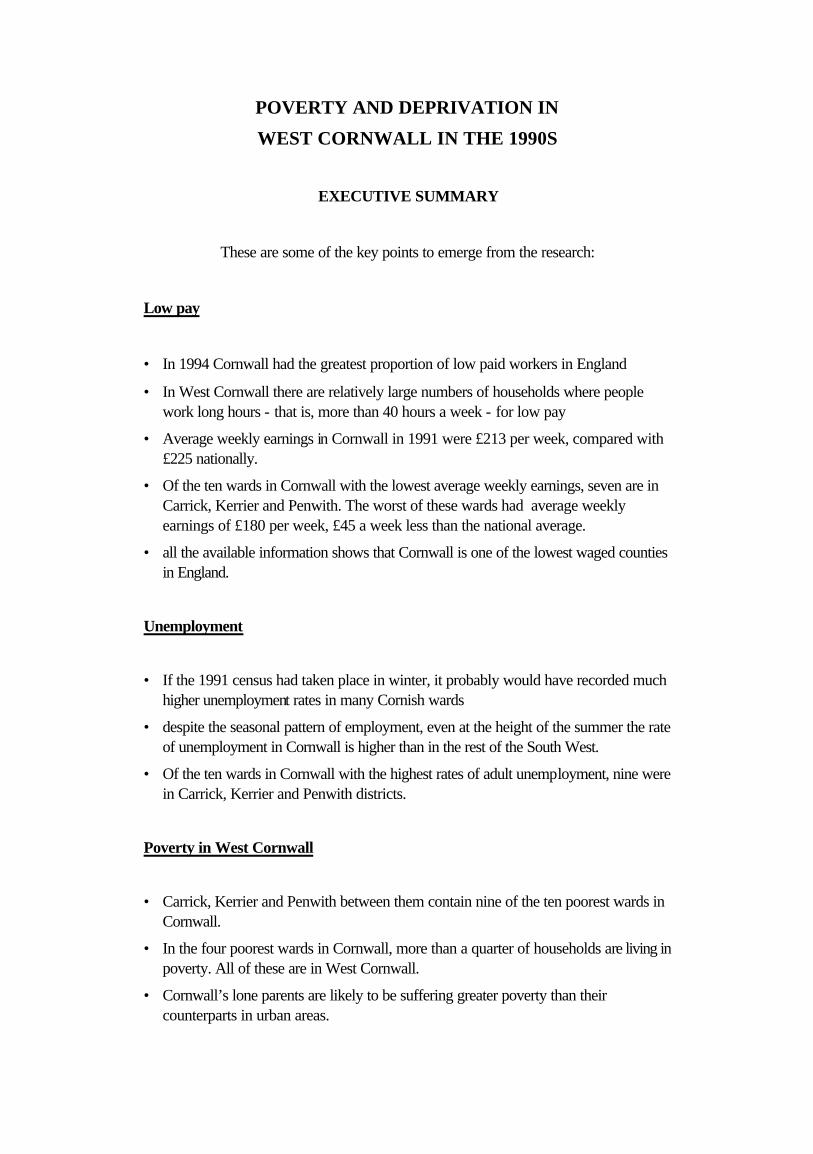
EXECUTIVE SUMMARY
These are some of the key points to emerge from the research:
Low pay
• In 1994 Cornwall had the greatest proportion of low paid workers in England
• In West Cornwall there are relatively large numbers of households where people work long hours - that is, more than 40 hours a week - for low pay
• Average weekly earnings in Cornwall in 1991 were £213 per week, compared with £225 nationally.
• Of the ten wards in Cornwall with the lowest average weekly earnings, seven are in Carrick, Kerrier and Penwith. The worst of these wards had average weekly earnings of £180 per week, £45 a week less than the national average.
• all the available information shows that Cornwall is one of the lowest waged counties in England.
Unemployment
• If the 1991 census had taken place in winter, it probably would have recorded much higher unemployment rates in many Cornish wards
• despite the seasonal pattern of employment, even at the height of the summer the rate of unemployment in Cornwall is higher than in the rest of the South West.
• Of the ten wards in Cornwall with the highest rates of adult unemployment, nine were in Carrick, Kerrier and Penwith districts.
Poverty in West Cornwall
• Carrick, Kerrier and Penwith between them contain nine of the ten poorest wards in Cornwall.
• In the four poorest wards in Cornwall, more than a quarter of households are living in poverty. All of these are in West Cornwall.
• Cornwall’s lone parents are likely to be suffering greater poverty than their counterparts in urban areas.

Hard workers • In five wards in Cornwall, 50% or more of full-time workers are working more than
40 hours a week. • Wards with a high percentage of hard workers, also have a high proportion of
people working in the ‘free economy’ - that is, in unpaid caring work. The effects of poverty • wards with higher levels of poverty, unemployment and poor housing conditions also
tended to have higher levels of morbidity, and higher mortality rates. Key Recommendations The setting up of an inter-agency forum within Cornwall with two aims: to explore the
potential for collaboration on anti-poverty strategies, and to ensure that information and research about poverty in Cornwall is shared by the different agencies in Cornwall
• Each district must assess their own level of policy commitment to anti-poverty strategies - bearing in mind that a number of ‘stand-alone’ policies such as providing financial support for benefit take-up campaigns can make a significant start
• Individual agencies need to undertake or commission a review of quality and range of their internal information systems regarding the distribution of poverty within their boundaries
• The use of figures in this report to assist in lobbying for a greater level of assistance from Europe
Sarah Payne Brenda Henson Dave Gordon Ray Forrest June 1996

CHAPTER ONE
THE DEFINITION OF POVERTY, DEPRIVATION AND RURALITY
INTRODUCTION
Local government has in recent years undergone a prolonged period of major framework changes alongside profound difficulties in meeting both old and new obligations with ever more limited resources. Increased poverty and inequality and demographic changes, such as the growing number of frail elderly people (see, for example, the Joseph Rowntree Foundation Report 1994), generate their own demands on council resources in terms of the numbers of people directly requiring services, and, where means-testing is required, in terms of the volume of administrative work involved. In recent years, new responsibilities have been added to the wide range of local authorities’ established statutory responsibilities, such as the need to plan, fund and provide certain services jointly with other agencies and sectors (for example, the community care legislation and the requirement following Local Government Review for local council tiers to work more closely); the growing trend which requires councils to engage in competitive bidding for external funds; and increasing pressures arising from the demands of the Government’s Citizen’s Charter initiative. Whilst many pressures are common to all councils, for rural councils, such as those in Cornwall the business of service planning and provision is made more difficult by the dispersed populations and the implications of this. Two key aspects to the costs of service delivery in rural areas are the additional need for services resulting from the social, economic, demographic and geographic composition of the area, and the additional problems in identifying and meeting these needs. Neither the extent of poverty nor the problems associated with service provision in rural areas have been recognised in central government policy-making, in funding the formulae used in the calculation of rural Standard Spending Assessments (SSAs), in the allocation of Revenue Support Grant (except for the application of the sparsity factor for certain selected services) or in the criteria for obtaining external funding such as Single Regeneration Budget. The SSA which determines both the level of central and total local authority spending is based on complex formulae which draw on many information sources. In rural areas these calculations do not realistically reflect the prevalence of rural deprivation. For example reliance is placed upon unemployment figures, overlooking the high levels of low-income seasonal or casual employment within areas like Cornwall. At the same time relevant indicators are not used. For example no account is taken of factors such as the high cost of housing in relation to low wage levels: a particular problem in Cornwall. This creates a pool of ‘concealed homelessness’, among individuals and families who are involuntarily sharing accommodation with relatives or friends
(demonstrated in the St Just Pilot study on homelessness, CRCC 1993) which official statistics miss. Population sparsity is the only ‘rural indicator’ recognised in the SSA formulae and only the ‘Education’ and ‘All Other Services’ (applied in the funding calculations for District Councils) SSA blocks take any account of population sparsity. Additionally the weighting attached to the sparsity indicator is relatively small, and is not currently based on hard evidence. Sparsity is a significant factor in the provision of all services and, in particular, in the Social Services, and it will become increasingly significant as more care is provided within the community. Cornwall has one of the lowest population densities of all English counties. To add to rural authorities’ sense of injustice higher unit costs in the South East receive recognition in the SSA formulae due to the Area Cost Adjustment, the methodology of which is now under review Other funding mechanisms which are used by Central Government also tend to discriminate against rural areas. Taken together the present funding formulae are often inappropriate and inadequate when applied to rural local authorities, their responsibilities and their needs. Research evidence about rural needs and costs is still limited on a national scale although work has been commissioned by the Department of the Environment to carry out research into the comparative cost of rural service provision and a report is expected later this year. A proper identification of unit costs due to rural factors would both enable local authorities covering a mix of both urban and rural communities to assess the costs of service provision, plan and allocate resources accordingly, and enable Central Government to take rural costs into account in the various funding distribution mechanisms employed. The ‘Rural White Paper’ (1995), introduced last autumn, has been welcomed for its analysis of many of the difficulties affecting rural areas. However, the optimistic interpretation of the state of rural economies, the omission of any acknowledgement of rural poverty and deprivation, the absence of proposals to tackle these issues and the heightening problem of resource shortages to meet rural needs have a increased concern among many rural authorities that the political will to tackle the fundamental problems is missing. The overall aim of this report, then, is to highlight the nature, extent and effects of poverty, deprivation and social exclusion in Cornwall. We aim to bring forward ideas for local action by councils, other statutory agencies and those in the voluntary sector who wish to contribute to tackling the problems faced by Cornwall’s poorest residents. This first chapter establishes working definitions and examines some of the specific issues around poverty and deprivation in rural areas. The second chapter looks at how these broader issues are manifested in Cornwall.

DEFINITIONS It is important to define what we mean by poverty, deprivation and social exclusion so that everyone is clear as to what is being discussed. Similarly the notion of rurality is open to many interpretations and needs clarification. POVERTY, DEPRIVATION AND EXCLUSION The concepts of poverty, deprivation and social exclusion are clearly very closely linked, as will be shown below, but while poverty is concerned with both low income/resources and low standard of living, the concept of deprivation covers life circumstances which are independent of income but which are experienced by people who are poor (Townsend and Gordon 1991). Social exclusion is also discussed as a phenomenon which is frequently related to but can be independent of, poverty. Poverty The concept of poverty which is now most commonly accepted is the relative concept, which is grounded in, and relates to the society in which a person or household lives.1 The definition of poverty set out by the Council of Europe in 1984 (85/8 EEC) adopts the relative concept, in that;
The poor shall be taken to mean persons, families and groups of persons whose resources (material, cultural and social) are so limited as to exclude them from the minimum acceptable way of life in the Member State in which they live.
This echoes Townsend’s (1979) definition;
Individuals, families and groups ... can be said to be in poverty when they lack the resources to obtain the types of diet, participate in the activities and have the living conditions and amenities which are customary, or are at least widely encouraged or approved, in the societies to which they belong. Their resources are so seriously below those commanded by the average individual or family that they are, in effect, excluded from ordinary living patterns, customs and activities.
There is no official ‘poverty threshold’ in the UK but rather a range of low income yardsticks which are used as proxy measures of poverty. Common examples of these include the following: • A person may be regarded as living in, or on the margins of poverty if their income is
below 140% of the level at which Income Support would be set for that particular individual and his/her household.
• Income below a regularly adjusted low pay threshold set by the Department of
1 The alternative concept is that of absolute poverty, which is based on calculating whether a
person or household has the necessary resources for basic subsistence.

Environment in the annual New Earnings Survey. • Income levels in relation to mean or median wages. • Income in relation to the European Decency Threshold. Deprivation Townsend (1993) has defined deprivation more fully as “a state of observable and demonstrable disadvantage relative to the local community or the wider society or nation to which an individual, family or group belongs”. Deprivation can be seen as the actual lack of goods, activities and services taken for granted by the majority in a society. People are poor if they suffer from both deprivation and low income. Social Exclusion The idea of social exclusion is one which arose both in Townsend’s (1979) and the Council of Europe’s (1984) definitions of poverty. It has become increasingly common as a way of looking at social inequalities across Europe and within the UK. In April 1992 the Inter-Service Group of the EU Commission stated that:
Today the concept of social exclusion is taking over from poverty ... it ... emphasises the multidimensional nature of the mechanisms whereby individuals and groups, even whole territories, are denied participation in the exchanges, practices and social rights that make for social integration. Social exclusion does not only mean insufficient income and it even goes beyond participation in working life: it is clearly reflected in the fields of housing, education, health, social life, etc.
The idea of social exclusion can be especially helpful in dealing with deprivation in rural areas. Phillips and Williams (1984) described rural deprivation as, for example:
an absence, or in a rural context unavailability because of distance, of goods and services, ... a ‘lack’ of well-being. This could be caused by an uneven distribution or unavailability of ‘impure’ public goods such as health care, education and the welfare services, but also by a lack, say, for rural dwellers to obtain good housing at a fair price, to enjoy cultural and recreational activities and to have access to a range of jobs, services and information available to urban residents.
This definition describes the multi-dimensional nature of social exclusion, which does not necessarily require the existence of poverty as defined above. Social exclusion is more likely to be present in rural areas by the nature of those areas, and has a particularly harsh impact on people whose incomes prevent them from accessing the (higher cost) market solutions to the problems which rurality presents.

The higher costs of rural life include direct personal expenditure to obtain the necessities, for example either through paying the higher costs of shopping locally, (usually for lower quality goods) or through the need to own and maintain a car in order to travel to the nearest town to access a wider range of goods at lower purchase prices. In some areas the added costs are also exacted through increases in Council Tax to pay for such services as the maintenance of village schools, fire services and to meet the growing demand for community care. Costs also arise from the absence of subsidised public goods, a common feature in rural areas. Such goods include regular bus services, leisure facilities, a choice of shops, a post office, information and advice centres, a choice of local GP, and a range/choice of other health and social services. Because of these kinds of additional living costs, at any given level of income and/or household resources families in rural areas tend to experience greater disadvantage than families in urban areas. To a great extent, therefore, it may be assumed that poverty in rural areas implies both deprivation and social exclusion which can be extreme.
RURALITY Defining ‘rurality’ is notoriously problematic so far as producing a definition which is capable of being used in a way which facilitates studies and comparisons of quantitative data on ‘rural areas’. For the purposes of establishing Rural Development Areas, the Rural Development Commission excludes settlements of 10,000 population or above from its definition of rural areas. This places 93% of Cornwall within a Rural Development Area, and in West Cornwall, all settlements other than Truro, Falmouth, Camborne/Redruth and Penzance fall within the RDC’s definition of rural. Whilst these towns are considered too large to count as ‘rural’, with populations of under 20,000 they would nevertheless be regarded as very small towns by most urban standards. The Organisation for Economic Co-operation and Development (OECD 1994) has devised a classification method which deals with the problem of defining ‘rurality’ within its member countries. The OECD states that:
...population density is ... a key indicator for rural analysis at the OECD level. It serves as the main criterion for the distinction of rural from urban population and area. Density reflects territorial differences in settlement pattern. It also indicates difficulties in getting or providing access to infrastructure and services (OECD 1994).
The OECD classification is arrived at by aggregating population densities on a ‘regional’ basis and assigning each ‘region ̀the label of ‘Predominantly Rural̀ , ‘Significantly Rural’ or ‘Predominantly Urban’. In the UK, ‘regions’ equate to counties or metropolitan council areas (pre-Local Government Review) and in spite of its industrial heritage and the patterns of settlement around old mining works and manufacturing industries, Cornwall’s overall population sparsity puts the County into the ‘predominantly rural` category, together with seven other English counties. Thus for OECD purposes in this
regard, Cornwall is a self-contained Predominantly Rural region.
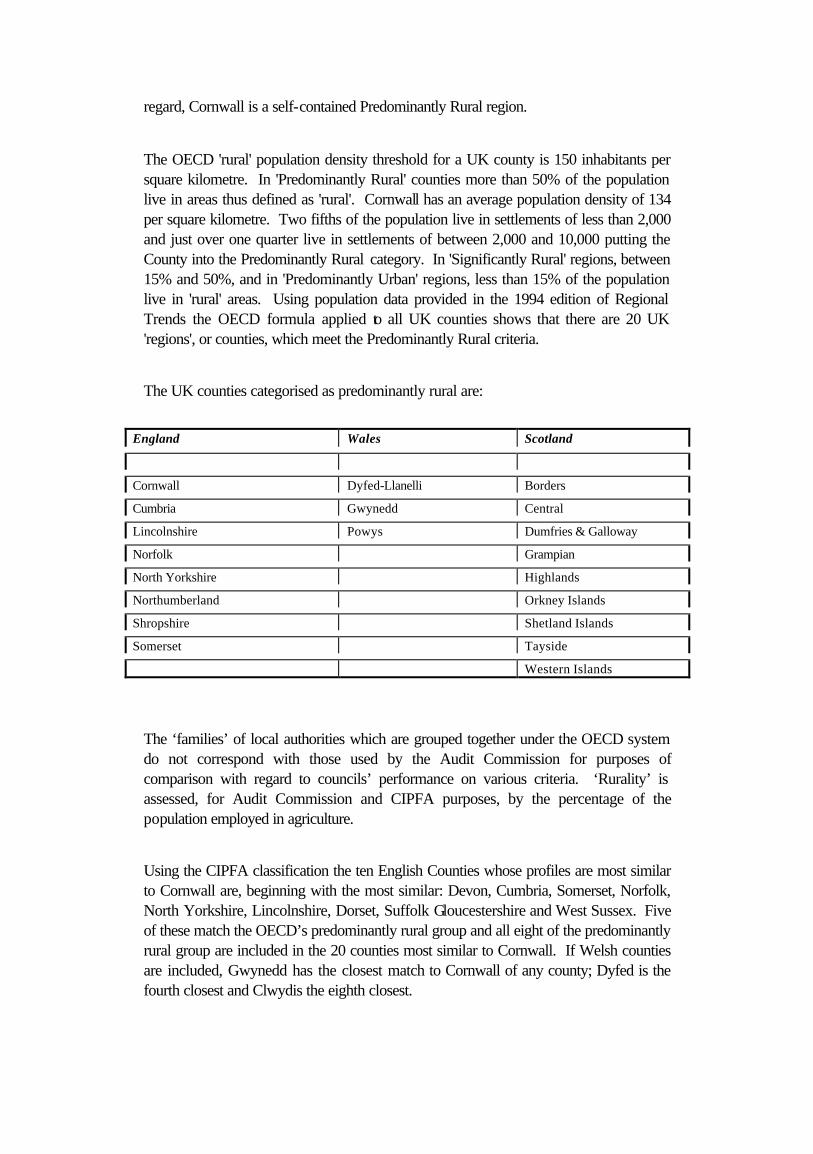
The OECD 'rural' population density threshold for a UK county is 150 inhabitants per square kilometre. In 'Predominantly Rural' counties more than 50% of the population live in areas thus defined as 'rural'. Cornwall has an average population density of 134 per square kilometre. Two fifths of the population live in settlements of less than 2,000 and just over one quarter live in settlements of between 2,000 and 10,000 putting the County into the Predominantly Rural category. In 'Significantly Rural' regions, between 15% and 50%, and in 'Predominantly Urban' regions, less than 15% of the population live in 'rural' areas. Using population data provided in the 1994 edition of Regional Trends the OECD formula applied to all UK counties shows that there are 20 UK 'regions', or counties, which meet the Predominantly Rural criteria.
The UK counties categorised as predominantly rural are:
England Wales Scotland
Cornwall Dyfed-Llanelli Borders
Cumbria Gwynedd Central
Lincolnshire Powys Dumfries & Galloway
Norfolk Grampian
North Yorkshire Highlands
Northumberland Orkney Islands
Shropshire Shetland Islands
Somerset Tayside
Western Islands
The ‘families’ of local authorities which are grouped together under the OECD system do not correspond with those used by the Audit Commission for purposes of comparison with regard to councils’ performance on various criteria. ‘Rurality’ is assessed, for Audit Commission and CIPFA purposes, by the percentage of the population employed in agriculture.
Using the CIPFA classification the ten English Counties whose profiles are most similar to Cornwall are, beginning with the most similar: Devon, Cumbria, Somerset, Norfolk, North Yorkshire, Lincolnshire, Dorset, Suffolk Gloucestershire and West Sussex. Five of these match the OECD’s predominantly rural group and all eight of the predominantly rural group are included in the 20 counties most similar to Cornwall. If Welsh counties are included, Gwynedd has the closest match to Cornwall of any county; Dyfed is the fourth closest and Clwydis the eighth closest.

POVERTY, DEPRIVATION AND SOCIAL EXCLUSION IN RURAL AREAS Measuring Rural Deprivation: Some Problems with Urban Indicators A key factor in the under-estimation of deprivation in rural areas is the use of social and economic indicators which are predicated on urban conditions as the norm. Shucksmith (1990) and others have argued the need for qualitative surveys to provide better information about rural deprivation, and that such surveys should look at households rather than spatial units. In the previous section, problems with the calculation of Standard Spending Assessments (SSAs) were discussed. These calculations rest partly on census data which are selected to serve as proxy indicators for deprivation. For example, the proportion of the population who are members of minority ethnic groups or the proportion of lone parent households, are assumed to be equally good proxies for deprivation in both West Cornwall and Plymouth. The resulting low ‘scores’ for Cornwall creates a misleading impression of the extent of deprivation. For the purposes of Rural Development Area designation the Rural Development Commission (RDC) employed a set of indicators which were considered more sensitive to rural conditions than the Index of Local Conditions2 (DOE 1994). Nevertheless there remain shortcomings and the RDC is in the process of commissioning preparatory work for the construction of an appropriate rural deprivation index. The growing call for qualitative data underlines the fact that there are important differences between rural conditions and patterns of living and working, and those which are characteristic of urban life. Rural poverty, deprivation and exclusion are dispersed rather than spatially concentrated, and may be manifested along somewhat different lines. These differences, and the effects of population sparsity need to be taken into account when measuring deprivation in rural areas. There is at present no mechanism by which these considerations are built into the weightings of the individual indicators which make up the ILC and the growing trend of local authorities adopting their own sets of deprivation indicators is symptomatic of a widespread recognition of these problems. Whichever set of indicators is used the central problem remains that, whilst census and other data may be of use in measuring deprivation they are proxies which are employed to substitute for data on personal or household incomes which are a much more direct indication of economic and social needs. Government recognition of the problems of measuring and understanding rural deprivation has manifested itself in the form of two major in-depth studies of selected 2 The Department of the Environment’s Index of Local Conditions (ILC) is the ‘official’
deprivation index, developed by the University of Manchester (Robson et al 1995). The ILC was originally conceived as an urban index to be used to help look for the successors to the 57 Urban Programme Authorities (Robson per. com.). It is therefore, unsurprising that it does not work well in Cornwall.

rural areas commissioned by the Department of the Environment in conjunction with the Rural Development Commission (McLaughlin 1985 (unpublished), Cloke 1994). The first study, by McLaughlin, was based on fieldwork carried out in 1981 in five specially selected rural communities in Essex, Northumberland, Shropshire, Suffolk and Yorkshire which were intended to represent “... approximations to “ideal types” of different rural localities”. The Northumberland study area was, probably the closest in type to Cornwall. It consisted of “6 parishes on the coast in or on the edge of the designated AONB and selected as typifying a high amenity coastal area with primary employment in tourism and the fishing industry” (p14), however, it did not reflect Cornwall’s high rate of in-migration. McLaughlin’s report was submitted in June 1985 but never published. Nevertheless, the report was significant in that it provides evidence of the difficulties facing rural people living on low incomes, and the problems for councils charged with providing for the needs of rural populations. Much of the subsequent academic work around rural deprivation, including the background material for this report, has been built on this McLaughlin’s study. The second study followed up much of the work carried out by McLaughlin, extending the research to an additional seven rural areas in Cheshire, Nottinghamshire, Northamptonshire, Warwickshire, West Sussex, Wiltshire and Devon (Cloke 1994) and found similarly high levels of poverty in the rural areas studied. These major studies showed that a significant proportion of the total rural population live on very low incomes and/or experience social deprivation. (Using the Townsend measure of 140% or below Income Support level, between 20% and 25% of rural households appear to be in or on the margins of poverty, with a figure of over one third in some areas of Nottinghamshire and Devon). In summary, there is a growing consensus that methods used by government departments in measuring rural social needs and economic prosperity should be appropriately refined and complemented by qualitative data. In the meantime a growing number of Councils and other agencies are producing their own sets of indicators, and carrying out their own qualitative studies to help them with service planning and resource allocation. Is rural poverty different from urban poverty? Poor people are those who suffer from both a low standard of living and a low income. Those who have a low standard of living but a high income are not poor. Also ‘not poor’ are those people who have a low income but a reasonable standard of living. Poverty is an enforced low standard of living due to a lack of resources (the term ‘resources’ includes income). Studies of people’s behaviour after they have experienced a drastic cut in resources show that they sometimes act to fulfil their social obligations before they act to satisfy their physical wants. They require income to fulfil their various roles and participate in

the social customs and associations to which they have become habituated and not only to satisfy their physical wants (Townsend and Gordon 1989). Poverty can be defined as a state where resources are so seriously below those commanded by the average individual or family that the poor are, in effect, excluded from ordinary living patterns, customs and activities. As resources for any individual or family are diminished, there is a point at which there occurs a sudden withdrawal from participation in the customs and activities sanctioned by the culture. The point at which withdrawal escalates disproportionately to falling resources can be defined as the poverty line or threshold (Townsend 1979, 1993). When people experience a large drop in income (for example, due to unemployment), they make choices about which areas of expenditure to cut back on. They restrict expenditure on some areas of their lifestyle more than others. If the lack of income persists, then the amount of choice becomes more and more restricted until a deep state of poverty is reached where choice becomes virtually non-existent, eg homeless people living on the streets have very little choice about what to spend their money on. The choices people make when restricting expenditure are influenced by a wide range of factors such as age, sex, social class, family circumstances, education, culture, etc. However, these choices are also influenced by the person’s geographical location. Therefore, it would be expected that poverty in rural areas would be different to poverty in urban areas since people living in rural areas would have a number of different priorities to urban dwellers. One way of exploring these urban/rural differences is to examine what people in rural and urban areas consider to be the necessities of life, eg ‘those things that all people should be able to afford and which they should not have to do without’ (Mack and Lansley 1985). This ‘consensual’ or ‘perceived deprivation’ approach to measuring poverty was pioneered in 1983 by the Breadline Britain survey. This study set out to determine whether there are some people whose standard of living is below the minimum acceptable to society. It defined ‘poverty’ from the viewpoint of the public’s perception of minimum need:
This study tackles the questions ‘how poor is too poor?’ by identifying the minimum acceptable way of life for Britain in the 1980’s. Those who have no choice but to fall below this minimum level can be said to be ‘in poverty’. This concept is developed in terms of those who have an enforced lack of socially perceived necessities. This means that the ‘necessities’ of life are identified by public opinion and not by, on the one hand, the views of experts or, on the other hand, the norms of behaviour per se (Mack and Lansley 1985).
The 1983 Breadline Britain survey of Great Britain was repeated in 1990 and, more recently, in Wales in November 1995. All three of these studies found that there was widespread agreement across British society on the necessities of life. The overwhelming majority of people, irrespective of age, sex, class, etc, agreed that everybody should be able to afford adequate clothing, food and housing and the ability to feed themselves and their children and to keep themselves warm. However, there

were a number of differences in the perceptions of people living in rural and urban local authority districts which reflected both the different social compositions of these populations as well as the effects of these different environments. Table 1.1 shows the items that a higher proportion of people living in rural local authority districts considered to be necessities of life, compared with those living in urban and suburban districts. The results are from two household surveys, the Welsh Omnibus Survey which was carried out in every Welsh local authority district in November 1995; and the Breadline Britain in the 1990’s survey which was carried out on a nationally representative sample of household in July and November 1990. Rural districts were defined using the Office of Population, Censuses and Surveys (OPCS) area type classification (Craig 1985, Denham et al 1995). A car was considered to be a necessity by a higher proportion of rural dwellers than urban dwellers. This is unsurprising, considering the relative lack of public transport in many rural areas and the greater distances that need to be travelled. A number of other household facilities were also more likely to be considered necessities by a greater number of people in the countryside, eg fridges, telephones and washing machines. This is probably due to the relative lack of facilities (such as launderettes and supermarkets) and the greater isolation (lack of telephone) of people in rural areas. Table 1.1: Items More Likely to be Thought of as ‘Necessities of Life’ by
People Living in ‘Rural’ Local Authority Districts Compared with those Living in ‘Urban and Suburban’ Areas
Deprivation Type Wales 1995 (N=1,007)
Great Britain 1990 (N=1,831)
Durables and Household Goods
A Car. A Car.
A Fridge. A Telephone. A Washing Machine. Financial Security Regular savings of £10 a
month for ‘rainy days’ or retirement.
Regular savings of £10 a month for ‘rainy days’ or retirement.
Household Insurance. Insurance of contents of dwelling.
Household Facilities A damp -free home. A damp -free home. Heating to warm living areas in
the home if it’s cold. Heating to warm living areas in the home if it’s cold.
Bath or Shower not shared with another household.
Bedrooms for every child over 10 of different sexes.
Family Activities Presents for friends or family once a year.
Child’s participation in out-of-school activities.
Three meals a day for children. Hobby or leisure activity. Clothing A Dressing Gown.
Notes on Table: The number of ‘rural’ households was 285 in the 1995 Welsh Omnibus Survey and 367 in the Breadline Britain in the 1990’s Survey. The differences in the results from these two surveys are largely due to the greater number of questions (44) on the ‘necessities of life’ asked in the Breadline Britain in the 1990’s Survey compared with 23

questions in the 1995 Welsh Omnibus Survey.
The rural population in both the 1995 Welsh survey and the 1990 Breadline Britain survey was significantly more likely to be concerned about financial security (regular savings and household insurance). This, in part, may be explained by the greater numbers of retired and elderly people living in the countryside but also by the relative low pay and job insecurity in rural Britain. Rural dwellers are also more likely to consider housing conditions to be important, particularly adequate heating and the absence of damp. This is unsurprising considering that rural areas are, on average, colder than urban areas (urban areas generate a ‘heat island’). Similarly, certain family and children’s activities were considered to be important by people in rural Britain and Wales which again may reflect the relatively greater isolation of families in rural districts. Since there seem to be a number of differences in the perception of the ‘necessities of life’ between people living in rural and non-rural districts, it would be expected that there would also be differences in the frequency of the types of deprivation suffered by rural and non-rural households living in or on the margins of poverty. There will, of course, also be differences that result from the nature of rural living. Unfortunately, there have been no large scale studies in Cornwall that have attempted to directly measure poverty or deprivation. However, the 1995 Welsh Omnibus Survey can be used to provide an indication of the differences that might exist between rural and non-rural households in England. These results should be treated with some caution because although there are some analogies between the Welsh and Cornish situation (both have rural villages that have experienced a dramatic decline in mining and industry) the decline of industry in Wales has been much more recent than in Cornwall. There are also national differences between Wales and Cornwall, for example Cornwall has witnessed significantly more in-migration than Wales. Figure 1.1 shows the proportion of households/families suffering from different kinds of deprivation in rural and urban/suburban districts of Wales in November 1995. A higher proportion of rural households suffer from deprivation of clothing, children’s activities and certain types of household goods. Conversely, rural households are less likely to suffer from financial insecurity or food deprivation and are equally likely to suffer from housing deprivation. There are a number of possible explanations for these findings. The large difference between rural and urban Wales in the prevalence of deprivation of children’s activities is primarily due to the relative isolation of children in rural areas, which places real physical restrictions on their social and out of school activities, particularly in low income households. The differences in household goods seems to result from the financial limitations placed on rural households because of the greater need for a car, or by the relatively greater

cost of public transport. This may mean that low income households have less money to spend on other types of household good (such as televisions, etc). Figure 1.1: Proportion of Households/Families Suffering from Different Kinds of Deprivation in Rural and Urban Districts of Wales in 1995
% Households/Families
0
5
10
15
20
25
ClothingDeprivation
Children'sActivity
HouseholdGoods
FincialInsecurity
HousingDeprivation
FoodDeprivation
Rural Wales
Urban Wales
Source: Welsh Omnibus Survey, Nov. 1995 Sample Size: 1,007 Households (Rural = 285) © Beaufort Research and BBC Wales The differences in clothing deprivation may be a reflection of rural lifestyles, since there tends to be a smaller range and less choice of clothing in rural shops compared with shops in urban areas. The lower proportions of rural households suffering from financial insecurity may be due to the relatively greater costs of household insurance in urban areas (due to higher crime rates), but also the greater importance that rural households place on financial security (see previous discussion). The differences in food deprivation may be due to rural households having a greater opportunity to obtain cheaper food compared with urban households. Although food in many rural shops tends to be more expensive than in urban shops (McLaughlin 1985) it is often assumed (by government statisticians) that ‘poor’ rural households may be able to obtain inexpensive food by growing it themselves or by having access to ‘cheap’ farm gate sales. All these explanations should be treated with some caution, since there has been so little research into the causes of the differences between rural and urban poverty, all explanations are at present largely speculation.

In light of these rural/urban differences and drawing on the reports of McLaughlin, Cloke and others, the following sections draw attention to a range of qualitative factors which need to be considered when looking at the circumstances of people on low incomes, and attempting to measure deprivation in rural areas.
Rural Services and Equity
A National Council for Voluntary Organisations (NCVO 1994) report states that:
... the basic perspectives assumed by policy makers generally have an ‘urban tilt’. Plans and policies are developed using urban norms; city experience shapes assumptions made about available facilities, services and transport, etc. Where differences are recognised, rural communities are often viewed as a ‘minority’ community and risk being deemed a second order issue.
Politicians and opinion formers whose personal experience is of city and town life tend to assume that everyone is able to catch a bus at regular intervals throughout the day and evening, visit the dentist or doctor without making elaborate arrangements, shop around for a choice of the particular commodity they need or require, choose from a number of local schools and access a range of leisure and cultural activities. The NCVO draw attention to the significance of the urban mind-set and the extent to which it contributes to the invisibility of important aspects of rural poverty.
The 1995 Survey of Rural Services looked at the availability of a range of key services in rural areas. Table 1.2 summarises some of their findings.

Table 1.2: Availability of Public Services in Rural Areas
Services Percentage of parishes without this service
Permanent Shop 39 Post Office 36 School 58 Village hall/community centre 90 Daily bus service 60 After school groups 95 Day care for elderly 60 Day care for handicapped 94 Bank or building society 98 Permanent GP surgery 84
Source: Rural Development Commission (1995) A steady decline in rural services has been associated with migration patterns which have brought into rural areas mobile, and more affluent households who are less reliant on, or less inclined to use village services (see McLaughlin 1985). At the same time significant proportions of the less affluent local population, whose usage previously made such services more viable, have migrated to towns and cities. The absence of key services and facilities creates a problem of access to these for people on low incomes and for Councils attempting to provide equity of service provision to all their constituents. Rural Employment Patterns and the Influence of the ‘Dual Labour Market’ Unemployment statistics, and particularly those for long term unemployment, are among the most commonly used deprivation indicators. However, they fail to reflect the range and diversity of employment circumstances in rural areas which gives rise to deprivation among a substantial proportion of the working population. For example, concealed within the figures showing the numbers in employment is widespread underemployment with temporary, part-time, casual and seasonal work being particularly common in some of Cornwall’s major employment sectors such as tourism, agriculture, and fishing and construction. Such work patterns make the long-term unemployment count particularly unreliable, but at the same time limit households’ ability to save or cope with larger items of expenditure, and create lower standards of living in the long term. Another important feature of the rural job market is the comparatively high level of self-employment. The UK average figure for self-employment in spring 1993 was 11.3% (Regional Trends 1994). In Cloke’s (1994) study, 29% of his sample who were economically active said they were self-employed. This confirms a high level of self-employment which was revealed in McLaughlin’s (1985) study. An examination of patterns of self employment shows considerable regional differences in self-employment and some major differences between urban and rural figures. Although self-employment is often regarded as a signal of prosperity there is evidence to

suggest that this is far from universally so, and particularly in rural areas. The National Association of Citizens Advice Bureaux have reported that recession had led to increasing numbers of employees across the country being pressurised to change their status from employed to self-employed as a means of saving employers’ overheads. A deterioration across a range of working conditions, and a loss of security was a common outcome for those affected (NACAB 1993). Additionally, the evidence for a rural culture of self-reliance reported by Scott et al (1991) would indicate that self-employment may operate as a more acceptable alternative to unemployment, despite bringing a very low income. Remoteness from, and difficulty in getting to, Job Centres and benefit offices can be a strong deterrent against registering as unemployed, whilst the more advantageous - and less stigmatised - allowances available under the Family Credit scheme could provide an incentive to claim this benefit rather than Income Support. In general terms benefit take up levels in rural areas are significantly lower than that they are in urban areas. This adds to the unreliability of unemployment figures and Income Support claimant figures as an indicator of rural deprivation. Social Trends 1994 states that: “A particularly interesting finding is that the full-time self employed make up around ten percent of the bottom quintile of incomes”. The Department of Social Security (DSS 1993) found similar results in data from their Households Below Average Income analysis taken from the Family Expenditure Survey. In their study of women and employment in rural areas, Little et al (1991) found that on average 54% of their sample of women of working age were in paid employment compared to a national average of 68%. This included a significantly higher rate of part-time work than the national average. High proportions of women in their sample in Wiltshire and Cornwall were self-employed and this included women engaged in ‘domestic and cleaning work’. Working conditions were, in some respects, considerably worse than those of women nationally. The rates of pay, holiday and leave entitlements and training were poor or non-existent on the whole and trade union membership was low. Of those who were not in paid work but said they would like to be, very few women actually registered as unemployed or regarded themselves as such.
Rural pay Local wage levels in most rural areas are below the national mean, fell further in relation to national wage levels during the period 1980-1991 (Cloke 1994) and appear to be falling even further since the abolition of Wages Councils. McLaughlin (1985) and Cloke’s (1994) studies showed an average of 20-25% of rural populations living in or on the margins of poverty with some significant variations above that average (for example, the figure was 34.4% in the Devon study area, the only rural area in the South West included). Clearly people on low pay form a significant section of this group.

Detailed analysis of data from the annual New Earnings Survey (NES)3 using the OECD classification of area types, clearly shows higher proportions of full time male and female adult workers receiving low wages in areas which are predominantly rural than in either significantly rural or predominantly urban areas. Figure 1.2 shows that in 1995, 28% of full-time male workers in predominantly rural areas earned less than £220 per week gross. This compares with only 20.7% earning less than this in England as a whole. Similarly, Figure 1.3 shows that over a third of women in predominantly rural areas earned less than £170 per week gross, compared with less than a fifth of women in predominantly urban areas. In the preliminary study of Poverty and Deprivation in West Cornwall by the Bristol Statistical Monitoring Unit (Gordon and Henson 1994; Bruce, Gordon and Kessell 1995: see Appendix One) it was found that; “in West Cornwall, there appear to be a relatively large number of households where people work long hours for low pay.” This analysis of the New Earnings Survey clearly demonstrates that this problem was not confined to West Cornwall but was common throughout rural Britain. In 1995, the rural counties of Britain contained the highest proportion of low paid full-time workers. Figure 1.2: Percentage of Full-Time Low Paid Male Earners by Area Type
% full-time low paid male earners New Earnings Survey 1995
0.0
10.0
20.0
30.0
Area Type
Pred Rur Sig. RurPred Urb England
28.0
22.619.6 20.7
Source: New Earnings Survey 1995
3 The New Earnings Survey: The New Earnings Survey is undertaken annually by the
Department of Employment and part E (Tables 110 and 113) provides gross pay data for male and female full-time employees on adult rates.

Figure 1.3: Percentage of Full-Time Low Paid Female Workers by Area Type
% full time low paid female workersNew Earnings Survey 1995
0
10
20
30
40
Area type
Pred rur Sig RurPred Urb England
33.527.6
19.9 22.1
Source: New Earnings Survey 1995
The differences between rural and urban counties were less pronounced in the data for 1981 than for 1995, demonstrating a growing pay gap between urban and rural areas. As in-migration continues, with more and more professional middle class households moving into the more accessible areas of the countryside, rural income levels diverge widely but the incomes of highly paid professionals raise average pay levels and thus help to disguise the extremes of low pay in those areas. For this reason it is important to desegregate earnings figures in order to look at what is happening among the lower paid in rural areas. Low earnings levels not only impact on the health of the local economy but they also mean that for many local people, consistently low earnings during their economically active years is likely to result in a greater risk of poverty and deprivation in retirement and old age. The Ageing Population The presence of a growing number and proportion of elderly people in rural areas, in conjunction with the out-migration of many younger people of working age, has implications in terms of service needs, particularly for the very elderly who are living alone. The percentages of older and very elderly people are generally high in rural areas compared with the national average. Amongst this ageing population are both people who are local and those who have moved in, some during their working lives and others to retire. For elderly ‘incomers` the prospects can be bleak when health and strength deteriorate. The changing demography with the consequent weakening of rural communities, and an
increase in the proportions and numbers of dependent and frail elderly people remaining in their own homes, is reducing the availability of informal social support networks. The children of elderly ‘locals’ will not necessarily be on hand to provide support, and those who have moved to the area may not have the family or social networks available to assist them as they become more frail. Commenting on the phenomenon of elderly migrants with no local ties the Eurosocial Report No 16 (1985) said ‘The village has become an asylum where the elderly are dumped to die slowly.’ The weakening of the fabric of rural communities, represented in changes through migration and the loss of local kinship networks, and the increase in proportions of rural women participating in the paid workforce, will inevitably reduce these communities’ capacity to provide for the needs of local residents without increased intervention and support from local authorities. Domiciliary care in rural areas tends to be more expensive to provide in terms of travelling, staffing and other resource costs. The pattern of residential care provision depends largely on the availability of suitable accommodation in registered homes. These may not be close to the client’s original home in many rural areas. This restricts the client’s choice and leads to additional travelling costs for family visitors. Younger Long-Term Sick and Disabled People Surveys carried out among non-elderly people with particular needs in Somerset (Somerset Social Services 1994) have underlined the fact that those who live in rural areas face a range of added disadvantages arising from the nature of their place of residence and the distribution of infrastructure services. An important example was the lack of accessible, affordable and reliable transport to reach the services and social contacts on which people rely. Day services and work opportunities for people with disabilities are predominantly based in towns. In most rural counties, there are areas where public transport is minimal, the bus service is expensive relative to incomes, and concessionary fares schemes, where they exist, are limited. In addition, few public buses are capable of accommodating wheelchairs nor are the majority easily accessible to people with arthritis or other mobility restricting conditions. Thus people with disabilities often have no option but to depend on volunteer transport services to get them into town. People who use Somerset’s Social Services revealed a demand for the independence afforded by work opportunities. However the structure and conditions within the rural job market, with a predominance of small employers4 reduces the prospects of suitable employment for people with physical, sensory or learning disabilities or with a mental illness. Clearly anyone who is disadvantaged in the search for secure and adequately paid work in a climate of high unemployment is at greater risk of experiencing deprivation.
4 Small businesses are not required to provide equal work opportunities to people with
disabilities by law.

Women in Rural Areas Women have a range of particular social and economic roles in relation to families, the community and the economy and needs related to these roles. They live longer than men and they are more likely than men to form one parent families and very elderly one person households. It is important to bear in mind that although women live longer they are often less healthy and have a greater need (partly age-linked) to use social care and health services. They are more likely to suffer from mental illness, particularly depression (Glendinning and Miller 1992; Payne 1991). In a study of Women and Employment in rural areas carried out by Little et al (1991) the two major constraints affecting women’s employment opportunities were the lack of available transport and the lack of appropriate and affordable child care. Women were often unable to apply for jobs for which they were qualified and consequently many were in low paid jobs which did not reflect their training and abilities. Gordon and Forrest (1995) have mapped the distribution pattern of the ‘Free Economy’, the distribution of people who spend all or a large proportion of their time caring for others in an unpaid capacity. Rural areas - and in practice women in rural areas - make up the vast bulk Britain’s free economy. This contribution to the nation’s economy is unpaid, is not valued, has no link with the national insurance system and is not counted as part of the GDP. This unmeasured volume of unpaid work contributes to women’s poverty in younger and older age rather than helping to relieve it. An unknown, but significant number of women are victims of domestic violence and sexual assaults. Evidence from the British Crime Survey (1992) and qualitative studies show that these are vastly under-reported crimes. Domestic violence has been linked with ‘economic conditions, bad housing, relative poverty, lack of job opportunities and unfavourable and frustrating work conditions’ (Smith 1989). For women who live in towns and cities access to transport and relative geographical proximity to helping agencies inevitably make escape and reporting easier and support more accessible. In a rural context the stigma which is still felt by the victims of such crimes, combined with difficulties associated with a more closed community, lack of access to an independent income, to transport, to alternative accommodation and to police protection add to the difficulties for those wanting to flee violence. Such factors seem likely to lead to higher rates of under-reporting of domestic violence in rural areas (Derounian 1993). To compound the difficulties, family and marriage guidance counselling which might help prevent marriage breakdown due to violence, or indeed other pressures, are difficult to access for people in rural areas. For parents and, particularly, mothers of younger children with special needs, there is a lack of specialist nursery provision in rural areas. Carers of younger children with potentially very demanding needs have limited respite opportunities (particularly if they have moved into the area from elsewhere and lack local kinship and other support

networks) and many are likely to have additional difficulties in attending appointments at urban-based specialist health or social care facilities. Children and Young People Under the Children Act 1989, ‘children in need’ include 11-16 year olds who are: excluded from school; have poor school attendance records; are being looked after by foster parents and residential care homes or are involved in the youth justice system. There are often few foster carers in rural areas, relative to the need, and these can be widely scattered. Where children are being looked after away from home it is important that they are able to continue at the same school and retain contact with siblings, but if the child’s school or foster home is in a rural area the logistics and cost of this can be problematic. Child care organisations report particular problems surrounding the establishment of playgroups and playschemes in rural areas (Somerset County Council 1995). Parishes without playgroups tend to be those which are more sparsely populated and less likely to have social focal points such as village shops, post offices and so on. While those playgroups which are operating are an important social focus for parents and small children, unless they are staffed and run full-time they cannot serve the needs of parents who are in full-time work. One of the areas which many local authorities are forced to look at as resources become more strained is the closure of more village schools. Where village schools are closed there are costs associated with travel to the nearest alternative, whether funded publicly or privately. The average journey cost is higher for rural inhabitants. Where remote learning facilities are provided, there are costs associated with both setting up and maintaining the infrastructure to make such arrangements work. For example, although much has been made of the revolution in education which could result from the availability of teaching programmes on home-computers coupled to extensive educational databases accessible by telephone, at present neither the physical infrastructure, nor training arrangements in how to use such tools, are in place. Children and young adults in rural areas have less opportunity to participate in after-school activities unless their parents are able/willing to taxi them around after the school bus has left. Young adults may suffer similar isolation from leisure facilities, with little or no public transport available during the evenings there is a heavy reliance on parents taxiing them. If private transport is not regularly available, there is an inevitable curtailment of hobbies, clubs and other youth activities. For school leavers opportunities for further education and jobs lie mainly in urban centres and out of the County altogether. Such opportunities may also be inaccessible, for practical purposes, to a young person from a one, or no-car household. The high

levels of youth unemployment in parts of the Cornwall clearly demonstrate the problem. One of the issues often closely associated with youth unemployment is that of youth crime, and this has given rise to concern in rural areas in recent years, following the publication of high percentage increases in rural crime. Although “official statistics show that levels of crime in rural areas remain much lower than in urban areas” the fear of crime is becoming more pronounced in rural communities according to a report by Action with Communities in Rural England (ACRE) (Lloyd 1995). Whilst figures showing a geographical breakdown at a low enough level to compare rural and urban areas are not readily available an analysis of figures for predominantly urban and predominantly rural police force areas shows that fewer offences are committed per 1,000 population in rural areas than in urban areas and that the nature of crime “is not substantively different to urban areas” (Lloyd 1995). However, figures showing percentages of increase in rural crimes tend to present an alarming picture, and perceptible increases in incidents of petty crime and vandalism which do not get recorded add a general sense of anxiety and concern to which women and older people in rural areas are particularly vulnerable (Working Group on the Fear of Crime 1989, quoted in Lloyd 1995). Much of this fear inevitably revolves around the activities of young people and Lloyd suggests that it “inhibits community development and could exacerbate problems in the social environment which lead to an increase in crime levels”. Transport The Transport Act 1985 deregulated public transport services and removed formerly available cross-subsidies between profitable and non-profitable bus routes. Local Councils were given powers to secure ‘socially necessary’ public transport services not met by commercial services (ie on unprofitable routes). Specific duties include: the need for County Councils to describe the services which they intend to secure (eg in a Transport Plan); that they must have regard to functions of Education and Social Services Departments and to the transport needs of elderly and disabled people, and they must not inhibit competition. District Councils may secure public transport services which would not be met apart from action by them. In practice, where commercial public transport facilities are provided in rural counties they tend to concentrate on travel within and between urban centres. Since the average distance between communities is greater in rural areas, the average cost of each journey is also proportionately higher. The largely discretionary powers which councils inherited under the Transport Act 1985 are set against a background of cuts in central funding to local authorities and in the context of high levels of car ownership in many rural areas (discussed below). Additional counter-pressure to public transport investment lies in the need for rural authorities to maintain diffuse networks of minor roads to ensure these continue to provide access in all weathers to larger urban centres. In an influential nationwide study of how the public measured poverty, 88% of the

people interviewed believed that public transport for one’s needs was a necessity of life. (Mack and Lansley 1985). Transport is without doubt a key issue in rural areas where the centralisation of essential facilities, services and jobs increases the need for mobility (Clark and Woollett 1990). There are practical difficulties in accurately assessing transport needs in rural areas. The availability of public transport can be overestimated in parish-based surveys, because parishes can cover large areas and very often have more than one settlement within their boundaries (Lievesley and Maynard 1991). The smaller, more remote villages are often the least well served. Alongside powerful disincentives to unearth hidden transport needs there are practical difficulties in assessing levels of access to public transport using the most convenient geographical boundaries. The authors of the 1991 rural services survey highlighted the problem, pointing out that their results overestimated the availability of public transport services because the survey was parish-based. Parishes can cover large areas and very often have more than one settlement within their boundaries (Lievesley and Maynard 1991). The smaller, more remote villages were the least well served, and counties with lower levels of public provision tended to have community transport and dial a ride schemes, albeit in very small numbers (19% and 8% respectively) and often for specific groups provided for in the Transport Act. Support for Lievesley and Maynard’s concern is echoed in the 1994 Cornwall Rural Facilities Report where the authors explain that they chose to carry out their survey on a settlement by settlement basis because of this very problem (Cornwall County Council & Cornwall RCC 1996). Within the statutory framework and current national public spending climate interpretation of what is socially necessary in a rural context clearly appears to be limited. The latest CIPFA statistics indicate a generally low level of resourcing of public transport services in rural authority areas. With the exception of certain Welsh rural authorities, council spending on public transport covering predominantly rural areas, is consistently low (Chartered Institute of Public Finance and Accountancy 1995). This indicates that a low priority is being given by many councils to this high priority rural issue. In terms of creating an accurate picture of both transport needs and deprivation in rural areas the use of car ownership as an indicator is problematic. While lack of household ownership of a car is a commonly-used as a proxy indicator for low income, in a rural context car ownership must be linked to the availability of public transport, the loss of rural services and the distance between work and home (Williams 1995). High levels of car ownership in rural areas should be more appropriately viewed as an expensive necessity for a significant proportion of households rather than an ‘optional extra’ indicative of high incomes. In low income households, car ownership may create and mask considerable problems in two respects. Firstly, the vehicle may be used to carry a worker to their job, leaving others in the household without transport during the day time (Little et al 1990). Secondly, ownership of a car may be a practical necessity whose purchase and maintenance is an expense which a low income household can ill afford, causing
restrictions on other important areas of spending. Although car ownership is higher in the South West and East Anglia than in any other region, the average age of these cars is also the greatest. CONCLUSION Exeter University’s Agricultural Economics Unit spelled out some of the political choices to be made in relation to the future of rural areas in a commissioned report about West Somerset (McInerney and Turner 1993):
... the viability of rural locations as a focus for living depends considerably on the transport facilities for people to travel to their place of work. This immediately highlights the question about who should live in the countryside - those who can afford to because they bear the cost of their own transport, or those who are enabled to by the provision of subsidised transport or subsidised employment places?
In spite of the publication of the Rural White Paper, there remains a need for government and local councils to work together to formulate an integrated rural social policy directed towards enabling people on a low income to move to or remain living in rural areas.

CHAPTER TWO
POVERTY AND DEPRIVATION IN A CORNISH CONTEXT
This chapter focuses on Cornwall: on its population and characteristics and how the County compares and contrasts with other areas within the South West, with other rural areas and with the rest of the country. It focuses on ways in which deprivation is manifested, perceived and measured in the County, drawing on a range of data sources. This focus is at County level for two main reasons. Firstly, much of the available government and local information sources are presented at a County level. Secondly, a number of poverty issues are relevant to the County Council, since its expenditure on services is affected by the level of poverty in the County and because as an authority it has the power to introduce anti-poverty measures into its service delivery. CORNWALL IN A REGIONAL CONTEXT Some regional characteristics of Cornwall are outlined below and the County is located within the South West5. (Source is Regional Trends (1995) unless stated otherwise) As Williams' (1992) work has emphasised, the South West is a geographically large and an economically, socially and demographically disparate region . It contains, at the one extreme, sparsely populated, (relatively) culturally traditional, remote rural and coastal areas such as those found in Cornwall and parts of Devon and Somerset and, at the other, large, densely populated multi-cultural, urban centres such as Plymouth, Bristol and Gloucester. Patterns of employment, income and lifestyle, as well as of service provision, are widely heterogeneous. Williams (1992) argues that, given a more authentic picture of Cornwall, different strategies for development from those applied on a blanket basis for the South West might achieve greater acceptance and success. • The South West and East Anglia have had the fastest growing populations.
Figures for 1993 show that the greatest source of in-migration to both the South West and East Anglia is from the prosperous South East.
In Cornwall the rate of population increase between 1982 - 1986 was five times the UK average, the main reason being in-migration.
• The South West has the joint third largest proportion of its population aged over
65 of all regions in Europe. Of all UK regions it has the largest proportion of
5 Regional Trends divides the UK into eleven standard regions, eight of which are in England and
the others being Wales, Scotland and Northern Ireland.

people in this age group. One in five people in the South West are over 65 and one in 20 people are over 80.
In Cornwall, 22.8% of the population are over pension age.
• Of all the regions in Britain the South West had the second lowest
unemployment rate (after East Anglia) in 1993 at 8.3%. Figures for January 1995 show that Cornwall had the highest unemployment rate in the South West and, at 10-11%, the rate was higher than the UK average.
Using 1991 figures, Williams (1992) shows that Cornwall had more than twice the rate of unemployment of both Gloucestershire and Wiltshire.
• The average figure for gross weekly full-time earnings for men in the South West
as at April 1993 was £333.20; for women the average was £236.50.
In Cornwall, the average for men was £280.10 and for women £207.70.
• While the region has the joint highest rate of car ownership (along with East
Anglia), the South West has the oldest cars: the average age of vehicles in the region is greater than in any other.
In Cornwall, 4.6% of cars registered in the County are under 12 months old, compared with an average 8.3% for Great Britain. Ownership of vans (which are not VAT taxable and are therefore cheaper) is greater than the average for Great Britain (County Planning Department Basic Planning Statistics for Cornwall 1996).
• In Cornwall an average of 37% of women are economically inactive compared
with a national (GB) average of 48% (General Household Survey 1993).
• In Spring 1993, self-employment accounted for 11.3% of the UK workforce. In the South West, 14.9% of the workforce were self-employed (Labour Force Survey, Spring 1993).
In Cornwall, figures from the 1991 Census showed 24% of those in work were self-employed (Cornwall Structure Plan Deposit Draft, Cornwall C C 1995).
• The South West has the highest percentage (19.3%) of men employed in public
administration and other services. It has the joint third highest percentage of women in service occupations at 41.3%.
Little et al (1991) found that, among working women in Cornwall public sector jobs accounted for a high proportion of jobs in Social Class II.

• Overall, in the South West, there has been an increase in the female economic activity rate between 1981 and 1991 of 8.2% (UK - 5%). During the same period the male economic activity rate has decreased by 0.4% (UK - 2.7%).
In Cornwall the female activity rate increased by 13% in the same period, more than any county in England and Wales (Analysis of Economic and Employment Trends 1996/97, Cornwall County Council 1995).
• The South West has a below average level of trade union membership: 1994
figures show male membership at 30.7% (UK 36.5%) and female membership at 25.3% (UK 30.8%).
Little et al (1991) found that, amongst working women in Cornwall, fewer than 20% of respondents were in trade unions.
These figures suggest that Cornwall has special characteristics which distinguish it from the South West as a whole, in terms of the economic and social structure of the County and the experience and impact of deprivation and poverty. CORNWALL: A 'PREDOMINANTLY RURAL' REGION Cornwall has an unusual pattern of population distribution and, unlike neighbouring Devon, the County has no cities or major conurbations where large proportions of its population are concentrated. The largest urban area is St Austell with a population of only 21,000 (Cornwall County Council 1995). Instead Cornwall has a mainly rural population, fairly evenly spread across its many small towns and villages as Figure 2.1 demonstrates6. Figure 2.1 shows that the average population density for Cornwall as a whole in 1991 was 1.3 persons per hectare compared with 3.6 persons per hectare in England as a whole. This population distribution and density accounts for the County’s categorisation as Predominantly Rural, as distinct from the Significantly Rural category within which Devon falls (OECD 1994). According to 1987 figures, in the County's most densely populated District Council area (Penwith) over one third (34.1%) of the population live in settlements of 5,000 or less while in the most sparsely populated area (North Cornwall) almost two thirds (62.4%) of the population live in such settlements, and 32.85% of North Cornwall’s population lived in settlements of less than 1,000 (Cornwall County Planning Department, 1990). This picture contrasts with data from the OECD which puts the overall rural population of the United Kingdom at 16.9% of the total population (OECD 1994). Whilst in the perceptions of many Cornish people the label of 'predominantly rural' may not appear to adequately or accurately describe the County’s character, it does enable
6 Figure 2.1 and all subsequent maps of Cornwall show the 133 Electoral Wards of the county. A
key to the ward names and the local authority districts can be found at the beginning of this report.

certain comparisons and generalisations to be applied concerning a growing body of research material on deprivation in rural areas. Such research is helping to identify and explore the mechanisms by which deprivation has become almost synonymous with densely-populated urban pockets of poverty and decay, and the ways in which standard deprivation indices fail to measure deprivation in rural areas and thus render poverty and deprivation in rural areas almost invisible.

Figure 2.1: Population Density in Cornwall
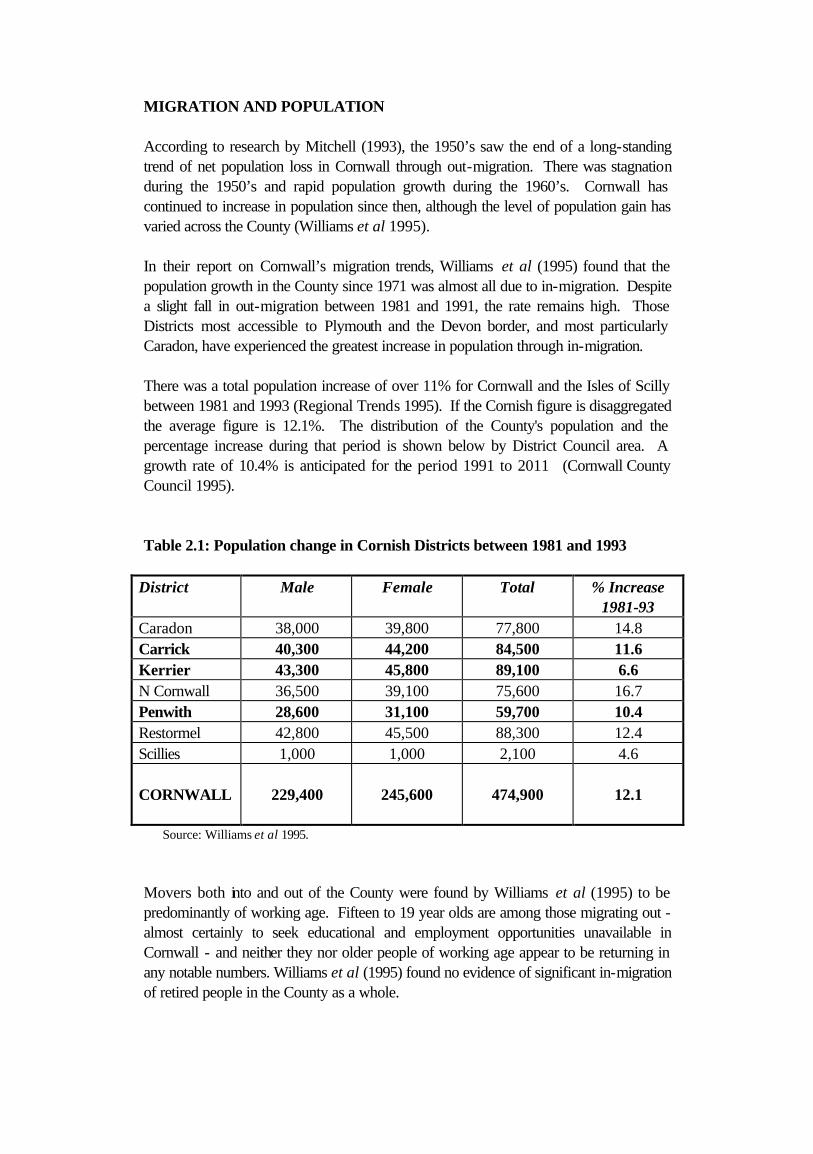
MIGRATION AND POPULATION According to research by Mitchell (1993), the 1950’s saw the end of a long-standing trend of net population loss in Cornwall through out-migration. There was stagnation during the 1950’s and rapid population growth during the 1960’s. Cornwall has continued to increase in population since then, although the level of population gain has varied across the County (Williams et al 1995). In their report on Cornwall’s migration trends, Williams et al (1995) found that the population growth in the County since 1971 was almost all due to in-migration. Despite a slight fall in out-migration between 1981 and 1991, the rate remains high. Those Districts most accessible to Plymouth and the Devon border, and most particularly Caradon, have experienced the greatest increase in population through in-migration. There was a total population increase of over 11% for Cornwall and the Isles of Scilly between 1981 and 1993 (Regional Trends 1995). If the Cornish figure is disaggregated the average figure is 12.1%. The distribution of the County's population and the percentage increase during that period is shown below by District Council area. A growth rate of 10.4% is anticipated for the period 1991 to 2011 (Cornwall County Council 1995). Table 2.1: Population change in Cornish Districts between 1981 and 1993
District Male Female Total % Increase 1981-93
Caradon 38,000 39,800 77,800 14.8 Carrick 40,300 44,200 84,500 11.6 Kerrier 43,300 45,800 89,100 6.6 N Cornwall 36,500 39,100 75,600 16.7 Penwith 28,600 31,100 59,700 10.4 Restormel 42,800 45,500 88,300 12.4 Scillies 1,000 1,000 2,100 4.6 CORNWALL
229,400
245,600
474,900
12.1
Source: Williams et al 1995.
Movers both into and out of the County were found by Williams et al (1995) to be predominantly of working age. Fifteen to 19 year olds are among those migrating out - almost certainly to seek educational and employment opportunities unavailable in Cornwall - and neither they nor older people of working age appear to be returning in any notable numbers. Williams et al (1995) found no evidence of significant in-migration of retired people in the County as a whole.

They did find evidence that many people who move into the County ultimately move out - largely to other South West counties and to the South East, and that movers do better economically than either stayers or in-migrants. Williams noted that the long term population fare worst economically. However, the incomes of those in-migrants who stayed, while frequently starting at higher levels, tended to eventually become similar to, or even fall below, those of local people (Williams et al 1995). Finally, Williams found that people who move into the County are better and more securely housed than the long term population. The age profile of Cornwall's population is shown in Table 2.2 below. Table 2.3 shows the percentage breakdown by age and District Council area (Regional Trends 1995). Table 2.2: Cornwall/UK Populations by Age Group as % of Total Population
(1993)
Age Cornwall %
UK %
Under 5 5.8 6.7 5-15 13.5 13.9 16-pension age 57.9 61.2 Pension age + 22.8 18.2
Source: Regional Trends, 1995. Table 2.3: Cornwall's Population by Age Group and District Council Area (1993)
District <5 years 5-15 16-Pension Pension + Caradon 5.8 14.2 58.8 21.2 Carrick 5.6 13.0 56.8 24.6 Kerrier 6.2 13.5 58.7 21.6 N Cornwall 6.0 13.7 57.1 23.2 Penwith 5.3 12.9 57.0 24.8 Restormel 5.9 13.6 58.5 22.1
Source: Regional Trends, 1995. In Cornwall, an average of 28.8% of households are all-pensioner households, compared with the British average of 24.4%. However, the percentage of pensioner households varies widely at ward level, from over 40% in the coastal wards of Fowey, Marazion, Lelant/Carbis Bay, St Minver and Roseland (which has the highest proportion at 44.3%) to 13.4% in Rumford (Cornwall County Council Planning Dept 1995).
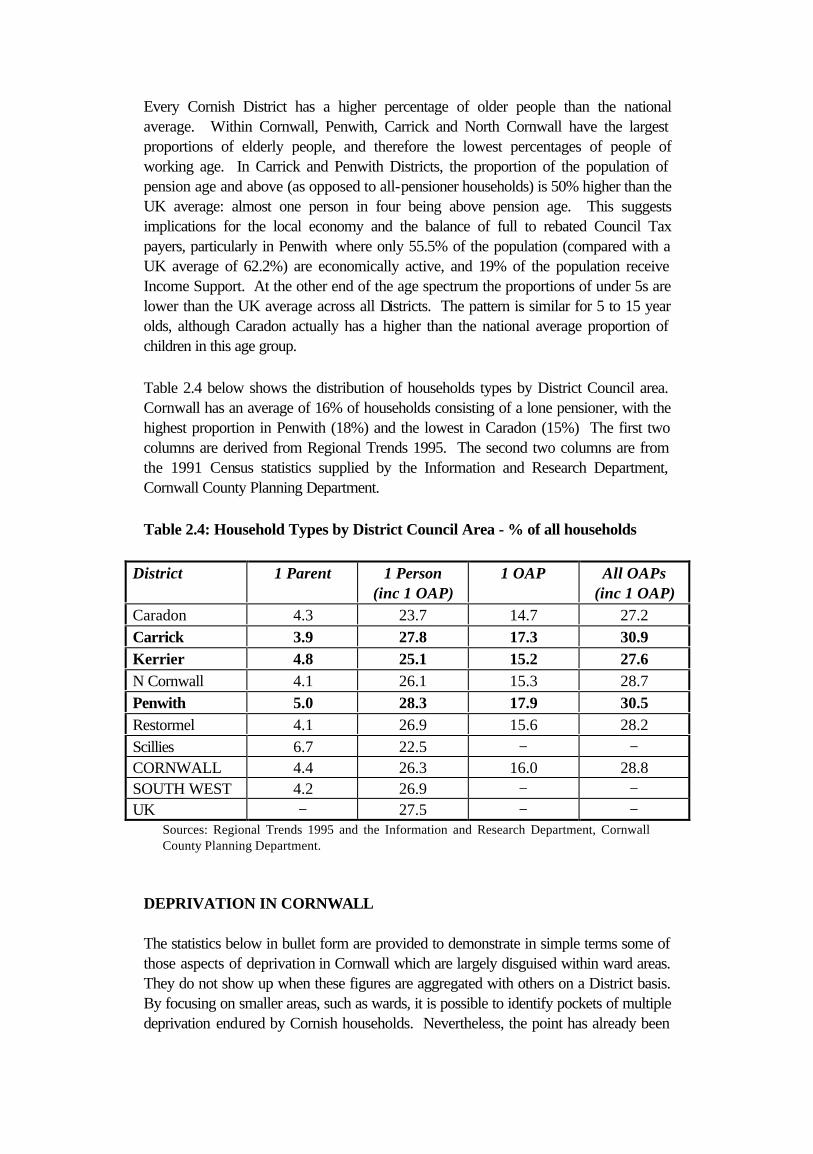
Every Cornish District has a higher percentage of older people than the national average. Within Cornwall, Penwith, Carrick and North Cornwall have the largest proportions of elderly people, and therefore the lowest percentages of people of working age. In Carrick and Penwith Districts, the proportion of the population of pension age and above (as opposed to all-pensioner households) is 50% higher than the UK average: almost one person in four being above pension age. This suggests implications for the local economy and the balance of full to rebated Council Tax payers, particularly in Penwith where only 55.5% of the population (compared with a UK average of 62.2%) are economically active, and 19% of the population receive Income Support. At the other end of the age spectrum the proportions of under 5s are lower than the UK average across all Districts. The pattern is similar for 5 to 15 year olds, although Caradon actually has a higher than the national average proportion of children in this age group. Table 2.4 below shows the distribution of households types by District Council area. Cornwall has an average of 16% of households consisting of a lone pensioner, with the highest proportion in Penwith (18%) and the lowest in Caradon (15%) The first two columns are derived from Regional Trends 1995. The second two columns are from the 1991 Census statistics supplied by the Information and Research Department, Cornwall County Planning Department. Table 2.4: Household Types by District Council Area - % of all households
District 1 Parent 1 Person (inc 1 OAP)
1 OAP All OAPs (inc 1 OAP)
Caradon 4.3 23.7 14.7 27.2 Carrick 3.9 27.8 17.3 30.9 Kerrier 4.8 25.1 15.2 27.6 N Cornwall 4.1 26.1 15.3 28.7 Penwith 5.0 28.3 17.9 30.5 Restormel 4.1 26.9 15.6 28.2 Scillies 6.7 22.5 − − CORNWALL 4.4 26.3 16.0 28.8 SOUTH WEST 4.2 26.9 − − UK − 27.5 − −
Sources: Regional Trends 1995 and the Information and Research Department, Cornwall County Planning Department.
DEPRIVATION IN CORNWALL The statistics below in bullet form are provided to demonstrate in simple terms some of those aspects of deprivation in Cornwall which are largely disguised within ward areas. They do not show up when these figures are aggregated with others on a District basis. By focusing on smaller areas, such as wards, it is possible to identify pockets of multiple deprivation endured by Cornish households. Nevertheless, the point has already been

made that for more dispersed rural populations deprivation remains difficult to identify in terms of 'pockets' as it may occur in a small number of scattered households in a ward or parish area. • In four West Cornwall wards, over 25% of households are in poverty according to
the Breadline Britain index (See p 50) • Between 1981 and 1994, Cornwall was the County with the greatest proportion of
low paid male workers. • With an average number of 22.7%, Cornwall has higher than the GB average
(19.5%) of young people aged 16-24 who are unemployed or on a government scheme. In 34 wards, over a quarter of 16-24 year olds have no job and, in a further 15 wards, over 24% are not working.
• In 22 Cornish wards, more than 25 households out of every 1000 lack or share use
of a bathroom and/or WC with other households. In two wards, more than 50 in every 1000 households share these facilities.
• In six Cornish wards, more than 40% of households are all-pensioner households. • In 13 Cornish wards, a greater proportion of households have no car, than in Britain
as a whole. • On average, 9% fewer homes (28%) have central heating in Cornwall than
nationally. In 23 Cornish wards, over one third of homes have no central heating and, in two wards, this rises to over 50% of homes.
• In 14 Cornish wards, over one-fifth of households consist of non-earning parents
with dependent children. (Source: 1991 Census - figures supplied by Cornwall County Planning Department) This chapter has discussed some of the reasons why, in Cornwall, there is concern that rural poverty is not fully recognised and reflected in deprivation indices such as the Index of Local Conditions (ILC) used by the Department of the Environment. This problem has prompted research by the Cornwall Social Services Department (Lennon 1991) and the Citizens' Advice Bureaux (Giarchi 1989) looking at deprivation in the County, the creation of an alternative set of indicators by the Cornwall Health Commission, and a study by the Universities of Exeter and Plymouth of the use of the ILC in SRB bids in Devon and Cornwall (Payne 1995). The fact that the whole of Cornwall has European Objective 5B status and qualifies for Structural Funds, demonstrates that the County has fared badly in terms of economic prosperity and social development over many years. However, the middle rankings of Cornish Districts by the ILC deprivation index disguises the reality experienced 'on the ground' (Bruce et al 1995.

In her analysis of the ILC and its application for Single Regeneration Budget bidding purposes, Payne (1995) concluded that Cornwall "does not experience the degree of deprivation of Bristol or Plymouth but its most affluent District (Caradon) is much less affluent than mid-Sussex". Payne also concluded that: • Cornwall exhibits a different pattern of deprivation than Devon: there appears to
be widespread low-level deprivation which was described as extensive rather than intensive;
• Cornwall has greater deprivation than Devon and Cornwall together, the South
West or England as a whole; • Devon and Cornwall combined are more deprived than the South West Region,
but that much of this is accounted for by Cornwall (Payne 1995). In her critique of the Index of Local Conditions as applied to Devon and Cornwall, Payne (1995) concludes that Local Authority Districts - the spatial units to which the Index is applied - are too coarse a measure for detailed identification of deprivation and targeting, and that evidence suggests that in these counties either the spatial pattern of deprivation or the nature of rural deprivation is different. The dispersed nature of rural populations and the socially and economically polarised nature of rural communities mean that deprivation is disguised by the aggregation of data at District level. Payne's (1995) study concludes that the causes of deprivation in Devon and Cornwall may differ from those in urban areas, but that many of the dimensions of disadvantage would appear to correspond: income, unemployment, housing and the dangers of marginalisation of older people. She advocates the use of available data and survey material other than the Index of Local Conditions as supporting evidence for external funding bids since the ILC, as an urban index, does not identify rural deprivation. Giarchi (1989) who carried out 415 interviews in 11 rural parishes in the Liskeard area, concluded that poverty in both urban and rural areas arises from the same negative structural effects of an unequal society. He links a range of deprivation factors with increasing centralisation which leads to the withdrawal of rural services and isolation from facilities, aggravated by information deprivation related to income and social class. This service withdrawal/centralisation has not been offset in terms of an adequate increase in rural public transport services. Although a decision was made by the County Council that there should be no reduction in bus services following the 1985 Transport Act and the advent of 'Hopper' buses provided greater flexibility in the service, the spending base was low and has not been expanded. Giarchi's concerns are echoed in Cornwall Social Services Department report on deprivation in rural Cornwall (Lennon 1991) with particular reference to the effects of

service centralisation and the inadequacy of transport services on vulnerable groups including frail and elderly people, low income households, families and households in debt, homeless people and children at risk of abuse. The social services report points out that although car ownership in Cornwall is higher than the national average, detailed investigation by the County Planning Department has revealed the figures to be misleading if car ownership figures are related to the size of settlement, Cornwall is lower in car ownership than comparable areas nationally (figures based on 1981 Census data, analysed in 1988). The report notes that bus passes can be an important source of help for the elderly (and others), and whilst a number of voluntary and community transport schemes have sprung up to try to bridge the gaps in public transport services a lack of co-ordination has meant that no comprehensive cover has been achieved. There is also a problem recruiting volunteer drivers in rural areas. Giarchi (1989) argues that low wages and poor employment conditions are linked to the low level of unionisation in the County. He also suggests that whilst many young people move out of the County in search of work they are ill prepared to cope with urban competitiveness. He identified three key factors which he believes present a challenge to rural planners: • Centralisation leading to rural under-development associated with rural
deprivation
• Information deprivation which is more prevalent amongst the poorest
• The need for social services, health and advice agencies to target lower socio-economic groups and frail elderly people in isolated rural areas (Giarchi, 1989).
Giarchi's report concludes that, taking all the issues together, there is evidence of multiple rural deprivation in Cornwall, with specific reference to the area covered in his research (eg around Liskeard). Again, these conclusions are echoed in the Social Services Report (Lennon 1991) where it is stated that the combined effects of rural factor such as remoteness, isolation, inaccessibility and information deprivation frequently result in the provision of social services support in crisis, often providing too little, too late. Reference is also made to the high cost of community care provision and the lack of government recognition for this in government funding allocation. ECONOMIC ACTIVITY, INCOME AND EMPLOYMENT IN CORNWALL There is concern in the County that the size and increasing growth of the labour force will continue to outstrip the numbers of available jobs (Cornwall County Council 1995). Concern, also surrounds regional policy which emphasises the development of tourism

as a major job-creating industry because of the very low wages, low job security and poor working conditions which are so often found in this sector of the economy (Williams 1992). The economically active population are those over the minimum school-leaving age who are in work, on a government training course or are registered as unemployed. Among those who are not included are women, disabled people and older men of working age, who want to find work but are not registered as unemployed. Their exclusion from the numbers of both economically active and recorded unemployment result in an under-estimate of the potential labour force and of the extent of income deprivation in the County. The size of the economically active population is important since it is this group on whom the non-economically active population are largely dependent in terms of taxation income to resource public sector services and infrastructure. The revenue support grant allocations this year have relied more than before on income from local taxation to fund local authority expenditure, resulting in a combination (or “double whammy”) of higher Council Taxes and, in Cornwall as elsewhere, cuts in spending on local services in the face of growing needs. Table 2.5 below shows how the proportions of the economically active population vary between district council areas with the lowest percentage of 55.5% being in Penwith. It is significant that none of the Cornish districts reaches the UK average of 62.2% of the population being economically active. With the exception of Caradon, it can be seen that all Cornish Districts have a higher than the regional average (13%) proportion of households on Income Support, with the highest, at 19% in Penwith (CIPFA 1995). Total registered unemployment in the County at January 1995 was just under 24,000 with the greatest percentage in Restormel. However, official unemployment figures under-estimate the true number of people who want to, and are seeking work since they include only those who are 'unemployed and claiming benefit'. For example, Little et al's (1991) study of women and employment showed that only 13% of the women interviewed who were not currently in paid work were registered as unemployed. A series of technical adjustments, such as the removal of job trainees on government schemes from the figures and ending the requirement for unemployed people over 60 to register, have added to ineligibility to claim benefit as further sources of under-counting.
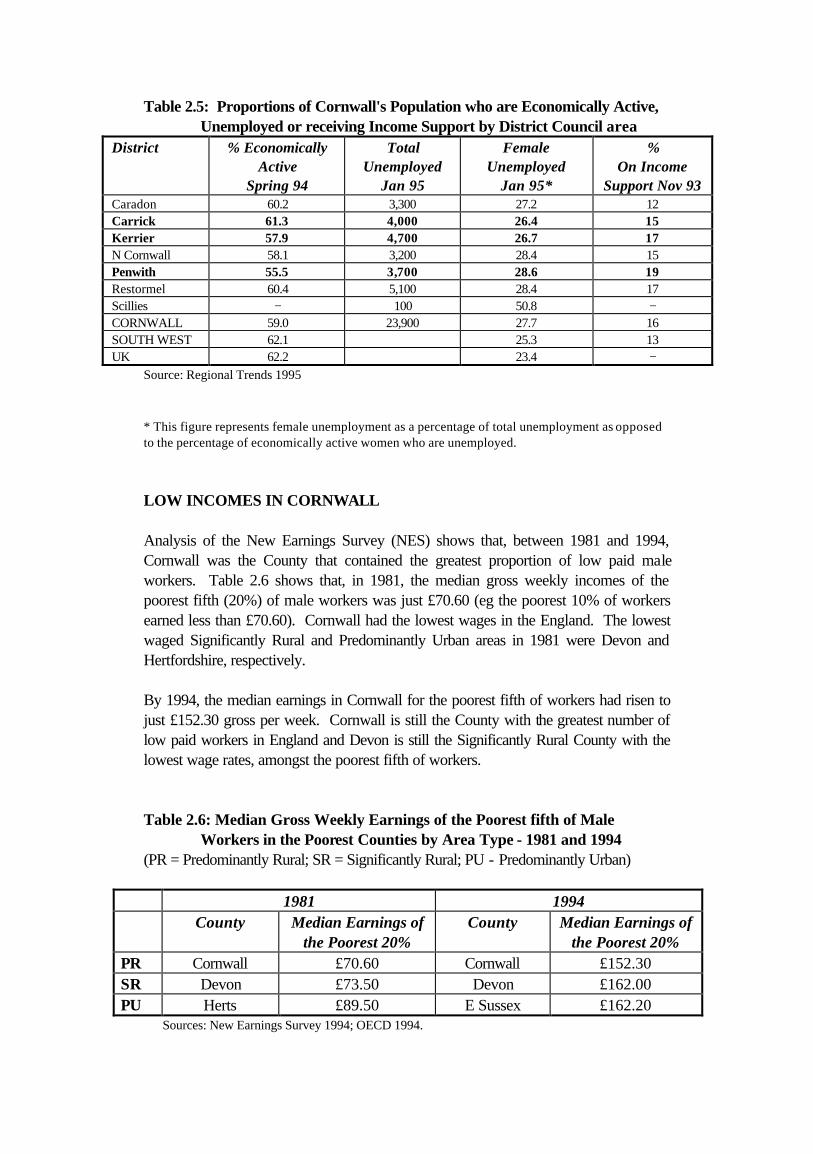
Table 2.5: Proportions of Cornwall's Population who are Economically Active, Unemployed or receiving Income Support by District Council area
District % Economically Active
Spring 94
Total Unemployed
Jan 95
Female Unemployed
Jan 95*
% On Income
Support Nov 93 Caradon 60.2 3,300 27.2 12 Carrick 61.3 4,000 26.4 15 Kerrier 57.9 4,700 26.7 17 N Cornwall 58.1 3,200 28.4 15 Penwith 55.5 3,700 28.6 19 Restormel 60.4 5,100 28.4 17 Scillies − 100 50.8 − CORNWALL 59.0 23,900 27.7 16 SOUTH WEST 62.1 25.3 13 UK 62.2 23.4 −
Source: Regional Trends 1995 * This figure represents female unemployment as a percentage of total unemployment as opposed to the percentage of economically active women who are unemployed. LOW INCOMES IN CORNWALL Analysis of the New Earnings Survey (NES) shows that, between 1981 and 1994, Cornwall was the County that contained the greatest proportion of low paid male workers. Table 2.6 shows that, in 1981, the median gross weekly incomes of the poorest fifth (20%) of male workers was just £70.60 (eg the poorest 10% of workers earned less than £70.60). Cornwall had the lowest wages in the England. The lowest waged Significantly Rural and Predominantly Urban areas in 1981 were Devon and Hertfordshire, respectively. By 1994, the median earnings in Cornwall for the poorest fifth of workers had risen to just £152.30 gross per week. Cornwall is still the County with the greatest number of low paid workers in England and Devon is still the Significantly Rural County with the lowest wage rates, amongst the poorest fifth of workers. Table 2.6: Median Gross Weekly Earnings of the Poorest fifth of Male
Workers in the Poorest Counties by Area Type - 1981 and 1994 (PR = Predominantly Rural; SR = Significantly Rural; PU - Predominantly Urban)
1981 1994 County Median Earnings of
the Poorest 20% County Median Earnings of
the Poorest 20% PR Cornwall £70.60 Cornwall £152.30 SR Devon £73.50 Devon £162.00 PU Herts £89.50 E Sussex £162.20
Sources: New Earnings Survey 1994; OECD 1994.
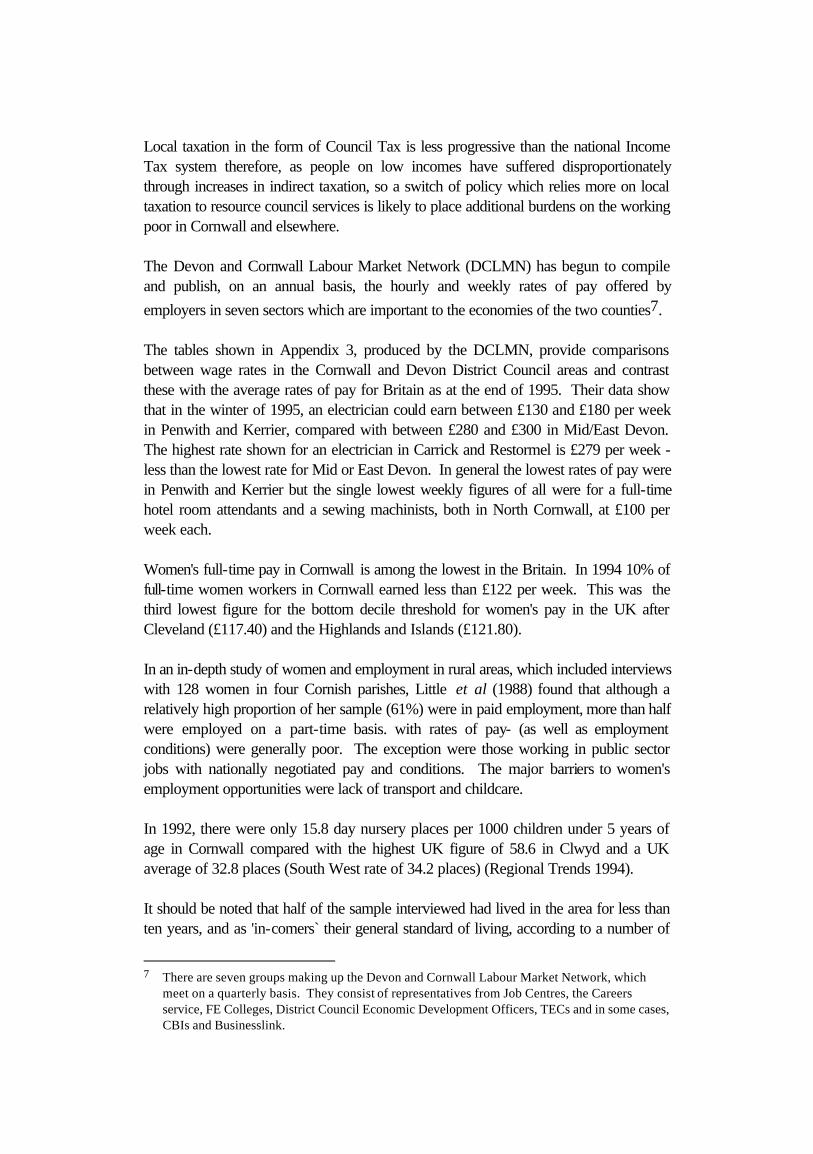
Local taxation in the form of Council Tax is less progressive than the national Income Tax system therefore, as people on low incomes have suffered disproportionately through increases in indirect taxation, so a switch of policy which relies more on local taxation to resource council services is likely to place additional burdens on the working poor in Cornwall and elsewhere. The Devon and Cornwall Labour Market Network (DCLMN) has begun to compile and publish, on an annual basis, the hourly and weekly rates of pay offered by employers in seven sectors which are important to the economies of the two counties7. The tables shown in Appendix 3, produced by the DCLMN, provide comparisons between wage rates in the Cornwall and Devon District Council areas and contrast these with the average rates of pay for Britain as at the end of 1995. Their data show that in the winter of 1995, an electrician could earn between £130 and £180 per week in Penwith and Kerrier, compared with between £280 and £300 in Mid/East Devon. The highest rate shown for an electrician in Carrick and Restormel is £279 per week - less than the lowest rate for Mid or East Devon. In general the lowest rates of pay were in Penwith and Kerrier but the single lowest weekly figures of all were for a full-time hotel room attendants and a sewing machinists, both in North Cornwall, at £100 per week each. Women's full-time pay in Cornwall is among the lowest in the Britain. In 1994 10% of full-time women workers in Cornwall earned less than £122 per week. This was the third lowest figure for the bottom decile threshold for women's pay in the UK after Cleveland (£117.40) and the Highlands and Islands (£121.80). In an in-depth study of women and employment in rural areas, which included interviews with 128 women in four Cornish parishes, Little et al (1988) found that although a relatively high proportion of her sample (61%) were in paid employment, more than half were employed on a part-time basis. with rates of pay- (as well as employment conditions) were generally poor. The exception were those working in public sector jobs with nationally negotiated pay and conditions. The major barriers to women's employment opportunities were lack of transport and childcare. In 1992, there were only 15.8 day nursery places per 1000 children under 5 years of age in Cornwall compared with the highest UK figure of 58.6 in Clwyd and a UK average of 32.8 places (South West rate of 34.2 places) (Regional Trends 1994). It should be noted that half of the sample interviewed had lived in the area for less than ten years, and as 'in-comers` their general standard of living, according to a number of
7 There are seven groups making up the Devon and Cornwall Labour Market Network, which
meet on a quarterly basis. They consist of representatives from Job Centres, the Careers service, FE Colleges, District Council Economic Development Officers, TECs and in some cases, CBIs and Businesslink.

sources (for example, Williams et al 1995) would be expected to be higher than those of long-term Cornish residents. Nevertheless, a significant minority of women were paid on a casual basis when the money was needed or when the work was completed. Many of these women worked in family firms, most said they took money for housekeeping and food and effectively had no independent wage of their own (Little et al 1991). All of those in regular paid employment who were paid weekly received less than £150 per week, including those who worked more than 37 hours. Four women working 40 hours per week earned less than £100 and one woman worked 70 hours a week for between £20 and £50 per week. Another four women worked between 21 and 25 hours per week but earned less than £50. Only two women earned above £15,000 per annum (Little et al 1991). Little (1991) reports on the additional comments offered by women interviewed regarding the low pay, poor working conditions and difficulties with child care and transport which acted as barriers to obtaining or keeping jobs which were consistent with experience and qualifications. Wage levels were thought responsible for driving younger people away from the area. The low wage trap had forced one of the women to give up her job when her husband became unemployed and they were threatened with a loss of benefits. There is widespread concern among local authority service providers over the impact of very low rates of pay on the health and well-being of their populations and in relation to the economic health of the County (Social Services Department; Lennon 1991). Another indication of the extent of low income and its effect on local authorities comes from figures from the financial year 1993/94 which show how Cornwall compares with other areas in terms of the percentage of council tenants in receipt of Housing Assistance. These figures represent the number of tenants in receipt of income and non-income support in April 1993 divided by the total number of tenants (CIPFA 1995). No figure was available for Kerrier, however, given other economic and social indicators for the District it is likely that the percentage is at the higher end of the spectrum.

Table 2.7: Percentage of Cornwall Council Tenants Receiving Housing Assistance, by District 1993/94.
District % Receiving Housing Assistance Caradon 63.0 Carrick 68.2 Kerrier − North Cornwall 65.1 Penwith 73.3 Restormel 69.7
Source: CIPFA Actuals - Local Government Comparative Statistics 1995 The next table is presented for the purposes of national comparison. The proportion of council tenants receiving housing assistance in Penwith in 1993/94 is higher than in any of the Inner London Boroughs and well above the average for outer London Boroughs. It exceeds the average for all Metropolitan Districts and is almost 10% above the average for all English Non-Metropolitan Districts. It is also higher than the average for Welsh Districts (71%). The average figure for Cornwall is 67.9%. Table 2.8: Percentages of Cornwall Council Tenants Receiving Housing
Assistance in 1993/94 Compared with Selected Local Authorities in the UK
Comparator Areas % Receiving Housing Assistance Penwith 73.3 Inner London Boroughs 63.7 Outer London Boroughs 65.3 Metropolitan Districts 72.4 Non-Met Districts 63.5 All Welsh Districts 71.0 Average for Cornish Districts 67.9
Source: CIPFA Actuals - Local Government Comparative Statistics 1995 LOCAL AUTHORITY RENT ARREARS The information about rent arrears is also incomplete but does provide some indication of the extent and size of rent arrears which are clearly a problem for both tenants and councils. By Districts, column (1) shows the percentage of all households in arrears of between £100 and £500; column (2) shows the percentage of households in arrears (all amounts); column (3) shows the average amount of cumulative arrears; column (4) shows total rent arrears as a percentage of gross rents.

Table 2.9: Rent Arrears Data by District Council Area, 1993/94
District Rents (1) % in Arrears of £100-£500
(2) % in Arrears
(3) Mean Amount
(£) Cum Arrears*
(4) Arrears as % Gross
Rents Caradon − − £594 3.1 Carrick 10.4 26.7 95 1.5 Kerrier − − − 1.8 N Cornwall 8.2 21.0 176 2.1 Penwith 4.3 24.8 68 − Restormel 8.9 24.0 160 2.2
Source: CIPFA Actuals - Local Government Comparative Statistics, 1995. * Current tenants only.
The mean cumulative arrears vary considerably around the country but the Caradon figure exceeds those of any of the Merseyside districts and is higher than all but Hackney and Southwark among Inner London and all but one outer London borough (Ealing). WORKING CONDITIONS Some characteristics of the rural job market have already been referred to in Chapter 1. These include factors well known to those familiar with the Cornish economy: job insecurity, under-employment, casual, seasonal and part-time work. The Cornwall and Isles of Scilly Rural Strategy (1988) provides a graphic picture of the sharp seasonal fluctuations in unemployment in the County between 1978 and 1988 and shows that the levels remain above the Great Britain level for that period. In 1993, in response to a growing number of enquiries related to employment problems, the National Association of Citizens' Advice Bureaux compiled a national report about job insecurity. This report drew evidence from many rural CABs, including three based in Cornwall. It highlighted problems, many of which had grown during recession, such as an absence of any written contract setting out agreed terms and conditions and employers unilaterally changing terms and conditions of employment. It was also clear that little protection from job insecurity and poor working conditions was available from the law, and even where protections exist both employers and employees may be unaware of them or they were not adequately enforced. Young people were found to be particularly vulnerable.

An earlier study (NACAB 1990) to which four Cornish CABs contributed evidence, found that the majority of people who sought advice on employment problems worked in small firms, and often in the service industry. This is particularly relevant to Cornwall since 45% of those in employment in Cornwall are employed by firms with under 25 employees compared with 32.5% in Great Britain (Cornwall County Council 1995). One feature of the problem was enforced self-employment whereby workers, often of long standing in their jobs, were given no option but to declare themselves self-employed, thus reducing employers` overheads but losing important rights and protections of employee status. Another trend was for full-time posts to be replaced by part-time posts, again reducing overheads for employers and job security and protection for staff (NACAB 1990). The report cites two cases in Cornwall. The first involved two people who had been employed as cleaners for 15 and 16 years and who were given an ultimatum of reducing their work or being made 'redundant`. They reluctantly accepted the change and then were asked to change their working times. Because they now worked less than 8 hours per week they had no protection against unfair dismissal if they did not comply (NACAB 1990). The Little et al (1991) study provides additional insight into the kinds of insecurity which workers face in Cornwall. One woman spoke of widespread exploitation in the hotel and catering industry, where workers are engaged on a part-time basis so that employers do not have to provide meals or rest periods. Women in the study accepted these conditions because of a lack of alternative work. Only 32.1% of women in work had a written contract of employment, with most of these being in full-time employment. Just over one third of women received sick pay and less than 50% received holiday pay (Little et al 1991). In spite of experiencing lower wages, worse working conditions and greater job insecurity than women in the Wiltshire sample, the vast majority of the Cornish women who were in paid employment (87%) were satisfied with their job (Little et al 1991). This is no doubt linked to the scarcity of paid work, the difficulties which had to be overcome to obtain it and the fact that the most common reason for working given by the women was to buy essentials. It can also be linked to research findings which have shown that paid employment is important to women in terms of self-esteem and maintaining mental health. (Brown and Harris 1978). SERVICES IN CORNWALL In their 1991 Survey of Rural Services, Lievesley and Maynard (1992) concluded that Cornwall was among the better served counties, with a better than average distribution and range of services. The Cornwall and Isles of Scilly Rural Strategy Document of 1988 (Cornwall County Council 1988) mapped a healthy scattering of village halls and primary schools at that time, but there were few areas where the bus service was

described as frequent. In terms of training and job centres, the people in sparsely populated North Cornwall are rather less well-served than those in the West Cornwall Districts. The 1994 Survey of Rural Services also showed Cornwall as being relatively well-served across a range of services (Rural Development Commission 1995). However, the 1994 Rural Facilities Survey, carried out jointly by Cornwall County Planning (CCP) and the Cornwall Rural Community Council (CRCC), was a more detailed study than the national one of which it was a part. The CCP and CRCC chose, in the case of almost all services covered by the survey, to study provision in settlements (excluding major towns and parishes located adjacent to them) rather than parishes because “the fact that one settlement has a full range of facilities may be of little relevance to other settlements in the parish” (CCP/CRCC 1995). Whilst warning of the problems associated with looking at Cornwall’s facilities on a parish basis, the 1994 Survey concluded that “even when looked at on a settlement basis there is a good distribution of facilities. Although here has been widespread historical decline in shops and churches, the trends of decline seem to be slowing.” However, along with these up-beat accounts of rural facilities in Cornwall, it is well to look at some of the figures revealed in the local 1994 survey. With a pattern which shows the lowest levels of provision in the most sparsely populated areas the survey found that: • 49% of settlements lacked any permanent food shop and 23% had only one. • Only 18 settlements had a banking facility. • Less than half of the settlements (44%; 245 of 556) had a post office facility, with a
loss of 5 post offices in West Cornwall since 1991. • 30% of parishes had no daily milk delivery. • 32% of settlements had no meeting place • 77% of settlements had no group for elderly people. A combination of factors, including length of travel time, difficulty of journeys, uncertainty about bus services (many people are confused by the timetables since some buses only run during school terms) deter elderly people from using GP and other health care services . Meanwhile the weakening of rural communities, resulting from in-migration has made localised informal support and care less available at a time when formal care is subject to more stringent rationing in the face of constraints on local government spending (Giarchi 1989; Lennon 1991). Youth services are also under-resourced compared to other counties of similar population density, in spite of the County Council’s desire to uphold the aims of the 1982 Thompson Report. This report stated that “The Youth Service has the duty to help all young people who have need of it” and set out a range of basic services - including social education, advice and counselling and participation in activities, clubs and local affairs - which should be available through “appropriate styles of provision” for rural areas. Isolation and a lack of peer group interaction, lack of access to live

music performances and the predominance of elderly people in some areas are issues felt by young people to be a problem associated with rural life (Giarchi 1989). Giarchi cites a 1984 report by the NCVO and NACAB which showed the additional difficulty and costs involved for rural dwellers in gaining access to advice, information and legal services. The latter had emerged as particularly problematic for older women who are widowed and unable to drive, since their need for legal guidance coincides with a time of grief and added vulnerability. This is perhaps especially so for those who have migrated into the area and lack family support. Findings from a 1987 Child Poverty Action Group (CPAG) report highlighted problems in education services in Cornwall including the costs of bussing children to the nearest village or town, a shortage of Education Welfare Officers and inadequacy of information on primary school truancies, the below UK average of children under 5 years attending school and a severe shortage of nursery places across Cornwall (Deacon 1987). Chapter four discusses Cornwall’s shortage of affordable housing which makes it difficult for workers to live close to their employment in rural areas. This situation is exacerbated by the lack of public transport and local services and facilities and can lead to involuntary migration into towns. It is possible that Cornwall’s migration pattern has helped sustain rural facilities to some extent. Mitchell (1993) has shown that since 1971 in-migration in Cornwall underwent an urban to rural shift reversing the decline in numbers living in settlements of below 500 population and slowing the loss of population to settlements with populations of between 100 and 200. This influx of people to rural settlements may well have helped keep rural services viable, which might otherwise have been lost. In spite of Cornwall’s better showing in the 1994 Rural Facilities Survey, there remain large gaps in crucial service provision for many people and these make life particularly difficult, and more expensive, for the poorest. CONCLUSION This chapter has looked at various aspects of Cornwall's characteristics. It provides a range of information which demonstrates not only that Cornwall is distinct from other counties within the South West, but also that on many available indicators it is worse off than other counties. Low wages are a highly significant factor in Cornwall's economic and social difficulties, yet this is not reflected in the government's assessment of the County's needs. In this Cornwall shares a disadvantage with other Counties which are categorised as Predominantly Rural according to the OECD's classification method. There is clearly a case for anti-poverty action by local authorities within Cornwall. Given the polarisation of income levels between the highest and the lowest,

compensatory and concessionary subsidies and the re-ordering of some council priorities has the potential both to redress the redistribution problems referred to earlier (low income households paying disproportionately for Council services)and to release more money among low income households to spend in the local economy.