potentially preventable deaths from the five leading ... · continuing education examination ......
TRANSCRIPT

Statistics. The calculations of potentially preventable deaths were restricted to U.S. residents and to deaths that occurred to persons aged <80 years. The age restriction is consistent with average life expectancy for the total U.S. population, which was nearly 79 years in 2010 (2). Analysis was restricted to deaths with an underlying cause of death among the five leading causes, based on International Classification of Diseases, 10th Revision (ICD-10) codes: diseases of the heart codes (I00–I09, I11, I13, I20–I51), cancer (C00–C97), chronic lower respi-ratory diseases (J40–J47), cerebrovascular diseases (stroke) (I60–I69), and unintentional injuries (V01–X59, Y85–Y86). The five leading causes of death represented 63% of all deaths in 2010; the next five most frequent causes accounted for only about 12% of deaths (2).
The annual number of potentially preventable deaths for each of the five leading causes of death by state was calculated in three steps. The first step was to calculate and rank state
INSIDE375 Outbreak of Campylobacteriosis Associated with a
Long-Distance Obstacle Adventure Race — Nevada, October 2012
379 Falls and Fall Injuries Among Adults with Arthritis — United States, 2012
384 Notes from the Field: Investigation of Infectious Disease Risks Associated With a Nontransplant Anatomical Donation Center — Arizona, 2014
386 Announcements389 QuickStats
Continuing Education examination available at http://www.cdc.gov/mmwr/cme/conted_info.html#weekly.
U.S. Department of Health and Human ServicesCenters for Disease Control and Prevention
Morbidity and Mortality Weekly ReportWeekly / Vol. 63 / No. 17 May 2, 2014
In 2010, the top five causes of death in the United States were 1) diseases of the heart, 2) cancer, 3) chronic lower respiratory diseases, 4) cerebrovascular diseases (stroke), and 5) unintentional injuries (1). The rates of death from each cause vary greatly across the 50 states and the District of Columbia (2). An understanding of state differences in death rates for the leading causes might help state health officials establish disease prevention goals, priorities, and strategies. States with lower death rates can be used as benchmarks for setting achievable goals and calculating the number of deaths that might be prevented in states with higher rates. To determine the number of premature annual deaths for the five leading causes of death that potentially could be prevented (“potentially preventable deaths”), CDC analyzed National Vital Statistics System mortality data from 2008–2010. The number of annual potentially preventable deaths per state before age 80 years was determined by comparing the number of expected deaths (based on average death rates for the three states with the low-est rates for each cause) with the number of observed deaths. The results of this analysis indicate that, when considered separately, 91,757 deaths from diseases of the heart, 84,443 from cancer, 28,831 from chronic lower respiratory diseases, 16,973 from cerebrovascular diseases (stroke), and 36,836 from unintentional injuries potentially could be prevented each year. In addition, states in the Southeast had the highest number of potentially preventable deaths for each of the five leading causes. The findings provide disease-specific targets that states can use to measure their progress in preventing the leading causes of deaths in their populations.
Mortality data from the National Vital Statistics System for the period 2008–2010 were analyzed. Population estimates for the period 2008–2010 were produced by the U.S. Census Bureau in collaboration with the National Center for Health
Potentially Preventable Deaths from the Five Leading Causes of Death — United States, 2008–2010
Paula W. Yoon, ScD1, Brigham Bastian2, Robert N. Anderson, PhD2, Janet L. Collins, PhD3, Harold W. Jaffe, MD4 (Author affiliations at end of text)

Morbidity and Mortality Weekly Report
370 MMWR / May 2, 2014 / Vol. 63 / No. 17
The MMWR series of publications is published by the Center for Surveillance, Epidemiology, and Laboratory Services, Centers for Disease Control and Prevention (CDC), U.S. Department of Health and Human Services, Atlanta, GA 30329-4027.Suggested citation: [Author names; first three, then et al., if more than six.] [Report title]. MMWR 2014;63:[inclusive page numbers].
Centers for Disease Control and PreventionThomas R. Frieden, MD, MPH, Director
Harold W. Jaffe, MD, MA, Associate Director for Science Joanne Cono, MD, ScM, Director, Office of Science Quality
Chesley L. Richards, MD, MPH, Deputy Director for Public Health Scientific ServicesMichael F. Iademarco, MD, MPH, Director, Center for Surveillance, Epidemiology, and Laboratory Services
MMWR Editorial and Production Staff (Weekly)Charlotte K. Kent, PhD, MPH, Acting Editor-in-Chief
John S. Moran, MD, MPH, EditorTeresa F. Rutledge, Managing Editor
Douglas W. Weatherwax, Lead Technical Writer-EditorDonald G. Meadows, MA, Jude C. Rutledge, Writer-Editors
Martha F. Boyd, Lead Visual Information SpecialistMaureen A. Leahy, Julia C. Martinroe, Stephen R. Spriggs, Terraye M. Starr
Visual Information SpecialistsQuang M. Doan, MBA, Phyllis H. King
Information Technology SpecialistsMMWR Editorial Board
William L. Roper, MD, MPH, Chapel Hill, NC, ChairmanMatthew L. Boulton, MD, MPH, Ann Arbor, MI
Virginia A. Caine, MD, Indianapolis, INBarbara A. Ellis, PhD, MS, Atlanta, GA
Jonathan E. Fielding, MD, MPH, MBA, Los Angeles, CADavid W. Fleming, MD, Seattle, WA
William E. Halperin, MD, DrPH, MPH, Newark, NJKing K. Holmes, MD, PhD, Seattle, WA
Timothy F. Jones, MD, Nashville, TNRima F. Khabbaz, MD, Atlanta, GADennis G. Maki, MD, Madison, WI
Patricia Quinlisk, MD, MPH, Des Moines, IAPatrick L. Remington, MD, MPH, Madison, WI
William Schaffner, MD, Nashville, TN
disease-specific death rates by age group. Ages were initially grouped by 10-year increments, from 0–9 years through 70–79 years. However, these 10-year age groups, especially at the younger ages, frequently did not have enough deaths reported to be statistically reliable. Therefore, adjacent 10 year-age groups with small numbers of deaths were combined until enough deaths were aggregated to achieve reliability. For chronic lower respiratory diseases, for example, the age group-ings were 0–49, 50–59, 60–69, and 70–79 years. The three states with the lowest observed death rates for each age group-specific cause of death category were then selected and their death rates averaged to calculate a lowest average age-specific death rate for each cause of death. The average of the lowest three states was chosen to minimize the effect of any extreme outlier and to represent the low end of the distribution of death rates among the states. The second step was to calculate expected deaths for each age group and state by multiplying the age-specific state populations by the lowest three-state average age-specific death rate for each cause. Total expected deaths for each cause per state were then calculated by sum-ming expected deaths over all age groups up to age 79 years. Finally, the potentially preventable deaths were calculated by subtracting expected deaths from observed deaths. In instances where the result would be a negative number of potentially preventable deaths because the existing state rate was lower than the average of the three lowest states, the state’s potentially preventable deaths were set to zero. Results are presented by
state and by the 10 U.S. Department of Health and Human Services regions.*
During the period from 2008 to 2010, the average number of annual deaths from the five leading causes of death in persons aged <80 years was 895,317. This number represents 66% of annual deaths from all causes. The estimated average number of potentially preventable deaths for the five leading causes of death in persons aged <80 years were 91,757 for diseases of the heart, 84,443 for cancer, 28,831 for chronic lower respira-tory diseases, 16,973 for cerebrovascular diseases (stroke), and 36,836 for unintentional injuries (Table 1). The Southeast (Region IV) had the highest number of potentially prevent-able deaths for all five leading causes of death (Table 2). The proportion of potentially preventable deaths among observed deaths for each of the five causes of death were 34% for diseases of the heart, 21% for cancer, 39% for chronic lower respiratory
* Region 1: Connecticut, Maine, Massachusetts, New Hampshire, Rhode Island, and Vermont. Region 2: New Jersey, New York, Puerto Rico, and the U.S. Virgin Islands. Region 3: Delaware, the District of Columbia, Maryland, Pennsylvania, Virginia, and West Virginia. Region 4: Alabama, Florida, Georgia, Kentucky, Mississippi, North Carolina, South Carolina, and Tennessee. Region 5: Illinois, Indiana, Michigan, Minnesota, Ohio, and Wisconsin. Region 6: Arkansas, Louisiana, New Mexico, Oklahoma, and Texas. Region 7: Iowa, Kansas, Missouri, and Nebraska. Region 8: Colorado, Montana, North Dakota, South Dakota, Utah, and Wyoming. Region 9: Arizona, California, Hawaii, Nevada, American Samoa, Commonwealth of the Northern Mariana Islands, Federated States of Micronesia, Guam, Marshall Islands, and Republic of Palau. Region 10: Alaska, Idaho, Oregon, and Washington. Additional information available at http://www.hhs.gov/about/regionmap.html.

Morbidity and Mortality Weekly Report
MMWR / May 2, 2014 / Vol. 63 / No. 17 371
TABLE 1. Annual number of deaths expected,* observed, and potentially preventable† for the five leading cause of death for persons aged <80 years, by state/area — United States, 2008–2010
State/Area
Diseases of the heart CancerChronic lower respiratory
diseasesCerebrovascular diseases
(stroke) Unintentional injuries
Deaths observed
Deaths expected
Potentially prevent-
able deaths
Deaths observed
Deaths expected
Potentially prevent-
able deaths
Deaths observed
Deaths expected
Potentially prevent-
able deaths
Deaths observed
Deaths expected
Potentially prevent-
able deaths
Deaths observed
Deaths expected
Potentially prevent-
able deaths
Alabama 6,604 2,993 3,611 7,595 5,227 2,368 1,778 765 1,013 1,277 588 689 2,036 910 1,126 Alaska 463 331 132 703 588 115 112 77 35 91 62 29 331 131 200 Arizona 4,735 3,885 850 7,460 6,775 685 1,558 1,004 554 848 771 77 2,341 1,191 1,150 Arkansas 3,808 1,845 1,963 4,720 3,219 1,501 1,101 476 625 718 365 353 1,221 551 670 California 24,707 19,742 4,965 38,226 34,454 3,772 6,047 4,904 1,143 5,366 3,839 1,527 8,627 6,886 1,741 Colorado 2,815 2,707 108 4,944 4,752 192 1,141 665 476 604 520 84 1,525 940 585 Connecticut 2,569 2,176 393 4,367 3,805 562 509 544 0 425 420 5 905 679 226 Delaware 857 575 282 1,352 1,006 346 224 147 77 170 113 57 296 172 124 DC 729 310 419 742 543 199 73 78 0 107 61 46 169 117 52 Florida 17,586 13,352 4,234 28,249 23,195 5,054 5,327 3,501 1,826 3,481 2,655 826 6,927 3,675 3,252 Georgia 9,103 5,120 3,983 11,820 8,967 2,853 2,413 1,263 1,150 1,965 989 976 3,133 1,791 1,342 Hawaii 1,007 836 171 1,555 1,467 88 141 212 0 244 163 81 344 259 85 Idaho 1,080 883 197 1,753 1,546 207 409 224 185 234 174 60 516 285 231 Illinois 11,424 7,249 4,175 16,558 12,654 3,904 2,740 1,815 925 2,047 1,412 635 3,093 2,395 698 Indiana 6,421 3,783 2,638 9,385 6,612 2,773 2,154 954 1,200 1,240 739 501 2,064 1,209 855 Iowa 2,716 1,892 824 4,127 3,295 832 859 485 374 462 373 89 892 571 321 Kansas 2,248 1,636 612 3,624 2,854 770 826 414 412 485 321 164 1,010 525 485 Kentucky 5,332 2,662 2,670 7,499 4,655 2,844 1,792 675 1,117 934 520 414 2,240 826 1,414 Louisiana 5,784 2,609 3,175 6,909 4,562 2,347 1,106 658 448 1,003 510 493 1,771 850 921 Maine 1,083 928 155 2,259 1,627 632 443 237 206 229 180 49 390 262 128 Maryland 5,321 3,303 2,018 7,218 5,788 1,430 1,035 818 217 935 636 299 1,065 1,093 0 Massachusetts 4,416 3,926 490 8,319 6,865 1,454 1,115 984 131 807 761 46 1,507 1,252 255 Michigan 10,327 6,056 4,271 14,394 10,600 3,794 2,721 1,527 1,194 1,743 1,178 565 2,923 1,869 1,054 Minnesota 2,720 3,050 0 6,273 5,328 945 960 762 198 662 592 70 1,342 993 349 Mississippi 4,183 1,750 2,433 4,731 3,055 1,676 1,016 446 570 827 344 483 1,395 553 842 Missouri 6,553 3,691 2,862 9,023 6,442 2,581 2,090 941 1,149 1,164 724 440 2,328 1,133 1,195 Montana 826 650 176 1,304 1,143 161 341 166 175 162 127 35 416 190 226 Nebraska 1,252 1,063 189 2,254 1,852 402 543 270 273 294 209 85 490 337 153 Nevada 2,903 1,566 1,337 3,370 2,743 627 701 395 306 446 305 141 952 510 442 New Hampshire 916 828 88 1,772 1,455 317 315 206 109 163 158 5 381 255 126 New Jersey 7,106 5,243 1,863 10,948 9,147 1,801 1,436 1,312 124 1,319 1,015 304 1,888 1,665 223 New Mexico 1,510 1,253 257 2,393 2,194 199 535 320 215 310 246 64 1,013 386 627 New York 17,371 11,522 5,849 23,787 20,112 3,675 3,358 2,906 452 2,423 2,246 177 3,804 3,692 112 North Carolina 9,021 5,679 3,342 13,297 9,931 3,366 2,698 1,436 1,262 1,894 1,108 786 3,268 1,802 1,466 North Dakota 512 406 106 780 708 72 170 104 66 127 80 47 193 127 66 Ohio 11,875 7,164 4,711 17,413 12,514 4,899 3,729 1,818 1,911 2,271 1,400 871 4,016 2,184 1,832 Oklahoma 4,857 2,267 2,590 5,787 3,957 1,830 1,736 581 1,155 889 448 441 1,870 703 1,167 Oregon 2,421 2,364 57 5,212 4,153 1,059 1,110 599 511 635 461 174 1,068 730 338 Pennsylvania 12,668 8,221 4,447 19,114 14,340 4,774 3,051 2,101 950 2,194 1,611 583 4,319 2,435 1,884 Rhode Island 820 636 184 1,423 1,112 311 225 160 65 148 123 25 339 200 139 South Carolina 5,413 2,896 2,517 7,063 5,079 1,984 1,391 740 651 1,119 567 552 1,910 883 1,027 South Dakota 590 491 99 1,054 856 198 226 126 100 126 97 29 284 151 133 Tennessee 7,956 3,916 4,040 10,185 6,853 3,332 2,197 995 1,202 1,463 765 698 2,895 1,209 1,686 Texas 19,939 12,683 7,256 27,141 22,143 4,998 5,061 3,139 1,922 4,254 2,471 1,783 7,612 4,551 3,061 Utah 1,229 1,194 35 1,931 2,080 0 383 298 85 282 238 44 765 470 295 Vermont 482 411 71 921 723 198 167 103 64 91 79 12 181 122 59 Virginia 6,588 4,609 1,979 10,162 8,073 2,089 1,647 1,148 499 1,369 891 478 1,889 1,521 368 Washington 4,437 3,844 593 8,193 6,754 1,439 1,451 956 495 907 743 164 1,925 1,269 656 West Virginia 2,400 1,308 1,092 3,415 2,289 1,126 921 338 583 464 257 207 1,031 364 667 Wisconsin 4,513 3,424 1,089 7,530 5,978 1,552 1,190 862 328 869 667 202 1,666 1,074 592 Wyoming 492 333 159 695 585 110 186 83 103 73 65 8 296 106 190
Total 272,688 181,261 91,757 400,949 316,652 84,443 74,458 45,738 28,831 52,360 35,390 16,973 94,862 58,055 36,836
Abbreviation: DC = District of Columbia.* Expected deaths are the lowest three-state average age-specific death rate times the age-specific state population rounded to the nearest whole number.† Potentially preventable deaths are observed deaths minus expected deaths rounded to the nearest whole number.

Morbidity and Mortality Weekly Report
372 MMWR / May 2, 2014 / Vol. 63 / No. 17
diseases, 33% for cerebrovascular diseases (stroke), and 39% for unintentional injuries (Figure).
Discussion
Death rates are population health outcome measures that reflect the combined influences of multiple biological and social health determinants, public health efforts, and medi-cal care. Examining which diseases and injuries result in the greatest number of deaths in populations, particularly for deaths that occur earlier than expected, allows health officials to establish disease prevention goals, priorities, and strategies. In the United States, the largest number of deaths during 2008–2010 occurred from diseases of the heart, cancer, chronic lower respiratory diseases, cerebrovascular diseases (stroke), and unintentional injuries (1). The results of this study demon-strate that if all states achieved the lowest observed mortality levels for the five leading causes, when considered separately, as many as 91,757 premature heart disease deaths, 84,443 cancer deaths, 28,831 chronic lower respiratory disease deaths, 16,973 stroke deaths, and 36,836 unintentional injury deaths might be prevented each year. These calculations translate to approximately one in three premature heart disease deaths, one in five premature cancer deaths, two out of five chronic lower respiratory disease deaths, one out of every three stroke deaths, and two out of every five unintentional injury deaths that could be prevented.
Reducing the number of earlier than expected deaths from the leading causes of death requires risk factor reduction, screening, early intervention, and successful treatment of the
disease or injury. For the five leading causes of death, the major modifiable risk factors include 1) diseases of the heart: tobacco use, high blood pressure, high blood cholesterol, type 2 diabe-tes, poor diet, being overweight, and lack of physical activity (3); 2) cancer: tobacco use, poor diet, lack of physical activity, being overweight, sun exposure, certain hormones, alcohol, some viruses and bacteria, ionizing radiation, and certain chemicals and other substances (4); 3) chronic lower respiratory diseases: tobacco smoke, second hand smoke exposure, other indoor air pollutants, outdoor air pollutants, allergens, and occupational agents (5); 4) cerebrovascular diseases (stroke): high blood pressure, high blood cholesterol, heart disease, diabetes, being overweight, tobacco use, alcohol use, and lack of physi-cal activity (6); and 5) unintentional injuries: lack of vehicle restraint use, lack of motorcycle helmet use, unsafe consumer products, drug and alcohol use (including prescription drug misuse), exposure to occupational hazards, and unsafe home and community environments (7).
The majority of these risk factors do not occur randomly in populations; they are closely aligned with the social, demo-graphic, environmental, economic, and geographic attributes of the neighborhoods in which people live and work (8). However, the calculation of potentially preventable deaths in this study did not account for differences in the attributes of states that might influence risk factors and ultimately death rates, such as proportion of the population below the poverty level. If health disparities were eliminated, as is called for by Healthy People 2020 (9), all states should be closer to achieving the lowest possible death rates for the five leading causes of death.
TABLE 2. Annual number of deaths expected,* observed, and potentially preventable† for the five leading cause of death for persons aged <80 years, by U.S. Department of Health and Human Services region§ — United States, 2008–2010
Region
Diseases of the heart CancerChronic lower respiratory
diseasesCerebrovascular diseases
(stroke) Unintentional injuries
Deaths observed
Deaths expected
Potentially prevent-
able deaths
Deaths observed
Deaths expected
Potentially prevent-
able deaths
Deaths observed
Deaths expected
Potentially prevent-
able deaths
Deaths observed
Deaths expected
Potentially prevent-
able deaths
Deaths observed
Deaths expected
Potentially prevent-
able deaths
1 10,286 8,904 1,382 19,061 15,587 3,474 2,774 2,234 540 1,863 1,722 141 3,703 2,771 932 2 24,477 16,765 7,712 34,735 29,259 5,476 4,794 4,218 576 3,742 3,261 481 5,692 5,357 335 3 28,563 18,327 10,236 42,003 32,039 9,964 6,951 4,630 2,321 5,239 3,568 1,671 8,769 5,703 3,066 4 65,198 38,367 26,831 90,439 66,962 23,477 18,612 9,820 8,792 12,960 7,538 5,422 23,804 11,650 12,154 5 47,280 30,726 16,554 71,553 53,686 17,867 13,494 7,740 5,754 8,832 5,988 2,844 15,104 9,724 5,380 6 35,898 20,656 15,242 46,950 36,074 10,876 9,539 5,174 4,365 7,174 4,040 3,134 13,487 7,040 6,447 7 12,769 8,281 4,488 19,028 14,443 4,585 4,318 2,111 2,207 2,405 1,628 777 4,720 2,566 2,154 8 6,464 5,782 682 10,708 10,123 585 2,447 1,442 1,005 1,374 1,128 246 3,479 1,985 1,494 9 33,352 26,030 7,322 50,611 45,439 5,172 8,447 6,514 1,933 6,904 5,078 1,826 12,264 8,845 3,419
10 8,401 7,422 979 15,861 13,041 2,820 3,082 1,857 1,225 1,867 1,439 428 3,840 2,414 1,426
Total 272,688 181,261 91,428 400,949 316,652 84,296 74,458 45,738 28,718 52,360 35,390 16,970 94,862 58,055 36,807
* Expected deaths are the lowest three-state average age-specific death rate times the age-specific state population rounded to the nearest whole number. Differences between Table 1 and Table 2 are the result of rounding error when calculating states individually or by region.
† Potentially preventable deaths are observed deaths minus expected deaths rounded to the nearest whole number.§ Region 1: Connecticut, Maine, Massachusetts, New Hampshire, Rhode Island, and Vermont. Region 2: New Jersey, New York, Puerto Rico, and the U.S. Virgin Islands. Region 3: Delaware, the
District of Columbia, Maryland, Pennsylvania, Virginia, and West Virginia. Region 4: Alabama, Florida, Georgia, Kentucky, Mississippi, North Carolina, South Carolina, and Tennessee. Region 5: Illinois, Indiana, Michigan, Minnesota, Ohio, and Wisconsin. Region 6: Arkansas, Louisiana, New Mexico, Oklahoma, and Texas. Region 7: Iowa, Kansas, Missouri, and Nebraska. Region 8: Colorado, Montana, North Dakota, South Dakota, Utah, and Wyoming. Region 9: Arizona, California, Hawaii, Nevada, American Samoa, Commonwealth of the Northern Mariana Islands, Federated States of Micronesia, Guam, Marshall Islands, and Republic of Palau. Region 10: Alaska, Idaho, Oregon, and Washington. Additional information available at http://www.hhs.gov/about/regionmap.html.

Morbidity and Mortality Weekly Report
MMWR / May 2, 2014 / Vol. 63 / No. 17 373
The findings in this report are subject to at least four limita-tions. First, uncertainty and error in the diagnosis and reporting of cause of death might result in errors in death rate estimations for some causes of death. Second, state affiliation is based on the person’s residency at the time of death. With the exception of unintentional injuries, the factors that led to the resulting cause of death for some persons might have accumulated over a lifetime spent in different geographic locations. Third, the potentially preventable deaths are based on existing levels of state performance for the three states with the lowest death rates for each condition and might underestimate the benefit if these three states made full use of optimal health promo-tion and disease prevention strategies. Finally, to the extent that natural (i.e., random) variability in state death rates from year to year is responsible for the selection of the three states with the lowest death rates, there will be a tendency to regress to the mean. The method used tends to slightly overestimate the number of potentially preventable deaths. Nevertheless, the random component of the variation in state death rates is minimal and any bias is also minimal.
What is already known on this topic?
The top five causes of death in the United States are diseases of the heart, cancer, chronic lower respiratory diseases, cerebro-vascular diseases (stroke), and unintentional injuries. Death rates for these diseases vary widely across the states because of the distribution of health determinants, access and use of health services, and public health efforts.
What is added by this report?
This report demonstrates that if all states could achieve the lowest observed death rates for the five leading causes, when considered separately, as many as 91,757 premature heart disease deaths, 84,443 cancer deaths, 28,831 chronic lower respiratory disease deaths, 16,973 stroke deaths, and 36,836 unintentional injury deaths might be prevented in the United States each year.
What are the implications for public health practice?
State health officials can use the lower death rates as bench-marks to establish disease prevention goals, priorities, and strategies. Reducing the number of earlier than expected deaths from the leading causes of death requires the joint effort of public health and heath-care organizations and personnel to support risk factor prevention and reduction, screening, early intervention, and successful treatment of diseases or injuries.
FIGURE. Annual number of deaths observed and potentially preventable* for the five leading cause of death for persons aged <80 years — United States, 2008–2010
* Potentially preventable deaths are observed deaths minus expected deaths (the lowest three-state average age-specific death rate times the age-specific state population) rounded to the nearest whole number.
0
50
100
150
200
250
300
350
400
450
Diseases of the heart Cancer Chronic lowerrespiratory diseases
Cerebrovasculardiseases (stroke)
Unintentional injuries
No.
of d
eath
s (in
thou
sand
s)
Cause of death
Deaths observedPotentially preventable deaths

Morbidity and Mortality Weekly Report
374 MMWR / May 2, 2014 / Vol. 63 / No. 17
As a further note of caution, potentially preventable deaths cannot be added across causes of death by state or for the nation as a whole because of competing risks. For example, for a state that has been able to reduce its heart disease mortality, some premature deaths will be prevented altogether, but others will be pushed to different causes of death. A person who avoids death from heart disease might then be exposed to a higher risk for dying from injury or cancer. The result is that there is less variation by state in the death rate for all causes combined than for any particular cause of death.
States can use the disease-specific aspirational goals for poten-tially preventable deaths presented in this report in several ways. They can identify other states with similar populations but better outcomes and examine what those are doing differently to address the leading causes of death. Although each state has a unique set of factors that determine health outcomes, states might find neighboring states or states within their region as good sources of information on effective policies, programs, and services. The goals can also be used to educate state poli-cymakers and leaders about what is achievable if they were able to match the best state outcomes. 1Division of Epidemiology, Analysis, and Library Services, Center for
Surveillance, Epidemiology, and Laboratory Services; 2Division of Vital Statistics, National Center for Health Statistics; 3Division of Nutrition, Physical Activity, and Obesity, National Center for Chronic Disease Prevention and Health Promotion; 4Office of the Associate Director for Science, CDC (Corresponding author: Paula W. Yoon, [email protected], 404-498-6298)
References1. Hoyert DL, Xu JQ. Deaths: preliminary data for 2011. Natl Vital Stat
Rep 2012;61(6).2. Murphy SL, Xu JQ, Kochanek KD. Deaths: final data for 2010. Natl
Vital Stat Rep 2013;61(4).3. National Heart Lung and Blood Institute. What are the risk factors for
heart disease? Washington, DC: National Institutes of Health; 2012. Available at http://www.nhlbi.nih.gov/educational/hearttruth/lower-risk/risk-factors.htm.
4. National Cancer Institute. Prevention, genetics, causes. Washington, DC: National Institutes of Health; 2013. Available at http://www.cancer.gov/cancertopics/prevention-genetics-causes.
5. World Health Organization. Risk factors for chronic respiratory diseases. In: Global surveillance, prevention and control of chronic respiratory diseases: a comprehensive approach. Geneva, Switzerland: World Health Organization; 2007:37–55. Available at http://www.who.int/gard/publications/GARD%20Book%202007.pdf.
6. CDC. Stroke risk factors. Atlanta, GA: US Department of Health and Human Services, CDC; 2010. Available at http://www.cdc.gov/stroke/risk_factors.htm.
7. Doll LS, Bonzo SE, Mercy JA, Sleet DA, eds. Handbook of injury and violence prevention. New York, NY: Springer; 2007.
8. CDC. CDC health disparities and inequalities report—United States, 2013. MMWR 2013;62(Suppl No. 3).
9. US Department of Health and Human Services. Healthy people 2020. Washington, DC: US Department of Health and Human Service; 2013. Available at http://www.healthypeople.gov/2020.
Morbidity and Mortality Weekly Report
MMWR / May 2, 2014 / Vol. 63 / No. 17 375
Outbreak of Campylobacteriosis Associated with a Long-Distance Obstacle Adventure Race — Nevada, October 2012
Mariah Zeigler, DVM1, Chad Claar, MPH1, Daviesha Rice, MPH1, Jack Davis, PhD1, Tammy Frazier1, Alex Turner1, Corinna Kelley1, Jonathan Capps1, Andrea Kent1, Valerie Hubbard1, Christiana Ritenour1, Cristina Tuscano1, Zuwen Qiu-Shultz, MPH2,
Collette Fitzgerald Leaumont, PhD3 (Author affiliations at end of text)
On October 12, 2012, the Nellis Air Force Base Public Health Flight (Nellis Public Health), near Las Vegas, Nevada, was notified by the Mike O’Callaghan Federal Medical Center (MOFMC) emergency department (ED) of three active-duty military patients who went to the ED during October 10–12 with fever, vomiting, and hemorrhagic diarrhea. Initial interviews by clinical staff members indicated that all three patients had participated October 6–7 in a long-distance obstacle adventure race on a cattle ranch in Beatty, Nevada, in which competitors frequently fell face first into mud or had their heads submerged in surface water. An investigation by Nellis Public Health, coordinated with local and state health officials, identified 22 cases (18 probable and four confirmed) of Campylobacter coli infection among active-duty service mem-bers and civilians. A case-control study using data provided by patients and healthy persons who also had participated in the race showed a statistically significant association between inadvertent swallowing of muddy surface water during the race and Campylobacter infection (odds ratio = 19.4; p<0.001). Public health agencies and adventure race organizers should consider informing race attendees of the hazards of inadvertent ingestion of surface water.
Campylobacter is one of the most common causes of diar-rheal illness in the United States. Most persons who become ill with campylobacteriosis get diarrhea, cramping, abdominal pain, and fever within 2–5 days after exposure to the organ-ism. The diarrhea can be bloody and can be accompanied by nausea and vomiting. The illness typically lasts about 1 week. Most cases occur as isolated, sporadic events and are usually associated with eating raw or undercooked poultry or from cross-contamination of other foods by these items (1).
Initial Epidemiologic InvestigationBecause of the three cases of hemorrhagic diarrhea and
the suspected source of infection reported to Nellis Public Health by ED staff members on October 12, definitions were developed to identify additional cases. A probable case was defined as diarrhea (three or more loose stools in a 24-hour period), any episode of bloody diarrhea, or a combination of other gastrointestinal illness symptoms (e.g., abdominal cramps, nausea, or vomiting) in a person who participated in
the obstacle adventure race during October 6–7. A confirmed case was defined as a probable case in a patient who also had laboratory isolation of Campylobacter from a stool specimen.
An additional 19 patients, including both military and civilian personnel, were identified through active reporting by clinical staff members throughout MOFMC, a retrospective review of ED logs from October 6–16, and announcements to the Nellis community that encouraged self-identification. These efforts resulted in the identification of a total of 18 probable and four confirmed cases of illness. The investigation was limited to the population of the Nellis community, primarily because of the short incubation period for Campylobacter, the time lags between the event, symptom onset, and investigative findings, and the lack of additional cases reported to the Southern Nevada Health District by civilian health-care providers.
Among the 22 patients, the mean time from exposure to illness was 3.3 days (range = 1–9 days) (Figure). The most common symptoms were diarrhea (18 of 19 patients), cramps (14 of 18 patients), fever (10 of 18 patients), and nausea (10 of 17 patients) (Table 1). Twenty of the 22 patients sought medical care, and two reported their illness directly to Nellis Public Health without seeking care. One person with chronic gastrointestinal illness was hospitalized and treated with sup-portive care and intravenous antibiotics. All 22 patients made a full recovery.
To obtain information about the outbreak source, a 72-hour food and drinking water history questionnaire, which included questions on surface water exposure, was used to interview the ill persons. An analysis of the questionnaire data indicated that muddy surface water was a possible source of infection.
Case-Control StudyA case-control study was conducted to identify the source
of infection. Twenty-four healthy controls consisting of both military personnel and civilians who had been race participants were identified through contact investigation of the 22 case-patients. Nellis Public Health developed a new questionnaire for this investigation and administered it by telephone. The questionnaire evaluated the 22 case-patients and 24 controls with regard to their water consumption, food consumption,

Morbidity and Mortality Weekly Report
376 MMWR / May 2, 2014 / Vol. 63 / No. 17
and environmental water exposure during the October 6–7 obstacle race.
Analysis of the case-control study identified a statisti-cally significant association with “inadvertent swallowing of muddy water while competing” and Campylobacter infection (odds ratio = 19.4; p<0.001) (Table 2). No significant associa-tion (p<0.05) was found with drinking water or eating food provided by race organizers, full body submersion in surface water, or getting surface water or mud in the eyes or mouth.
Laboratory TestingNellis Public Health requested stool specimens from all 22
patients and recommended cultures for Shigella, Campylobacter, Salmonella, and Escherichia coli 0157:H7, plus testing for Shiga toxin and a search for ova and parasites. Initially, four stool spec-imens were obtained and each tested negative for all organisms, including Campylobacter. Persistence in obtaining seven addi-tional stool specimens resulted in four laboratory-confirmed
cases positive for Campylobacter by growth on selective media, oxidase testing, and Gram stain at the MOFMC laboratory. These four isolates were identified as hippurate-negative Campylobacter (not Campylobacter jejuni) by the Southern Nevada Health District Public Health Laboratory and further identified as Campylobacter coli by CDC.
Further characterization of the four C. coli isolates by pulsed-field gel electrophoresis using SmaI and KpnI, multilocus sequence typing, and antimicrobial susceptibility testing at CDC, identified all four as the same strain. This C. coli outbreak strain was pansuscep-tible to the antimicrobials tested on the CDC national antimicrobial resistance monitoring system panel, and was assigned PulseNet patterns DBBS16.0134/ DBBK02.0272 and sequence type (ST) 6159. All specimens tested
for E. coli 0157:H7, Salmonella, Shigella, Shiga toxin, and ova and parasite testing were negative.
Public Health ActionBecause commercial obstacle adventure races often are mar-
keted to military personnel, Nellis Public Health provided edu-cational outreach to the base population regarding the risk for disease when competing in such events. Emphasis was placed on the importance of hand washing and avoidance of exposure (especially ingestion) to contaminated surface water to prevent disease. This investigation also highlighted the importance of outbreak investigators continuing stool specimen collection, culture, and serial testing, even after initial results are negative.
Discussion
Inadvertent ingestion of muddy surface water contaminated with cattle or swine feces during a long-distance obstacle adventure course competition likely resulted in an outbreak of campylobacteriosis in 22 participants. Four of the 22 had laboratory-confirmed infections with Campylobacter coli.
High-intensity and competitive muddy obstacle adventure course races have surged in popularity across the United States, drawing an estimated 1.5 million participants in 2012 (2). These military-style adventure races attract high numbers of active-duty military personnel, along with young, active, extremely fit civilians. Persons typically are advised of the risks of participating and required to sign a liability waiver. Races are commonly held on farmlands where animal feces increase the risk for zoonotic disease transmission. Primary and emergency care providers, as well as public health profes-sionals, should be aware that obstacle adventure race events
FIGURE. Number of probable and confirmed cases of Campylobacter coli infection among participants in a long-distance obstacle adventure race, by date of symptom onset — Nevada, October 2012
0
2
4
6
8
10
6 7 8 9 10 11 12 13 14 15 16 17 18
No.
of c
ases
Date of symptom onset
ProbableCon�rmed
Obstacle adventure race
Average incubation period = 3.3 days
TABLE 1. Number of persons (N = 22) with signs and symptoms of confirmed or probable Campylobacter coli infection after participating in a long-distance obstacle adventure race — Nevada, October 2012
Sign/Symptom No.* (%*)
Diarrhea 18 of 19 (95)Cramps 14 of 19 (74)Fever 10 of 18 (56)Nausea 10 of 18 (56)Vomiting 9 of 17 (53)Watery diarrhea 7 of 10 (70)Bloody diarrhea 6 of 10 (60)Influenza-like illness 6 of 10 (60)Mucus-like diarrhea 3 of 10 (30)Chills 3 of 7 (43)
* Denominator values varied as a result of nonreporting by some participants.

Morbidity and Mortality Weekly Report
MMWR / May 2, 2014 / Vol. 63 / No. 17 377
could pose a heightened risk for outbreaks from inadvertent ingestion of contaminated water or mud and might consider outreach to educate participants on the health risks from oral contact with contaminated surface water or mud.
Documented common-source outbreaks of campylobacteriosis (especially those caused by C. coli) are rare, but have been previously attributed to contact with nonchlorinated water contaminated with the feces of cattle, poultry, and swine (3). Campylobacter is an important cause of acute zoonotic bacterial diarrhea across all age groups. An estimated 5%–14% of diarrhea cases worldwide are attributed to this organism, and approximately 2.4 million human cases of campylobacteriosis occur annually in the United States (4).
Participation in obstacle adventure races is relatively common among men and women of the U.S. military. These events typically are held in rural areas and often include man-made slurry fields (a mixture of soil or clay and water) as race “chal-lenges.” In areas commonly frequented by animals (5), topsoil used in the creation of slurry fields can be contaminated with feces from domestic fowl (6) or ruminants (7) or wild animals. Competitors who run or ride through such areas might unin-tentionally swallow sufficient numbers of organisms to cause clinical disease. Fewer than 500 Campylobacter organisms are needed to cause illness (1). The race described in this report was held on a cattle ranch, and participants reported seeing cattle and swine on or near the course on race day. Obstacle adventure race planners should consider building slurry field challenges where animal fecal contamination is not likely.
Although contaminated food and drinking water are more common sources of Campylobacter outbreaks, previous out-breaks have been associated with unintentional ingestion of contaminated mud or muddy water. Campylobacteriosis out-breaks were associated with two bicycle races in Norway in the 1990s, in which unintentional ingestion of dirty water splash-ing from bicycle wheels was implicated (8). Similarly, ingestion of mud was found the most likely cause of Campylobacter outbreaks during mountain bike races in Wales in 2008 (9) and in British Columbia in 2010 (10).
Warning participants in outdoor sporting events who might be exposed to fecally contaminated water or slurry that
potentially serious diarrheal disease can result if ingested, even inadvertently, could reduce exposures to these pathogens. Event organizers should consider including the risk for waterborne outbreaks in their participant waivers and advise participants to avoid drinking or swallowing unsafe water. Participants also need to be encouraged to seek appropriate medical care for postcompetition diarrhea, especially bloody diarrhea, and to inform medical personnel of their exposure. In addition, health-care providers need to be aware of the association between these adventure races and the risk for exposure to Campylobacter or other pathogens via contaminated water, mud, or slurry so that appropriate diagnostic testing and treat-ment can be provided to ill participants.
TABLE 2. Comparison of case-patients with Campylobacter coli infection and control subjects among participants in a long-distance obstacle adventure race, by food and water exposures — Nevada, October 2012
Exposure
Case-patients (n = 22) Controls (n = 24)
Odds ratio p-value%* %*
Inadvertent swallowing of muddy water while competing 89 30 19.4 <0.001Consumption of potable drinking water provided by race organizers 100 100 2.6 0.48Consumption of food provided by race organizers 93 74 4.9 0.16Full body submersion in surface water 94 96 0.7 0.86Exposure of eyes or mouth to surface water or mud 100 74 6.4 0.09
* Denominator values varied as a result of nonreporting by some participants.
What is already known on this topic?
Campylobacter is an important cause of acute zoonotic bacterial enteric disease worldwide. The most common cause of campylo-bacteriosis in humans is Campylobacter jejuni, with Campylobacter coli less common. Livestock, including cattle and swine, are important reservoirs for human infection with C. coli. Multiple outbreaks have been linked to contaminated surface water.
What is added by this report?
In 2012 a total of 22 cases of acute diarrheal disease attributed to C. coli were identified among participants in a long-distance obstacle adventure race in Beatty, Nevada. Eleven stool speci-mens were collected for culture, and four were positive for C. coli. This investigation established an association between inadver-tent swallowing of muddy surface water and C. coli infection. In addition, the investigation demonstrated the potential need for ongoing collection of stool specimens for culture during a food or waterborne outbreak to identify the causative agent and implement public health preventive measures.
What are the implications for public health practice?
Participation in adventure races combining mud and obstacles has become popular with extremely fit members of the general public, including military personnel. The races often take place on farmland exposing participants to numerous zoonotic pathogens. This outbreak highlights C. coli as a cause of diarrhea associated with such exposures and the importance of inform-ing participants and race organizers regarding these hazards.

Morbidity and Mortality Weekly Report
378 MMWR / May 2, 2014 / Vol. 63 / No. 17
Acknowledgments
Paul Hug, Southern Nevada Health District. Barbara Mahon, MD, Patrick Kwan, PhD, Janet Pruckler, Jessica Halpin, MS, Steven Stroika, Lexie Vaughn, Division of Foodborne, Waterborne, and Environmental Diseases, National Center for Emerging and Zoonotic Infectious Diseases, CDC. James A. Mullins, DVM, Air Combat Command Public Health. Mark R. Duffy, DVM, US Air Force School of Aerospace Medicine. Stefani Ruiz, MHS, US Air Force School of Aerospace Medicine. Brenna Shackelford, MD, Nellis Air Force Base Emergency Services; Dana Windhorst, MD, Nellis Air Force Base Aerospace Medicine; Ruth A. Jones, Nellis Air Force Base Clinical Laboratory.
1Nellis Air Force Base Public Health Flight, Nellis Air Force Base, Nevada; 2Southern Nevada Health District, Las Vegas, Nevada; 3Division of Foodborne, Waterborne, and Environmental Diseases, National Center for Emerging and Zoonotic Infectious Diseases, CDC (Corresponding author: Chad Claar, [email protected], 702-653-3440)
References1. CDC. Campylobacter. How do people get infected with this germ? Atlanta,
GA: US Department of Health and Human Services, CDC; 2013. Available at http://www.cdc.gov/nczved/divisions/dfbmd/diseases/campylobacter/#how_infect.
2. Keneally S. Playing dirty. Outside [magazine]. November 2012. Available at http://www.outsideonline.com/outdoor-adventure/multisport/playing-dirty-november-2012.html.
3. Scallan E, Hoekstra RM, Angulo FJ, et al. Foodborne illness acquired in the United States—major pathogens. Emerg Infect Dis 2011;17:7–15.
4. Saeed AM, Harris NV, DiGiacomo RF. The role of exposure to animals in the etiology of Campylobacter jejuni/coli enteritis. Am J Epidemiol 1993;137:108–14.
5. Rosef O, Gondrosen B, Kapperud G, Underdal B. Isolation and characterization of Campylobacter jejuni and Campylobacter coli from domestic and wild mammals in Norway. Appl Environ Microbiol 1983;46:855–9.
6. Pearson AD, Greenwood MH, Donaldson J, et al. Continuous source outbreak of campylobacteriosis traced to chicken. J Food Prot 2000;63:309–14.
7. Kemp R, Leatherbarrow AJ, Williams NJ, et al. Prevalence and genetic diversity of Campylobacter spp. in environmental water samples from a 100-square-kilometer predominantly dairy farming area. Appl Environ Microbiol 2005;71:1876–82.
8. Kapperud G, Lomo OM, Styrmo K, Gregusson S, Melby K, Vardund T. Two outbreaks of Campylobacter infection after bicycle races—dirty water splash from the wheels identified as a likely source of infection [in Norwegian]. MSIS-rapport 2000;28. Available at http://www.fhi.no/davx/nyhetsbrev/msis/2000/8/msis.pdf.
9. National Public Health Service for Wales. The investigation of an outbreak of diarrhoeal illness in participants of the Builth Wells Mountain Bike Marathon: final report. Available at http://www.wales.nhs.uk/sitesplus/888/document/149181.
10. Stuart TL, Sandhu J, Stirling R, et al. Campylobacteriosis outbreak associated with ingestion of mud during a mountain bike race. Epidemiol Infect 2010;138:1695–703.

Morbidity and Mortality Weekly Report
MMWR / May 2, 2014 / Vol. 63 / No. 17 379
Falls are the leading cause of injury-related morbidity and mortality among older adults, with more than one in three older adults falling each year,* resulting in direct medical costs of nearly $30 billion (1). Some of the major consequences of falls among older adults are hip fractures, brain injuries, decline in functional abilities, and reductions in social and physical activities (2). Although the burden of falls among older adults is well-documented (1,2), research suggests that falls and fall injuries are also common among middle-aged adults (3). One risk factor for falling is poor neuromuscular function (i.e., gait speed and balance), which is common among persons with arthritis (2). In the United States, the prevalence of arthritis is highest among middle-aged adults (aged 45–64 years) (30.2%) and older adults (aged ≥65 years) (49.7%), and these popula-tions account for 52% of U.S. adults (4). Moreover, arthritis is the most common cause of disability (5). To examine the preva-lence of falls among middle-aged and older adults with arthritis in different states/territories, CDC analyzed data from the 2012 Behavioral Risk Factor Surveillance System (BRFSS) to assess the state-specific prevalence of having fallen and having experienced a fall injury in the past 12 months among adults aged ≥45 years with and without doctor-diagnosed arthritis. This report summarizes the results of that analysis, which found that for all 50 states and the District of Columbia (DC), the prevalence of any fall (one or more), two or more falls, and fall injuries in the past 12 months was significantly higher among adults with arthritis compared with those without arthritis. The prevalence of falls and fall injuries is high among adults with arthritis but can be addressed through greater dissemination of arthritis management and fall prevention programs in clinical and community practice.
BRFSS is an annual, random-digit–dialed landline and cell-phone survey representative of the noninstitutionalized adult population aged ≥18 years of the 50 states, DC, and the U.S. territories. In 2012, a total of 338,734 interviews with persons aged ≥45 years were completed, and data from 50 states, DC, Puerto Rico, and Guam are included in this report (the U.S.
Virgin Islands did not collect BRFSS data). Response rates ranged from 27.7% to 60.4%, with a median of 45.2%.†
Respondents were defined as having arthritis if they answered “yes” to the question, “Have you ever been told by a doctor or other health professional that you have some form of arthri-tis, rheumatoid arthritis, gout, lupus, or fibromyalgia?” The BRFSS survey asks about falls in the past year, explaining to the respondent that, “By a fall, we mean when a person unin-tentionally comes to rest on the ground or another lower level.” Respondents were considered to have fallen if they answered the question, “In the past 12 months, how many times have you fallen?” with a number of one or more. The number of falls was analyzed as a categorical variable (zero, one, or two or more) and as a dichotomous variable (yes or no). Those who reported one or more falls were also asked, “How many of these falls caused an injury? By an injury, we mean the fall caused you to limit your regular activities for at least a day or to go see a doctor?” Injury from any fall was categorized as a dichotomous variable (yes or no).
All analyses used sampling weights to account for the com-plex sample design, nonresponse, noncoverage, and cellphone-only households. Since 2011, iterative proportional weighting (raking) has been used and shown to reduce nonresponse bias and error within estimates compared with post-stratification weighting.§ Thus, 2012 estimates should not be compared with estimates made before 2011. The unadjusted prevalence of any fall (one or more in the past 12 months) with 95% confidence intervals (CIs) for combined state/territory data was used to assess the similarity of prevalence for two age groups (45–64 and ≥65 years). State-specific unadjusted prevalence of fall out-comes among adults aged ≥45 years with and without arthritis are available at http://www.cdc.gov/arthritis/data_statistics/prevalence-injuries-falls-by-state.htm. Age-adjusted estimates were standardized to the year 2000 U.S. standard population
Falls and Fall Injuries Among Adults with Arthritis — United States, 2012
Kamil E. Barbour, PhD1, Judy A. Stevens, PhD2, Charles G. Helmick, MD1, Yao-Hua Luo, PhD1, Louise B. Murphy, PhD1, Jennifer M. Hootman, PhD1, Kristina Theis, MPH1, Lynda A. Anderson, PhD1, Nancy A. Baker, ScD3, David E. Sugerman, MD2
(Author affiliations at end of text)
* Information available at http://www.cdc.gov/injury/wisqars.
† The response rate was the number of respondents who completed the survey as a proportion of all eligible and likely eligible persons. Response rates for BRFSS were calculated using standards set by the American Association of Public Opinion Research response rate formula no. 4. Additional information ava i lable a t ht tp: / /www.cdc.gov/br f s s /annual_data/2012/pdf/summarydataqualityreport2012_20130712.pdf.
§ Additional information available at http://www.cdc.gov/brfss/annual_data/2012/pdf/overview_2012.pdf.

Morbidity and Mortality Weekly Report
380 MMWR / May 2, 2014 / Vol. 63 / No. 17
using five age-groups (45–54, 55–64, 65–74, 75–84, and ≥85 years). Age-adjusted estimates were presented and used to compare the prevalence of one fall, any fall, two or more falls, and fall injuries by arthritis status across states/territories. In addition, medians and ranges for all states and DC were determined for each fall outcome. For all comparisons, differ-ences were considered statistically significant if the CIs of the age-adjusted estimates did not overlap.
The unadjusted prevalence of having experienced any fall in the past 12 months was similar for adults aged 45–64 years (25.5%) and ≥65 years (27.0%); therefore, state-specific find-ings for the combined ≥45 years age group are reported. Overall the unadjusted median state prevalence of arthritis among adults aged ≥45 years was 40.1% (range = 31.0%–51.9%), and the median prevalence of one fall, two or more falls, and fall injuries in the preceding year was 13.8% (range = 8.8%–16.7%), 13.3% (range = 6.1%–21.0%), and 9.9% (range = 4.5%–13.3%), respectively.
In analyses of adults with arthritis, the age-adjusted median prevalence for one fall was 15.5% (range = 10.7% in Wisconsin to 20.1% in Washington), for two or more falls was 21.3% (range = 7.7% in Wisconsin to 30.6% in Alaska), and for fall injuries was 16.2% (range = 8.5% in Wisconsin to 22.1% in Oklahoma) (Table). Among adults without arthritis, the age-adjusted median prevalence of one fall, two or more falls, and fall injuries was 12.1% (range = 7.7% in Wisconsin to 15.1% in Wyoming), 9.0% (range = 4.1% in Wisconsin to 14.6% in Alaska), and 6.5% (range = 2.7% in Wisconsin to 9.0% in Alaska), respectively. Within every state and territory except Guam, the prevalence of two or more falls and fall injuries was significantly higher for those with arthritis com-pared with those without arthritis (Table). The age-adjusted median prevalence of one fall, any fall, two or more falls, and fall injuries was 28%, 79%, 137%, and 149% higher (relative differences), respectively, among adults with arthritis compared with adults without arthritis.
In 2012, 46 states and DC had an age-adjusted prevalence of any fall in the past 12 months of ≥30% among adults with arthritis, and 16 states had an age-adjusted prevalence of any fall of ≥40% (Figure). Among adults without arthritis, no state/territory had an age-adjusted prevalence of falls ≥30% or had a significantly higher age-adjusted prevalence of falls compared with adults with arthritis.
Discussion
In all 50 states and DC, the prevalence of any fall (one or more), two or more falls, and fall injuries in the past 12 months was significantly higher among adults aged ≥45 years with arthritis compared with those without arthritis. Among persons with arthritis, about half of all states had a prevalence
of multiple falls (two or more) ranging from 21% to 31% and a prevalence of fall injuries ranging from 16% to 22%. In 45 states and DC, the age-adjusted prevalence of any fall among adults with arthritis was ≥30%; in contrast, the prevalence of any fall in adults without arthritis did not reach 30% in any state. Finally, the age-adjusted median prevalence of two or more falls and fall injuries among adults with arthritis was approximately 2.4 and 2.5 times higher, respectively, than those without arthritis.
The 2010 U.S. Census reported 81.5 million adults (26.4% of the population) aged 45–64 and 40.3 million persons (13.0%) aged ≥65 years. The projected rapid growth in the population aged ≥65 years¶ and the increase in adults with arthritis (an estimated 67 million by 2030) (6) demonstrate the need for increasing fall prevention efforts.
Public health approaches to prevent falls among older adults have focused on modifying fall risk factors (e.g., muscle weakness in the legs, gait and balance problems, psychoactive medication use, poor vision, and environmental hazards such as slippery surfaces or tripping hazards), in addition to iden-tifying and treating the symptoms of chronic conditions that increase fall risk, such as arthritis.** Public health approaches to preventing poor outcomes among adults with arthritis have focused on evidence-based self-management education and physical activity interventions†† that have been proven to reduce pain and improve function by correcting muscle weakness and balance dysfunction. Combining arthritis exer-cise programs with proven fall prevention intervention might reduce the risk for falls in this at-risk population.
Effective fall prevention interventions can be multifaceted, but the most effective single strategy involves exercise or physical therapy to improve gait, balance, and lower body strength, which have been shown to reduce fall risk by 14%–37% (7). For an exercise program to be effective in reducing falls it must 1) focus on improving balance, 2) become progressively more challenging, and 3) involve at least 50 hours of practice (e.g., a 1-hour Tai Chi class taken twice a week for 25 weeks) (8). As a form of exercise, Tai Chi is an effective fall prevention intervention§§ that has also been shown to improve neuromuscular function (9). However, the effects of Tai Chi intervention programs on arthritis-specific outcomes are still being evaluated; therefore, Tai Chi is not currently endorsed
¶ Additional information available at https://www.census.gov/prod/2010pubs/p25-1138.pdf.
** Additional information available at http://www.americangeriatrics.org/health_care_professionals/clinical_practice/clinical_guidelines_ recommendations/2010.
†† Additional information available at http://www.cdc.gov/arthritis/interventions/marketing-support/compendium/docs/pdf/compendium-2012.pdf.
§§ Add i t i ona l i n fo rma t ion ava i l ab l e a t h t tp : / /www.cdc . gov /homeandrecreationalsafety/falls/preventfalls.html#compendium.
Morbidity and Mortality Weekly Report
MMWR / May 2, 2014 / Vol. 63 / No. 17 381
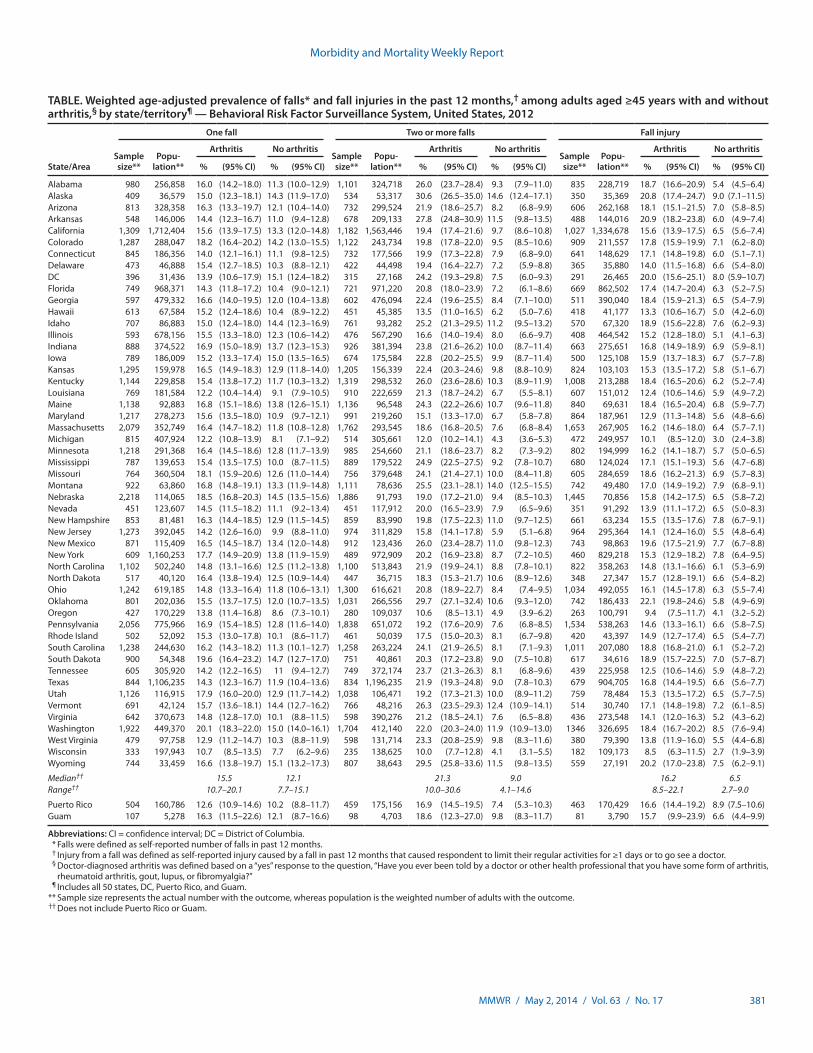
TABLE. Weighted age-adjusted prevalence of falls* and fall injuries in the past 12 months,† among adults aged ≥45 years with and without arthritis,§ by state/territory¶ — Behavioral Risk Factor Surveillance System, United States, 2012
State/Area
One fall Two or more falls Fall injury
Sample size**
Popu- lation**
Arthritis No arthritisSample size**
Popu- lation**
Arthritis No arthritisSample size**
Popu- lation**
Arthritis No arthritis
% (95% CI) % (95% CI) % (95% CI) % (95% CI) % (95% CI) % (95% CI)
Alabama 980 256,858 16.0 (14.2–18.0) 11.3 (10.0–12.9) 1,101 324,718 26.0 (23.7–28.4) 9.3 (7.9–11.0) 835 228,719 18.7 (16.6–20.9) 5.4 (4.5–6.4)Alaska 409 36,579 15.0 (12.3–18.1) 14.3 (11.9–17.0) 534 53,317 30.6 (26.5–35.0) 14.6 (12.4–17.1) 350 35,369 20.8 (17.4–24.7) 9.0 (7.1–11.5)Arizona 813 328,358 16.3 (13.3–19.7) 12.1 (10.4–14.0) 732 299,524 21.9 (18.6–25.7) 8.2 (6.8–9.9) 606 262,168 18.1 (15.1–21.5) 7.0 (5.8–8.5)Arkansas 548 146,006 14.4 (12.3–16.7) 11.0 (9.4–12.8) 678 209,133 27.8 (24.8–30.9) 11.5 (9.8–13.5) 488 144,016 20.9 (18.2–23.8) 6.0 (4.9–7.4)California 1,309 1,712,404 15.6 (13.9–17.5) 13.3 (12.0–14.8) 1,182 1,563,446 19.4 (17.4–21.6) 9.7 (8.6–10.8) 1,027 1,334,678 15.6 (13.9–17.5) 6.5 (5.6–7.4)Colorado 1,287 288,047 18.2 (16.4–20.2) 14.2 (13.0–15.5) 1,122 243,734 19.8 (17.8–22.0) 9.5 (8.5–10.6) 909 211,557 17.8 (15.9–19.9) 7.1 (6.2–8.0)Connecticut 845 186,356 14.0 (12.1–16.1) 11.1 (9.8–12.5) 732 177,566 19.9 (17.3–22.8) 7.9 (6.8–9.0) 641 148,629 17.1 (14.8–19.8) 6.0 (5.1–7.1)Delaware 473 46,888 15.4 (12.7–18.5) 10.3 (8.8–12.1) 422 44,498 19.4 (16.4–22.7) 7.2 (5.9–8.8) 365 35,880 14.0 (11.5–16.8) 6.6 (5.4–8.0)DC 396 31,436 13.9 (10.6–17.9) 15.1 (12.4–18.2) 315 27,168 24.2 (19.3–29.8) 7.5 (6.0–9.3) 291 26,465 20.0 (15.6–25.1) 8.0 (5.9–10.7)Florida 749 968,371 14.3 (11.8–17.2) 10.4 (9.0–12.1) 721 971,220 20.8 (18.0–23.9) 7.2 (6.1–8.6) 669 862,502 17.4 (14.7–20.4) 6.3 (5.2–7.5)Georgia 597 479,332 16.6 (14.0–19.5) 12.0 (10.4–13.8) 602 476,094 22.4 (19.6–25.5) 8.4 (7.1–10.0) 511 390,040 18.4 (15.9–21.3) 6.5 (5.4–7.9)Hawaii 613 67,584 15.2 (12.4–18.6) 10.4 (8.9–12.2) 451 45,385 13.5 (11.0–16.5) 6.2 (5.0–7.6) 418 41,177 13.3 (10.6–16.7) 5.0 (4.2–6.0)Idaho 707 86,883 15.0 (12.4–18.0) 14.4 (12.3–16.9) 761 93,282 25.2 (21.3–29.5) 11.2 (9.5–13.2) 570 67,320 18.9 (15.6–22.8) 7.6 (6.2–9.3)Illinois 593 678,156 15.5 (13.3–18.0) 12.3 (10.6–14.2) 476 567,290 16.6 (14.0–19.4) 8.0 (6.6–9.7) 408 464,542 15.2 (12.8–18.0) 5.1 (4.1–6.3)Indiana 888 374,522 16.9 (15.0–18.9) 13.7 (12.3–15.3) 926 381,394 23.8 (21.6–26.2) 10.0 (8.7–11.4) 663 275,651 16.8 (14.9–18.9) 6.9 (5.9–8.1)Iowa 789 186,009 15.2 (13.3–17.4) 15.0 (13.5–16.5) 674 175,584 22.8 (20.2–25.5) 9.9 (8.7–11.4) 500 125,108 15.9 (13.7–18.3) 6.7 (5.7–7.8)Kansas 1,295 159,978 16.5 (14.9–18.3) 12.9 (11.8–14.0) 1,205 156,339 22.4 (20.3–24.6) 9.8 (8.8–10.9) 824 103,103 15.3 (13.5–17.2) 5.8 (5.1–6.7)Kentucky 1,144 229,858 15.4 (13.8–17.2) 11.7 (10.3–13.2) 1,319 298,532 26.0 (23.6–28.6) 10.3 (8.9–11.9) 1,008 213,288 18.4 (16.5–20.6) 6.2 (5.2–7.4)Louisiana 769 181,584 12.2 (10.4–14.4) 9.1 (7.9–10.5) 910 222,659 21.3 (18.7–24.2) 6.7 (5.5–8.1) 607 151,012 12.4 (10.6–14.6) 5.9 (4.9–7.2)Maine 1,138 92,883 16.8 (15.1–18.6) 13.8 (12.6–15.1) 1,136 96,548 24.3 (22.2–26.6) 10.7 (9.6–11.8) 840 69,631 18.4 (16.5–20.4) 6.8 (5.9–7.7)Maryland 1,217 278,273 15.6 (13.5–18.0) 10.9 (9.7–12.1) 991 219,260 15.1 (13.3–17.0) 6.7 (5.8–7.8) 864 187,961 12.9 (11.3–14.8) 5.6 (4.8–6.6)Massachusetts 2,079 352,749 16.4 (14.7–18.2) 11.8 (10.8–12.8) 1,762 293,545 18.6 (16.8–20.5) 7.6 (6.8–8.4) 1,653 267,905 16.2 (14.6–18.0) 6.4 (5.7–7.1)Michigan 815 407,924 12.2 (10.8–13.9) 8.1 (7.1–9.2) 514 305,661 12.0 (10.2–14.1) 4.3 (3.6–5.3) 472 249,957 10.1 (8.5–12.0) 3.0 (2.4–3.8)Minnesota 1,218 291,368 16.4 (14.5–18.6) 12.8 (11.7–13.9) 985 254,660 21.1 (18.6–23.7) 8.2 (7.3–9.2) 802 194,999 16.2 (14.1–18.7) 5.7 (5.0–6.5)Mississippi 787 139,653 15.4 (13.5–17.5) 10.0 (8.7–11.5) 889 179,522 24.9 (22.5–27.5) 9.2 (7.8–10.7) 680 124,024 17.1 (15.1–19.3) 5.6 (4.7–6.8)Missouri 764 360,504 18.1 (15.9–20.6) 12.6 (11.0–14.4) 756 379,648 24.1 (21.4–27.1) 10.0 (8.4–11.8) 605 284,659 18.6 (16.2–21.3) 6.9 (5.7–8.3)Montana 922 63,860 16.8 (14.8–19.1) 13.3 (11.9–14.8) 1,111 78,636 25.5 (23.1–28.1) 14.0 (12.5–15.5) 742 49,480 17.0 (14.9–19.2) 7.9 (6.8–9.1)Nebraska 2,218 114,065 18.5 (16.8–20.3) 14.5 (13.5–15.6) 1,886 91,793 19.0 (17.2–21.0) 9.4 (8.5–10.3) 1,445 70,856 15.8 (14.2–17.5) 6.5 (5.8–7.2)Nevada 451 123,607 14.5 (11.5–18.2) 11.1 (9.2–13.4) 451 117,912 20.0 (16.5–23.9) 7.9 (6.5–9.6) 351 91,292 13.9 (11.1–17.2) 6.5 (5.0–8.3)New Hampshire 853 81,481 16.3 (14.4–18.5) 12.9 (11.5–14.5) 859 83,990 19.8 (17.5–22.3) 11.0 (9.7–12.5) 661 63,234 15.5 (13.5–17.6) 7.8 (6.7–9.1)New Jersey 1,273 392,045 14.2 (12.6–16.0) 9.9 (8.8–11.0) 974 311,829 15.8 (14.1–17.8) 5.9 (5.1–6.8) 964 295,364 14.1 (12.4–16.0) 5.5 (4.8–6.4)New Mexico 871 115,409 16.5 (14.5–18.7) 13.4 (12.0–14.8) 912 123,436 26.0 (23.4–28.7) 11.0 (9.8–12.3) 743 98,863 19.6 (17.5–21.9) 7.7 (6.7–8.8)New York 609 1,160,253 17.7 (14.9–20.9) 13.8 (11.9–15.9) 489 972,909 20.2 (16.9–23.8) 8.7 (7.2–10.5) 460 829,218 15.3 (12.9–18.2) 7.8 (6.4–9.5)North Carolina 1,102 502,240 14.8 (13.1–16.6) 12.5 (11.2–13.8) 1,100 513,843 21.9 (19.9–24.1) 8.8 (7.8–10.1) 822 358,263 14.8 (13.1–16.6) 6.1 (5.3–6.9)North Dakota 517 40,120 16.4 (13.8–19.4) 12.5 (10.9–14.4) 447 36,715 18.3 (15.3–21.7) 10.6 (8.9–12.6) 348 27,347 15.7 (12.8–19.1) 6.6 (5.4–8.2)Ohio 1,242 619,185 14.8 (13.3–16.4) 11.8 (10.6–13.1) 1,300 616,621 20.8 (18.9–22.7) 8.4 (7.4–9.5) 1,034 492,055 16.1 (14.5–17.8) 6.3 (5.5–7.4)Oklahoma 801 202,036 15.5 (13.7–17.5) 12.0 (10.7–13.5) 1,031 266,556 29.7 (27.1–32.4) 10.6 (9.3–12.0) 742 186,433 22.1 (19.8–24.6) 5.8 (4.9–6.9)Oregon 427 170,229 13.8 (11.4–16.8) 8.6 (7.3–10.1) 280 109,037 10.6 (8.5–13.1) 4.9 (3.9–6.2) 263 100,791 9.4 (7.5–11.7) 4.1 (3.2–5.2)Pennsylvania 2,056 775,966 16.9 (15.4–18.5) 12.8 (11.6–14.0) 1,838 651,072 19.2 (17.6–20.9) 7.6 (6.8–8.5) 1,534 538,263 14.6 (13.3–16.1) 6.6 (5.8–7.5)Rhode Island 502 52,092 15.3 (13.0–17.8) 10.1 (8.6–11.7) 461 50,039 17.5 (15.0–20.3) 8.1 (6.7–9.8) 420 43,397 14.9 (12.7–17.4) 6.5 (5.4–7.7)South Carolina 1,238 244,630 16.2 (14.3–18.2) 11.3 (10.1–12.7) 1,258 263,224 24.1 (21.9–26.5) 8.1 (7.1–9.3) 1,011 207,080 18.8 (16.8–21.0) 6.1 (5.2–7.2)South Dakota 900 54,348 19.6 (16.4–23.2) 14.7 (12.7–17.0) 751 40,861 20.3 (17.2–23.8) 9.0 (7.5–10.8) 617 34,616 18.9 (15.7–22.5) 7.0 (5.7–8.7)Tennessee 605 305,920 14.2 (12.2–16.5) 11 (9.4–12.7) 749 372,174 23.7 (21.3–26.3) 8.1 (6.8–9.6) 439 225,958 12.5 (10.6–14.6) 5.9 (4.8–7.2)Texas 844 1,106,235 14.3 (12.3–16.7) 11.9 (10.4–13.6) 834 1,196,235 21.9 (19.3–24.8) 9.0 (7.8–10.3) 679 904,705 16.8 (14.4–19.5) 6.6 (5.6–7.7)Utah 1,126 116,915 17.9 (16.0–20.0) 12.9 (11.7–14.2) 1,038 106,471 19.2 (17.3–21.3) 10.0 (8.9–11.2) 759 78,484 15.3 (13.5–17.2) 6.5 (5.7–7.5)Vermont 691 42,124 15.7 (13.6–18.1) 14.4 (12.7–16.2) 766 48,216 26.3 (23.5–29.3) 12.4 (10.9–14.1) 514 30,740 17.1 (14.8–19.8) 7.2 (6.1–8.5)Virginia 642 370,673 14.8 (12.8–17.0) 10.1 (8.8–11.5) 598 390,276 21.2 (18.5–24.1) 7.6 (6.5–8.8) 436 273,548 14.1 (12.0–16.3) 5.2 (4.3–6.2)Washington 1,922 449,370 20.1 (18.3–22.0) 15.0 (14.0–16.1) 1,704 412,140 22.0 (20.3–24.0) 11.9 (10.9–13.0) 1346 326,695 18.4 (16.7–20.2) 8.5 (7.6–9.4)West Virginia 479 97,758 12.9 (11.2–14.7) 10.3 (8.8–11.9) 598 131,714 23.3 (20.8–25.9) 9.8 (8.3–11.6) 380 79,390 13.8 (11.9–16.0) 5.5 (4.4–6.8)Wisconsin 333 197,943 10.7 (8.5–13.5) 7.7 (6.2–9.6) 235 138,625 10.0 (7.7–12.8) 4.1 (3.1–5.5) 182 109,173 8.5 (6.3–11.5) 2.7 (1.9–3.9)Wyoming 744 33,459 16.6 (13.8–19.7) 15.1 (13.2–17.3) 807 38,643 29.5 (25.8–33.6) 11.5 (9.8–13.5) 559 27,191 20.2 (17.0–23.8) 7.5 (6.2–9.1)
Median†† 15.5 12.1 21.3 9.0 16.2 6.5Range†† 10.7–20.1 7.7–15.1 10.0–30.6 4.1–14.6 8.5–22.1 2.7–9.0
Puerto Rico 504 160,786 12.6 (10.9–14.6) 10.2 (8.8–11.7) 459 175,156 16.9 (14.5–19.5) 7.4 (5.3–10.3) 463 170,429 16.6 (14.4–19.2) 8.9 (7.5–10.6)Guam 107 5,278 16.3 (11.5–22.6) 12.1 (8.7–16.6) 98 4,703 18.6 (12.3–27.0) 9.8 (8.3–11.7) 81 3,790 15.7 (9.9–23.9) 6.6 (4.4–9.9)
Abbreviations: CI = confidence interval; DC = District of Columbia. * Falls were defined as self-reported number of falls in past 12 months. † Injury from a fall was defined as self-reported injury caused by a fall in past 12 months that caused respondent to limit their regular activities for ≥1 days or to go see a doctor. § Doctor-diagnosed arthritis was defined based on a “yes” response to the question, “Have you ever been told by a doctor or other health professional that you have some form of arthritis,
rheumatoid arthritis, gout, lupus, or fibromyalgia?” ¶ Includes all 50 states, DC, Puerto Rico, and Guam. ** Sample size represents the actual number with the outcome, whereas population is the weighted number of adults with the outcome. †† Does not include Puerto Rico or Guam.

Morbidity and Mortality Weekly Report
382 MMWR / May 2, 2014 / Vol. 63 / No. 17
for use by the 12 CDC-funded state arthritis programs that disseminate arthritis-appropriate, evidence-based intervention programs for use in local communities. Existing arthritis physical activity interventions, especially EnhanceFitness and Fit and Strong¶¶ might reduce the risk for falls and fall injuries but have not yet been evaluated for these outcomes.
The findings in this report are subject to at least four limita-tions. First, data in BRFSS are based on self-report; therefore, arthritis status, falls, and a fall injury might be misclassified. The case-finding question used in BRFSS to assess arthritis status has been judged to be sufficiently sensitive and specific for public health surveillance purposes among those aged ≥65 years, but it is less sensitive for those aged <65 years than is desirable (10); however, recall bias might contribute to an underestimate of self-reported falls. Conversely, the broad definition of a fall injury might have led participants to report minor falls as injurious, resulting in an overestimate. Second, because BRFSS is a cross-sectional survey, the tem-poral sequence of arthritis and falls could not be established. Nonetheless, a meta-analysis of seven longitudinal studies showed that persons with arthritis have more than a two-fold increased risk for falls (2). Third, no BRFSS questions assess the severity, location, or type of arthritis, which might affect falls and fall injuries differently. Finally, the 2012 median survey response rate for all states and DC was 45.2% and ranged from
27.7% to 60.4%; lower response rates can result in nonresponse bias, although the application of sampling weights is expected to reduce nonresponse bias.
The number of adults with arthritis is expected to increase steadily through at least 2030 (6), putting more adults at higher risk for falls and fall injuries. Efforts to address this growing public health problem require raising awareness about the link between arthritis and falls, evaluating evidence-based arthritis interventions for their effects on falls, and implementing fall prevention programs more widely through changes in clinical and community practice. 1Division of Population Health, National Center for Chronic Disease Prevention
and Health Promotion, CDC; 2Division of Unintentional Injury Prevention; National Center for Injury Prevention and Control, CDC; 3Department of Occupational Therapy, University of Pittsburgh (Corresponding author: Kamil E. Barbour, [email protected], 770-488-5145)
References1. Stevens JA, Corso PS, Finkelstein EA, Miller TR. The costs of fatal and
non-fatal falls among older adults. Inj Prev 2006;12:290–5.2. Rubenstein LZ, Josephson KR. Falls and their prevention in elderly people:
what does the evidence show? Med Clin North Am 2006;90:807–24.3. Talbot LA, Musiol RJ, Witham EK, Metter EJ. Falls in young, middle-
aged and older community dwelling adults: perceived cause, environmental factors and injury. BMC Public Health 2005;5:86.
4. CDC. Prevalence of doctor-diagnosed arthritis and arthritis-attributable activity limitation—United States, 2010–2012. MMWR 2013; 62:869–73.
5. CDC. Prevalence and most common causes of disability among adults—United States, 2005. MMWR 2009;58:421–6.
What is already known on this topic?
In the United States, arthritis, falls, and fall injuries are highly prevalent conditions among middle-aged (aged 45–64 years) and older (aged ≥65 years) adults. Falls are the leading cause of injury-related morbidity and mortality among older adults; meanwhile, arthritis remains the most common cause of disability.
What is added by this report?
During 2012, for all 50 states and the District of Columbia, the prevalence of any fall (one or more), two or more falls, and fall injuries in the past 12 months was significantly higher among adults with arthritis compared with those without arthritis. Moreover, among adults with arthritis, the age-adjusted median prevalences of one fall, any fall, two or more falls, and fall injuries were 28% , 79%, 137%, and 149% higher, respectively, compared with adults without arthritis.
What are the implications for public health practice?
The burden of falls and fall injuries is high among adults with arthritis but can be addressed through greater dissemination of arthritis management and fall prevention programs in clinical and community practice.
¶¶ Additional information available at http://www.cdc.gov/arthritis/interventions/marketing-support/compendium/docs/pdf/compendium-2012.pdf.
FIGURE. Age-standardized prevalence of having one or more falls in the past 12 months among adults aged ≥45 years with arthritis — Behavioral Risk Factor Surveillance System, United States, 2012
≥40%35% to 40%30% to 35%25% to 30%<25%
DC

Morbidity and Mortality Weekly Report
MMWR / May 2, 2014 / Vol. 63 / No. 17 383
6. Hootman JM, Helmick CG. Projections of US prevalence of arthritis and associated activity limitations. Arthritis Rheum 2006;54:226–9.
7. Gillespie LD, Robertson MC, Gillespie WJ, et al. Interventions for preventing falls in older people living in the community. Cochrane Database Syst Rev 2009;2(CD007146).
8. Sherrington C, Tiedemann A, Fairhall N, Close JC, Lord SR. Exercise to prevent falls in older adults: an updated meta-analysis and best practice recommendations. N S W Public Health Bull 2011;22:78–83.
9. Jahnke R, Larkey L, Rogers C, Etnier J, Lin F. A comprehensive review of health benefits of qigong and tai chi. Am J Health Promot 2010;24:e1–25.
10. Sacks JJ, Harrold LR, Helmick CG, Gurwitz JH, Emani S, Yood RA. Validation of a surveillance case definition for arthritis. J Rheumatol 2005;32:340–7.

Morbidity and Mortality Weekly Report
384 MMWR / May 2, 2014 / Vol. 63 / No. 17
Investigation of Infectious Disease Risks Associated With a Nontransplant Anatomical Donation Center — Arizona, 2014Marie A. de Perio, MD1, Bruce P. Bernard, MD1, Lisa J. Delaney,
MS1, Nicki Pesik, MD2, Nicole J. Cohen, MD2
(Author affiliations at end of text)
On April 25, 2014, this report was posted as an MMWR Early Release on the MMWR website (http://www.cdc.gov/mmwr).
CDC is investigating reports of potential occupational exposure to human immunodeficiency virus (HIV), hepatitis B virus (HBV), hepatitis C virus (HCV), and Mycobacterium tuberculosis among workers performing preparation and dissection procedures on human nontransplant anatomical materials at a nontransplant anatomical donation center in Arizona. CDC is working with Arizona public health officials to inform persons exposed to these potentially infected mate-rials. Nontransplant anatomical centers around the United States process thousands of donated cadavers annually. These materials (which might be fresh, frozen, or chemically pre-served) are used by universities and surgical instrument and pharmaceutical companies for medical education and research. The American Association of Tissue Banks has developed accreditation policies for nontransplant anatomical donation organizations (1). It also has written standards (1) that specify exclusion criteria for donor material, as well as use of proper environmental controls and safe work practices to prevent transmission of infectious agents during receipt and handling of nontransplant anatomical materials. At the center under investigation, which is now closed, these standards might not have been consistently implemented.
CDC has assisted Arizona public health officials in notifying former workers at the center regarding potential exposure to HIV, HBV, and HCV, and M. tuberculosis while preparing non-transplant anatomical materials. Bloodborne pathogens (e.g., HIV, HBV, and HCV) can be transmitted when blood or other potentially infectious materials contact mucous membranes, such as the eyes, mouth, or nonintact skin, or when they enter the body through a percutaneous injury such as a needlestick or scalpel wound. M. tuberculosis can be transmitted by infec-tious aerosols generated by manipulation of infectious tissues.
Arizona public health officials have offered former workers at the center cost-free testing for HIV, HBV, and HCV, and
M. tuberculosis infection as well as counseling regarding these infections. End users of nontransplant anatomical materials for medical training or research purposes are thought to be at considerably lower risk for infection because of the reduced survival and infectivity of these organisms over time, and are being notified separately where possible. Waste treatment, stor-age, and transportation workers handling containers or packaged nontransplant anatomical materials would not directly contact these materials during regular work and are not considered to be at risk unless there is a spill of infectious material. If a spill were to occur, proper disinfection procedures, determination of employee exposure, and worker follow-up with an assessment of transmission risk should take place, per facility protocols and the Bloodborne Pathogens Standard of the Occupational Safety and Health Administration (OSHA) (2). There are no known risks to the general public, and these activities are unrelated to organs or tissues recovered for transplantation in human recipients.
Employers and employees in the nontransplant anatomical donation industry and end users should recognize that cadav-ers and nontransplant anatomical materials are considered potentially infectious with M. tuberculosis and other pathogens, even if they are known to test negative for HIV, HBV, and HCV. Employers must comply with the OSHA Bloodborne Pathogens Standard, which requires a written exposure control plan, use of engineering and work practice controls, appropriate personal protective equipment, and provision of hepatitis B vaccine to employees assigned to jobs with occupational expo-sure risk (2). CDC’s Guidelines for Safe Work Practices in Human and Animal Medical Diagnostic Laboratories (3) and the Standards for Non-Transplant Anatomical Donation have been published (1). When transported, these materials should be packaged and labeled in accordance with all applicable regu-lations. Should a spill or damage to a package of nontransplant anatomical materials occur, procedures, such as those found in the U.S. Postal Service, Handbook EL–812, Hazardous Materials and Spill Response (4) and U.S. Department of Transportation Hazardous Materials Regulations (5) should be followed. 1National Institute for Occupational Safety and Health, CDC; 2National Center
for Emerging and Zoonotic Infectious Diseases, CDC (Corresponding author: Marie de Perio, MD, [email protected], 513-841-4116).
Notes from the Field

Morbidity and Mortality Weekly Report
MMWR / May 2, 2014 / Vol. 63 / No. 17 385
References1. American Association of Tissue Banks. Standards for non-transplant
anatomical donation for education and/or research. First edition. McLean, VA: American Association of Tissue Banks; 2011.
2. Occupational Safety and Health Administration. Bloodborne pathogens standard (29 CFR Part 1910.1030). Washington, DC: US Department of Labor, Occupational Safety and Health Administration. Ava i lab le a t ht tps : / /www.osha .gov/p l s /oshaweb/owadisp.show_document?p_id=10051&p_table=STANDARDS.
3. CDC. Guidelines for safe work practices in human and animal medical diagnostic laboratories: recommendations of a CDC-convened, biosafety blue ribbon panel. MMWR 2012;61(Suppl 1).
4. US Postal Service. Handbook EL–812. Hazardous materials and spill response: general guidelines. Washington, DC: US Postal Service. Available at http://pe.usps.com/text/pub52/pub52c2_019.htm.
5. Department of Transportation. Hazardous materials regulations. 49CFR171-180. Washington, DC: Department of Transportation. Available at http://www.ecfr.gov/cgi-bin/text-idx?tpl=/ecfrbrowse/Title49/49cfrv2_02.tpl.

Morbidity and Mortality Weekly Report
386 MMWR / May 2, 2014 / Vol. 63 / No. 17
Announcements
National High Blood Pressure Education Month — May 2014
May is National High Blood Pressure Education Month. High blood pressure, also known as hypertension, is the lead-ing risk factor for stroke and a major cause of morbidity and mortality (1). In the United States, nearly one in three adults has hypertension, but only about half (47%) of those have it under control (1). Hypertension is considered the “silent killer” because it can damage the heart, brain, and kidneys without any symptoms (1). Each day in the United States, nearly 1,000 deaths are associated with hypertension (2). National High Blood Pressure Education Month aims to save lives by increas-ing awareness and educating the public about cardiovascular risks and how to prevent them.
To control hypertension, patients can take medications as directed, measure their blood pressure, and eat a lower-sodium diet and more fruits and vegetables (1). Health-care providers can use electronic health records, blood pressure monitoring, and a team-based care approach to help improve their patients’ hypertension control (3).
CDC’s Division for Heart Disease and Stroke Prevention focuses on promoting cardiovascular health and improving quality of care for all and eliminating disparities associated with heart disease and stroke. Additional information is avail-able at http://www.cdc.gov/bloodpressure and http://www.cdc.gov/stroke.
References1. CDC. Vital signs: awareness and treatment of uncontrolled hypertension
among adults—United States, 2003–2010. MMWR 2012;61:703–9.2. Kochanek KD, Xu JQ, Murphy SL, Miniño AM, Kung HC. Deaths:
final data for 2009. Nat Vital Stat Rep 2011;60(3).3. Go AS, Mozaffarian D, Roger VL, et al. Heart disease and stroke
statistics—2014 update: a report from the American Heart Association. Circulation. 2014;128:e28–e292.
Older Americans Month — May 2014Each May, the nation celebrates Older Americans Month
to recognize older persons for their contributions and pro-vide information to help them stay healthy and active. This year’s focus is injury prevention, with the theme “Safe Today. Healthy Tomorrow.”
Injuries and violence are serious threats to the health of persons aged ≥65 years. Unintentional injuries among this population result in approximately 48,550 deaths annually (1). Falls are the leading cause of fatal and nonfatal injuries among older adults (2). About a third of those aged ≥65 years fall each year, resulting in costs of nearly $30 billion annually (1). Older adults are also at higher risk for traumatic brain injury and injuries associated with residential fires, abuse and maltreatment, and suicide (3).
To improve older adult health, CDC works to reduce risk factors for injuries and ensure widespread adoption of effec-tive injury prevention strategies. Information on fire safety and interventions to prevent falls among older adults, for example, can be found at http://www.cdc.gov/homeandrecre-ationalsafety. Information and resources (including posters and sample articles) about Older Americans Month are available at http://www.acl.gov/newsroom/observances/oam/index.aspx.
References1. Finkelstein EA, Corso PS, Miller TR. The incidence and economic
burden of injuries in the United States. New York, NY: Oxford University Press; 2006.
2. CDC. Web-Based Injury Statistics Query and Reporting System (WISQARS). Atlanta, GA: US Department of Health and Human Services, CDC; 2014. Available at http://www.cdc.gov/ncipc/wisqars.
3. CDC. Violence prevention. Atlanta, GA: US Department of Health and Human Services, CDC; 2014. Available at http://www.cdc.gov/violenceprevention.
Morbidity and Mortality Weekly Report
MMWR / May 2, 2014 / Vol. 63 / No. 17 387
Announcements
ALS Awareness Month — May 2014May is Amyotrophic Lateral Sclerosis (ALS) Awareness
Month. ALS, also known as Lou Gehrig’s disease, is a progres-sive, fatal, neurodegenerative disorder of the upper and lower motor neurons. The etiology of ALS is not well understood, and currently there is no cure. Persons with ALS usually die within 2–5 years of diagnosis.
In October 2010, the Agency for Toxic Substances and Disease Registry (ATSDR) launched the National ALS Registry (http://www.cdc.gov/als) to collect and analyze data regarding persons with ALS in the United States. The goals are to determine the incidence and prevalence of ALS, characterize the demographics of those living with ALS, and examine the potential risk factors for the disease. The registry uses data from existing national databases, including the Centers for Medicare and Medicaid Services and the U.S. Department of Veterans Affairs, as well as information provided by persons
with ALS through the secure online web portal. Registrants can also take brief online surveys regarding potential risk factors for the disease.
ATSDR is collaborating with the ALS Association (http://www.alsa.org), Muscular Dystrophy Association (http://www.als-mda.org), Les Turner Foundation (http://www.lesturnerals.org), and other organizations to make all persons with ALS and their families aware of the oppor-tunity to register in the National ALS Registry. Additional features have been added to enhance the registry for patients and researchers, including state and metropolitan area–based ALS surveillance to assist in evaluating the completeness of the registry, a research notification system to inform persons with ALS about new research studies, a biorepository study to evaluate the feasibility of collecting biospecimens from enrollees, and mobile apps to help find the nearest ALS clinics and support groups.
Morbidity and Mortality Weekly Report
388 MMWR / May 2, 2014 / Vol. 63 / No. 17
Erratum
Vol. 63, No. 14In the report, “Measles Outbreak Associated with
Adopted Children from China — Missouri, Minnesota, and Washington, July 2013,” an error occurred on page 302 in the fifth sentence of the second paragraph of the right column. The sentence should reads as follows: “He arrived in the United States on July 4, developed a fever on July 10, rash on July 14, and tested PCR-positive for measles on July 16.”

Morbidity and Mortality Weekly Report
MMWR / May 2, 2014 / Vol. 63 / No. 17 389
* Based on responses to the question, “During the past 6 months, was [child’s name] prescribed medication or taking medication for difficulties with emotions, concentration, behavior, or being able to get along with others.”
† Estimates are based on household interviews of a sample of the noninstitutionalized, civilian U.S. population and are derived from the National Health Interview Survey sample child component.
§ 95% confidence interval.
During 2011–2012, among children aged 6–17 years, 7.5% overall had been prescribed medication for emotional or behavioral difficulties during the preceding 6 months. By U.S. Census region, the percentages were 9.3% in the South, 8.0% in the Midwest, 6.3% in the Northeast, and 5.0% in the West.
Source: National Health Interview Survey, 2011–2012. Available at http://www.cdc.gov/nchs/nhis.htm.
Reported by: LaJeana D. Howie, MPH, [email protected], 301-458-4611; Patricia N. Pastor, PhD; Susan L. Lukacs, DO.
QuickStats
FROM THE NATIONAL CENTER FOR HEALTH STATISTICS
Percentage of Children Aged 6–17 Years Prescribed Medication During the Preceding 6 Months for Emotional or Behavioral Difficulties,* by Census Region — National Health Interview Survey,† United States, 2011–2012
SouthMidwestNortheastWestOverall
12
10
8
6
4
2
0
Perc
enta
ge
U.S. Census region
§


U.S. Government Printing Office: 2014-723-032/01055 Region IV ISSN: 0149-2195
Morbidity and Mortality Weekly Report
The Morbidity and Mortality Weekly Report (MMWR) Series is prepared by the Centers for Disease Control and Prevention (CDC) and is available free of charge in electronic format. To receive an electronic copy each week, visit MMWR’s free subscription page at http://www.cdc.gov/mmwr/mmwrsubscribe.html. Paper copy subscriptions are available through the Superintendent of Documents, U.S. Government Printing Office, Washington, DC 20402; telephone 202-512-1800.
Data presented by the Notifiable Disease Data Team and 122 Cities Mortality Data Team in the weekly MMWR are provisional, based on weekly reports to CDC by state health departments. Address all inquiries about the MMWR Series, including material to be considered for publication, to Editor, MMWR Series, Mailstop E-90, CDC, 1600 Clifton Rd., N.E., Atlanta, GA 30329-4027 or to [email protected].
All material in the MMWR Series is in the public domain and may be used and reprinted without permission; citation as to source, however, is appreciated.
Use of trade names and commercial sources is for identification only and does not imply endorsement by the U.S. Department of Health and Human Services.
References to non-CDC sites on the Internet are provided as a service to MMWR readers and do not constitute or imply endorsement of these organizations or their programs by CDC or the U.S. Department of Health and Human Services. CDC is not responsible for the content of these sites. URL addresses listed in MMWR were current as of the date of publication.