potential positive mri contrast agent based on pvp-grafted
TRANSCRIPT

Nanomed. J. 6(3):214-222, Summer 2019
RESEARCH PAPER
Potential positive MRI contrast agent based on PVP-grafted superparamagnetic iron oxide nanoparticles with various
repetition times Mahmood Nazarpoor 1, Hassan Fattahi 2*
1Department of Medical Physics, Faculty of Medicine, Tehran Medical Sciences, Islamic Azad University, Tehran, Iran
2Composite Research Center, Department of Materials and Manufacturing Technologies, Malek Ashtar University of Technology, Tehran, Iran
* Corresponding Author Email: [email protected]. This manuscript was submitted on February 15, 2019;approved on May 29, 2019
How to cite this articleNazarpoor M, Fattahi H. Potential positive MRI contrast agent based on PVP-grafted superparamagnetic iron oxide nanoparticles with various repetition times. Nanomed J. 2019; 6(3):214-222. DOI: 10.22038/nmj.2019.06.00008
ABSTRACTObjective(s): The present study aimed to evaluate the capability of synthesized and modified superparamagnetic iron oxide nanoparticles (SPIONs) as the positive contrast agent in magnetic resonance imaging (MRI) by investigating the effect of repetition time (TR) on the MRI signal intensity. Materials and Methods: SPIONs were synthesized using the co-precipitation method, and their surface was successfully modified with biocompatible poly (N-vinylpyrrolidone) (PVP). The effect of TR on the signal intensity (SI) of the PVP-grafted SPIONs was assessed in the spin-echo T1-weighted MRI images. Results: The results indicated the maximum SI at the concentration of 400 µmol Fe/l with the TR of 800-2,200 milliseconds. Moreover, the maximum SI was observed at the concentration of 75 µmol Fe/l, where TR was within the range of 2,900-6,400 milliseconds. Conclusion: According to the results, in addition to their capability as negative MRI contrast agents, PVP-grafted SPIONs could be preferred positive contrast agents with specific imaging parameters and have the potential application for early cancer diagnosis and perfusion measurements.
Keywords: Contrast Agent, MRI, SPIONs, Repetition Time,Signal Intensity
INTRODUCTIONOwing to their noninvasiveness and capability
in producing images with high spatial and temporal resolution, magnetic resonance imaging (MRI) plays a pivotal role in clinical diagnosis and molecular imaging [1-3]. Despite the advantages of MRI and its intrinsic contrast offering higher flexibility than other clinical imaging techniques, there are still challenges in accurate diagnosis by MRI. Contrast agents are often used in MRI scans in order to improve their sensitivity and diagnostic accuracy [4, 5].
Paramagnetic metal ions (e.g., Gd3+ and Mn2+) have a relatively high number of unpaired electrons and are used as positive contrast agents. Although these metal ions are chelated with biocompatible chelates to avoid high toxicity and
adverse biodistribution, some chelates are less stable and could be dissociated in the body [6-8]. The dissociation of Gd-based contrast agents in the body may cause adverse reactions known as nephrogenic systemic fibrosis (NSF), which could lead to severe physical disability in some cases [9, 10]. Due to the mentioned concerns regarding Gd-based contrast agents, special attention has been paid to superparamagnetic iron oxide nanoparticles (SPIONs) as MRI contrast agents [11-18].
Apart from serving as MRI contrast agents, SPIONs have various biomedical applications, such as the magnetic control of drug delivery systems [19], tumor treatment through hyperthermia [20], use as biosensors [21], and bioseparation [22]. However, the main challenges regarding the use of SPIONs for these biomedical applications are their agglomeration and biocompatibility. These challenges become more critical when
215Nanomed. J. 6(3):214-222, Summer 2019
M. Nazarpoor / Positive MRI contrast agent based on PVP-grafted SPIONs
the nanoparticle sizes are further scaled down. Therefore, surface modification on SPIONs is essential to their applications in the mentioned fields. Various polymeric [11, 12, 23, 24], organic [25], and inorganic coatings [26] are used for the surface modification and stabilization of SPIONs.
Depending on the type of interactions, two approaches are available for the modification of iron oxide nanoparticles by polymers, which are based on physical interactions and chemical bindings. These approaches are known as non-covalent and covalent methods, respectively. In the covalent approach, molecules or macromolecules are grafted onto the surface of nanoparticles via chemical linkages. This approach is considered to be highly effective since grafted macromolecules increase the stability duration in physiological media [27-30]. Among synthetic polymers, poly (N-vinylpyrrolidone) (PVP) is water-soluble, non-charged, non-toxic and used for various medical applications [27]. In this regard, we have previously prepared PVP-grafted iron oxide nanoparticle via chemical linkages, and the obtained results have confirmed their high efficiency as negative MRI contrast agents [12]. On the other hand, image parameters such as repetition time (TR), echo time (TE), and image sequences (e.g., spin echo, gradient echo, and inversion recovery sequences) could effectively enhance the signal intensity (SI) in MRI [31-35].
The present study aimed to investigate the effect of TR on the SI of PVP-grafted iron oxide nanoparticle on the spin echo T1-weighted images to assess the use of these nanoparticles as positive contrast agent in MRI.
MATERIALS AND METHODS Synthesis of PVP-grafted SPIONs
PVP-grafted SPIONs were synthesized based on our previous report via surface-initiated radical polymerization [12]. Magnetite nanoparticles were synthesized through the co-precipitation of the Fe2+ and Fe3+ ions in alkaline conditions. The concentration ratio of Fe2+/Fe3+ was 1:2, and the synthesis was carried out using argon inert gas in order to prevent the oxidation of Fe2+ to Fe3+. After the washing and purification of the nanoparticles, 3-(trimethoxysilyl)propyl methacrylate (silane A) was used as the coupling agent to introduce the reactive vinyl functional groups onto the surface of the nanoparticles. Following that, the silane A-modified Fe3O4 nanoparticles, azobis
(isobutyronitrile [AIBN] as the radical initiator), ethanol, and deionized water were placed in a flask and vibrated with argon ultrasonic to be dispersed uniformly. Afterwards, the reaction mixture was heated at the temperature of 70°C, mechanically stirred at 400 rpm with argon, and a mixture of N-vinylpyrrolidone, ethanol, and deionized water was added dropwise to the contents of the flask within one hour. Graft polymerization was performed at the temperature of 70°C for six hours, and the product was collected by magnetic separation, washed with ethanol repeatedly, and dried at the temperature of 40°C in a vacuum oven.
Characterization techniquesFourier-transform infrared (FT-IR) spectroscopy
was used for the characterization of the functional groups of SPIONs and PVP-grafted SPIONs. FT-IR was performed using a TENSOR 27 spectrometer (Bruker, Germany) and the solid potassium bromide method (resolution: 2 cm-1, scanning times: 10). In addition, transmission electron microscopy (TEM) was performed using Joel TEM-2100 (Japan) operated at 200 kV. To perform the TEM tests, the nanoparticles were deposited on a copper grid-supported, perforated transparent carbon coil. The ImageJ software was used to calculate the mean size of the nanoparticles.
The crystal structure of the nanoparticles was investigated using an X-ray diffractometer (XRD; model: Siemens D5000, Germany) and Cu (Kα) radiation (λ=1.5418 Å). Thermogravimetric analysis (TGA) was performed using TGA 951 (DuPont, USA). Dried samples (1-5 mg) were placed in the TGA furnace, and the measurements were carried out using nitrogen gas with the heating rate of 15°C/min (temperature range: 30-650ºC). The magnetic properties of the nanoparticles were assessed using a vibrating-sample magnetometer (VSM; model: LakeShore 7307, USA) at room temperature.
MRI acquisitionThe MRI experiments were performed using
a clinical MR scanner (model: GE Signa EXCITE 1.5T, USA) at the temperature of 25°C. A standard clinical head coil was used to perform MRI, and a phantom was designed to hold the vials. The phantom containing the vials was filled with various and constant concentrations of surface-modified nanoparticles and meticulously placed

216
M. Nazarpoor / Positive MRI contrast agent based on PVP-grafted SPIONs
Nanomed. J. 6(3):214-222, Summer 2019
at the center of the coil. The PVP-grafted Fe3O4 nanoparticles were
suspended in water (10-ml tubes) with various iron concentrations of zero, 25, 50, 75, 100, 200, 400, and 600 µmol Fe/l. The iron concentrations were determined by measuring the longitudinal relaxation rate (R1) [11]. In brief, the samples were mineralized through microwave digestion (MLS-1200 Mega, Milestone, Analis, Namur, Belgium), and the R1 value of the resulting solutions was recorded at 0.47 T and temperature of 37°C, which allowed the determination of the iron concentration using the following equation:
[Fe]=(R1^sample-R1^
diam)×0.0915 (1)
where (s-1) is the diamagnetic relaxation rate of water (0.36 s-1), and 0.0915 (s-1 mM-1) represents the slope of the calibration curve.
Radiofrequency (RF) coil inhomogeneity is an important factor to be considered in MRI [36]. In order to measure the non-uniformity of the coil, we used the vials containing the constant concentration of iron (200 µmol Fe/l). Additionally, two images were obtained from the vials at various and constant concentrations. Following that, the non-uniformity of the coil was calculated for each vial at the constant concentration. The obtained SI was normalized to determine the correction factor, and the corrected SI for various concentrations was calculated based on the SI of each vial by multiplying the value to its correction factor. It is notable that the position of the vials in the phantom with the constant concentration was the same as the vials with various concentrations. The phantoms were placed in the MR scanner, and a number of the spin echo sequences were run to determine the relaxation times (T1).
Image parameters included the slice thickness of 10 millimeters and matrix size of 512×512. The T1 relaxation time of each sample was measured with variable TR within the range of 100-6,400 milliseconds with the constant TE of 18 milliseconds. After acquiring the images, the magnitude of the image intensities was measured within the regions of interest (ROIs) for each sample. In addition, R1 (1/T1) relaxation rate was calculated by the mono-exponential curve fitting of the signal intensity versus TR. The curve fitting of R1 relaxation rate was performed using the following equation [33]:
( )0 1( ) 1 exp (1)S t S R TR= − − ×
where S(t) is the SI at the t time, and S0 shows the observed SI in the absence of magnetization preparation of the pre-pulses or contrast agents. Equation 1 had to be multiplied to the or exp(-R2.TE) factor at a higher concentration of the contrast agents [37]. The plotting R1 versus the iron concentration resulted in the T1 relaxivity (r1) as the slope.
MRI image analysisThe data on the MRI image were transferred
from the MR scanner to a personal computer and processed using Interactive Data Language (IDL, Research Systems, Inc., http://www.rsinc.com) image processing software. IDL programs were written to automatically find the following parameters:
a) The correction factor for the non-uniformity of the coil based on the SI of the vials with the constant concentration;
b) The mean and standard deviation of SI and nine innermost pixels of the vial to avoid partial volume effects;
c) The corrected SI based on the mean SI values of the vials with various concentrations multiplied by the non-uniformity correction factors.
Fig 1. FT-IR Spectra of a) bare Fe3O4 and b) PVP-grafted Fe3O4 nanoparticles
RESULTS FT-IR analysis
To evaluate the surface modification of the nanoparticles through graft polymerization, the PVP-grafted SPIONs were purified from the unreacted monomers and PVP homopolymers by washing with ethanol. The FT-IR spectra of the bare Fe3O4 and PVP-grafted Fe3O4 nanoparticles are shown in Figs 1-a and 1-b, respectively. The absorption peak at 580 cm-1 belonged to the stretching vibration of the Fe-O bonds in Fe3O4. As is depicted in Fig 1-b, the absorbent peak of

217Nanomed. J. 6(3):214-222, Summer 2019
M. Nazarpoor / Positive MRI contrast agent based on PVP-grafted SPIONs
the C=O group of N-vinylpyrrolidone appeared at 1660 cm-1. In addition, the peaks observed at 1957 and 1465 cm-1 were attributed to the asymmetric stretching and scissoring bending vibrations of the CH2 group of N-vinylpyrrolidone, respectively. The peak observed at 1289 cm-1 belonged to the C-N bond stretching vibration of N-vinylpyrrolidone. Considering these characteristic peaks, the FT-IR spectra indicated the successful grafting of PVP onto the Fe3O4 nanoparticle surfaces.
TEM analysis The TEM images of the bare and PVP-grafted
SPIONs are illustrated in Fig 2. According to the TEM image of the bare nanoparticles (Fig 2), the synthesized Fe3O4 nanoparticles had a mean diameter of 14 nanometers. A high-resolution TEM image of the synthesized Fe3O4 nanoparticles is shown as inset in Fig 2. According to the TEM image of the PVP-grafted SPIONs (Fig 3), the encapsulation of the magnetic core by PVP could be observed in the TEM image, while the polymer layer could also be spotted as a light shadow around the Fe3O4 nanoparticles. In addition, the surface-grafted nanoparticles could be easily dispersed in water to form a uniform suspension with proper stability for several months, while the suspension obtained from the bare nanoparticles rapidly precipitated in water within few minutes. Such evidence attests to the surface modification of the nanoparticles with PVP.
X-ray diffraction (XRD)Fig 4 shows the XRD diffraction patterns of
the bare and PVP-grafted Fe3O4 nanoparticles. As can be seen, the diffraction pattern of the nanoparticles (Fig 4-a) was close to the standard pattern of crystalline magnetite.
Fig 2. TEM Image of Bare Fe3O4 Nanoparticles Prepared by Coprecipitation and HRTEM of Nanoparticles (inset)
Fig 3. TEM Image of PVP-grafted Fe3O4 Nanoparticles
The characteristic diffraction peaks were marked by their indices as (220), (311), (400), (422), and (511), which could be well indexed to the inverse cubic spinel structure of Fe3O4. These characteristic peaks are shown in Fig 4-b. As can be seen, only the intensity and width of the peaks have changed without changing the position of the peaks, which confirms that the crystalline structure of the PVP-grafted nanoparticles did not change.
Fig 4. XRD Pattern of a) Bare Fe3O4 and b) PVP-grafted Fe3O4 Nanoparticles
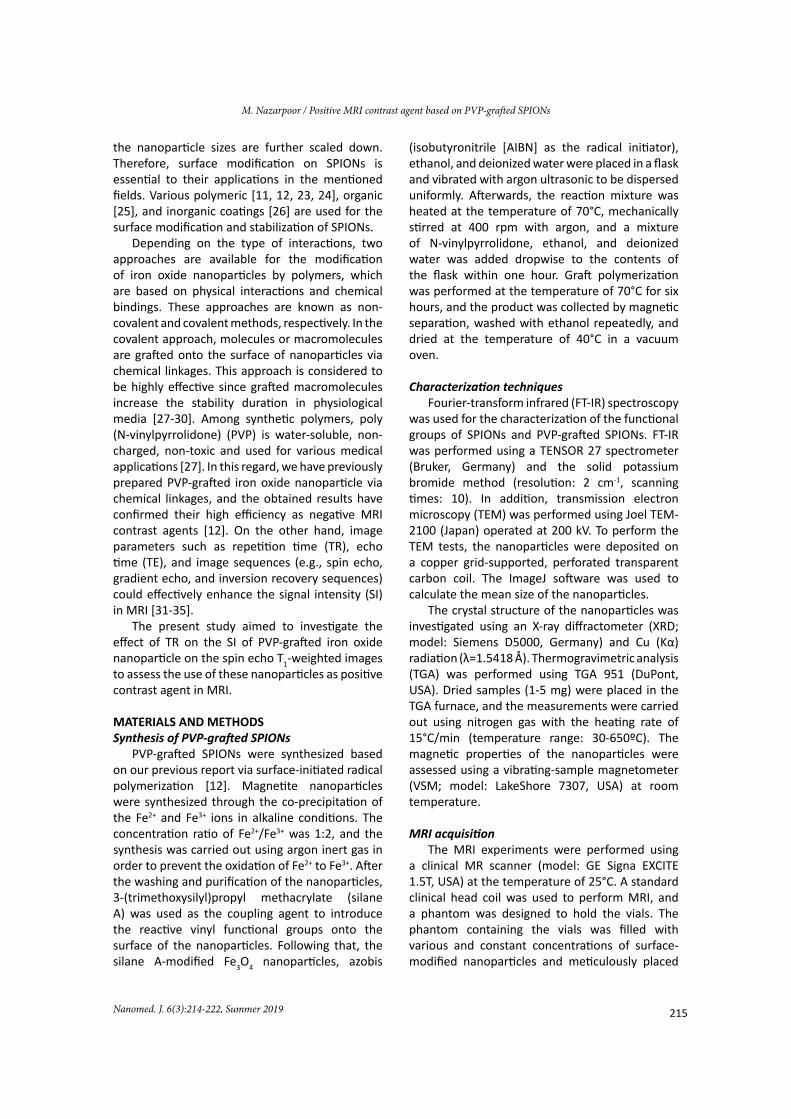
Analysis of magnetic propertiesFigs 5-a and 5-b show the VSM of the bare
and PVP-grafted Fe3O4 nanoparticles, respectively. Accordingly, the saturation magnetization (Ms) of the bare Fe3O4 nanoparticles was estimated at 62.1 emu/g, which decreased to 33.5 emu/g after PVP grafting onto the nanoparticle surfaces. There was no hysteresis loop in the magnetization curve, and both the remanence and coercivity were zero, indicating that the covalently PVP-grafted Fe3O4 nanoparticles had superparamagnetic behavior, which is of utmost importance for the biomedical applications of these magnetic nanoparticles.
218
M. Nazarpoor / Positive MRI contrast agent based on PVP-grafted SPIONs
Nanomed. J. 6(3):214-222, Summer 2019
Fig 5. VSM of a) bare Fe3O4 and b) PVP-grafted Fe3O4 nanoparticles
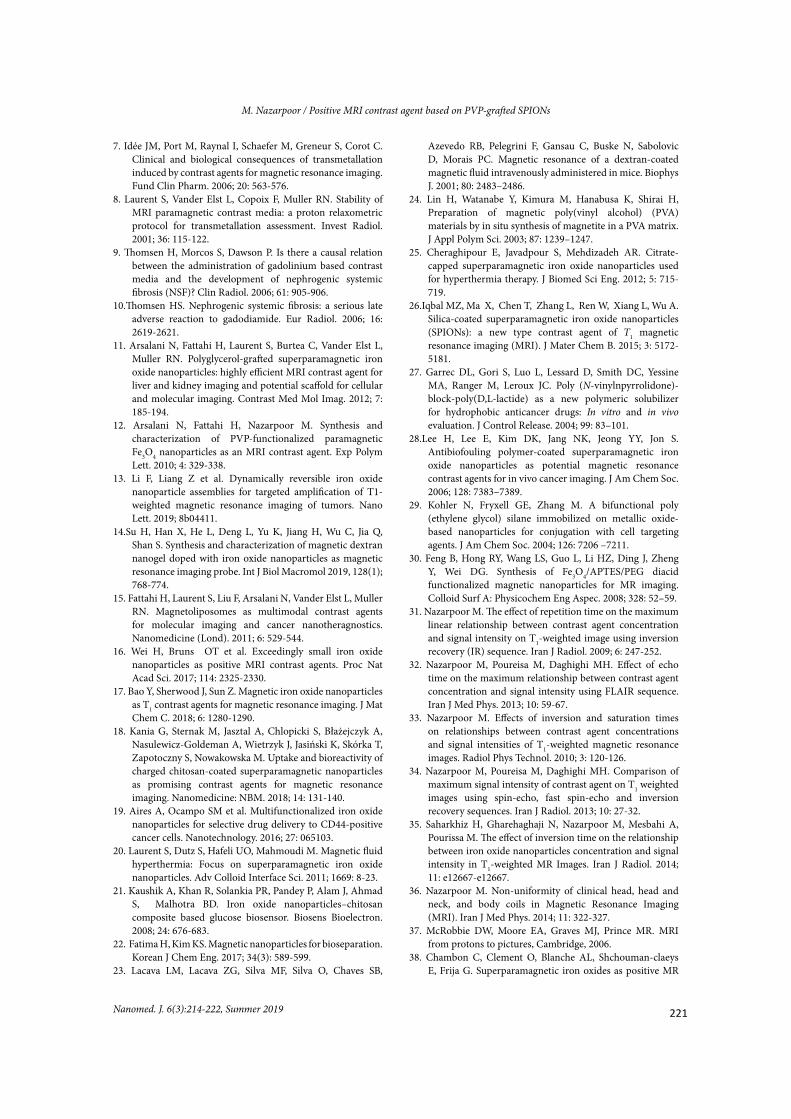
Thermogravimetric analysisThermogravimetric analysis (TGA) was
performed to evaluate the magnetite content of the PVP-grafted Fe3O4 nanoparticles (Fig 6). According to the TGA thermograms, the organic materials completely burned, and the magnetite was converted into Fe2O3 at elevated temperatures. In addition, the rate of weight loss in the bare Fe3O4 was estimated at 3.2% (Fig 6-a) in the entire temperature range, which was associated with the removal of physically and chemically adsorbed water.
In case of the PVP-grafted Fe3O4 nanoparticles (Fig 6-b), the first weight loss in the TGA diagram (below 140°C) was attributed to the evaporation of the adsorbed water in the polymer matrix, while the second stage initiated at the temperature of 200ºC belonged to the decomposition of PVP. Moreover, the TGA diagram indicated that the magnetite content of the PVP-grafted Fe3O4 nanoparticles was approximately 45.3%.
Fig 6. TGA Diagram of a) Bare Fe3O4 and b) PVP-grafted Fe3O4 nanoparticles
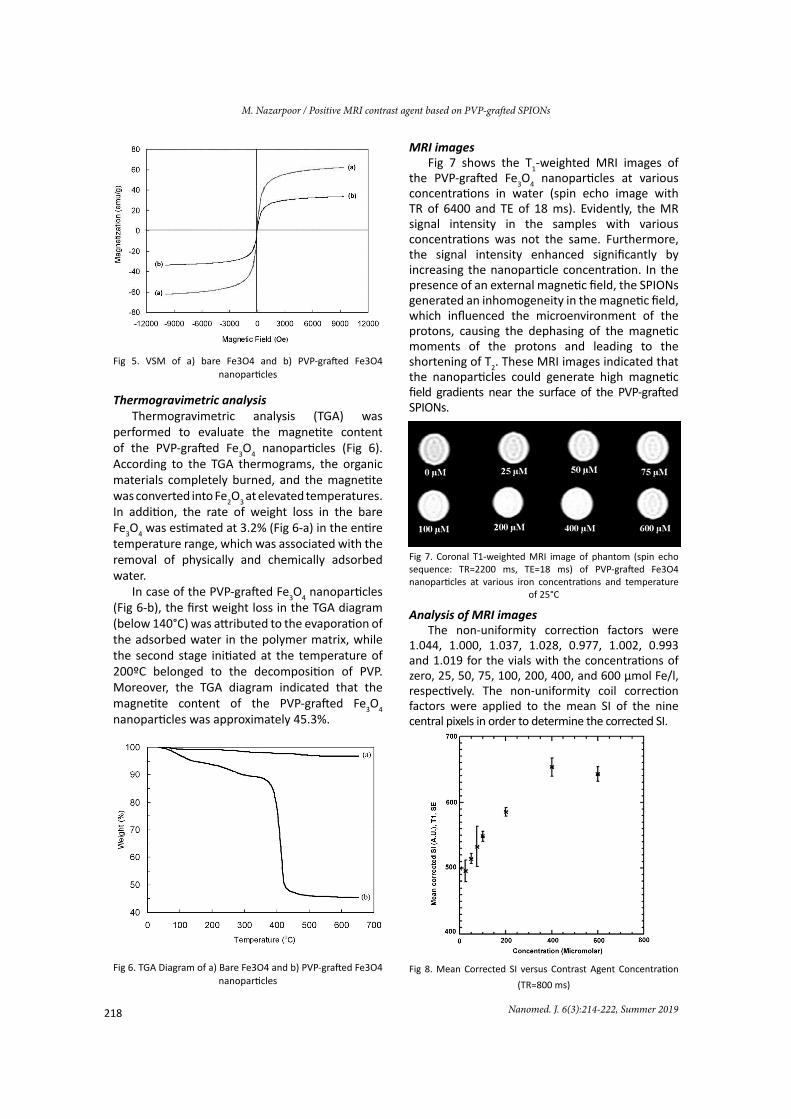
MRI imagesFig 7 shows the T1-weighted MRI images of
the PVP-grafted Fe3O4 nanoparticles at various concentrations in water (spin echo image with TR of 6400 and TE of 18 ms). Evidently, the MR signal intensity in the samples with various concentrations was not the same. Furthermore, the signal intensity enhanced significantly by increasing the nanoparticle concentration. In the presence of an external magnetic field, the SPIONs generated an inhomogeneity in the magnetic field, which influenced the microenvironment of the protons, causing the dephasing of the magnetic moments of the protons and leading to the shortening of T2. These MRI images indicated that the nanoparticles could generate high magnetic field gradients near the surface of the PVP-grafted SPIONs.
Fig 7. Coronal T1-weighted MRI image of phantom (spin echo sequence: TR=2200 ms, TE=18 ms) of PVP-grafted Fe3O4 nanoparticles at various iron concentrations and temperature
of 25°C
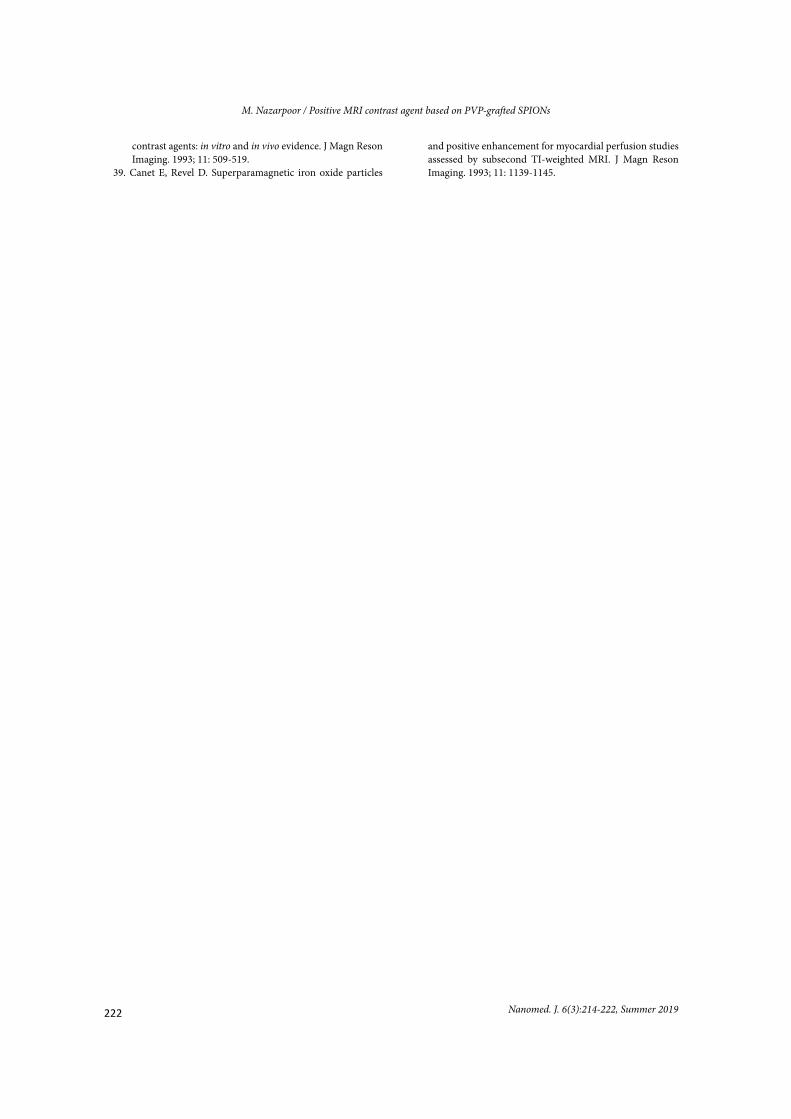
Analysis of MRI imagesThe non-uniformity correction factors were
1.044, 1.000, 1.037, 1.028, 0.977, 1.002, 0.993 and 1.019 for the vials with the concentrations of zero, 25, 50, 75, 100, 200, 400, and 600 µmol Fe/l, respectively. The non-uniformity coil correction factors were applied to the mean SI of the nine central pixels in order to determine the corrected SI.
Fig 8. Mean Corrected SI versus Contrast Agent Concentration (TR=800 ms)

219Nanomed. J. 6(3):214-222, Summer 2019
M. Nazarpoor / Positive MRI contrast agent based on PVP-grafted SPIONs
Fig 9. Mean Corrected SI versus different nanoparticle concentrations at typical TR of 2,200 ms
Fig 10. Mean corrected SI versus various concentrations of nanoparticles for another typical TR of 5000 ms
Figs 8-10 show some of the typical findings obtained from the corrected SI in terms of the non-uniformity of the coil versus the nanoparticle concentration at the TR of 800, 2200, and 5000 milliseconds with the TE of 18 milliseconds, which was obtained from the T1-weighted spin echo sequence.
As can be seen in Fig 8, the maximum mean SI was 653.32±14.01 µmol Fe/l at the concentration of 400 µmol Fe/l, while Fig 9 shows that the maximum mean SI was 1137.35±31.66 µmol Fe/l at the concentration of 400 µmol Fe/l. Moreover, the error bars show the standard deviation of the
SI at each concentration. As is depicted in Fig 10, the maximum mean SI was 1613.75±44.04 µmol Fe/l at the concentration of 75 µmol Fe/l. The error bars show the standard deviation of the SI at each concentration.
Fig 11. TR versus Maximum SI
Fig 11 shows various TR values versus the maximum SI. As can be seen, increasing the TR leads to an increment in the maximum SI. According to the results of the present study, the maximum SI with the TR of 800-2200 ms appeared at the concentration of 400 µmol Fe/l. In addition, the maximum SI was observed at the concentration of 75 µmol Fe/l, where the TR was within the range of 2,900-6,400 ms (Fig 12).
Fig 12. TR versus nanoparticle concentration with maximum SI (maximum SI decreased at higher TR and lower nanoparticle
concentrations)
M. Nazarpoor / Positive MRI contrast agent based on PVP-grafted SPIONs

220
M. Nazarpoor / Positive MRI contrast agent based on PVP-grafted SPIONs
Nanomed. J. 6(3):214-222, Summer 2019
DISCUSSION Contrast agents such as Gd-DTPA and SPIONs
act indirectly on the MR signal by decreasing the RT of the surrounding nuclear spins. Both the T1- and T2-shortening effects could influence the SI on MRI, and increased TR leads to an increment in the SI of the T1-weighted image (Equation 1). As is depicted in Figs 8-10, the SI reduced at the higher concentrations of the nanoparticles due to the T2-shortening effect. In other words, the injection of the contrast agent at the excess concentrations of 400 and 75 µmol Fe/l with the TR of 800, 2,200, and 5,000 milliseconds, respectively led to the net decrease in the SI of the images using the spin echo sequence. Furthermore, the Figs also indicated that the increased TR led to an increment in the maximum SI (Equation 1; Fig 11).
Our previous investigations have been focused on the effects of various inversion times (TI) on the strength of SI at various concentrations of polyethylene glycol and carboxydextran-coated iron oxide nanoparticles using inversion recovery turbo-FLASH (turbo fast low angle shot) pulse sequence [35]. Since the nanoparticles, image parameters, and image sequence in the current research differed from our previous study, it is impossible to compare these findings. Despite the differences, the maximum SI (440) with the TR of 416 milliseconds, TE of 1.69 milliseconds, and TI of 400 milliseconds occurred at the concentration of 400 µmol Fe/l in our previous study. In the present study, the maximum SI (350) with the TR of 416 milliseconds and TE of 18 milliseconds was observed at the concentration of 550 µmol Fe/l (Fig 11).
In a research in this regard, Chambon et al. [38] evaluated the signal enhancement of the ultrasmall superparamagnetic iron oxide (USPIO) nanoparticles at various concentrations (0-800 µmol Fe/l) in-vitro using the spin echo T1-weighted pulse sequence with various TRs (160-1800 ms) and TEs (20-80 ms). According to the findings, the maximum SI enhancement was achieved at the concentration of 400 µmol Fe/l at the TR of 160 milliseconds and TE of 20 milliseconds. Despite the differences in the nanoparticles type and image parameters, this finding is consistent with the results of the present study.
In another study, Canet et al. [39] assessed signal enhancement at various concentrations of SPIONs (AMI-25) in-vitro using the spin echo T1-weighted pulse sequence with the TR/TE
of 200/22 and 500/22 milliseconds. According to the obtained results, the maximum signal enhancement was achieved at the USPIO nanoparticle concentration of 200 µmol Fe/l at the TRs of 500 and 200 milliseconds. According to the results of the present study, the maximum SI was observed at the concentration of 400 µmol Fe/l at the TR of 800-2,200 milliseconds and TE of 18 milliseconds. This discrepancy could be due to the differences in the utilized nanoparticles and image parameters. Considering the key role of nanoparticle relaxivity, size, and coating in the biological properties of contrast agents, image parameters could influence the strength of SI [34, 35].
CONCLUSIONThis study aimed to investigate the effect of TR
on the SI of PVP-grafted iron oxide nanoparticles using spin echo T1-weighted images. Although the nanoparticles had high efficiency as negative MRI contrast agents, the results indicated that the behavior of the nanoparticles was similar to other commercial nanoparticles (e.g., carboxydextran and carbohydrate-polyethylene glycol USPIO nanoparticles) and could also be used as positive MRI contrast agents with T1-weighted images in perfusion measurements.
ACKNOWLEDGMENTSThe support of the deputy of research
and technology of Malek Ashtar university of technology is greatly acknowledged.
REFERENCES1. Laurent S, Forge D, Port M, Roch A, Robic C, Vander
Elst L, Muller RN. Magnetic iron oxide nanoparticles: Synthesis, stabilization, vectorization, physicochemical characterizations, and biological applications. Chem Rev. 2009; 108: 2064-2110.
2. Zhao Z, Zhou Z, Bao J, Wang Z, Chi X, Ni K, Wang R, Chen X, Chen Z, Gao J. Octapod iron oxide nanoparticles as high performance T2 contrast agents for magnetic resonance imaging. Nat Commun. 2013; 4: 2266-2272.
3. Lee H, Shin T-H, Cheon J, Weissleder R, Recent developments in magnetic diagnostic systems, Chem Rev. 2015; 115: 10690-10724.
4. Rinck PA. Magnetic Resonance in Medicine. ABW wissenschaftsverlag, Germany, 2003.
5. Major JL, Meade TJ. Bioresponsive, cell-penetrating, and multimeric MR contrast agents. Acc Chem Res. 2009; 42: 893–903.
6. Cabella C, Crich SG, Corpillo D, Barge A, Ghirelli C, Bruno E, Lorusso V, Ugerri F, Aime S. Cellular labeling with Gd (III) chelates: only high thermodynamic stabilities prevent the cells acting as ‘sponges’ of Gd3+ ions. Contrast Med Mol Imag. 2006; 1: 23-29.
221Nanomed. J. 6(3):214-222, Summer 2019
M. Nazarpoor / Positive MRI contrast agent based on PVP-grafted SPIONs
7. Idée JM, Port M, Raynal I, Schaefer M, Greneur S, Corot C. Clinical and biological consequences of transmetallation induced by contrast agents for magnetic resonance imaging. Fund Clin Pharm. 2006; 20: 563-576.
8. Laurent S, Vander Elst L, Copoix F, Muller RN. Stability of MRI paramagnetic contrast media: a proton relaxometric protocol for transmetallation assessment. Invest Radiol. 2001; 36: 115-122.
9. Thomsen H, Morcos S, Dawson P. Is there a causal relation between the administration of gadolinium based contrast media and the development of nephrogenic systemic fibrosis (NSF)? Clin Radiol. 2006; 61: 905-906.
10.Thomsen HS. Nephrogenic systemic fibrosis: a serious late adverse reaction to gadodiamide. Eur Radiol. 2006; 16: 2619-2621.
11. Arsalani N, Fattahi H, Laurent S, Burtea C, Vander Elst L, Muller RN. Polyglycerol-grafted superparamagnetic iron oxide nanoparticles: highly efficient MRI contrast agent for liver and kidney imaging and potential scaffold for cellular and molecular imaging. Contrast Med Mol Imag. 2012; 7: 185-194.
12. Arsalani N, Fattahi H, Nazarpoor M. Synthesis and characterization of PVP-functionalized paramagnetic Fe3O4 nanoparticles as an MRI contrast agent. Exp Polym Lett. 2010; 4: 329-338.
13. Li F, Liang Z et al. Dynamically reversible iron oxide nanoparticle assemblies for targeted amplification of T1-weighted magnetic resonance imaging of tumors. Nano Lett. 2019; 8b04411.
14.Su H, Han X, He L, Deng L, Yu K, Jiang H, Wu C, Jia Q, Shan S. Synthesis and characterization of magnetic dextran nanogel doped with iron oxide nanoparticles as magnetic resonance imaging probe. Int J Biol Macromol 2019, 128(1); 768-774.
15. Fattahi H, Laurent S, Liu F, Arsalani N, Vander Elst L, Muller RN. Magnetoliposomes as multimodal contrast agents for molecular imaging and cancer nanotheragnostics. Nanomedicine (Lond). 2011; 6: 529-544.
16. Wei H, Bruns OT et al. Exceedingly small iron oxide nanoparticles as positive MRI contrast agents. Proc Nat Acad Sci. 2017; 114: 2325-2330.
17. Bao Y, Sherwood J, Sun Z. Magnetic iron oxide nanoparticles as T1 contrast agents for magnetic resonance imaging. J Mat Chem C. 2018; 6: 1280-1290.
18. Kania G, Sternak M, Jasztal A, Chlopicki S, Błażejczyk A, Nasulewicz-Goldeman A, Wietrzyk J, Jasiński K, Skórka T, Zapotoczny S, Nowakowska M. Uptake and bioreactivity of charged chitosan-coated superparamagnetic nanoparticles as promising contrast agents for magnetic resonance imaging. Nanomedicine: NBM. 2018; 14: 131-140.
19. Aires A, Ocampo SM et al. Multifunctionalized iron oxide nanoparticles for selective drug delivery to CD44-positive cancer cells. Nanotechnology. 2016; 27: 065103.
20. Laurent S, Dutz S, Hafeli UO, Mahmoudi M. Magnetic fluid hyperthermia: Focus on superparamagnetic iron oxide nanoparticles. Adv Colloid Interface Sci. 2011; 1669: 8-23.
21. Kaushik A, Khan R, Solankia PR, Pandey P, Alam J, Ahmad S, Malhotra BD. Iron oxide nanoparticles–chitosan composite based glucose biosensor. Biosens Bioelectron. 2008; 24: 676-683.
22. Fatima H, Kim KS. Magnetic nanoparticles for bioseparation. Korean J Chem Eng. 2017; 34(3): 589-599.
23. Lacava LM, Lacava ZG, Silva MF, Silva O, Chaves SB,
Azevedo RB, Pelegrini F, Gansau C, Buske N, Sabolovic D, Morais PC. Magnetic resonance of a dextran-coated magnetic fluid intravenously administered in mice. Biophys J. 2001; 80: 2483–2486.
24. Lin H, Watanabe Y, Kimura M, Hanabusa K, Shirai H, Preparation of magnetic poly(vinyl alcohol) (PVA) materials by in situ synthesis of magnetite in a PVA matrix. J Appl Polym Sci. 2003; 87: 1239–1247.
25. Cheraghipour E, Javadpour S, Mehdizadeh AR. Citrate-capped superparamagnetic iron oxide nanoparticles used for hyperthermia therapy. J Biomed Sci Eng. 2012; 5: 715-719.
26.Iqbal MZ, Ma X, Chen T, Zhang L, Ren W, Xiang L, Wu A. Silica-coated superparamagnetic iron oxide nanoparticles (SPIONs): a new type contrast agent of T1 magnetic resonance imaging (MRI). J Mater Chem B. 2015; 3: 5172-5181.
27. Garrec DL, Gori S, Luo L, Lessard D, Smith DC, Yessine MA, Ranger M, Leroux JC. Poly (N-vinylnpyrrolidone)-block-poly(D,L-lactide) as a new polymeric solubilizer for hydrophobic anticancer drugs: In vitro and in vivo evaluation. J Control Release. 2004; 99: 83–101.
28.Lee H, Lee E, Kim DK, Jang NK, Jeong YY, Jon S. Antibiofouling polymer-coated superparamagnetic iron oxide nanoparticles as potential magnetic resonance contrast agents for in vivo cancer imaging. J Am Chem Soc. 2006; 128: 7383–7389.
29. Kohler N, Fryxell GE, Zhang M. A bifunctional poly (ethylene glycol) silane immobilized on metallic oxide-based nanoparticles for conjugation with cell targeting agents. J Am Chem Soc. 2004; 126: 7206 –7211.
30. Feng B, Hong RY, Wang LS, Guo L, Li HZ, Ding J, Zheng Y, Wei DG. Synthesis of Fe3O4/APTES/PEG diacid functionalized magnetic nanoparticles for MR imaging. Colloid Surf A: Physicochem Eng Aspec. 2008; 328: 52–59.
31. Nazarpoor M. The effect of repetition time on the maximum linear relationship between contrast agent concentration and signal intensity on T1-weighted image using inversion recovery (IR) sequence. Iran J Radiol. 2009; 6: 247-252.
32. Nazarpoor M, Poureisa M, Daghighi MH. Effect of echo time on the maximum relationship between contrast agent concentration and signal intensity using FLAIR sequence. Iran J Med Phys. 2013; 10: 59-67.
33. Nazarpoor M. Effects of inversion and saturation times on relationships between contrast agent concentrations and signal intensities of T1-weighted magnetic resonance images. Radiol Phys Technol. 2010; 3: 120-126.
34. Nazarpoor M, Poureisa M, Daghighi MH. Comparison of maximum signal intensity of contrast agent on T1 weighted images using spin-echo, fast spin-echo and inversion recovery sequences. Iran J Radiol. 2013; 10: 27-32.
35. Saharkhiz H, Gharehaghaji N, Nazarpoor M, Mesbahi A, Pourissa M. The effect of inversion time on the relationship between iron oxide nanoparticles concentration and signal intensity in T1-weighted MR Images. Iran J Radiol. 2014; 11: e12667-e12667.
36. Nazarpoor M. Non-uniformity of clinical head, head and neck, and body coils in Magnetic Resonance Imaging (MRI). Iran J Med Phys. 2014; 11: 322-327.
37. McRobbie DW, Moore EA, Graves MJ, Prince MR. MRI from protons to pictures, Cambridge, 2006.
38. Chambon C, Clement O, Blanche AL, Shchouman-claeys E, Frija G. Superparamagnetic iron oxides as positive MR
222
M. Nazarpoor / Positive MRI contrast agent based on PVP-grafted SPIONs
Nanomed. J. 6(3):214-222, Summer 2019
contrast agents: in vitro and in vivo evidence. J Magn Reson Imaging. 1993; 11: 509-519.
39. Canet E, Revel D. Superparamagnetic iron oxide particles
and positive enhancement for myocardial perfusion studies assessed by subsecond TI-weighted MRI. J Magn Reson Imaging. 1993; 11: 1139-1145.