potential for solar heat in industrial processes in terms of process engineering, ... to identify...
TRANSCRIPT


Task 33/IV – Potential for Solar Heat in Industrial Processes
1
Solar
IEA SHC and SolarPACES Programmes – Task 33/IV
Industrial Process Indicators
and Heat Integration in Industries
__________________________________________________________
Christoph Brunner* Bettina Slawitsch*
Kanellina Giannakopoulou* Hans Schnitzer*
*JOANNEUM RESEARCH – Institute of Sustainable Techniques and Systems This booklet was prepared as an account of work done within Task 33 “Solar Heat for Industrial Processes” of the IEA Solar Heating and Cooling Programme and Task IV of the IEA SolarPACES Programme.
Published by Joanneum Research, Graz, Austria 2008 © 2008 Solar Heating and Cooling Executive Committee of the International Energy Agency (IEA)
Notice: The Solar Heating and Cooling Programme functions within a framework created by the International Energy Agency (IEA). Views, findings and publications of the Solar Heating and Cooling Programme do not necessarily represent the views or policies of the IEA Secretariat or of all its individual member countries.

Task 33/IV – Potential for Solar Heat in Industrial Processes
2
Solar
Table of contents
1 Introduction............................................................................................................................ 3 2 Matrix of Industrial Process Indicators .............................................................................. 4
2.1 Background ....................................................................................................................... 4 2.2 Methodology ..................................................................................................................... 4
2.2.1 Definition .................................................................................................................... 4 2.2.2 Sectors......................................................................................................................... 4 2.2.3 Approach..................................................................................................................... 5
2.3 Utilization.......................................................................................................................... 7 3 Pinch – Energy Efficiency tool............................................................................................ 8
3.1 Solar process heat in energy efficient processes............................................................... 8 3.2 Heat integration – theoretical background ........................................................................ 8
3.2.1 Overview..................................................................................................................... 8 3.2.2 Analysis of a production process with the pinch methodology .................................. 9
3.3 PE² “Pinch Energy Efficiency” – a new software tool ................................................... 12 4 Conclusion ........................................................................................................................... 14 Appendix 1 – IEA Solar Heating and Cooling Programme .......................................... 15 Appendix 2 – Task 33/IV Solar Heat for Industrial Processes .................................... 17

Task 33/IV – Potential for Solar Heat in Industrial Processes
3
Solar
1 Introduction
The goal of this report, developed in the framework of the Task 33/IV – Solar Heat for Industrial Processes (SHIP) of the International Energy Agency, is to give an overview of the tools which have been developed within this IEA Task 33/IV.
The first tool is the “Matrix of Industrial process indicators – MATRIX”, which is a comprehensive database, and was developed in Subtask B as a decision support tool for solar experts. With this MATRIX the work with industry and the identification of suitable solar applications can be facilitated. It will be possible to investigate and calculate the installation of solar heat in production processes without detailed knowledge of the relevant unit operations and production processes.
Some industry sectors such as food, chemistry, plastic processing, textile industry and surface treatment industry have been identified as very promising sectors for solar thermal applications. For these industries detailed information like general benchmark data, temperature levels of the processes, flow sheets of production lines and generic hydraulic schemes for solar integration can be found in the specific Sub-MATRICES.
The investigation of these industries has to focus on an integrated analysis of cooling and heating demands taking into account competitive technologies, when assessing the (economic) feasibility of solar thermal energy. Among those competing technologies are heat integration, co-generation and heat pumps, which also have been described in the relevant parts of the MATRIX. Beside technology optimization, the reduction of energy consumption also has to be achieved by system optimization.
Most industries have a heat demand in the production and at the same time a lot of waste heat. The usage of this waste heat has the advantage of being simultaneous with the heat demand of other processes. The reuse of this waste heat has to be done at the highest possible temperature. The most promising methodology to identify the maximum heat recovery in a defined system (for a defined industrial process) is to design a heat exchanger network using the so-called the Pinch Analysis. With this tool a system optimization can by achieved and the minimal external heating demand as well as the minimal external cooling demand can be identified.
Within the work of IEA Task 33/IV the computer programme (Pinch Energy Efficiency – PE²), which calculates the heat recovery potential and designs a technically and economically feasible heat
exchanger network for a given process, has been developed. PE² fulfils the need of heat integration calculations in promising industries. The automatic calculation of an ideal heat exchanger network (based on mathematical criteria and aiming at maximum savings in terms of energy savings in kWh per year) is one of the main advantages of the programme. Furthermore the possibility to calculate heat exchanger surfaces and the calculation of a dynamic cost function
resulting in the pay-back period for a given heat exchanger network based on user defined economic data as well as the visualisation of energy savings with a Sankey Editor afford a fast energy optimization and documentation of a whole process.
The analysis with PE² shows the remaining energy demand at the corresponding temperature levels after the optimisation of the processes by heat recovery. It gives information on which temperature level external heat/cold is necessary – important information for implementation of solar energy for heating purposes.

Task 33/IV – Potential for Solar Heat in Industrial Processes
4
Solar
2 Matrix of Industrial Process Indicators
2.1 Background The analysis of industrial energy usage indicates that low temperature processes (20 - 200 °C) are common in nearly all industrial sectors. In principle, there is a potential to use solar thermal energy in these lower temperature processes, thus reducing the environmental impact of burning fossil fuels and the energy costs of the industries. Consequently, industrial sectors which mainly include low temperature processes have a higher solar thermal potential.
Industrial sectors vary in structure and heat demand. Therefore a systematic approach is needed to describe the processes in energetic terms. The application of solar thermal systems in industry incorporates energy efficiency optimization as a primary step. The minimization of the heat demand of an industry can be achieved by: (a) applying changes in the process (application of competitive energy technologies), (b) applying changes in the energy distribution system (application of heat integration systems) and (c) applying changes in the energy supply system (application of heat pumps/co-generation systems and/or application of solar thermal systems). Elaboration of the items mentioned above can point out the most energy and cost efficient integrated solution. Solar thermal systems vary in layout and design. Therefore a classification of the different hydraulic schemes is needed to point out their suitability to be applied for the energy supply in production processes. In order to fulfil the above issues on a theoretical level, a tool that systematically includes process engineering and energetic information of industrial sectors with a potential for application of solar thermal systems has been developed. The aim was to design a decision support system that gives the user a large information database for all crucial steps that have to be taken when designing a solar heating system for industrial processes. These steps include the overview of the processes, important parameters of the energy supply of unit operations, benchmark data on energy consumption, competitive technologies, hydraulic schemes for solar integration and successful case studies.
2.2 Methodology
2.2.1 Definition The Matrix of Industrial Process Indicators is designed as a decision support tool for process engineers, energy efficiency experts and solar experts. With this tool, the work with industry concerning energy efficiency and the identification of suitable solar applications can be facilitated.
2.2.2 Sectors Based on European and international potential studies on solar thermal energy in industries, four industrial sectors, the most promising for solar thermal applications, have been selected to be described in the tool: • Food Industries • Textile Industries • Surface Treatment of Metals and Plastics Industries • Chemical Industries

Task 33/IV – Potential for Solar Heat in Industrial Processes
5
Solar
Industry sectors such as food and textile industries can be emphasised as very promising sectors for the application of solar thermal systems, since their share of heat demand at low and medium temperature (below 250°C) is significant. Surface treatment of metals and plastics is not indicated in such studies as an industry with good potential for solar thermal applications. This is mainly because surface treatment processes are included in metal processing industries, which in total require high temperatures (above 400°C). Still, surface treatment processing requires energy for heating up aqueous baths at temperatures below 70°C, therefore a good potential for applying a solar thermal system is found. Chemical industries are diverse in unit operations and products. A variety of sub-sectors of the chemical industry have a heat demand at low and medium temperatures. Therefore, the chemical sector is considered as a focus sector for the application of solar thermal systems.
2.2.3 Approach The main template of the Matrix of Industrial Process Indicators is a matrix where on the ordinate industry sectors relevant for solar application are listed, while on the abscissa different unit operations – which have been identified as suitable for solar applications – are registered. The Matrix contains two levels of information: • Basic information on unit operations, solar thermal systems and industrial sectors • Detailed information on unit operations, products, energy efficiency case studies and solar thermal
case studies per industrial sector Basic information is presented in the main template of the Matrix:
Fig. 1: Main template of the Matrix of Industrial Process Indicators
Detailed information is presented per industrial sector in different templates (Matrix for Food Industry, Matrix for Textile Industry, Matrix for Surface Treatment of Metals and Plastics and Matrix for Chemical Industry). Indicatively the Matrix for the Food Industry is shown below:

Task 33/IV – Potential for Solar Heat in Industrial Processes
6
Solar
Fig. 2 Template of the Matrix for the Food Industry

Task 33/IV – Potential for Solar Heat in Industrial Processes
7
Solar
Information included in the tool can be spotted through a network of links. A User Guideline is integrated in the tool, to help the user familiarize with the navigation through the Matrix of Industrial Process Indicators. The following information can be found in the Matrix:
Tab. 1 Overview of the information in the Matrix of Industrial Process Indicators
Application of unit operations per industrial sector Information on Process Engineering Flowsheets of industrial sectors
Temperature levels of unit operations per industrial sector Benchmark data (e.g. per product) of industrial sectors Competitive technologies with energy saving potentials Heat Integration possibilities
Information on Energy Efficiency
Case studies on Energy Efficiency Classification of solar thermal systems Application of solar thermal systems for different unit operations Information on Solar Thermal
Applications Case studies on solar thermal applications
2.3 Utilization The Matrix of Industrial Process Indicators can be used as an information database for engineers before visiting companies, providing flow sheets and information on unit operations and production lines. Additionally, it can be used as a fast assessment tool for the possibilities of heat minimization in industries, as reported in literature and performed case studies. Moreover it can be used as an industrial solar thermal system database, where an overview of the available systems and case studies performed in different industrial sectors can be found. As a triple-function-tool the Matrix of Industrial Process Indicators aims to summarize available information in terms of process engineering, energy efficiency and solar thermal applications.

Task 33/IV – Potential for Solar Heat in Industrial Processes
8
Solar
3 Pinch – Energy Efficiency tool
3.1 Solar process heat in energy efficient processes
Fig. 3 Solar thermal plant, football stadium "UPC-Arena" in
Graz, Austria (Source: SOLID, Austria)
The integration of solar heat into industrial processes is more complex than the design of common heat supply technologies. To identify the ideal integration for solar process heat into the production system and to design a most economic and efficient overall energy supply system, (that might embrace different energy sources) all considerations concerning energy efficiency and heat recovery that might lead to economical, technical or organisational improvements need to be considered. As stated above the two important steps in considering the saving potentials are a technological optimisation of single processes and a system optimisation taking into account the whole production. Only with this approach a real economic and efficient solar process heat plant can be designed that fits well into the energy supply system of a company. The following reasons can support this statement: The optimisation of the production process
(technological and system optimisation) reduces the overall energy demand and prevents an over-dimensioning of the energy supply systems (e.g. the solar plant).
The technological optimisation of unit operations can result in different energy demand and different temperature levels of the processes. Both parameters have a large impact on the considerations of solar process heat.
The investigation of processes leads to detailed know-how of unit operations and their operational data (temperatures, operation schedule etc.) and gives the necessary overview to identify the ideal integration for solar process heat into the production system.
Consideration of all possibilities of heat recovery and the use of waste heat (system optimisation) makes sure that no supplementary heat is introduced to the production where recovered or waste heat is available as an already existing energy source.
The technological optimisation of processes can be very diverse and is very dependent on the sector and the products (see Matrix of Industrial Process Indicators). However, for the system optimisation a powerful methodology that can be applied to any production process exists. This is the so called “Pinch Methodology”.
3.2 Heat integration – theoretical background
3.2.1 Overview A correct way to integrate (waste) heat into a process is described by the pinch theory [Ferner, Schnitzer, 1990] that was developed by Linhoff et.al. in the 1970s. With the pinch analysis the heat and cold demand of the whole production is plotted in one diagram that shows the energy (heating or cooling) demand of the processes and at which temperatures this energy is needed. Some very important statements can be drawn from this analysis: How much energy can theoretically be saved by heat recovery?
Task 33/IV – Potential for Solar Heat in Industrial Processes
9
Solar
How much external heating demand does the production process have? Which temperature level is necessary?
How much external cooling demand does the production process have? Which temperature level is necessary?
The pinch analysis is a strong tool for a first estimation of the energy saving potential by heat recovery (which later has to be adapted due to practical and/or economic reasons). Secondly, the analysis shows at which temperature levels the demanded heat/cold is necessary – important information for a possible solar process heat plant.
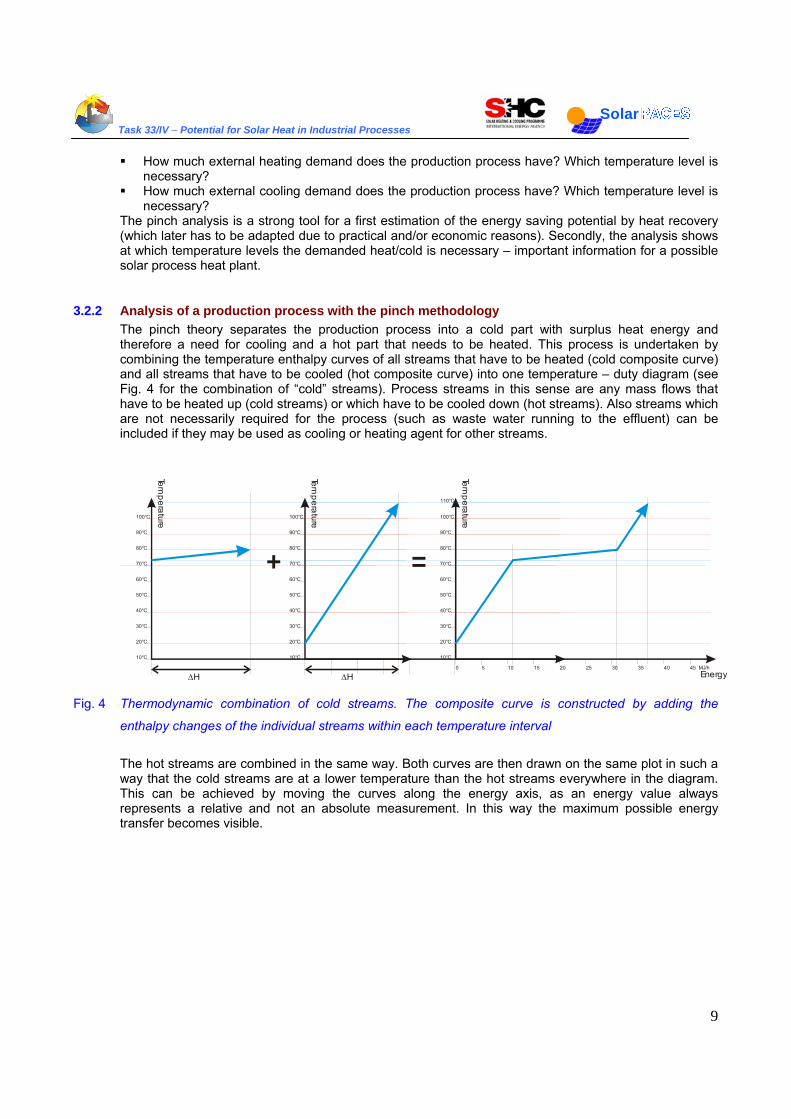
3.2.2 Analysis of a production process with the pinch methodology The pinch theory separates the production process into a cold part with surplus heat energy and therefore a need for cooling and a hot part that needs to be heated. This process is undertaken by combining the temperature enthalpy curves of all streams that have to be heated (cold composite curve) and all streams that have to be cooled (hot composite curve) into one temperature – duty diagram (see Fig. 4 for the combination of “cold” streams). Process streams in this sense are any mass flows that have to be heated up (cold streams) or which have to be cooled down (hot streams). Also streams which are not necessarily required for the process (such as waste water running to the effluent) can be included if they may be used as cooling or heating agent for other streams.
Temperature
10°C
20°C
30°C
40°C
50°C
60°C
70°C
80°C
90°C
100°C
ΔH
Temperature
10°C
20°C
30°C
40°C
50°C
60°C
70°C
80°C
90°C
100°C
ΔH
+ =
Temperature
Energy
10°C
0 5 10 15 20 25 30 35 40 45 MJ/h
20°C
30°C
40°C
50°C
60°C
70°C
80°C
90°C
100°C
110°C
Fig. 4 Thermodynamic combination of cold streams. The composite curve is constructed by adding the
enthalpy changes of the individual streams within each temperature interval
The hot streams are combined in the same way. Both curves are then drawn on the same plot in such a way that the cold streams are at a lower temperature than the hot streams everywhere in the diagram. This can be achieved by moving the curves along the energy axis, as an energy value always represents a relative and not an absolute measurement. In this way the maximum possible energy transfer becomes visible.

Task 33/IV – Potential for Solar Heat in Industrial Processes
10
Solar
Fig. 5 Representation of the combination of the cold and hot composite curves
With the help of these composite curves it is possible to determine some essential facts about the process. The curves are separated by a point of the lowest difference in temperature ∆Tmin that is chosen by the user as the minimal ∆T over a possible heat exchanger in the system. This ∆Tmin defines the temperature level in the system that can be explained as the thermodynamic bottleneck (See Fig. 5) of the process, the so called “pinch”. The pinch temperature cuts the system in two halves: In an area below the pinch temperature with a heat surplus that has to be removed by cooling and an area above the pinch temperature with an energy deficiency that has to be overcome by additional heating. Two important rules for heat integration follow: No external heating below the pinch temperature (enough waste heat is available) No external cooling above the pinch temperature (cooling can be achieved by heating other process
streams)
The overlap between the curves in Fig. 5 shows the maximum possible process heat recovery. The minimum heating demand QH,min, and the minimum cooling demand QC,min can also be identified from the figure. The minimum temperature difference ∆Tmin is determined by economical optimization, as a lower ∆Tmin increases the efficiency of heat exchange, but also increases heat exchanger surfaces and costs. Typical energy differences ∆Tmin are shown in Tab. 2.
Tab. 2 Typical ∆Tmin values for various types of processes [Linhoff March, 1998]
Industrial Sector Experience ∆Tmin Values Oil Refining 20 – 40 °C Petrochemical 10 – 20°C Chemical 10 – 20 °C Low Temperature Processes
3 – 5 °C
The theoretical values for QC,min and QH,min will be difficult to achieve in practice. The reasons for this are the difficulties of handling process streams that are polluted, corrosive or simply out of the way. Nevertheless the pinch analysis gives a good indication and overview of what is possible. Another way to demonstrate the heat demand of processes in a system is the grand composite curve (GCC). To construct the GCC curve, the hot composite curve (HCC) and the cold composite curve (CCC) are moved by ½* ΔT towards each other, so that they touch at the Pinch. The horizontal difference between the two curves is now drawn into a new T-H graph which then gives the GCC. This is

Task 33/IV – Potential for Solar Heat in Industrial Processes
11
Solar
another way to show a heat source/sink profile of a process. If the heat flux increases with increasing temperature, the process functions as heat sink (more energy is needed at this temperature than is given). If the heat flux increases with lowering the temperature, the process can act as a heat source.
Fig. 6 Overlapping of HCC and CCC (a) and design of the GCC (b)
The main aim of the GCC is to identify the ideal external energy sources that are necessary to heat up or cool down different streams. By analysing which heat sources can transfer heat to heat sinks of the processes, the remaining heat demand is only covered by external energy sources if no internal heat is available. It is also possible to see at which temperature the external resource should be supplied (see Fig. 7). It is important to notice that the GCC is crucially dependent on the choice of ΔTmin of the heat-exchanger.

Task 33/IV – Potential for Solar Heat in Industrial Processes
12
Solar
Fig. 7 GCC and analysis of heat sources and sinks. External energy sources (shown with lines) with too
high/low temperature and therefore high exergy loss (a) and with ideal temperature choice (b)
3.3 PE² “Pinch Energy Efficiency” – a new software tool
PE² is a programme to improve the energy efficiency in a production plant and to determine the minimal external energy demand necessary in a given system. It analyses all heat sinks (cold streams that need to be heated) and heat sources (hot streams that need to be cooled or can act as energy supply) in a production process by applying the Pinch Methodology that has been described in detail above. The result of the calculation of the programme is a heat exchanger network for a production system based on real process data. The economics of each heat exchanger and the overall heat exchanger network is calculated taking into account current energy costs and a dynamic cost calculation. The overall savings in terms of economics and energy demand are displayed as a decision basis for changes within the energy supply system. There are other software programmes for applying the pinch analysis; however, no software so far has been designed for the low and medium temperature range in particular. PE² also steps further than current software programmes: besides the possibility to design heat exchangers manually, it offers a mathematical calculation for the heat exchanger network that leads to the greatest savings in terms of kWh and costs. This focus on energy savings (kWh) instead of power (kW) is necessary as many processes in industry are not running continuously and for the possible heat recovery between processes that run timely shifted the calculations need to focus on the energy savings per year. This is necessary as many processes in industry are not running continuously and for the possible heat recovery between processes that run timely shifted the calculations need to focus on the energy savings per year. The programme offers a user friendly environment for energy efficiency calculations, is compatible with Microsoft Excel® for importing data and generates a report in Microsoft Excel® with all necessary data and figures.

Task 33/IV – Potential for Solar Heat in Industrial Processes
13
Solar
An important feature is the compatibility with the widely known software “Sankey-Editor”, that visualizes energy flows and energy balances. The two software tools can be used separately. PE² also generates an automatic visualization of the improvements of the energy demand of the processes in the form of Sankey diagrams. During the IEA Task 33/IV the programme could be discussed and evaluated among a number of experts and has been critically reviewed. With publication of this booklet, also the first edition is released for public distribution and future amendments are planned in particular for a closer link to solar simulation programmes. The results of PE² are the following: Clear demonstration of the energy household of a system of processes, by illustrating the energy
demand in its different temperature ranges Calculation and display of the amount of energy that theoretically might be exchanged between hot
and cold processes Calculation and display of the amount of heat that has to be supplied by external energy sources
and the temperature range required. Display of all processes in a data grid where heat exchangers can be designed and calculated. Manual input of a heat exchanger – automatically calculation of the heat load (in kW) saved by the
heat exchanger. Display of the supply and target temperatures of the streams entering the heat exchanger.
Automatic calculation of an ideal heat exchanger network (based on mathematical criteria aiming at maximum savings in terms of energy savings in kWh per year). Possibility to enhance the theoretical network by manual optimisation (including practical criteria).
Possibility to calculate heat exchanger surfaces and calculation of the investment costs. Calculation of dynamic costs resulting in the pay back period of a given heat exchanger network based on user defined economic data.
Diagrams on the development of important parameters (pinch temperature, heat exchanger surfaces, energy costs and savings, necessary external energy sources) over the change of ΔTmin.
Visualisation of energy savings with a Sankey diagramme.
Fig. 8 The start page of PE²

Task 33/IV – Potential for Solar Heat in Industrial Processes
14
Solar
4 Conclusion
With the “Matrix of Industrial Process Indicators” and the pinch programme PE² two strong tools for the implementation of solar heat into industrial processes have been developed. The optimization of a process is achieved by the integration of energy efficiency measures and heat exchange. The analysis for this optimization is done with the mathematical model of the Pinch Analysis. With the help of the Pinch Analysis the minimal heat and cooling demand of a process can be calculated and the theoretical possibilities of heat recovery are shown. The software PE² is particularly designed for processes running at low and medium temperature levels. Furthermore PE² offers a calculation for the heat exchanger network that leads to the greatest savings in terms of kWh and costs. After having gained a solution for optimizing a given process in terms of energy efficiency, an information tool is used that allows for further optimization and that might lead to changes of the process, changes of the energy distribution system or changes of the energy supply system. The “Matrix of Industrial Process Indicators” was designed as a decision support tool for solar experts and facilitates work with industry and the identification of suitable solar applications. The “Matrix of Industrial Process Indicators” provides solar experts with detailed information on general benchmark data, temperature levels of the processes, flow sheets of production lines and generic hydraulic schemes for solar integration. With the help of the “Matrix of Industrial Process Indicators” the ideal solution to implement energy efficiency measures and to integrate solar energy in industrial processes can be found.

Task 33/IV – Potential for Solar Heat in Industrial Processes
15
Solar
Appendix 1 – IEA Solar Heating and Cooling Programme
The International Energy Agency (IEA) is an autonomous body within the framework of the Organization for Economic Co-operation and Development (OECD) based in Paris. Established in 1974 after the first “oil shock,” the IEA is committed to carrying out a comprehensive program of energy cooperation among its members and the Commission of the European Communities. The IEA provides a legal framework, through IEA Implementing Agreements such as the Solar Heating and Cooling Agreement, for international collaboration in energy technology research and development (R&D) and deployment. This IEA experience has proved that such collaboration contributes significantly to faster technological progress, while reducing costs; to eliminating technological risks and duplication of efforts; and to creating numerous other benefits, such as swifter expansion of the knowledge base and easier harmonization of standards. The Solar Heating and Cooling Programme was one of the first IEA Implementing Agreements to be established. Since 1977, its members have been collaborating to advance active solar and passive solar and their application in buildings and other areas, such as agriculture and industry. Current members are: Australia Finland Portugal Austria France Spain Belgium Italy Sweden Canada Mexico Switzerland Denmark Netherlands United States European Commission New Zealand Germany Norway A total of 39 Tasks have been initiated, 30 of which have been completed. Each Task is managed by an Operating Agent from one of the participating countries. Overall control of the program rests with an Executive Committee comprised of one representative from each contracting party to the Implementing Agreement. In addition to the Task work, a number of special activities—Memorandum of Understanding with solar thermal trade organizations, statistics collection and analysis, conferences and workshops—have been undertaken. The Tasks of the IEA Solar Heating and Cooling Programme, both underway and completed are as follows: Current Tasks:
Task 32 Advanced Storage Concepts for Solar and Low Energy Buildings Task 33 Solar Heat for Industrial Processes Task 34 Testing and Validation of Building Energy Simulation Tools
Task 35 PV/Thermal Solar Systems Task 36 Solar Resource Knowledge Management Task 37 Advanced Housing Renovation with Solar & Conservation Task 38 Solar Assisted Cooling Systems Task 39 Polymeric Materials for Solar Thermal Applications Completed Tasks: Task 1 Investigation of the Performance of Solar Heating and Cooling Systems Task 2 Coordination of Solar Heating and Cooling R&D Task 3 Performance Testing of Solar Collectors Task 4 Development of an Insolation Handbook and Instrument Package Task 5 Use of Existing Meteorological Information for Solar Energy Application Task 6 Performance of Solar Systems Using Evacuated Collectors Task 7 Central Solar Heating Plants with Seasonal Storage

Task 33/IV – Potential for Solar Heat in Industrial Processes
16
Solar
Task 8 Passive and Hybrid Solar Low Energy Buildings Task 9 Solar Radiation and Pyranometry Studies Task 10 Solar Materials R&D Task 11 Passive and Hybrid Solar Commercial Buildings Task 12 Building Energy Analysis and Design Tools for Solar Applications Task 13 Advance Solar Low Energy Buildings Task 14 Advance Active Solar Energy Systems Task 16 Photovoltaics in Buildings Task 17 Measuring and Modeling Spectral Radiation Task 18 Advanced Glazing and Associated Materials for Solar and Building Applications Task 19 Solar Air Systems Task 20 Solar Energy in Building Renovation Task 21 Daylight in Buildings Task 23 Optimization of Solar Energy Use in Large Buildings Task 22 Building Energy Analysis Tools Task 24 Solar Procurement Task 25 Solar Assisted Air Conditioning of Buildings Task 26 Solar Combisystems
Task 28 Solar Sustainable Housing Task 27 Performance of Solar Facade Components Task 29 Solar Crop Drying Task 31 Daylighting Buildings in the 21st Century
Completed Working Groups:
CSHPSS, ISOLDE, Materials in Solar Thermal Collectors, and the Evaluation of Task 13 Houses To find Solar Heating and Cooling Programme publications and learn more about the Programme visit www.iea-shc.org or contact the SHC Executive Secretary, Pamela Murphy, e-mail: [email protected].

Task 33/IV – Potential for Solar Heat in Industrial Processes
17
Solar
Appendix 2 – Task 33/IV Solar Heat for Industrial Processes
Task 33/IV was a collaborative project of the Solar Heating and Cooling Program and the SolarPACES program of the International Energy Agency (IEA) in which 16 institutes and 11 companies from Australia, Austria, Germany, Italy, Spain, Portugal, Mexico were involved. The aim of the project was the development of solar thermal plants for industrial process heat.
To reach this goal, studies on the potential for this technology were carried out for the countries involved, medium-temperature collectors were developed for the production of process heat up to a temperature of 250°C, and solutions were sought to the problems of integrating the solar heat system into industrial processes.
In addition, demonstration projects were realised in cooperation with the solar industry.
Knowledge was transferred to industry via industry newsletters, by holding relevant conferences as well as through the following four booklets:
• Design Guidelines - Solar Space Heating of Factory Buildings • Medium Temperature Collectors • Pilot Plants - Solar Heat for Industrial Processes • Potential for Solar Heat in Industrial Processes
Further information: www.iea-shc.org/task33
TASK 33/IV Participants
Operating Agent: Werner Weiss AEE INTEC Feldgasse 19 A-8200 Gleisdorf, Austria
Australia Wes Stein Lucas Heights Science & Technology Centre New Illawarra Rd, Lucas Heights NSW, PMB 7 Bangor NSW 2234
Austria Werner Weiss, Dagmar Jähnig and Thomas Müller AEE INTEC AEE - Institute for Sustainable Technologies Feldgasse 19 A-8200 Gleisdorf
Italy Riccardo Battisti, Annalisa Corrado Claudia Vannoni, Serena Drigo University of Rome "La Sapienza" Department of Mechanical and Aeronautical Engineering Via Eudossiana 18 00184 Rome
Hans Schnitzer and Christoph Brunner Joanneaum Research Elisabethstrasse 16/1 A-8010 Graz Gernot Gwehenberger Technical University of Graz RNS Inffeldgasse 25c A-8010 Graz
Mexico Claudio Estrada CIE-UNAM Privada Xochicalco, S/N, Col. Centro Cuernavaca, Mor., Mexico
Germany Klaus Vajen and Elimar Frank Kassel University Department of Mechanical Engineering Solar and System Technology D-34109 Kassel

Task 33/IV – Potential for Solar Heat in Industrial Processes
18
Solar
Andreas Häberle PSE GmbH Emmy-Noether Str. 2 D-79110 Freiburg
Portugal Maria Joao Carvalho INETI Edificio H, Estrada do Paço do Lumiar, 22 1649-038 Lisboa
Klaus Hennecke DLR Institut für Technische Thermodynamik D-51170 Köln
Spain Esther Rojas Bravo CIEMAT-PSA Avda. Complutense, 22, Edificio 42 28040 Madrid Gonzalez i Castellví AIGUASOL Engineering C/ Roger de Llúria, 29 3er 2a 08009 Barcelona Hans Schweiger Ingeniería Termo-energética y Energías Renovables Creu dels Molers, 15, 2o 1a 08004 Barcelona
Matthias Rommel Fraunhofer ISE Heidenhofstrasse 2 D-79110 Freiburg Stephan Fischer ITW, Stuttgart University Pfaffenwaldring 6 D-70550 Stuttgart Markus Peter dp2 - Energienutzung mit Verstand Michelsweg 29 D- 59494 Soest
