potential for power trade in western part of south asia
TRANSCRIPT

Potential for Power Trade in Western Part of South Asia :Techno-Economic Rationale
SOUTH ASIA REGIONAL INITIATIVE FORENERGY INTEGRATION (SARI/EI)

Report is prepared by:
SARI/EI Project Secretariat, IRADe
Mr. V. K. Kharbanda, Project Director Mr. Rajiv Ratna Panda, Head-Technical
August, 2016
DISCLAIMER:
This study is made possible by the support of American people through the United States Agency for International Development (USAID). The content of this study do not necessarily reflect the views of USAID of the United Sates Government.
Integrated Research and Action for Development (IRADe) does not guarantee the accuracy of the data included in this publication and accepts no responsibility for any consequences of their use. By making any reference to a particular geographic area, or by using the term “country’’ in this document, IRADe does not intend to make any judgement as to the legal or other status of any area.
The information/data as existed in public domain and obtained/collected from the various primary and secondary sources as on July, 2016 has been used on an “as-is” basis without any independent verification by IRADe. IRADe shall not be responsible in any manner whatsoever for any error or omissions, or for the results obtained from the use of this information and provides no assurance regarding the accuracy, timeliness, adequacy, comprehensiveness and/ or completeness of such information. IRADe shall not be liable for any losses and damages arising as a result of any inaccuracy or inadequacy or incomprehensiveness or incompleteness of such information.
Any changes and updating made in data/information after July, 2016 has not been incorporated as a part of this study. This study analysis and report concluded in the month of August, 2016. The report and its findings do not necessarily reflect the views of SARI/EI Project Secretariat. The report can be considered as a base document for further analysis and the reports aims to stimulate further discussion and analysis for accelerating Cross Border Electricity Trade in the South Asian Region.
© Integrated Research and Action for Development (IRADe) 2016.
All rights reserved. Do not copy or quote without prior permission. No part of this report can be reproduced or utilized in any form or by any means, electronic or mechanical, including photocopying, recording, or by any information storage and retrieval system, without prior permission (for seeking permission contact [email protected]) in writing from Integrated Research and Action for Development.
IRADe-SARI-08 (August 2016)

Potential for Power Trade in Western Part of South Asia :Techno-Economic Rationale
SOUTH ASIA REGIONAL INITIATIVE FORENERGY INTEGRATION (SARI/EI)
August 2016


iii
Contents
Abbreviations v
Preface 01
1 Introduction 02
2 South Asian Cross Border Energy Trade 03
3 CountryProfile 09
4 CBET PotentialinWesternPartofSouthAsia 20
5 Techno-EconomicRationale 24
WayForward 31
Bibliography 32
Acknowledgements 33
FigureFigure1: PowerSectorProfile 03
Figure2: LoadSheddinginBangladesh 06
Figure3: PowerPurchaseCostinBangladesh 06
Figure4: BhutanGDPGrowth 07
Figure5: ElectricityExporttoIndia 07
Figure6: PeakDemand-SupplyScenarioinIndia 09
Figure7: EnergyAvailabilityScenarioinIndia 10
Figure8: PeakDemandandEnergyRequirementForecast-India 10
Figure9: Demand-SupplyScenarioinPunjab(India)(GW) 11
Figure10:Punjab(India)EnergyAvailability 11
Figure11:EnergyConsumptionProfile-Punjab(India) 12

iv
Potential for Power Trade in Western Part of South Asia : Techno-Economic Rationale
Figure12:PowerTradingArrangementinIndianMarket 13
Figure13:IndianPowerMarket-STPriceTrends 13
Figure14:PakistanPowerSectorProfile 14
Figure15:GenerationmixofPakistan 14
Figure16:EnergyMixbyFuelinPakistan 15
Figure17:PakistanDemand-Supply 15
Figure18:Fuel-wiseGenerationTariffinPakistan2015 17
Figure19:GenerationTariffsforFuturePlants 17
Figure20:Afghanistan’sInstalledCapacity(MW)-2016 18
Figure21:Afghanistan’sEnergySupplyScenario 19
Figure22:PowerTradingPotentialbetweenIndiaandPakistan(2018-2034) 21
Figure23:CASA1000Project 22
Figure24:Pakistan–IndiaInterconnection 24
Figure25:Stage1–200MWTransferCapacityinRadialMode 25
Figure26:Stage2–500MWHVDCSub-station 25
Figure27:ImplementationSchedule 26
TablesTable1: EnergyResourcePotentialinSouthAsia 04
Table2: SouthAsianRegionInterconnections 05
Table3: PakistanGenerationAdditionbyFY2020 16
Table4: CASATariff 17
Table5: ReferenceCostofSimilarProjects 26
Table6: InterconnectionProjectEstimatedCost 26
Table7: PowerTariffsinIndia 28
Table8: Cost-BenefitoftheProject 29

v
Potential for Power Trade in Western Part of South Asia : Techno-Economic Rationale
AC AlternatingCurrent
ADB AsianDevelopmentBank
APPC AveragePowerPurchaseCost
BDT BangladeshiTaka
BPDB BangladeshPowerDevelopmentBoard
BU BillionUnits
CAGR CompoundAnnualGrowthRate
CASA CentralAsiaSouthAsia
CBET Cross-BorderElectricityTrade
CEA CentralElectricityAuthority
D/C DoubleCircuit
EPS ElectricPowerSurvey
FO FurnaceOil
GW Gigawatt
GWh GigawattHours
HSD HighSpeedDiesel
HVAC HighVoltageAlternatingCurrent
HVDC HighVoltageDirectCurrent
IEX IndianEnergyExchange
IPP IndependentPowerProducers
kM Kilometer
kV Kilovolt
MW Megawatt
Abbreviations

vi
Potential for Power Trade in Western Part of South Asia : Techno-Economic Rationale
MWh MegawattHour
NTDC NationalTransmissionandDispatchCompanyLtd
NTPC NationalThermalPowerCorporation
PEPCO PakistanPowerElectricCompany
PPA PowerPurchaseAgreements
PXIL PowerExchangeIndiaLimited
SAARC SouthAsianAssociationforRegionalCooperation
SAFTA SouthAsianFreeTradeArea
SEC SAARC Energy Centre
SPV SpecialPurposeVehicle
T/L TransmissionLine
TWh TeraWatthouror1BillionkWh
USD UnitedStatesDollars
WBSEDCLWestBengalStateElectricityDistributionCompany

01
Potential for Power Trade in Western Part of South Asia : Techno-Economic Rationale
SouthAsiaRegionalInitiativeforEnergyIntegration(SARI/EI),aprogramofUSAIDbeingimplementedbyIntegratedResearchandActionforDevelopment(IRADe),aimstopromotetheintegrationofenergysystemsandalsotoenhanceCross-BorderElectricityTrade(CBET)amongtheSouthAsiancountries.Theprogramfocusesonthreekeyoutcomesfortheoverallsocio-economicprogressoftheregion:
y Harmonisation/coordinationofpolicy,regulatory,andlegalissues
y Advancement of transmission systems interconnections
y EstablishmentofSouthAsiaRegionalElectricityMarkets
TheeightSouthAsiannations(Afghanistan,Bangladesh,Bhutan,India,theMaldives,Nepal,Pakistan,andSriLanka)collectivelyaccountforoverone-fifthoftheworld’spopulation.All theSouthAsiancountries are currently facing power and energy shortages which is negatively impacting theireconomy. Adequate supply of energy is a pre-requisite for all the development pursuits in SouthAsiarangingfromeconomicprogresstoscientificresearch,education,healthcare,qualityoflife,andprosperityintheregion.Intherecentpast,SouthAsiahasbeenoneofthefastestgrowingregionsintheworld,withanaverageannualgrowthrateof6percentasmeasuredbyGDPpercapita.Despitethisimpressivemacroeconomicgrowth,theenergysectorintheSouthAsianregionhasnotbeenabletokeeppace,andcontinuestoexperiencechronicproblemslikeshortageofsupplyandpoorqualityofservice.Giventhisdilemmatheonlylong-termsolutionisthesustainedincreaseinregionalenergycooperationandadvancing/acceleratingCBETamongSouthAsiannations.
TheintegrationofpowergridandCBETtotheextentof2300MWintheeasternpartofSouthAsiaisalreadyestablished,betweenBangladesh-India(600MW),Bhutan-India(1416MW),andNepal-India(~500MW),thoughthereisahugepotentialofCBETintheregionandtradeislikelytoenhanceinfuture.
Therefore,theintegrationofpowersysteminthewesternpartofSouthAsiawillbeanimportantstepinthedirectionofadvancing/acceleratingCBETintheSouthAsiaRegion.ThefutureprospectsforCBETare immense; fromacompletely integratedSouthAsiangrid,wherepowercouldbe tradedacrosstheregion,subsquentelytoapaninter-regionalintegrationbetweenCentralAsianandSouthEastAsia.
Thisstudyreportdescribesthecurrent landscapeandevaluatesthefutureoptionsofpotential forpowertradeinwesternpartofSouthAsia.
Preface

02
Potential for Power Trade in Western Part of South Asia : Techno-Economic Rationale
1.1 Objective of the StudySouthAsiaRegionalInitiativeforEnergyIntegration(SARI/EI)programofUSAIDisworkingtowardspromotingthedevelopmentofintegratedregionalpowermarketinSouthAsiatofacilitatepowertradeamongsttheSAARCcountries.ThepasteffortsunderthisprogramhavebroughtaboutarecognitionofthebenefitsofCross-BorderElectricityTrade(CBET)intheregionformeetingelectricityrequirementsofrespectivecountriesandalsoaddressingtheenergysecurityoftheregion.
This study is an endeavor to complement the increasingacceptanceofCBET in theSouthAsianregionforsustainabledevelopmentofthepowersectorintheregion.WithinSouthAsia,therehavebeenseveralsuccessful initiatives for interconnectionon theeasternside, involving India,Bhutan,BangladeshandnowNepal.AtrulyintegratedSouthAsianregionalpowergridwillberealisedoncethereisconnectivityonthewesternsideofSouthAsiainvolvingIndia,PakistanandAfghanistan.
AkeyelementofintegratingthepowersysteminthewesternpartofSouthAsiaistheIndia–Pakistaninterconnection,whichhasbeenthesubjectofvariousstudiessince1990sandseveralpre-feasibilitystudieshavebeenundertakeninthepasttoidentifythemostsuitableconnectivitybetweenthetwocountries.Thisreportevaluatestheprofiles/optionsforpowertransmissioninterconnectionandpowertradingopportunitiesamongthewesternpartofSouthAsiancountriesinthechangingcontextandprovidesconclusionsonthepotentialforpowertradebasedonthetechno-economicrationaleofthepossiblealternatives.
1 Introduction

03
2.1 BackgroundThe regional cooperation offers an ideal platform to achieve sustainable growth through sharingofavailablenatural resources in the region. In thecontextofenergysector, it isapplicable to theSAARCmembercountries,wherethereisavastdiversityofavailableenergyresources,particularlyhydropowerandrenewable,whicharestillunderdevelopment.Thefigure-1providesasnapshotofpowersystemsinSouthAsia:
Figure 1: Power Sector Profile
India
Bangladesh
Bhutan
Sri Lanka
Maldives
India
Nepal
Bhutan
Bangladesh
Afghanistan
Maldives
Sri LankaUnder developed Hydro potential
• Fragmented and very small power systems
• Diesel dependent• Limited possibility of
interconnection
• Small power system with high gas dependence
• Interconnected with India• Declining Gas reserves
• Largest energy consumer and supplier in region
• Large coal reserves• Dependent on import of oil & gas• Interconnections with Nepal,
Bhutan and Bangladesh
• Very small power system• Large hydro potential• Net exporter of power
to India
• Small power system• Under-utilized hydro potential• Net importer now but
potential to export in future
Pakistan• Mid-sized power system• Gas and Oil dependent• Proposed interconnection with
Central Asia & Afghanistan• Small power system• Proposed
interconnection with Central Asia and Pakistan
Theregionisendowedwithlimitedfossilfuelsbutamplehydroresources.Inadditiontotheconventionalenergyresources,therearehugerenewableenergyresourcessuchassolarandwind,asshownintable-1onnextpage.
Thedominanceofcertainfueltypes–coalinIndia,gasinBangladesh,petroleuminPakistan,hydropower inBhutanandNepal- leadstoover-dependenceontheseresourcesatacountry levelandleavesthemvulnerabletosupplysiderisks.Thereisaneedtohavediversityinenergysupplymixaswellasimprovetheenergyaccessforthelargepopulationinthesecountrieswhoaredeprivedofthebenefitsofelectricity.Thereisalsoaneedtobalancetheconventionalsourceswiththerenewableenergyresourcesformanagingtheclimatechangeeffectsinthesub-continent.
Allthecountriesintheregionarefacingsimilarchallengesofrisingcostofelectricitysupplyandhasanurgentneedtoimprovetheaccesstoelectricityforalargesectionofpopulation.Therearehuge
2South Asian Cross Border Energy Trade

04
Potential for Power Trade in Western Part of South Asia : Techno-Economic Rationale
Table 1: Energy Resource Potential in South Asia
Country/ Fuel Source
Coal (Million Tonnes)
Oil (Million Barrels)
Natural Gas
(Trillion Cubic Feet)
Biomass (Million Tonnes)
Hydropower (MW)
Solar (kwh/sq m/day)
Wind (MW)
Afghanistan 440 NA 15 18–27 25,000 NA Limited
Bhutan 2 0 0 27 30,000 2.5-5 4,825
Bangladesh 884 12 8 0.08 330 3.8-6.5 Limited
India 90,085 5,700 39 139 1,50,000 4-7 151,918
Maldives 0 0 0 0.06 0 NA NA
Nepal NA 0 0 27 83,000 3.6-6.2 3,000
Pakistan 17,550 324 33 - 59,000 5.3 24,000
SriLanka NA 150 0 12 2,000 NA 25,000
Total 1,08,961 6,186 95 223-232 3,49,000
Source:BackgroundPaperonCross-BorderElectricityTradeinSouthAsia:KeyPolicy,RegulatoryIssues/ChallengesandtheWayForward,Jan2016-IRADe
opportunitiesforoptimisationofresourcesthroughinterconnectedpowersystemsacrosstheregionwhichcanaddressthesechallenges.Theregionalenergytradehasthepotentialtodeliversignificanteconomicbenefitsaswellasimprovethereliabilityofpowerinanenvironmentfriendlymanner.
Thedominanceofcertainfueltypes–coalinIndia,gasinBangladesh,petroleuminPakistan,hydropower inBhutanandNepal- leadstoover-dependenceontheseresourcesatacountry levelandleavesthemvulnerabletosupplysiderisks.Thereisaneedtohavediversityinenergysupplymixaswellasimprovetheenergyaccessforthelargepopulationinthesecountrieswhoaredeprivedofthebenefitsofelectricity.Thereisalsoaneedtobalancetheconventionalsourceswiththerenewableenergyresourcesformanagingtheclimatechangeeffectsinthesub-continent.
All thecountries in the regionare facingsimilar challengesof risingcostof electricity supplyandhasanurgentneedto improvetheaccesstoelectricity fora largesectionofpopulation.Therearehuge opportunities for optimisation of resources through interconnected power systems acrossthe region which can address these challenges. The regional energy trade has the potential todeliver significanteconomicbenefitsaswell as improve the reliabilityofpower inanenvironment friendlymanner.
2.2 Key CBET Initiatives in South Asian RegionOver the past decade, there has been a growing realisationamongst the SAARC nations, onthe importance of improving the energy situation in their respective geographies and the rolewhich the regional Cross Border Energy Trade can play in meeting their individual electricityneeds. The agreement for a South Asian Free Trade Area (SAFTA), signed in 2004, envisioned a transition towardsa commonmarket. TheSAARCEnergyCentre (SEC); established in 2006as aSpecialPurposeVehicle(SPV)withitsbaseinIslamabad,Pakistan;alsohasafocusonregionalenergysectorcooperationinSouthAsia.Further,theSAARCInter-governmentalFrameworkAgreementonEnergy(electricity)Cooperation,signedamongSAARCmemberstates,laysthefoundationfordeeperpowersectorcooperationandenhancingCBETintheregion.

05
Potential for Power Trade in Western Part of South Asia : Techno-Economic Rationale
ThekeyinitiativesforpowertradinginSouthAsiahavepredominantlybeenthebilateralarrangementsbetweencountries.ThebilateralarrangementsbetweenIndia-BhutanandIndia-Nepalforgenerationand transmission system have provided opportunities to unleash the huge hydropower potentialavailable inbothBhutanandNepal.ThiscleansourceofenergycanbeusedtomeetthegrowingelectricitydemandinSouthAsia.Morerecently,thedevelopmentandgrowthintheIndia-Bangladeshpowertradehasopenednewavenuesforacollaborativeregionalmarket.Thetable-2belowillustratestheexistingandproposedinterconnectionsforCBETbetweenSouthAsiancountries.
Table 2: South Asian Region Interconnections
Interconnection Key Features
Bhutan–India y Totalexportcapacityofaround1,416MWfromTala,ChukhaandKurichhu y TransmissionandassociatedinfrastructureforPunasangchhuI&II(2220MW)andMangdechu(720MW)HEPsunderconstruction
y Capacityof10,000MWforexporttoIndiatobedevelopedinBhutanundertheUmbrellaAgreementsignedbetweenthetwocountries
Bangladesh–India y 500MWpowerisbeingsuppliedfromIndiavia400kVBehrampur-BheramaralinewithHVDCstationatBheramara
y 400kV(chargedat132kV)Tripura–Comillatransmissionlinetotransfer100MWpowertoBangladeshinradialmode
y AugmentationofHVDCbacktobackstationcapacityatBheramaraby500MWunder construction
Nepal–India y Multipleinterconnectionsat11kVto132kVwithcapacityofaround150MW y 400kVMuzaffarpur-Dhalkebarline(currentlychargedat220kV)willultimatelyhavecapacityofaround1000MW
2.3 CBET Experience in South Asia
2.3.1 BANGLADESH – INDIA ELECTRICITY TRADE
ThecrossborderelectricitytradebetweenBangladeshandIndiawasinitiatedinOctober2013withthecommissioningofBheramara(Bangladesh)–Baharampur(India)400kVback-to-backHVDClinkof500MWcapacitycomprisingoffollowingelements:
y Bangladeshside:27kmofBaharampur(India)–Bheramara(Bangladesh)400kVdoublecircuitline,a3kmloop-in,loop-outofIshurdi–KhulnaSouth230kVdoublecircuitlineatBheramaraanda500MWHVDCback-to-backstationand230kVswitchingstationatBheramara
y Indiaside:71kmofBaharampur(India)–Bheramara(Bangladesh)400kVdoublecircuit line,a3kmloop-in, loop-outofFarakka–Jeerat400kVsinglecircuit lineatBaharampurand400kVswitchingstationatBaharampur
Bangladeshpowersectorhadfacedseveralchallengesintherecentpast.Theseincluded:
y Hugepowerdeficit,whichislikelytocontinueinthemedium-term,duetogrowingdemandandlimitedaccesstonewgenerationsourcesintheshorttomedium-term
y Increased procurement cost of power due to reduced availability of gas which resulted independenceonpetroleum/oilbasedgeneration
y Rising demand for electricity combinedwith the need to improve energy access for the largesectionofpopulation

06
Potential for Power Trade in Western Part of South Asia : Techno-Economic Rationale
TheBangladesh–IndiainterconnectionhasbeenbeneficialtoBangladeshinsolvingseveralprevailingproblemsbeingfacedbyitspowersector:
1. Reduced load shedding due to increased availability of power from India
TheBangladeshutilitieshadtoresorttoloadsheddingforallcategoriesofconsumersduetoreducedgenerationcapacity.Theadditionof500MWfromimportofIndianpowerhasimprovedtheoverallloadsheddingsituationsince2013.
Figure 2: Load Shedding in Bangladesh
6,454 6,7657,518
8,3499,268
10,283
4,606 4,890
6,066 6,4347,356 7,817
1,459 1,335 1,058 1,048 932307
0
2,000
4,000
6,000
8,000
10,000
12,000
FY 10 FY 11 FY 12 FY 13 FY 14 FY 15
Max Demand (MW) Max Peak Generation (MW) Max Load Shedding (MW)
Source:BPDBAnnualReport2014-15
2. Reduction in power purchase cost
ThetariffofpowerimportedfromIndiaislowerthantheaveragepowerpurchasecostinBangladesh.Hence,theoverallprocurementcostofpowerforBangladeshPowerDevelopmentBoard(BPDB),whoisthesoleprocurerofpowerinBangladesh,hasreducedastheimportfromIndiaisatalowerratethantheAveragePowerProcurementCost(APPC).TheestimatedsavingsfromtheenergytransferwouldbearoundUSD500Millionperyear(Shahi2014).
Figure 3: Power Purchase Cost in Bangladesh
4.73
6.32
8.90
3.62
5.62
-
123456789
10
BPDB IPP Rental PublicPlants
Import from India
Avgpower purchase cost: 6.27 Tk/KWh
Taka
/Uni
t
Source:BPDBAnnualReport2015
In addition, India and Bangladesh have recently commissioned the 27 km 400 kV double circuittransmissionlinefromComillainBangladeshtoTripurainIndiaalongwithassociatedworksatComilla

07
Potential for Power Trade in Western Part of South Asia : Techno-Economic Rationale
(132kVbayextensionand18km132kVtransmissionline)toimport100MWpowerfromPalatanapowerstationinTripurainradialmode.TheestimatedprojectcostofextensionoftransmissionlineisBDT1,720Million(USD22Million).
Thebenefitsofthecrossbordertradehasbeenrecognisedbyboththecountriesandhasresultedinproposaltorampupthetransmissioncapacity.TheAsianDevelopmentBank(ADB)financedtheprojecttoaugmenttheexistingBheramaraHVDCStationCapacitybyadditional500MWtofacilitateoverall1000MWofpowertransferbetweenBangladeshandIndiathroughtheexistinginterconnection,whichiscurrentlyunderimplementationandislikelytobecompletedby2019.
2.3.2 BHUTAN - INDIA ELECTRICITY TRADE
Bhutan has a huge hydro potential but has limited demand. TheCrossBorder Energy Trade has providedBhutananaccesstogrowingIndianpowermarket.Sinceyear2003,hydropowerdevelopmenthassignificantlycontributedtoBhutan’sGDPasshowninthefigurebelow:
Figure 4: Bhutan GDP Growth
5%
10%
15%
20%
25%
30%
35%
40%
0
0.5
1
1.5
2
2.5
3
FY 2000
FY 2001
FY 2002
FY 2003
FY 2004
FY 2005
FY 2006
FY 2007
FY 2008
FY 2009
FY 2010
FY 2011
FY 2012
FY 2013
FY 2014
FY 2015
FY 2016
Gro
wth
(%)
GD
P (U
SD
Bill
ion)
GDP (USD Billion) Percentage growth
TalaHydro (1020 MW)
-10%
-5%
0%
Source:IMFEstimates
Figure 5: Electricity Export to India (USD Million)
30.00 30.01 30.3 30.4 30.6 30.7
17.01%
14.40%
10.74% 11.52%10.19% 10.14%
30.10
30.08
30.06
30.04
30.02
30.00
29.98
29.962010 2011 2012 2013 2014 2015
Export (USD Million) Export (% of GDP)
Source:BhutanPowerSectorReport

08
Potential for Power Trade in Western Part of South Asia : Techno-Economic Rationale
TheenergysaleswithinBhutanhasreachedthreetimesoverpastonedecadeandhasalsoledtodevelopmentofenergyintensiveindustrieslikeCement,IronandSteel,Carbide,etc.TheelectricityaccesshasimprovedinBhutan(76percentin2012)asaresultofhydropowerdevelopment.
The electricity exports to India have alsobeen steadily risingover the last decade. In addition tocontributingtotheGDP(morethan10percent),thedevelopmentofhydropowerpotentialhasalsoindirectlycontributedtotheoveralldevelopmentofBhutaneseeconomy.
2.4 Case for CBET in Western Part of South AsiaIn South Asia, the power systems in India-Bangladesh-Bhutan-Nepal have been interconnectedoverpastdecadeasaresultofseveralbilateralinitiatives.Thishasopenedupopportunitiesfortheevolutionofaneasternsub-regionalgridwithinSouthAsia.ThehugehydropowerpotentialinBhutan(estimatedcapacitydevelopedtobe11GWby2020)andNepal(economicpotentialisestimatedtobe42GW),canbedevelopedandtransmittedtoloadcenterstomeettheexponentiallyincreasingelectricitydemandinBangladeshandIndia.
On itswestern side, Pakistan already has limited connectivity to Iran’s power systemand is alsoan integral part of the CASA 1000 scheme. Under this scheme,over 3 Terawatt hours (TWh) ofhydroelectricityisproposedtobetransferredduringthesummermonthsfromCentralAsiancountriesofKyrgyzRepublicandTajikistantoPakistanthroughAfghanistaninSouthAsia.Currently,thereisnoconnectivityforpowertransferbetweenPakistanandIndia.TheinterconnectiononthewesternsideinvolvingIndia,PakistanandAfghanistanisimportantfortheoverallevolutionoftheSouthAsianregionalgrid.
The interconnectionbetweenPakistanand Indiahas thepotential tobringaboutan integration inthepowersystemsofCentralAsiancountriesandSouthAsiancountries.ThehydropowerpotentialinthesecountriescancomplementthepredominantlycoalbasedthermalpowergenerationinIndiatocreateastablepowersystem,whichismutuallybeneficialtotheconstituentsofboththeregions.According to ADB report (2013)1, the benefits fromCASA 1000 project in conjunctionwith India-Pakistan interconnectioncanyield substantivesavingsexceedingUSD1Billion,primarily throughreductioninunservedenergyinAfghanistan,PakistanandIndia.
Intheshort tomedium-term,the interconnectionbetweenPakistanandIndiacanbenefitPakistanandpossiblyAfghanistaninmeetingthegenerationdeficitatacompetitiveprice.Inthelong-term,theinterconnectedsysteminSouthAsiawillprovideopportunitiesforthenewcapacityadditionswithinPakistantoseekpowerdeficientmarketsinSouthandCentralAsia.TheSouthAsianregionalgridwillimprovetheelectricityaccessforthepopulationwhiledrivingthedevelopmentofefficientanddiversegenerationcapacities.
1 RDTA 7529: South Asian Regional Power Exchange Study – Final Report

09
Potential for Power Trade in Western Part of South Asia : Techno-Economic Rationale
Inthefollowingsection,thecurrentandfutureprofilesofpowersectorinIndiaandPakistanhavebeenassessedtounderstandandevaluatethepowertradingpotentialbetweenthetwocountries.
3.1 INDIAIndia’spowergenerationcapacitycurrentlystandsat303GW(June,2016)andhasfourthrankintheworld.This isasignificant increasefrom145GWattheendofFY2006,withaCompoundAnnualGrowthRate(CAGR)of7.7percent.TheenergymixforIndiaisdominatedbycoalwhichaccountsfor59percentofthetotalinstalledcapacity.ThesupplysituationinIndiahasdrasticallyimprovedoverthelasttwoyears.Thepeakdemandsupplydeficithasprogressivelycomedownoverlast5yearsandIndiaislikelytohavepeaksurplusduringFY2017.Thecoalsupplyhasalsoimprovedwithsurpluscoalcapacitybeingavailable.ThedominanceofcoalinIndia’senergyportfolioislikelytocontinueintheforeseeablefutureaswell.RenewableEnergyhasbeenoneofthefastestgrowingsegmentsofthepowersector,accountingfor17.6percentofthecurrentinstalledcapacity.ThegrowthinRenewableEnergyislikelytocontinueoveralong-termperiod,giventheambitioustargetswhichhavebeensetforsolarandwindsegments.
3.1.1 DEMAND-SUPPLY SCENARIO – PAN INDIA
The peak demand supply scenario has improved in India over the last few years as a result ofacceleratedgenerationcapacityadditionsandacomplementaryslowdowninthedemandgrowth.ForFY2017,thesituationislikelytoturnwithpeaksurplusof2.57percentasshowninthefigurebelow:
Figure 6: Peak Demand-Supply Scenario in India
119 122130
135 136
148153
160
104 110 116 123 130 141 148 157
-12.7%
-9.8%-10.6%
-9.0%
-4.5% -4.7%
-3.2%
-1.6%
-14%
-12%
-10%
-8%
-6%
-4%
0%
-
20
40
60
80
100
120
140
160
180
FY 2010 FY 2011 FY 2012 FY 2013 FY 2014 FY 2015 FY 2016 FY 2017
GW
Peak Demand Peak Supply Gap (%)
-2%
Source:MinistryofPower,GovernmentofIndia
3 Country Profile

10
Potential for Power Trade in Western Part of South Asia : Techno-Economic Rationale
Asimilartrendisalsoseenintheelectricitygenerationandavailability.India’selectricitydeficithasgraduallydecreasedover thepastdecade, from~10percent in2010to2.1percent in2016.Thecountryislikelytoexperienceenergysurplusduring2016-17asshowninthefigurebelow
Figure 7: Energy Availability Scenario in India
831 862 937
996 1,002 1,069 1,114
1,143
747 788 858 909 960 1,031 1,091 1,135
-10.11%
-8.50% -8.46% -8.73%
-4.23%-3.57%
-2.11%
-0.70%
-12%
-10%
-8%
-6%
-4%
-2%
0%
-
200
400
600
800
1,000
1,200
1,400
FY 2010 FY 2011 FY 2012 FY 2013 FY 2014 FY 2015 FY 2016 FY 2017
TW
h
Energy Requirement Energy Availability Surplus/ (Deficit)
Source:MinistryofPower,GovernmentofIndia
The 18th Electric Power Survey (EPS) report has analysed the future demand-supply and energysituationforIndia.ThereportestimatesthatIndia’speakdemandwouldbearound541GWinyear2032andelectricalenergyrequirementofaround3,700TWhasillustratedinthefigurebelow.
Figure 8: Peak Demand and Energy Requirement Forecast - India
200283
401
5421355
1905
2710
3710
0
500
1000
1500
2000
2500
3000
3500
4000
0
100
200
300
400
500
600
FY 2017 FY 2022 FY 2027 FY 2032
Pea
k D
eman
d (G
W)
Ene
rgy
Req
uire
men
t (T
Wh)
Peak Demand (GW) Energy Requirement (TWh)
Source:18thEPSReport,CentralElectricityAuthority

11
Potential for Power Trade in Western Part of South Asia : Techno-Economic Rationale
3.1.2 DEMAND-SUPPLY SCENARIO – PUNJAB (INDIA)
PunjabhasoneofthehighestpercapitaelectricityconsumptionstatesinIndiaandhasbeenabletoachieve100percentelectrificationwithinthestate.Thepeakdemandsupplygapforthestatehasbeenprogressivelycomingdownoverthelastfiveyearsasshownbelow:
Figure 9: Demand-Supply Scenario in Punjab (India) (GW)
-24.3%
-14.8% -15.6%
-21.2%
-12.2% -12.0%
-3.8% -3.1%-4.3%
-8.9%
-
2.00
4.00
6.00
8.00
10.00
12.00
14.00
16.00
FY 2010 FY 2011 FY 2012 FY 2013 FY 2014 FY 2015 FY 2016 FY 2017 FY 2018 FY 2019
Peak Demand Peak Supply Surplus/deficit
-30%
-25%
-20%
-15%
-10%
-5%
0%
Source:PFAReportsonPunjab
Theenergyavailability–requirementscenarioinPunjabhasbeenimprovingovertheyears.Asfarasenergyrequirementandthesupplyscenarioisconcerned,Punjabhasshowntremendousimprovementsince 2010. The state has attained surplus energy due to generation capacity additions over thepastfewyears.Theenergydeficithasdecreasedgraduallyfrom6,449GWhin2010toanegligibleshortagein2016.Thescenarioislikelytoimprovefurther,withtheadditionofthermalpowerprojectsinthestate.ThePowerFinanceCorporation(PFC)reportonPunjabforecastshugeenergysurpluswithinthestateinthecomingyearsasshownbelow:
Figure 10: Punjab (India) Energy Availability (TWh)
-13.9%
-6.0%-3.1%
-5.4%-1.6% -1.0%
36.8%
48.7%46.0%
37.2%
-16%
-6%
4%
14%
24%
34%
44%
54%
-10.00
20.00
30.00
40.00
50.00
60.00
70.00
80.00
90.00
100.00
FY 2010 FY 2011 FY 2012 FY 2013 FY 2014 FY 2015 FY 2016 FY 2017 FY 2018 FY 2019
Energy Requirement Energy Availability Surplus/ deficit
TWh
Source:PowerFinanceCorporationreportonPunjab

12
Potential for Power Trade in Western Part of South Asia : Techno-Economic Rationale
Punjab has a typical demand variation due to high agriculture load and the requirement is at itspeakduringthepaddyseason(JunetoSeptember).Around47percentofthetotalannualenergyrequirement isconsumedduring these fourmonthsand the requirementsignificantlydropsduringthe remaining part of the year. The state has surplus energy during the non-paddyperiod,whichis tradedthroughbilateralarrangementswithotherstates.The followingfigureshowsthemonthlyenergyprofileofPunjab(India):
Figure 11: Energy Consumption Profile - Punjab (India)
3.00
4.35
5.45
6.35 6.21
5.48
3.93
2.67
3.21 3.07 3.02 2.88
0.00
1.00
2.00
3.00
4.00
5.00
6.00
7.00
Apr-15 May-15 Jun-15 Jul-15 Aug-15 Sep-15 Oct-15 Nov-15 Dec-15 Jan-16 Feb-16 Mar-16
TW
h
Requirement (TWh)
Source:CEAReports
TherearesignificantopportunitiesfortradingthesurplusenergyavailablewiththestateofPunjabinfuture.ThissurpluscouldbeabsorbedwithintheNorthernRegioninIndiaorcanbetradedwithutilitiesinotherregionsaswell.
3.1.3 PRICING TRENDS IN INDIAN MARKET
ThepowermarketinIndiahasvariouscontractingarrangementsavailable,whichcandeterminethepriceoftransactionsbasedonopenmarketmechanism,asshowninfigure12.
ThepowerpricesinIndianmarketsareregulatedasperpurchasebythestatedistributioncompaniesareconcerned.Thegeneratorscanenterintolong-termPowerPurchaseAgreements(PPA)withthebuyerssuchasthedistributioncompaniesorpowertraders.Thepowerutilitiescanalsoenterintomediumtolong-termPPAstosellanysurplusenergyavailablewiththem.Thelicensedtraderscanactasintermediariestobuyandsellpowerbothinthemedium-termandlong-termmarkets.Inaddition,thetwoIndianexchangesviz.IndianEnergyExchange(IEX)andPowerExchangeIndiaLimited(PXIL)allowforshort-termandmedium-termpowertransactionstobebasedonthedemandandsupplybetweenthebuyersandsellers.For the internationalpowertrade, thereareseveraloptionswhichhavebeenimplementedinIndiancontext.ThesaleofpowerfromgeneratingstationsinBhutanistransactedthroughPTCIndiaLtd.whichisalicensedtrader.Morerecently,thesaleof80MWofpowerfromIndiatoNepalwasimplementedthroughNVVN,anotherlicensedpowertrader.Similarly,whenBangladeshPowerDevelopmentBoard(BPDB)contractedfor500MWofpowerinthefirstphase,250MWwasaffectedthroughPTCIndiaLtdfora3yearperiodandremaining250MWwassoldfromNTPCplants.ThepowersoldbyPTCIndiaLtd.wassourcedfromsurpluspoweravailablewithWestBengalStateElectricityDistributionCompany(WBSEDCL),justacrosstheIndia-Bangladeshborder.

13
Potential for Power Trade in Western Part of South Asia : Techno-Economic Rationale
Figure 12: Power Trading Arrangement in Indian Market
Long TermPower Purchase Agreements
Upto 25 Years
Medium Term
Power Exchanges (2)
Balancing Market
Real Time
Short Term
3 months-3 years
• Contingency Transaction• Day Ahead Transaction• Collective Transaction• Bilateral Transaction
Intraday -3 months
Bilateral TransactionsOver the Counter Trading (OTC)Licensed traders (47)
OTC Intraday-3 months
1. Intra-day2. Day Ahead Market (DAM)3. Day Ahead Contingency (DAC)4. Daily5. Weekly
Deviation Settlement Mechanism(DSM)
89% -91%
5% -6%
2% -3%
2% -3%
Themarketpriceforpoweronthepowerexchangehasbeenrangeboundoverlast5yearsasthedemandhasbeensuppressedandtheutilitieshavenotbeenprocuringpowerfromshort-termmarketduetostrictmonitoringbytheregulatorsonthepowerprocurementcosts.Thepricingtrendsforthetransactionsdoneby theTraders,PowerExchange–DayAheadMarketandTermAheadMarket,DSM–realtimeenergychargesforsixyearsisshownbelow:
Figure 13: Indian Power Market - ST Price Trends
8.09
7.37
6.43 6.66 6.60 6.58 6.32
5.43
7.63
5.34 5.49 5.65
4.46
5.38
4.18 3.85
-
1
2
3
4
5
6
7
8
9
FY 10 FY 11 FY 12 FY 13 FY 14 FY 15 FY 16 FY 17
Pric
ing
(US
cen
ts/
kWh)
Power Traders Power Exchange (DAM+TAM)
Source:CERCMonthlyMonitoringReports
3.2 PAKISTANThe installed generation capacity in Pakistan has increased at amodest CAGR of 1.55 per centbetween theperiodFY2011andFY2015.Theelectricitygenerationduring the sameperiodhasgrownatCAGRof2percent.ThepowersectorprofileofPakistanisshownfigure14.

14
Potential for Power Trade in Western Part of South Asia : Techno-Economic Rationale
Figure 14: Pakistan Power Sector Profile
23.34 23.49 23.73 23.73 24.82
100.58 99.30 98.66 105.70 109.06
-
20
40
60
80
100
120
-
10
20
30
FY 2011 FY 2012 FY 2013 FY 2014 FY 2015
TWh(GW
)
Installed Capacity (GW) Generation (TWh)
Source:StateofindustryReport,2015
Pakistan’spowersectorhasahighdependenceonliquidfuelsforpowergeneration.About35percentofitsinternalgenerationcamefromDiesel/HSD/FO,followedby30.9percentfromhydroand29.5percentfromdomesticgas.Itisexpectedthatthecontributionofliquidfuelswouldgraduallydecreaseby2020.Atthesametime,theproportionofdomesticgasisexpectedtodecreaseto18percentby2034andwillbereplacedbynuclearandhydrowhichwouldcontributearound7percentand35percentrespectivelyby2034.
Figure 15: Generation mix of Pakistan (2014)
RE,0.2%
DomesticGas, 29.5%
DomesticCoal, 0.1%
Diesel/HS/D/FO,35.2%
ImportedCoal, 0.0%
LNG, 0.0%
Hydro,30.9%
Nuclear, 4.0%
ThetotalenergygenerationinPakistanisexpectedtoincreaseto198TWhagainsttheoveralldemandof370TWhin2034.2Thiswouldmean,around172TWhwouldhavetobemetthrough importofelectricityfromothercountries.
2 USAID report on Assessment of the Electricity Trading Potential in the South Asian Region, May 2016

15
Potential for Power Trade in Western Part of South Asia : Techno-Economic Rationale
Figure 16: Energy Mix by Fuel in Pakistan
28
91
5 - - -
-
-
27
- - -
-
-
53
38 29 25
-
33 52
59 65 70
-
4
13
13 13 13
0
0
18
18 18 18
30
27
36
36 36 36
-
1
5
12 26 36
FY 2011 FY 2015 FY 2020 FY 2025 FY 2030 FY 2034
TWH
Diesel/HSD/FO LNG Coal (Imported) Hydro Nuclear Coal (Domestic) Gas (Domestic) RE
Source:SARI/EIreportonAssessmentoftheElectricityTradingPotentialintheSouthAsianRegion,May2016
3.2.1 DEMAND SUPPLY SCENARIO
TherehavebeensevereenergyshortagesinPakistansince2006.Thiscanbeattributedtolackofadequategenerationcapacityadditionstomeetthegrowingdemandandchallengesinmaintainingsomeoftheexistingaginggeneratingstations.Thesituationhascausedhugedemandsupplygapresultinginload-sheddingofelectricityasshownbelow:
Figure 17: Pakistan Demand-Supply
1213 13 13 12
14 13 1312
14
17 17 17
1213
1416
17 18 18 19 19 1921
2223
0.2 0.2
(10.00)
(5.00)
-
5.00
10.00
15.00
20.00
25.00
GW
2015
-16
2014
-15
2013
-14
2012
-13
2011
-12
2010
-11
2009
-10
2008
-09
2007
-08
2006
-07
2005
-06
2004
-05
2003
-04
-5.4-4.4-4.0
-5.3-6.6
-5.3-5.0-4.2-5.0
-2.5-1.2
Available Capability Computed Peak Demand Surplus/(Deficit)
Source:NTDCPresentationSAARCPerspectiveWorkshop,Oct2015
Theincreaseindemandsupplygapisattributedtoseveralfactorslike,reducedavailabilityfromtheexistingthermalstations,onaccountoffuelsupply-depletioninnaturalgas,delaysindevelopingthehydroprojects–lessthan15percentofthetotalhydropotentialof60GWhasbeendevelopedsofar.Theincreasedusageoffurnaceoilandhighspeeddieselalsoledtoexponentialincreaseingenerationcostwhichalsoadverselyaffectedtheaffordabilityofgeneration.
16
Potential for Power Trade in Western Part of South Asia : Techno-Economic Rationale
Thegovernmenthas initiatedaprogramme,withtheassistanceofChina,wheretheenergysectorhasbeengivenhighprioritytoovercomeenergyshortages.TheChina-PakistanEconomicCorridor(CPEC) is expected to add 10,400 MW to the grid on priority basis. The projects include coal,hydro andwind.Not only that, it will augment supplies in amajorway, butwill also significantlychange the energy mix, replacing expensive oil and resulting in reduction in the average cost ofgeneration.
ThesituationissimilarintheprovinceofPunjab,whichisalsothemostpopulousprovinceinPakistanandalsocontributesto68percentofthetotalconsumptioninthecountry.Thedemandisgrowingattherateofaround6-8percentperannumwiththedemand-supplygapestimatedataround4GW.Thegeneration,transmission,distributionandretailsupplyofelectricityinPakistanisundertakenbyPakistanPowerElectricCompany(PEPCO)withsignificantcontributiontogenerationfromvariousIndependentPowerProducers(IPPs).
The demand-supply gap will, however, remain almost the same in short to medium-term due tosuppresseddemandinthesystem,whichisexpectedtogrowatarateoffourtofivepercent.However,inthelong-runthesituationmayreverseandPakistancanbecomepowersurplusifitcanachieveitsambitioustargetsofadding17000MWpowergenerationcapacityunderCPEC.ThissituationmayallowPakistantoexportsurpluspowertoIndiaorotherSouthAsiancountriesconnectedtoIndianpowertransmissiongrid.
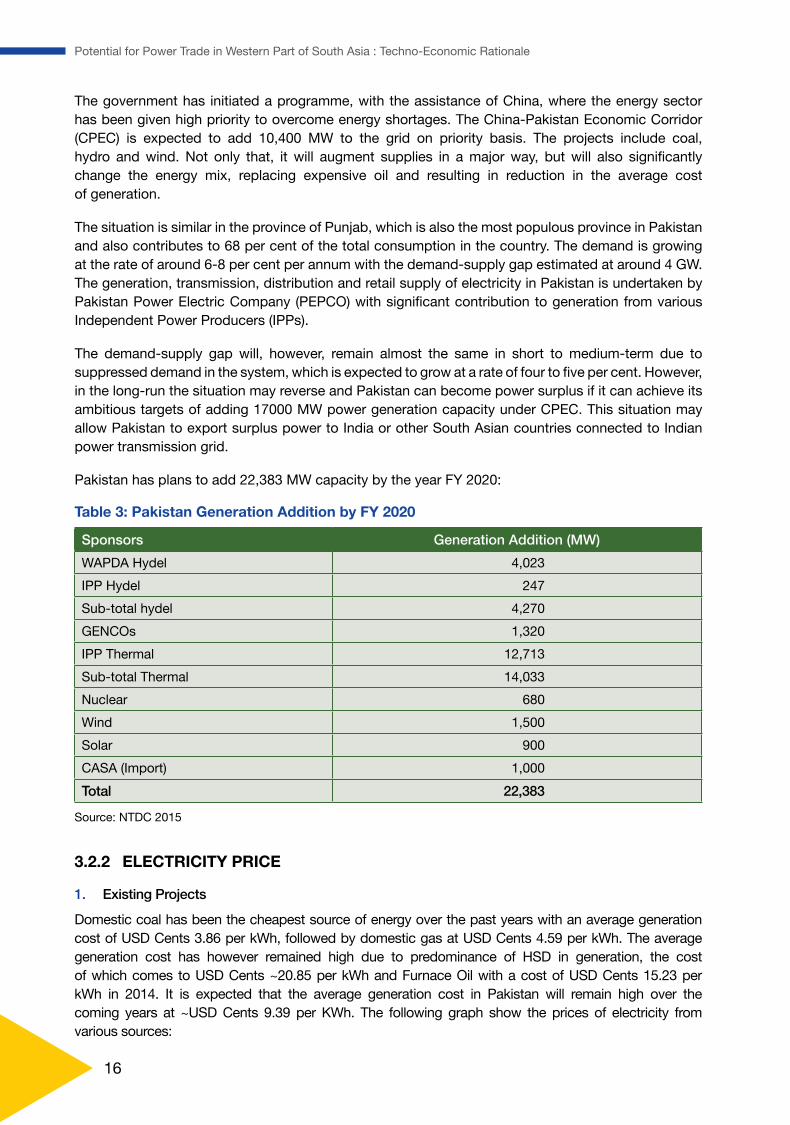
Pakistanhasplanstoadd22,383MWcapacitybytheyearFY2020:
Table 3: Pakistan Generation Addition by FY 2020
Sponsors Generation Addition (MW)
WAPDAHydel 4,023
IPPHydel 247
Sub-totalhydel 4,270
GENCOs 1,320
IPPThermal 12,713
Sub-totalThermal 14,033
Nuclear 680
Wind 1,500
Solar 900
CASA(Import) 1,000
Total 22,383
Source:NTDC2015
3.2.2 ELECTRICITY PRICE
1. Existing Projects
DomesticcoalhasbeenthecheapestsourceofenergyoverthepastyearswithanaveragegenerationcostofUSDCents3.86perkWh,followedbydomesticgasatUSDCents4.59perkWh.Theaveragegeneration cost has however remained high due to predominance of HSD in generation, the costofwhichcomestoUSDCents~20.85perkWhandFurnaceOilwithacostofUSDCents15.23perkWh in 2014. It is expected that the average generation cost in Pakistan will remain high over thecoming years at ~USDCents 9.39 perKWh. The following graph show the prices of electricity from varioussources:

17
Potential for Power Trade in Western Part of South Asia : Techno-Economic Rationale
Figure 18: Fuel-wise Generation Tariff in Pakistan (2015)(U
S c
ents
/ kW
h)
1.14
4.29 4.59
7.85 9.57
11.96
16.35
9.72
-
2.00
4.00
6.00
8.00
10.00
12.00
14.00
16.00
18.00
Nuclear Coal Gas Mixed Import Iran FO HSD
Fuelwise Av Generation
Source:StateofIndustryReport2015
2. Future Plants
TheCASA–1000isscheduledtodeliverthepoweratalevelisedtariffrangingfromUScents9.38toUScents10.88perkWhdependingonthecountryofsupplyasshowninthetablebelow:
Table 4: CASA TariffAllfiguresinUSCentsperkWh
Component Energy from Tajikistan
Energy from Kyrgyz
Energy from non-member country
Transmission Tariff 2.98 2.98 2.98
Energy Tariff 5.15 5.15 5.15
AfghanTransitFee 1.25 1.25 1.25
TajikistanfeeforKyrgyzenergy - 0.1 -
Non-member country charge - - 1.5
Total 9.38 9.48 10.88
Source:NEPRAPakistan
WithinPakistan,varioussourcesoffuelarebeingexploredtoreplacethecostlyoilbasedgeneration.Thefollowingfigureshowstherangeofgenerationtariffsforthefutureprojectsbasedonfuelsused:
Figure 19: Generation Tariffs for Future Plants
8.25 8.64 9.36
15.09
9.29 9.67 10.07
15.77
Domestic Coal Imported Coal LNG HSD
(US
cen
ts/
kWh)
Source:NEPRAPakistan

18
Potential for Power Trade in Western Part of South Asia : Techno-Economic Rationale
3.3 AFGHANISTANAfghanistan is rebuilding its energy sector and it has made ‘providing sustainable energy to itspopulation’afocusofitsdevelopmenteffortswiththesupportofinternationalcommunity.Currently,only43percentofthepopulationisestimatedtohaveaccesstoelectricity,withaverageper-capitauseof73kWhperyear.Eventhislowper-capitalevelofelectricityaccessconcealsasignificanturban-ruraldisparity,asitisestimatedthatonly23percentofsuppliedelectricityreachestheruralareas.
The Afghan energy sector not only suffers from limited power generation capacity but also itstransmissionanddistributionsystemsareoutdated.Theruralpopulationismostlydependentonmicro-hydroorPVbasedsolarpowerprojects.Thedependenceonthetraditionalbiomass(woodanddung)isstillveryhigh,ataround85percentofprimaryenergy,whichadverselyimpactstheenvironment.It is supplementedby theuseofdieselgenerators inoff-gridareasaswell as tocompensate forpoweroutages.Lackofaccesstoaffordableenergyislimitingtheeconomic,socialandeducationalopportunities,particularlyforthepoorandthoseinruralareas.
TheinstalledcapacityofAfghanistan’spowersystemwas566MWin2016.Thiscomprisedof53percenthydro,35.34percentdieselorHFObasedthermalpowerplants,0.2percentsolarandsmalldieselgeneratorsetsconstitutedabout12percent.However,duetopoliticalinstabilityandconflictsin the last twodecades,generationcapacityadditionhavebeen limitedandmajorityofelectricityconsumption(77percentoftotalconsumption, i.e.4,454GWh)ismetthroughpowerimportfromneighbouringcountries.
Afghanistancomprises10isolatedgridsorislandssuppliedbydifferentpowersystemsthrough220kVand110kVlinks.DifferentpartsofAfghanistanimportspowerfromIran,Tajikistan,Turkmenistan,and Uzbekistan. Currently, there are five transmission lines that are used for power import fromTurkmenistan,UzbekistanandTajikistanandthreelinesforimportofpowerfromIran.
Figure 20: Afghanistan’s Installed Capacity (MW) - 2016
Solar, 1, 0%Diesel Gensets, 65,12 %
Thermal, 200, 35%
Hydro,300,53%
Source:CAREC:StudyforPowerSectorFinancingRoadMap;DABSreportonAfghanistanPowerSectorOverview
3.3.1 DEMAND SUPPLY SCENARIO
Currently, Afghanistan’s energy demand-supply gap is around 50 per cent and the same trend isexpectedtocontinuetill2020.Therelianceontheimportofpowerfromneighboringcountrieswouldcontinue and the country is set to further gain from intra-regionalCBETprojects likeCASA-1000ProjectwhichwillenabletohavelinkswithPakistanandwilltransfercentralAsia’shydropowertoPakistan.

19
Potential for Power Trade in Western Part of South Asia : Techno-Economic Rationale
Figure 21: Afghanistan’s Energy Supply Scenario
-
1,000
2,000
3,000
4,000
5,000
6,000
2012 2013 2014 2015 2016 2017 2018 2019 2020 2021 2022 2023 2024 2025 2026 2027 2028 2029 2030 2031 2032
Total Capacity (MW) Peak Load (MW)
Source:AfghanistanPowerMasterPlan2013(ADB)
AccordingtotheAfghanistanPowerSectorMasterPlan,2013,thetotaldemandinAfghanistanwillincreaseonanaverageby5.7percentperannum to reach18,400GWh in2032.The totalpeakdemandin2032isexpectedtostandataround3,500MW.Thetotalcapacity(includingimportsfromneighbouringcountries)islikelytoincreasefrom1,270MWin2013to5,659MWin2032.Inenergyterms,thesituationislikelytoimprovewiththecommissioningofCASAInterconnectionin2020.ThefollowingfigureprovidesthepeakdemandandsupplyscenarioforAfghanistan.
3.3.2 TRANSMISSION INTERCONNECTIONS
Thefollowinginterconnectionsareinoperationorhavebeenproposed3
1. Interconnection with Tajikistan
Theexisting220kVdoublecircuitimportlinefromTajikistanisdesignedforaratingofabout600MW.Further,TajikistanwillbeprovidingpowertoAfghanistanthroughtheCASA-1000link.
2. CASA-1000
The Central Asia South Asia Electricity Transmission and Trade Project (CASA-1000), coveringAfghanistan,KyrgyzRepublic,PakistanandTajikistan,willputinplacethecommercialandinstitutionalarrangementsaswellastheinfrastructurerequiredfor1,300MegaWatts(MW)ofelectricitytrade.ThetotalprojectcostasperWorldBankreportisestimatedatUSD1.17billion.TheCASA-1000electricitytransmissionsystemwillhelptransformtheregionandsignifiesanimportantsteptowardrealizingtheplannedCentralAsia-SouthAsiaRegionalElectricityMarket(CASAREM).
3. Interconnection with Turkmenistan
TurkmenistanInterconnectionProjectisproposedtobedevelopedinthreestages.Thefirstphaseisunderimplementationandinvolvesconstructionofa500kVlinefromAtamyrat(TKM)toSheberghan(AFG)viaAndkhoy(AFG).Thiswillallowtheimportof300MWonthe220kVlevelthroughouttheyearandcompletionisexpectedby2017.Thesecondphase;foranadditional200MWoffirmcapacitysummingupto500MW,byupgradingto500kV,includingaback-to-backconverteratPul-e-Chomri;wouldbeavailableby2020.Inthethirdphase;anadditional500MWsummingupto1000MW,byaddingasecondback-to-backconverteratPul-e-Chomri;isscheduledfor2025.
3 Afghanistan Power Sector Master Plan Addendum Report (2014)

20
Potential for Power Trade in Western Part of South Asia : Techno-Economic Rationale
4.1 Past StudiesOverthelastdecade,severalpre-feasibilitystudieshavebeenconductedforthecrossborderenergytrade interconnectionbetween India andPakistan andalso for interconnectionwithCentralAsiancountries.Thesestudieshaveassessedthetechnical,financialandeconomicfeasibilityofthepowertradeinwesternpartofSouthAsia.Someofthekeyhighlightsofthesestudiesinclude:
1. CASA-1000ProjectCentralAsia-SouthAsiaRegionalPowerConnectivity:TheideaofCentralAsia–SouthAsiaTransmissionInterconnectionProject(CASA-1000)wasconceivedin2008totransmit1300MWofsurpluselectricity(MaytoSept)fromexistinghydelresourcesinTajikistanandKyrgyzRepublicthroughAfghanistantoPakistan.Outof1300MWofexpectedpower,300MWisreservedforAfghanistanand1000MWwillbeconsumedbyPakistan.
2. TheADB2013report4suggeststhattheshort-termpowertransfersbetweenIndiaandPakistanalsohasasignificanteconomicpotential.According to the report, the fuelcostsavings forasingleyearalonecanfundthedevelopmentoftransmission.Theestimatedinterconnectioncostfora200MWtransmissionlineof45kmlengthat220kVwouldbeUSD50millionandgoinguptoUSD150millionfor400kV5inlong-term,(2012estimate).Theannualbenefitsestimatedforthe400kVinterconnectionwasUSD491million,whichincludesfuelcostsavings.
3. TheWorldBankPolicyResearchPaper6publishedinJune2015showsthatthegridinterconnectioncapacitypotentialbetweenIndiaandPakistanwouldbe14,900MWbytheyear2040inano-carbonconstraint scenario. In this scenario, theenergy transfer fromPakistan to Indiawouldbe300TWhandenergy transfer from India toPakistanwouldbe397TWhduring theperiod2015-40.Inafullregionaltradingscenariowithcarbonconstraints,theinterconnectioncapacitypotentialwouldbe11,000MWby2040,whiletheexportfromPakistanduringtheperiod2015-40wouldbe314TWh,asagainstanimportof225TWhbyPakistanfromIndia.
4. TheSARI/EI/IRADereportonAssessmentoftheElectricityTradingPotentialintheSouthAsianRegion(May2016)estimatesthetradingpotentialbetweenIndiaandPakistantobeinexcessof44TWhfrom2021onwards,withIndiabeingthenetexporterofpowerfortheforecastperiodupto2034asshowninthefigureonnextpage:
4CBET Potential in Western Part of South Asia
4 ADB Report: RETA – Study on South Asia Regional Power Exchange (Jun 2013)5 similar to Bangladesh line, HVDC back to back6 World Bank Policy Research Paper: How Much Could South Asia Benefit from Regional Electricity Cooperation and Trade? –
Govinda Timilsina et al (2015)

21
Potential for Power Trade in Western Part of South Asia : Techno-Economic Rationale
Figure 22: Power Trading Potential between India and Pakistan (2018-2034)
- - -
44 55
65 75
84 93
102 111
120 129
139 150
161 172
FY 18 FY 19 FY 20 FY 21 FY 22 FY 23 FY 24 FY 25 FY 26 FY 27 FY 28 FY 29 FY 30 FY 31 FY 32 FY 33 FY 34
TWh
Source:SARI/EIreportonAssessmentoftheElectricityTradingPotentialintheSouthAsianRegion,May2016
4.2 Power Trade Potential In Western Part of South AsiaSalientfeaturesemergingfromtheanalysisofpowersectorsinIndia,PakistanandAfghanistanaregivenbelow:
1. Shortterm(2017to2020)
• India is likely to become energy surplus with the state of Punjab (India) being surplus in peak capacity and energy at least for 8 months.
• Pakistan will have overall energy deficit and will continue to depend on high-cost units like diesel/FO/HSD etc., to meet its demand in absence of sufficient transmission links with neighboring countries.
• Afghanistan will continue to be the net importer of electricity from the Central Asia and will have to rely on high-cost domestic generation from oil-based plants. Lack of interconnections with Pakistan will limit the potential of power export from South Asian region.
• Electricity trade can start between Pakistan and India with export of upto 200 MW power by India in the short-term. The trading of electricity is constrained by the lack of transmission infrastructure between the two countries. A phased approach for the interconnection needs to be considered.
2. Mediumterm(2021to2025)
• Development of CASA 1000 interconnection project will facilitate greater imports of electricity by Afghanistan from Central Asia, and possibly from South Asia.
• The electricity trading between India and Pakistan could increase with augmentation of interconnections and can be increased to 500 MW in the medium-term. Pakistan could also act as transit for export of power from India to Afghanistan.
3. Long-term(Beyond2025):
• Pakistan can also trade its surplus power to India or other South Asian countries if its ambitious target of power generation is realised.
• For incremental demand, Pakistan may rely on imports rather than building its own capacity, as importing coal-based power from India could work out to be economical than generation from an imported coal based power plant in Pakistan.

22
Potential for Power Trade in Western Part of South Asia : Techno-Economic Rationale
• Afghanistan can explore electricity import options from South Asia in addition to the already planned capacities in Central Asian region. More transmission interconnections through Pakistan could be planned which would link with the rest of the South Asian region.
4.3 Interconnection Options
4.3.1 INDIA - PAKISTAN
ThereareseveraloptionsforinterconnectionbetweenIndiaandPakistanwhichhavebeenidentifiedsince1990s.Thekeyamongstthemare:
y 400kVACtransmissionlinebetweenAmritsar(Punjab,India)andLahore(Punjab,Pakistan)andback-to-backHVDCsub-stationinPakistan-CostEstimatesasperstudyfundedbyWorldBankin2012-13:US$119.4million
y 220kVACtransmissionlinebetweenPatti(India)–Dinanath(Pakistan)interconnection(250MW)
y AC transmission line betweenMundra (Gujarat, India) andKarachi(Pakistan) and back-to-backHVDCsub-stationinPakistan
All recent studies indicate that interconnectionbetween theprovincesofPunjaboneither sideofborderwouldbemostappropriate, taking intoconsideration factors likedemand–supplyscenario,costof interconnectionetc.The400kVACtransmission linebetweenAmritsar (Punjab, India)andLahore(Punjab,Pakistan)andback-to-backHVDCsub-stationinPakistanhasbeenproposedaspertheWorldBankpre-feasibilitystudycarriedoutin2012-13.Thefollowingelementsofinterconnectionhavebeenproposed:
y 400/220 kV HVDC Back-to-back Convertor Station inPakistan
y 400kVD/CTransmissionLinefromBalachaknearAmritsarto Pakistan-India Border
y 400 kV D/C Transmission Line (approx. 10 km) fromConvertor Station to Pakistan-India Border
y 220kVD/CTransmissionLinefromGhaziRoadtoConvertorStation
4.3.2 AFGHANISTAN - PAKISTAN
1. CentralAsiaSouthAsia(CASA1000)Project
TheCASA-1000projectwillinclude:
y 500kVAClinefromDatka(intheKyrgyzRepublic)toSugd-500(477kilometresawayinTajikistan)
y 1300MWAC-DCConvertorStationatSangtuda(Tajikistan)
y 750 kilometre High Voltage DC line from Sangtuda(Tajikistan)toNowshera(Pakistan)
y 1300MWDC-ACConvertorStationatNowshera
Hydropowerplants(HPP)inKyrgyzstanandTajikistanwillsupplytheelectricityforCASA-1000.Theprojectcostisestimatedto Source: Central Asia - South Asia Electricity Transmission And Trade
(CASA-1000) Project Feasibility Study Update Report SNC Lavlin-
Pak
ista
n 500k
V H
VD
C -
750
km -
1300
MW
500k
V H
VAC
- 4
77km
-100
0MW
Peshawar
Kabul300MW
1300MW
Tajikistan Internal AC Grid
AC/DC Converter Station
Sangtuda
Khoudjand
Datka
Tajik
ista
nA
fgah
inis
tan
Kyr
gyza
tan
Figure 23: CASA 1000 Project

23
Potential for Power Trade in Western Part of South Asia : Techno-Economic Rationale
beUSD1.16BillionandisbeingsupportedbytheWorldBankGroup,IslamicDevelopmentBank,UnitedStatesAgencyforInternationalDevelopment(USAID),USStateDepartment,UnitedKingdomDepartment for InternationalDevelopment (DFID),AustralianAgency for InternationalDevelopment(AusAID)andotherdonorcommunities.
TheproposedCASA1000transmissionhastheflexibilityofbidirectionalflowsonthesystem.Asaresult,AfghanistansystemcanprovidepowertoPakistanincaseTajikistan/Kyrgyzsystemisunabletoprovidethefull1,300MWofexportpower.Similarly,AfghanistancanimportpowerfromPakistanincaseofneed.
2. Turkmenistan-Afghanistan-Pakistan500kVLine(TAP-500)
TheproposedTurkmenistan-Afghanistan-Pakistan500kVLine (TAP-500)projectwill facilitateyear-roundpower export fromTurkmenistan tobothAfghanistan andPakistan.By2020, Turkmenistanexpectstogenerate3,500MWofexcesspowertobeavailableforexport.ThetripartiteagreementhasbeensignedbythethreeheadofstatesinDecember2015.

24
Potential for Power Trade in Western Part of South Asia : Techno-Economic Rationale
5.1 Proposed Interconnection Between India and Pakistan
5.1.1 TECHNICAL ASSESSMENT
The proposed connection is required to have back-to-back HVDC sub-station, to make theasynchronousconnectionbetweenIndiaandPakistan,whichoperateondifferentfrequencies.Theprojectislikelytotakeupto36-40monthsforimplementation,astheconstructionofHVDCback-to-backstationshallhavelongergestationperiodofabout36months,whilethetransmissionnetworkcanbecompleted in about24months.The following technical interfacehasbeenconsidered forcarryingoutthetechno-economicanalysisfor400kVACtransmissionlinebetweenAmritsar(Punjab,India)andLahore(Punjab,Pakistan)andback-to-backHVDCsub-stationinPakistan:
y 400 kV D/C Transmission Line (approximately 26 kms) from Balachak near Amritsar (India) toPakistan -India Border
y 400kVD/CTransmissionLine(approximately10kms)fromConvertorStationinLahoretoPakistan-India Border
y 400/220kVHVDCback–to–backSubstationinLahoreforasynchronousinterconnectionmode
y 220kVD/CTransmissionLinefromGhaziRoadtoConvertorStation
y CostEstimatesasperstudyfundedbyWorldBankin2012-13:US$119.4million
Figure 24: Pakistan – India Interconnection
Source:NTDCL,Pakistan
5 Techno-Economic Rationale

25
Potential for Power Trade in Western Part of South Asia : Techno-Economic Rationale
Apossibleoptionwouldbetoconnectthesystemsinradialmodeat220kVvoltagelevelintheinterimperiod tillcommissioningofHVDCsub-station.TheconnectionwithHVDC linkbetweenBalachaksub-stationinAmritsar,Punjab(India)andGaziRoadsub-stationinLahore(Pakistan)isshownintheFigure25below.
The following stages of development of the interconnection have been considered for economicanalysis
1. Stage 1 -Supply of power to Lahore from India in radial mode
Underradialmodeofoperation,aportionofLahoreGridshallhavetobeisolatedandconnectedtoIndianGridthroughthe400kVdoublecircuittransmissionline,whichwouldinitiallybechargedat220kV.Around150-200MWloadcanbesegregatedforsupplyofpowerfromIndiaasshownbelow:
Figure 25: Stage 1 – 200 MW Transfer Capacity in Radial Mode
BalachakSub-station
Gazi Road Sub-station
400 kV Line charged at 220 kV
India-Pakistan Border
Lahore, Pakistan Amritsar, India
Load ~ 200 MW
Connection in radial mode
Disconnection from Lahore Grid
200 MW power transfer
2. Stage2:Developmentof500MWHVDCback-to-backsub-station
The construction of back-to-back HVDC sub-station would enhance the power transfer capacitybetweenthetwocountriesto500MWwithinthreetofouryears.
Figure 26: Stage 2 – 500 MW HVDC Sub-station
IndiaPakistan
PGCILSystem
PSTCL
Power Exchange (IEX/ PEX)
Power Trader
PSPCL
NTDCTransmission
System
500 MW B-B HVDC
S/S
LESCO
400 kV Transmission Line
500 MW Power Transfer
26 km10 km
BalachakS/S
400 kV and 220 kV AC Switchyard
India-Pakistan Border

26
Potential for Power Trade in Western Part of South Asia : Techno-Economic Rationale
5.1.2 COST ESTIMATION FOR INDIA PAKISTAN INTERCONNECTION
Thecapitalcostfortheprojecthasbeenestimated,basedontheprevailingtrendsinSouthAsianmarket.Therecentbenchmarkcostsfromtheregionhavebeenconsidered.
Table 5: Reference Cost of Similar Projects
Project Estimated Cost (USD Million)
India-BangladeshHVDCBlock–I
y 125kmof400kVdoublecircuit(D/C)T/LbetweensubstationsatBaharampur(India)andBheramara(Bangladesh)
y 400kVswitchingstationatBaharampur y 500MWback-to-backHVDCsub-stationatBheramara
USD193Million(excludesIndiansidetransmissionlinecost)*
India-BangladeshHVDCBlock-II
y 500MWback-to-backHVDCsub-station
USD144Millionin2015
CASA-1000
y 500kVHVACT/LfromKyrgyztoTajikistan(477km) y ±500kVHVDCT/LfromTajikistantoPakistanviaAfghanistan(750km)
y 300MWHVDCsubstationatKabulinAfghanistan y 1300MWHVDCconvertorstationatTajikistan y 1300MWHVDCconvertorstationatPeshawar
USD1.17Billionincluding208millionIDC
*Revisedcostestimates2015
ThetotalcostofinterconnectionincludingIDCandcontingencyfortwostagesisshownintheTablebelow:
Table 6: Interconnection Project Estimated Cost
Cost of Proposed Interconnection USD Million
Stage I 16.9
Stage II 108.1
Total 125.0
5.1.3 IMPLEMENTATION SCHEDULE
Theprojectcanbecompletedin54monthsbuttherearechallengesintheimplementationgiventhecomplexitiesinprocurementandimplementationduetothevaryingrequirementsinbothcountries.
Thepre-awardstagecomprisingofstudies,finalisationofspecificationsandtenderdocuments,awardofEPC-turnkeyContractscouldtakeupto18months.TheexecutiontimeforStageIisexpectedtobe24monthsposttheawardofcontract.TheStageIIislikelytotake36monthstocompletefromtheawarddate.Indicativetimelinesfortheproposedprojectisshownbelow.
Figure 27: Implementation Schedule
Appointment of Consultant
Issuance of RfP
M0 M12
Award of Turnkey Contract
M18 M42
Stage I: 400 kV D/C line Ready
Stage II: HVDC Converters ready
M48
Stage II: System
M54
Studies Completed
M8

27
Potential for Power Trade in Western Part of South Asia : Techno-Economic Rationale
5.1.4 COST-BENEFIT ANALYSIS
1. EconomicrationaleoftheProject
TheSouthAsiancountriesarenet importersof fossil fuelssuchascoal,oilandoilproducts fromoutside the region. Considerable benefits could be derived from tapping hydropower potential inBhutan,IndiaandNepalandfromutilisingthedifferingseasonalloadcharacteristicsofthecountriesintheregion.Theinterconnectionofpowertransmissionofthesecountrieshasbeenapriorityinthepastfewyearsinordertoutilisetheresourcesavailableintheregion.Regionalinterconnectivitycouldhelpcountriesmanagepowershortages,avoidpoweroutagesandimprovesystem-wideefficiency.Currently,IndiaimportspowerfromBhutanandexportspowertoNepalandBangladesh.TheIndia–Pakistancrossborderproject,whenimplemented,willprovideasuccessfulexampleofpowertradingbetweentwocountriesintheregion,contributetowardsmeetingthegoalofprovidingpowertoall,andbringeconomicbenefitstotheregion.
Pakistanhasexperiencedrapidlygrowingenergyneedstosustainitsgrowth,particularlyintheindustrysector.LackofgenerationcapacityadditionsandchallengesinoperatingtheexistinggeneratorduetofuelshortageshaveresultedinelectricitysalesinPakistannotmatchingthedemand.Peakdeficitofover5,000MWwasrecordedin2015.Thegovernmenthasplannedseveralinitiativestominimisepowershortagesbyplanninghydropowercapacityadditions,relyingonimportedgasandpetroleumandbypreparingprojectsbasedon importedcoal.Sourcingpower from theSouthAsia region isanotheroptionthatcanprovideafastandefficientmechanismtooffsetshortages.TheelectricalgridinterconnectionfacilitybetweenIndiaandPakistanwillpartiallyalleviatethecurrentpowercrisisbyproviding200–500MWofpowerfromIndia.TheprojectwillfacilitateimportsofcheapandreliablepowerfromIndiaforuseinPakistan,asignificantpartofthedemandbeingattributedtoindustrialactivities.
InPakistan,around30percentofelectricityisproducedfromgas-basedpowerplantsand35percent from petroleum products (Diesel and FO). The delays in capacity installation programmehasforcedelectricityutilitiestoresorttoloadsheddingincludingindustrialconsumerswhichhavebeenusingcaptivegenerationfacilities.Thedependenceonimportedcoalbasedplantsisalsoincreasing.
2. Keyassumptions
India-Pakistan Electrical Grid Interconnection will allow an exchange of power between the twocountries.Itwillinitiallyfacilitatethetransmissionof200MWofpowerfromIndiatomeetexistingandfuturedemandsinPakistan.Thiswillbeincreasedto500MWwithestablishmentofHVDCstation.Thisisthebasecasewhichhasbeenusedfortheanalysis.
Theprojectcostandthebenefitsfortheproposedinterconnectionhasbeenworkedoutbasedonfollowingassumptions:
y Allcostsareexpressedinconstant2016prices.Thecapitalcostestimatesincludecontingenciesandfinancialchargesduringconstruction.
y TheprojectcostincludesinvestmentandmaintenancecostsofPakistantoIndiatransmissionline,costofotherassociatedfacilitiesandannualpaymentstotheIndianentitiesfordeliveryofpowertoPakistan.Thepublishedreportshavebeenrelieduponfordata.
y Theprojectwillbefundedbymulti-lateralagenciesandwillbeownedbythetransmissionlicenseesintherespectivegeographies.
y PowerwillbeavailableforsaletoPakistanfromthesurpluswithPunjabstateinIndiaandalternatelythroughthemedium-termcontractingwiththelicensedpowertradersinIndia.Intheshort-termperiod,powercouldbepurchasedfromthepowerexchange(s)inIndiatomeetanyshort-fallinenergy.

28
Potential for Power Trade in Western Part of South Asia : Techno-Economic Rationale
y TheavailablepowerfromIndiawouldbeusedforreplacingthecostlierfuelswithinPakistanvizHSD/FO and imported coal. The additional powerwould be available for sale to the industrialconsumersincaseenergydeficitsituationprevailsinthemedium-term.
y Noenvironmentalandsocialcostsorbenefitshavebeenquantifiedorusedfortheinterconnectionproject.
y Theinformation/dataasexistedinpublicdomainandobtainedandcollectedfromvariousotherprimaryandsecondarysourcesasonJuly,2016.
3. EconomicAnalysis
Aperiodof25yearshasbeenassumedfortheeconomicanalysisandastandard12percentdiscountratewasusedtocalculatethelevelisedtariff.Capitalcostswerespreadoverthefirst3yearsbasedonconstructioncycleofsimilarprojects.Capacityutilisationofthetransmissionlineswasassumedtobe85percentinestimatingthequantityofpowertransmitted.
ThefollowingtableshowsthepricecomparisonbetweenvariousoptionsforprocurementofadditionalpowerfortheperiodFY19toFY34.ThelevelisedcostofpowerprocurementfromIndiaincludingthetransmissiontariffforIndiansystemandthetransmissionchargesfortheproposedinterconnectionhavebeencomparedwiththepowergenerationtariffsinPakistan.
FortheIndiansystem,thefollowingpowertariffshavebeenassumedforthebaseyear(2016)
Table 7: Power Tariffs in India
Indian power market tariff Tariff (US cents/kWh)
LongtermPPA 6.32
PowerExchange 5.49
PowerTraders 6.22
ForPakistan,whilehydropoweristhemosteconomicsourceofelectricity,domesticgasisnextlowcostresource,theavailabilityofwhichislimited.TheFurnaceOil-basedandHSD-basedgenerationisthecostliest.PakistanalsohassizablecoalreservesinTharregion,butcurrentlythereareconstraintsincoalproduction.Thedevelopmentofdomesticcoalfieldswill take timeandthedependenceonimportedcoalislikelytoincreaseinordertoreplacetheoil-basedgeneration.
ThefeasibilityoftheinterconnectionhasbeenassessedfromtheperspectiveofbothPakistanandtheregion.TheEconomicInternalRateofReturn(EIRR)ofthetransmissionprojecthasbeencalculatedassumingadedicatedtransmissionlinetoevacuatepowerfromadesignatedplant.
Theresourcecostsavingshavebeenconsideredforthebasecaseasdiscussedabove.Theresourcecost savingswere basedon the assumption that oil-basedgeneratorswould be used alongwithimported coal-based plants in the absence of the project. In the base case, the resource costsavingswereused toestimate thebenefits.The levelisedcostofgeneration for importedcoalhasbeen conservatively estimated at 9.70US cents per kWh for the base-case calculation. With thePakistan–India transmissionnetwork inplace,Pakistanwill be in aposition to import power fromIndia at a relatively cheaper cost in short to medium-term. The tariff for the power from tradersin India is based on the available power in short to medium-term and the trading margin andtransmission charges for delivery of power are based on theCERC-approved tariffmethodology.Marketbasedpowerpurchasecosts formediumandshort-termpower supplyareconsidered. InFY2016, the total tariffworksout toabout INR4.2perkWh.A2percentannualescalation rate hasbeenconsidered.

29
Potential for Power Trade in Western Part of South Asia : Techno-Economic Rationale
Theeconomiccost–benefitanalysisindicatesthatthebasecaseresultsinanEIRRof22.14percent.TheprojectislikelytogiveabenefitofUSD210Millionagainstthetotalcostof125Million.TheB/Cratioof theprojectworksout tobe1.68.Theproject iseconomicallyviable in thebasecase.Thefollowingtableshowsthecostsandbenefits:
Table 8: Cost-Benefit of the Project(AllfiguresinUSMillion)
Year Capital Cost & Operating Cost
Cost of Power Purchase
Total Cost Gross Benefit
Net Benefit
2017-18 25.04 - 25.04 - (25.04)
2018-19 51.16 - 51.16 - (51.16)
2019-20 27.51 90.11 117.62 115.16 (2.46)
2020 - 21 0.98 204.63 205.61 257.05 51.44
2021 - 22 1.00 165.97 166.98 204.92 37.94
2022 - 23 1.02 134.63 135.65 163.36 27.71
2023 - 24 1.04 109.21 110.25 130.23 19.98
2024 - 25 1.06 88.59 89.65 103.82 14.16
2025-26 1.09 71.87 72.95 82.76 9.81
2026-27 1.11 58.30 59.41 65.98 6.57
2027-28 1.13 47.30 48.43 52.60 4.16
2028-29 1.15 38.38 39.53 41.93 2.40
2029-30 1.18 31.14 32.32 33.43 1.11
2030 - 31 1.20 25.27 26.47 26.65 0.18
2031 - 32 1.23 20.50 21.73 21.24 (0.49)
2032 - 33 1.25 16.64 17.89 16.93 (0.95)
2033 - 34 1.28 13.50 14.78 13.50 (1.28)
2034 - 35 1.31 10.96 12.26 10.76 (1.50)
2035-36 1.33 8.89 10.22 8.58 (1.64)
2036-37 1.36 7.22 8.58 6.84 (1.74)
2037-38 1.39 5.86 7.24 5.45 (1.79)
2038-39 1.42 4.75 6.17 4.35 (1.82)
2039-40 1.45 3.86 5.30 3.47 (1.84)
2040 - 41 1.48 3.13 4.61 2.76 (1.85)
2041 - 42 1.51 2.54 4.05 2.20 (1.85)
2042 - 43 1.54 2.06 3.60 1.76 (1.85)
2043 - 44 1.57 1.67 3.25 1.40 (1.85)
2044 - 45 1.51 1.36 2.86 1.12 (1.75)
AsensitivityanalysishasbeenundertakenbasedonthesaleofpowertotheindustrialconsumersintheLahorearea.ThelevelisedtariffofUScents11.72perkWhhasbeenassumedbasedonthe

30
Potential for Power Trade in Western Part of South Asia : Techno-Economic Rationale
existingapplicabletariff fortheindustrialcategoryfortheanalysis.ThisgivesasignificantlyhigherEIRRandB/Cratio(3.33).Theprojectissensitivetocostescalationsandlowerlevelsofutilisation. A10percentcostincreasewouldgiveanEIRRof17.1percentandautilisationbelow75percentwillresultinnegativeEIRR.
ThesurpluspowersituationinNorthernIndiaislikelytocontinueandgiventherelativelysmallquantumofpowerrequirement,theriskofoutageonaccountoflackofpoweravailabilityisremote.
GiventhedevelopmentofthetradingmarketinIndiaaswellasthelevelofmarginalcostofelectricityinPakistan,itisnotexpectedthatthelinewillremainunutilisedoveritslifeoncebuilt.Overall,theanalysis shows that theproject is economically viable andprovides stable benefits under variousscenarios.
5.2 CASA 1000 Interconnection between Afghanistan and PakistanThetechno-commercialanalysisfortheCASA1000projectwasassessedbySNCLavalinandFinalFeasibilityStudyReportsubmittedinFebruary2011.
SNCLavalin was commissioned to prepare a feasibility study, in two phases, for the regionalinterconnection.ThefinalPhase1reportwassubmittedinDecember2007andthePhase2report,inJanuary2009.
Thekeyexcerptsfromthefeasibilityreportareasbelow:
5.2.1 TECHNICAL ASSESSMENT
TheHVDClinkbetweenTajikistan,AfghanistanandPakistaniscomprisedof1,300MWconvertersinTajikistanandPakistan,a300MWconverterinAfghanistananda1,300MW,750kmtransmissionline.TheCASAprojectalso includesanHVACtransmission linebetweentheKyrgyzRepublicandTajikistan,477kmlongandratedat1,000MW.
Theprojectisbasedontheexpectationthatsufficientsurpluspowerisavailableinthecountriesinthenorthtorepresentasubstantialpotentialfortradewiththecountriesinthesouth.Moreover,thecostofelectricityinthesendingcountriesisbelowthelong-runmarginalcostinthereceivingcountries,providingajustifiablerationaletoinvestinthetransmissioninterconnection.
5.2.2 COST ESTIMATES
AccordingtoSNCLavalinestimates,thecostoftherecommendedprojectisUSD873Million(Feb2011reportestimates),excludingInterestDuringConstruction(IDC). IDCamountstoanadditionalUSD80million.Theprojectisfoundtobeeconomicallyviablebasedona10percentdiscountratewithaBenefit/Costratioof1.3percentandanEIRRof15.6percent.

31
Potential for Power Trade in Western Part of South Asia : Techno-Economic Rationale
TheoverallCBETpotentialfortheSouthAsiaisverylarge.Theeasternpartoftheregionhasseensignificant developments in creation of the transmission infrastructure which has the potential oflinkingwithSouthEastAsiathroughMyanmar.Thewesternpartoftheregionisstilltowitnesssimilardevelopments.
A potential linking of Afghanistan–Pakistan and Indian grids could facilitate development of aninterconnectedsystembetweenCentralAsiaandSouthAsiawhichwouldbenefit thecountries intheseregions.
The current techno-commercial analysis is focusedon the India-PakistanCrossBorder ElectricityTrade,butthesamecouldbeextendedtocoverthewholeofwesternregionincludingAfghanistan.
Withthedevelopmentof India-Pakistan interconnection, IndiacanexportpowertoPakistan intheshort-term,since the later is experiencing huge power shortage. In the long-term, Pakistan canbecomesurplusandexporttoIndiabecauseofitsaggressivepowergenerationadditionaswellaslikelyconnectivitytotheCentralAsiansystem.Eitherway,theSouthAsianregionissettobenefitfromtheoptimalsourceofpowergeneration.
TheincumbentcountriesinthewesternpartofSouthAsianregioncouldformajointcommitteetoevaluatetheelectricitytradepotential.Thenodalagenciesfromrespectivecountriescouldbeidentifiedandgiventheresponsibilitytoworkoutvarioustechno-commercialissues.Adetailedfeasibilitystudyfortheidentifiedinterconnectionscouldbetakenupimmediatelytofinalisethecostsandalignment.
Various technical issueswouldneed tobe looked for viz. harmonisationofgridconnectioncode,operatingparametersetc.TheCASA1000Project,whichwouldestablishthelinkbetweenAfghanistanandPakistan,couldestablishbenchmarksfortheintegratedoperation.
Way Forward

32
Potential for Power Trade in Western Part of South Asia : Techno-Economic Rationale
1. Central Asia - South Asia Electricity Transmission and Trade (CASA-1000) Project FeasibilityStudyUpdateReport–SNCLavalin,Feb2011
2. EnergyTrade inSouthAsiaOpportunitiesandChallenges–ADB(Dec2011)-PriyanthaD.C.Wijayatunga,HerathGunatilake,P.N.Fernando
3. Cross-BorderPowerTradinginSouthAsia:ATechnoEconomicRationale-PriyanthaWijayatunga,D.ChattopadhyayandP.N.Fernando;August2015
4. StudyonaSouthAsiaRegionalPowerExchange–ADB(June2013)
5. PerspectiveTransmissionPlanforTwentyYears(2014-2034)(Aug2014)-GovernmentofIndia,MinistryofPower,CentralElectricityAuthority,PGCILandPOSOCO
6. SouthAsiaRegionalWorkshoponCompetitiveElectricityMarkets–Design,Implementation&BenefitsColombo,SriLanka,(Mar2014)-MuhammadWaseemYounas,SohailMumtazBajwa
7. SAARCPerspectiveWorkshoponthePast,PresentandFutureofHighVoltageDC(HVDC)PowerTransmission,Lahore,Pakistan(Oct2015)-MuhammadWaseemYounas
8. TheEnergyCooperationInSouthAsiaUnderSaarcUmbrella,The6thJapan-SAARCSymposium(March2013),Kathmandu,Nepal-Dr.MuhammadPervaz
9. SecuringIndia’sEnergyFuture(Oct2012),ColonelDevindarKumar,
10. Cross-BorderElectricityTradeinSouthAsia:KeyPolicy,RegulatoryIssues/ChallengesandtheWayForward-WorkshopontheSustainableDevelopmentofPowerSectorandEnhancementof Electricity Trade in the South Asian Region, New Delhi, India (Jan 2016), SARI/EI ProjectSecretariat,IRADe,Dr.JyotiParikh,Mr.V.K.Kharbanda,Mr.RajivRatnaPanda
11. Modelling, Investment Planning and Optimisation for the Design of a Polygeneration EnergySystem,Elsevier(2007)–PeiLiu,DimitriosI.GerogiorgisandEfstratiosN.Pistikopoulos
12. DevelopingaRegionalPowerMarketinSouthAsia,9thCapacityBuildingProgrammeforOfficersoftheElectricityRegulatoryCommissions–(Nov2015),AnoopSingh
13. CentralElectricityAuthorityWebsite(http://www.cea.nic.in/)
14. IndiaEnergyExchangeWebsite(http://www.iexindia.com/)
15. NationalElectricPowerRegulatoryAuthorityWebsite(http://www.nepra.org.pk/)
16. NationalTransmissionandDispatchCompanyLtdPakistanWebsite(http://www.ntdc.com.pk/)
17. LahoreElectricSupplyCompanyWebsite(http://www.lesco.gov.pk/)
Bibliography

33
Wearegratefultoallthestakeholderswhohaveprovidedtheirvaluableinputs/suggestioninpreparingandfinalizingReporton“PotentialforPowerTradeinWesternPartofSouthAsia:Techno-EconomicRationale”.
We are grateful to United States Agency for International Development (USAID) for its generoussupport.Wewould like toexpressoursincere thanks toMs.MonaliZeyaHazra,RegionalEnergyManagerandCleanEnergySpecialistfortheirvaluableinputsandsuggestions.
WesincerelythankDr.KiritS.Parikh,FormerMember,PlanningCommission,India,andChairman,IRADeandDr.JyotiParikh,ED,IRADefortheirvaluablesuggestionsandguidanceallalong.
WealsothankMr.RajivRatnaPanda,Head-TechnicalatSARI/EIProjectSecretariatforallhisvaluableanalyticalandtechnicalinputsandsuggestionsinpreparationofthisreport.
WewouldliketothankSARI/EIconsultantviz.Mr.TusharSudandMr.RajneeshSharmaofDeloitteToucheTohmatsuIndiaLLP(DTTLLP),forpreparingandfinalisingthisreport.
WealsoliketothankMr.Nikhil,ResearchAssistant,IntegratedResearchandActionforDevelopment(IRADe)forprovidinghissupportinreportwritingcopyeditinganddesigningofthereport.
Wealsoacknowledgeandexpressourappreciationforallthoseindividualswhosenamescannotbepennedherebutwhohaveofferedvaluableinsightsandgeneroussupportthroughoutthisexercise.WehopethatthisreportwillinitiatethoughtprovokingdiscussionamongSAcountrygovernments,electricity regulators of South AsianCountries, Policy and decisionmakers, developers/investors,financialinstitutionsandwillserveasavaluableresourcedocumentforpromotingCBETinPanSouthAsiaRegion.
Acknowledgements
34
ABOUT SARI/EI
Over the past decade, USAID’s South Asia Regional Initiative/Energy (SARI/E) has been advocating energy cooperation in South Asia via regional energy integration and cross border electricity trade in eight South Asian countries (Afghanistan, Bangladesh, Bhutan, India, Pakistan, Nepal, Sri Lanka and the Maldives). This fourth and the final phase, titled South Asia Regional Initiative for Energy Integration (SARI/EI), was launched in 2012 and is implemented in partnership with Integrated Research and Action for Development (IRADe) through a cooperative agreement with USAID. SARI/EI addresses policy, legal and regulatory issues related to cross border electricity trade in the region, promote transmission interconnections and works toward establishing a regional market exchange for electricity.
ABOUT USAID
The United States Agency for International Development (USAID) is an independent government agency that provides economic, development, and humanitarian assistance around the world in support of the foreign policy goals of the United States. USAID’s mission is to advance broad-based economic growth, democracy, and human progress in developing countries and emerging economies. To do so, it is partnering with governments and other actors, making innovative use of science, technology, and human capital to bring the most profound results to a greatest number of people.
ABOUT IRADe
IRADe is a fully autonomous advanced research institute, which aims to conduct research and policy analysis and connect various stakeholders including government, non-governmental organizations (NGOs), corporations, and academic and financial institutions. Its research covers many areas such as energy and power systems, urban development, climate change and environment, poverty alleviation and gender, food security and agriculture, as well as the policies that affect these areas.


Potential for Power Trade in Western Part of South Asia :Techno-Economic Rationale
SOUTH ASIA REGIONAL INITIATIVE FORENERGY INTEGRATION (SARI/EI)