potential for agricultural finance in ukraine for agricultural finance in ukraine study paper table...
TRANSCRIPT

Potential for Agricultural Finance in Ukraine
Study Paper


Table of contents
Introduction ............................................................................................................................................. 6
Executive summary .................................................................................................................................. 7
1 Methodology ..................................................................................................................................... 13
1.1 General approach ................................................................................................................................. 13
1.2 Assessment of supply ........................................................................................................................... 13
1.3 Assessment of demand ........................................................................................................................ 15
2 Relevant economic and political background ....................................................................................... 17
3 Agricultural sector .............................................................................................................................. 18
3.1 Overview ............................................................................................................................................... 18
3.2 Farm structures .................................................................................................................................... 18
3.3 Production trends ................................................................................................................................. 19
3.4 Trends in foreign trade in agricultural products ................................................................................... 21
3.5 Farm productivity ................................................................................................................................. 22
3.6 Agricultural policy and government support ........................................................................................ 22
3.7 Investment climate ............................................................................................................................... 23
3.8 Land market .......................................................................................................................................... 25
4 Supply of agricultural finance ............................................................................................................. 26
4.1 Banking sector ...................................................................................................................................... 26
4.2 Non-bank lending sector ...................................................................................................................... 30
4.3 Insurance companies ............................................................................................................................ 31
4.4 Leasing companies ................................................................................................................................ 33
4.5 Assessment of agricultural financial products ...................................................................................... 35
4.6 Specific internal and external challenges for agricultural and rural finance ........................................ 38
4.7 Value chain financing ............................................................................................................................ 41
5 Demand for agricultural finance (results of the demand-side survey) ................................................... 45
5.1 Perceived access to finance for small farmers and rural households .................................................. 45
5.2 Potential demand for financial products .............................................................................................. 46
6 Conclusions and recommendations ..................................................................................................... 52
6.1 Estimation of the agrifinance market gap ............................................................................................ 52
6.2 Opportunities for financial products .................................................................................................... 54
6.3 Technical assistance ............................................................................................................................. 56

Acronyms and abbreviations
BFC Business & Finance Consulting
CIDA Canadian International Development Agency
CIT Corporate income tax
DCFTA Deep and Comprehensive Free Trade Agreement
DerzhFinPoslug State Commission for Regulation of Financial Services Markets
DerzhStat State Statistics Service of Ukraine
EBRD European Bank for Reconstruction and Development
EFSE European Fund for Southeast Europe
EU European Union
EUR Euro (currency)
FAO Food and Agriculture Organization of the United Nations
FDI Foreign direct investment
FiM Finance in Motion
FX Foreign exchange
GDP Gross domestic product
GfK Gesellschaft für Konsumforschung
GIZ Deutsche Gesellschaft für Internationale Zusammenarbeit
GosStrakh State Insurance Company of the USSR
GUF German-Ukrainian Fund
IER Institute for Economic Research and Policy Consulting
IFC International Finance Corporation
IFI International financial institution
IFRS International financial reporting standards
IMF International Monetary Fund
IPO Initial public offering
IT Information technology
MEDA Mennonite Economic Development Associates
MFI Microfinance institution
MSEs Micro and small enterprises
NBU National Bank of Ukraine
NPL Non-performing loan
SMEs Small and medium enterprises
TA Technical assistance
UAH Ukrainian hryvnia (currency)
UMLP Ukraine Micro-Lending Programme
UCAB Ukrainian Agribusiness Club
USAID United States Agency for International Development

3
USD United states dollar (currency)
VAKS All-Ukrainian Association of Credit Unions
VAT Value added tax
VC Value chain
WTO World Trade Organization

4
Definitions
Agricultural finance or agrifinance
Financing agricultural activities, which broadly include crop production, ani-mal husbandry, seed and seedling production, rural crafts, irrigation, agro-chemical and fertilizer production, post-harvest activities, processing, sales and marketing of agricultural output, as well as any activity supporting the above. Agrifinance products include credit, leasing and insurance, designed for and provided to agriculture and agribusiness along the whole food value chain from farm to fork.
Agricredit Specific short- and long-term financial products, including loans, designed to cover working capital and investment needs in agriculture and food.
Agrileasing Leasing products for the agricultural and food sector usually comprise agri-cultural machinery and food processing equipment, leased for a defined pe-riod. The client pays a leasing rate including implicit interest payments.
Agri-insurance Insurance products for the agricultural sector usually cover risks of crop and livestock production against adverse weather conditions and insurance against other risks of losing movable and immovable assets.
SME finance Provision of financial services to small and medium sized enterprises, e.g. farmers below 2,000 ha.
Biomass production Organic materials used for industrial and energy purposes, including liquid biofuels (biodiesel, ethanol), solid biofuels (wood, straw) as well as biogas.
Market gap Unmet need on the market for certain products.
Microfinance Provision of financial services to low-income clients, e.g. rural households and small private farmers.1
Portfolio at risk Portfolio of overdue loans.
Seasonal loan A loan made for financing a predictable periodical activity, e.g. from seeding to harvesting in agriculture.
Value chain financing The flow of financing within a subsector, among value chain (VC) actors, for the purpose of getting products to market. This requires a relationship and exchange among VC actors.2 Usually, a bigger agribusiness operator (proces-sor, trader) integrates many smaller producers of agricultural raw materials (grains, oilseeds, milk, meat, fruits, vegetables etc.), adding value through grading, sorting, processing, packaging and logistical operations and sells on to wholesalers or retailers. The integrator may facilitate access to credit and technology for smaller raw material suppliers to satisfy its own raw material requirements (quality, timing, farm practices).
If the flow of financing is among the VC actors, it is intra-VC (internal) financ-ing. If access to finance by one actor is independent of other VC actors, it is extra-VC (external) financing.
Input financing Provision of finance for agricultural inputs (seeds, agrochemicals, fertilizers) at the time of sowing by promissory notes for the future harvest (Brazilian model).
1 The draft law of Ukraine “On microcredit for small enterprises by specialized institutions” is still awaiting its review by the Parliament. Micro-credit is defined there as an uncollateralized credit, the amount of which does not exceed the equivalent of EUR 15,000 and the term of which is generally up to one year. See http://w1.c1.rada.gov.ua/pls/zweb2/webproc4_1?id=&pf3511=12629 2 CGAP, “Value chain finance: financing to and within value chains”, available at http://www.cgap.org/gm/document-1.9.2312/africaday_Theme6.pdf

5
Promissory note A negotiable instrument, whereby one party makes an unconditional promise in writing to pay a determinate sum of money to the other, either at a fixed or determinable future time or on demand of the payee, under specific terms. Whereas promissory notes are evidence of a loan, they are not loan contracts.
Warehouse receipt Guarantee document of a warehouse for agricultural stocks of a specific pro-ducer that may be used as collateral for obtaining loans.
Futures contract A standardized contract between two parties to exchange a specified asset of standardized quantity and quality for a price agreed today with delivery oc-curring at a specified future date. The contracts are traded on a futures ex-change. Some futures contracts may call for physical delivery of the asset, while others are settled in cash.
The biggest agricultural futures stock exchange, CBOT (member of CME Group), is located in Chicago. The biggest European one is the French MATIF in Paris.
Forward contract A non-standardized contract between two parties to buy or sell an asset at a specified future time at a price agreed today. Forward contracts are very sim-ilar to futures contracts, except that they are not exchange-traded, or de-fined on standardized assets.
A farmer, e.g. corn producer, would use a forward or futures contract to "lock-in" a certain price for his corn for the upcoming harvest and reduce risk (hedge). To benefit from probable future corn price rises he would at the same time buy future options at higher prices (going long) at a futures stock exchange. Market participants betting on falling prices would buy future op-tions at lower prices (going short). Futures exchange contracts hedge the market risks of producers.

6
Introduction Currently, Ukrainian rural areas are characterized by a lack of reliable and accessible financial products for agricultural clients. At the same time, banks remain very conservative towards agricultural clients, especially those of small and medium size, citing various challenges in serving the sector. To get a detailed picture of the main characteristics of the supply of financial services to the agricultural sec-tor and demand patterns for the whole range of financial services by the agricultural sector, the Develop-ment Facility of the European Fund for Southeast Europe (EFSE DF) has commissioned a sector study, which included:
• an assessment of the current supply of agricultural financial services • an assessment of the demand for agricultural financial services.
The ultimate purpose of the study was to recommend viable solutions for facilitating the design of financial products to increase the supply of agricultural finance. The study was conducted in the period of June to November 2011 and consisted of three phases:
I. Desk research and preparation of tools and update of procedures for the field research phase.
II. Field research covering focus group discussions with individual, micro and small farmers, a quantita-tive demand survey of agricultural value chain players and individual face-to-face interviews with representatives of the financial sector, government bodies, and the international development community.
III. Follow-up and report writing. The major findings of the field research phase incorporate the results of the desk research presented in this comprehensive report. All confidential information collected for the purpose of the study has been removed. For the purpose of completing this study, EFSE DF commissioned Business and Finance Consulting (BFC) who subcontracted the following organizations in Ukraine:
• Institute for Economic Research and Policy Consulting (IER), a Kyiv-based think tank represented by three permanent staff members in the expert team
• Gesellschaft für Konsumforschung (GfK), a German consumer research consultancy with a branch of-fice in Kyiv, to support the implementation of the demand survey in selected regions.
The team of experts included:
• Heinz Strubenhoff (IER), team leader/international agricultural expert, • Sorin Revenko (BFC), financial sector development expert, • Oksana Kuziakiv (IER), senior researcher, • Oleh Nivievskyi (IER), research assistant, • Dmitry Yablonovskyy (GfK), demand survey implementation • John Ryan Elenbaum (BFC), survey backstopper, • Michael Kortenbusch (BFC), project backstopper

7
Executive summary
There is an estimated agrifinance gap of USD 8.7 billion in the Ukraine. The current agrifinance supply of about USD 3.3 billion falls short of meeting overall demand, estimated at USD 12 billion.
Despite the huge potential of Ukrainian agriculture, banks are currently focusing only on the largest play-ers and are reluctant to invest in the necessary agronomy-based risk assessment and capacity. Non-bank ser-vice providers, including insurance and leasing services as well as MFIs and credit unions, also remain under-developed. Village households, private farms and corporate farms below 2,000 ha suffer from constrained access to finance. Three quarters of demand survey respondents had never taken out a loan. However, 20 per cent per cent of respondents were interested in applying for a loan within the next 12 months. About 35 per cent per cent of all Ukrainian farms are trapped in a vicious circle of low solvency, low yields, low margins, bad management and therefore low creditworthiness.
ECONOMIC AND POLITICAL BACKGROUND The Ukrainian economy has slowly recovered from the global financial crisis3 and showed positive trends in the first half of 2011. The overall growth rate of the Ukrainian economy is expected to be 5.5 per cent per cent in 2011.4 However, the current Eurozone crisis is increasing economic risks, and a devaluation of the Ukrainian currency in 2012 cannot be excluded. Lending to small and medium-sized enterprises and house-holds is still below pre-crisis levels. Politically, Ukraine is caught between Russia and Europe, with the outcome uncertain. Russia is increasing its pressure on Ukraine to join the customs union with Russia, Belarus and Kazakhstan. At the same time, ne-gotiations with the EU on a Deep and Comprehensive Free Trade Agreement (DCFTA) are being finalised, however relations with Europe have recently come under strain.
UKRAINE’S AGRICULTURAL SECTOR
Farm structures Ukraine’s agriculture has considerable potential, including export potential, with 32 million ha of arable land and one-third of the world’s entire stock of black soils. The entire agro-industrial complex accounts for around 25 per cent of GDP. In 2010, agriculture alone accounted for 7.2 per cent of total GDP and provided jobs for about 6 per cent of the employed population. Ukraine’s farm sector is characterized by a three-way split between 6 million tiny household farms, 40,000 medium-sized peasant farms, and 9,800 large corporate farms. The country is currently undergoing a major land consolidation process. An increasing number of corporate farms are coming under the control of huge agri-holdings, which now farm 13 per cent of prime agricultural land. Meanwhile, the peasant farm sector is in a steep decline.
Production trends
3 The financial crisis arrived in Ukraine in October 2008 and led to a sudden halt in the foreign capital inflows that had previously balanced the current account deficit. As a consequence, the local currency lost about 40 per cent per cent of its value by spring 2009. The economy shrank by about 15 per cent per cent in 2009. 4 See the monthly economic monitor and quarterly economic forecast of the Institute for Economic Research and Policy Consulting (IER).

8
In total, crops account for 60 per cent of Ukraine’s gross agricultural output, with livestock and milk con-tributing the remaining 40 per cent. Farm structures drive the overall agricultural specialization in the country. Labour-intensive crops such as potatoes, fruits and vegetables, but also milk and meat, are primarily produced on household plots, while export-oriented cereal and oilseed crops are produced by large corporate farms. Cereals, oilseeds and pota-toes dominate Ukrainian crop production. While growing domestic consumer demand has recently made meat and milk production attractive for producers, growth trends have been mixed. Biomass production re-mains marginal.
Foreign trade Agriculture and the food industry are among the most export-oriented sectors in the economy, and Ukraine has emerged as an important supplier of global markets for its leading agricultural export commodities.
Farm productivity Crop yields still lag behind EU levels, but are slowly increasing, albeit with significant variation between in-dividual farms.
Policy, legislation and regulation Ukraine’s agricultural policy framework is seen as unpredictable, inconsistent and opaque. State support has been unpredictable in terms of both its direction and its volume. The overall level of support for produc-ers is modest.
Land market Agriculture in Ukraine has been developed on leased land because of a ban on selling agricultural land plots. A total area of about 17 million ha is currently leased out through 4.6 million contracts. A lifting of the moratorium on farmland trade is expected soon, but the potential impact on rural financial markets of doing so may prove to be limited. It is anticipated that minimum land prices will be set by the Government at levels higher than expected, which would be likely to lower the number of transactions. In any case, lifting the moratorium will allow lenders to take land as collateral which is not possible currently.
SUPPLY OF AGRICULTURAL FINANCE
Banking sector In 2010, the banking system surpassed its pre-crisis deposit base level, but the total loan portfolio re-mained almost flat. Banks found it difficult to expand their loan portfolios due to reduced demand for loans, especially from the retail sector, and their own more conservative credit policies. As a result, Ukrainian banks currently have high liquidity levels, leading to highly volatile interest rates. A high level of non-performing loans has been the major drag on the profitability of the Ukrainian banking sector and its ability to extend credit. According to data from the National Bank of Ukraine (NBU) data, the ratio of non-performing loans (NPL) reached 11.2 per cent at the end of 2010, but independent observers suspect that ‘true’ NPL levels are much higher. Borrowers in the agriculture and food sectors are performing above average. Overall, the financial position of the banking system has been strengthened, but remains weak. The agriculture and food sector in Ukraine became attractive to banks only in 2011. As of August 2011, the agricultural portfolio (including the food industry) reached UAH 66 billion, an increase of 23.1 per cent over UAH 53.6 billion at the end of August 2010. Nevertheless, the agricultural sector is generally not the first pri-ority of many commercial banks. Banks appreciate the sector as such but sharply differentiate between com-

9
panies according to size. Smaller farms and rural households are underrepresented in bank portfolios. The largest and second largest banks in Ukraine together hold more than 35 per cent of the total agricultural portfolio, with a focus on large enterprises. The performance of individual companies and farms varies more in Ukraine than elsewhere, making risk assessment difficult for banks. This implies that banks must invest in risk assessment tools able to assess the risk of an individual farm. Until now, commercial banks have been underinvesting in such specific sector risk assessment capacity.
Non-bank lending sector Credit unions remain marginal, including to agricultural financing, and are slowly losing the small market share that they have. At the end of 2010, over 600 credit unions between them held UAH 3.4 billion in loans. The role of other credit institutions is also marginal and in decline. The total loan portfolio of other financial institutions amounted to UAH 3.8 billion as of the end of 2010.
Insurance companies The insurance sector in Ukraine shows signs of recovery but is still performing below pre-crisis levels. Major reforms are needed to stimulate future development. Agricultural insurance represents only a very modest segment of the general insurance system in the coun-try. Neither agricultural producers nor lending institutions consider insurance to be a reliable risk mitigation instrument. Farmers do not trust the insurance sector, arguably for good reasons. The crop area insured be-tween 2005 and 2009 constituted less than 3 per cent of the total seeding area. Only a few insurers are systemically involved with agricultural insurance. The two sector leaders between them hold over 50 per cent of the total market.
Leasing companies The leasing business in Ukraine is still incipient, constituting a small proportion of total investments in the economy. At the end of 2010, lease agreements amounted to a total value of UAH 30.6 billion, less than 0.5 per cent of GDP. The volume of agricultural leasing was less than 1 per cent of total agricultural output. The market has recently seen a spectacular turnaround and continued growth is expected due to an im-proved tax environment and the overall economic recovery. With 13 per cent of the market, agriculture was the second most important sector for lease transactions. The share of agriculture has been growing strongly over the last three years.
Assessment of agricultural financial products Most banks do not offer products specifically designed for agriculture. Even simple agricultural financial products need business-specific risk assessments. This even applies to seasonal loans, which are the most common financial product offered to agriculture by commercial banks. Long-term loans need even more spe-cific knowledge and risk assessment tools. The moratorium on farmland sales still limits the use of agricultur-al land as collateral. Whether the expected lifting of the moratorium will significantly improve this situation is debatable. Agricultural insurance in Ukraine is mostly offered on the basis of traditional products. About a dozen in-surance companies currently offer basic agricultural products. The further development of the sector is sty-mied by methodological hurdles and market distortion by the State. Leasing companies offer a wide range of agricultural machinery and equipment.

10
Challenges for agricultural and rural finance The most important challenges for agrifinance are:
Risk assessment
Seasonality
Volatility
Targeting
Financial literacy of borrowers. Lenders tend to believe that the agricultural sector is highly risky. Insufficient understanding of agricultural production leads lending institutions to increase their interest rates to cover for risks they cannot properly assess. Lenders would welcome external assistance to improve their risk management function.
IFIs and donor activities International donors have become increasingly interested in agrifinance in Ukraine in recent years, but so far they have focused on the bigger players. This contributes to biased access to finance in an environment with unequal opportunities for small and big agricultural producers.
Value chain financing Access to finance is much easier for processors and wholesalers selling large quantities of goods with a shorter project cycle than for agricultural primary producers. Processors, input suppliers or wholesale trad-ers may be willing to support financing institutions to channel loans into the primary sector. Value chain fi-nancing has been successfully implemented in many parts of the world and some promising pilots already exist in Ukraine.
DEMAND FOR AGRICULTURAL FINANCE
Demand survey The study team conducted focus group discussions and a survey of 600 agricultural enterprises in order to assess the demand for agricultural finance in Ukraine. The survey was conducted in 10 regions, representing all parts of the country and covering all the main agricultural areas.
Access to finance for small farmers and rural households Three quarters of survey respondents had never taken out a loan. Amongst borrowers, loans with terms no longer than a year predominated. Over half of crop and livestock producers pledged no collateral. Enhancing the existing business and household consumption were the two main loan purposes. About a half of all re-spondents repaid their loan in full on time.
Prospective demand for financial products Around 20 per cent of respondents may be interested in applying for a loan within the next 12 months. Half of the potential borrowers would choose a loan duration of up to 12 months. The vast majority of inter-ested respondents consider banks as the main potential lenders. Enhancing the existing business was the major potential loan purpose. The cost of a loan was cited as the most important factor for selecting a lender. Use of leasing, property insurance and crop insurance is rare among households and small farmers. Lack of trust is a key barrier to insurance market growth.

11
CONCLUSIONS AND RECOMMENDATIONS
Conclusions There is an agrifinance gap of USD 8.7 billion in the Ukraine. The current agrifinance supply of about USD 3.3 billion falls short of meeting overall demand, estimated at USD 12 billion. This finance gap is currently trapping about 35 per cent of all Ukrainian farms in a vicious circle. Potential demand is estimated to be even higher than current demand if constraints on finance were removed.
Recommendations for financial support Assistance for improved access to finance should be based on the following four principles:
1. Keep project risk levels low to medium for the first projects in order to build a track record in what is considered a difficult market environment.
2. Apply a long term view in terms of expected impact due to the size of the economy and political and economic uncertainties.
3. Seek partnerships with other players in recognition of the need to achieve impact through the im-provement of a number of interrelated problem areas.
4. Ensure strong technical assistance. The structure of onlending resources to be made available to banks will be consistent with the proposed conditions of loan and leasing products to end borrowers as described in the table below. Table 1 Overview of the proposed financial products
Description Target group
Loan pur-pose
Loan size (USD)
Loan pricing
Term Collateral Loan pro-cessing time
Risk level
Level of effort
Agricultural machinery leasing
Farms 500 – 2000 ha
Mov-able assets
100-500k
Above aver-age
3-5 years
Equip-ment to be pur-chased
10 days Me-dium
Low
Seasonal crop loans
Farms 500 – 2000 ha
Work-ing capi-tal
75-150k
Market rates
12 months
Fixed and movable assets
2 days Me-dium
Low
Investment loans for village milk tanks
Village house-holds with 1 – 3 cows
Fixed assets
50–100k
Above aver-age
3-5 years
Equip-ment to be pur-chased
30 days Me-dium
High
Investment loans for village cold stores
Village house-holds and small farms (2 – 100 ha)
Fixed assets
50-100k
Above aver-age
4-6 years
Equip-ment to be pur-chased
30 days High High

12
Recommendations for technical assistance support The scope and intensity of technical assistance support will be defined based on the specific needs of a given partner institution and the complexity of financial services to be provided to the target group. For a typical partner institution the intervention requirements are assessed as follows. Table 2 Overview of the technical assistance requirements on the supply side
Financial product Awareness building
Staff capacity
Product develop-ment
Risk man-agement
Efficiency of opera-tions
Infrastruc-ture and IT
Seasonal loan Low Medium Low High Low Medium
Agricultural leasing Low Medium Low High Low High
Long-term loan for village milk tank
High High High Very high High Medium
Long-term loan for village cold store
High High High Very high High Medium
13
1. Methodology
1.1 General approach The study was organized in the following way:
First step: collection of publicly available information, telephone interviews with key sources, inter-net searches, and meetings with selected experts.5 Second step: focus group workshops in three regions with key representatives of agriculture, agri-business and agrifinance; launch of a demand survey in various regions with at least 600 respond-ents. Third step: guided interviews with selected suppliers of agrifinance products including commercial banks, IFIs and international donor agencies, leasing companies, credit unions and regulatory and governmental authorities. Fourth step: bringing together the results of the demand and supply-side surveys to quantify the market gap; developing recommendations for financing schemes and financial products.
1.2 Assessment of supply
1.2.1 Organisation and implementation of supply-side assessment
The desk research supported the hypothesis that large parts of the Ukrainian agricultural sector are under-serviced by the financial sector and that rural areas are characterized by a lack of reliable, affordable and ac-cessible financial products for rural households and farms below 2000 ha in size. The aim of the field study was to complement the desk research with additional quantitative and qualitative data. The field study of the supply side had the following objectives:
To complement the picture of the main characteristics of the supply of financial services to the agri-cultural sector with the perspectives of financial institutions;
To get an understanding of the underlying reasons for the challenges cited by financial sector actors as limiting their ability to better serve the agricultural sector, including:
o High (perceived) risk of agricultural production o Inadequate access to modern payment systems o Low financial capability of (potential) clients o Limitations of existing property rights legislation;
To assess the need of financial institutions for technical assistance (TA) and other support;
To identify other aspects of agricultural development in Ukraine, including the perspectives of gov-ernmental agencies, non-governmental organizations (NGOS) and donor agencies, as well as interna-tional best practices applicable to Ukraine;
To identify promising financing schemes and products;
To investigate potential products where finance providers (agribusinesses and banks) are advanced in their concept development (with existing credit schemes);
To investigate existing value chain financing schemes, including food processors and input and out-put traders, which need additional external funding;
To explore opportunities in the agrileasing and agri-insurance sectors.
5 Key information has been assessed and updated to structure information on the agriculture, food and financial sectors. In addi-tion, a detailed methodology for demand- and supply-side surveys has been developed. The first step was documented in the interim report (output 1) and accompanying methodology (output 2).
14
The field study comprised face–to-face interviews with financial institutions and representatives of the regu-latory authorities (bank and non-bank) and other relevant stakeholders from the financial sector. Field work in Ukraine took place in September 2011.
1.2.2 Selection of banks, financial institutions and contact persons
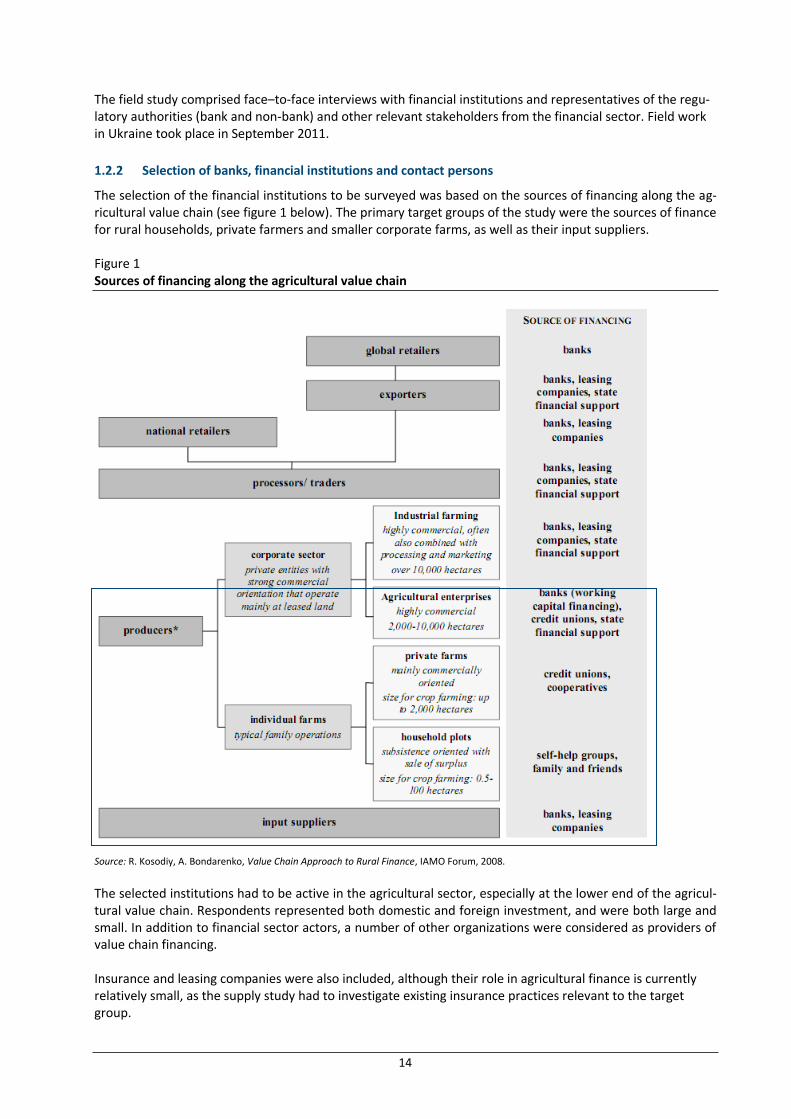
The selection of the financial institutions to be surveyed was based on the sources of financing along the ag-ricultural value chain (see figure 1 below). The primary target groups of the study were the sources of finance for rural households, private farmers and smaller corporate farms, as well as their input suppliers. Figure 1 Sources of financing along the agricultural value chain
Source: R. Kosodiy, A. Bondarenko, Value Chain Approach to Rural Finance, IAMO Forum, 2008.
The selected institutions had to be active in the agricultural sector, especially at the lower end of the agricul-tural value chain. Respondents represented both domestic and foreign investment, and were both large and small. In addition to financial sector actors, a number of other organizations were considered as providers of value chain financing. Insurance and leasing companies were also included, although their role in agricultural finance is currently relatively small, as the supply study had to investigate existing insurance practices relevant to the target group.

15
The following financial institutions and organizations were interviewed:
Financial institutions and/or their associations active in agrifinance (15 meetings)
Representatives of international donor organizations and specific projects (7 meetings)
Companies and organizations involved in value chain financing (4 meetings)
Governmental bodies and state agencies (5 meetings) Each targeted institution was contacted first by a letter introducing the project and requesting a meeting. Along with the meeting request, a special upfront information request was sent to the financial institutions to collect preliminary data about the institution prior to the visit. This allowed for more efficient interviews. The following face-to-face interviews allowed the consultants to obtain more details and qualitative infor-mation to supplement desk research and the information received through the upfront request. When meet-ing with a financial institution, a list of questions was used in order to ensure that all relevant topics were addressed.
At a minimum, the interviews covered the following topics:
Agricultural finance portfolio
Risk assessment (of agricultural clients)
Product range (with the focus on agriculture)
Current problems and future potential
Capacity–building.
1.3 Assessment of demand
1.3.1 Organization and implementation of demand-side assessment
The aim of the field study was to complement desk research by acquiring additional quantitative and qualita-tive data through a detailed assessment of the financing needs and other expectations of agricultural MSMEs in Ukraine. The findings from the demand assessments were compared against data from other sources used for this study. The demand study included two stages:
Qualitative assessment (focus group discussions)
Quantitative assessment (regional survey with face-to-face interviews). The focus group discussions elicited qualitative data on the demand side of agrifinance by collecting “on the ground” information about the main impediments to agribusiness development in Ukraine. This included views on the current development of the agricultural sector and on existing and expected policies and regula-tions affecting agriculture. The results of the focus groups were used for finetuning the face-to-face interview templates as well as for drawing conclusions for the overall study. The purpose of the quantitative survey was to obtain quantitative data on these issues, as well as descriptive data on the specific characteristics of potential clients for different agricultural finance products. The survey requested data related to respondents’ socio-demographic situation, business activities and related debt ca-pacity, prior credit history, experience with existing financial institutions, level of financial education, etc. The following topics were covered in these two stages:
Access to finance, agricultural insurance and leasing
Perceptions and implications of land reform
Existing and proposed policies and regulations affecting agriculture
Experience with obtaining finance
Financing needs and preferences regarding funding sources amongst the target groups (individual farmers, micro and small farms) and amongst the related agricultural production systems and rele-vant supply chains

16
Existing and potential external or internal incentive schemes, technical assistance, skills develop-ment, or other necessary support measures for financial institutions
Supply of financial services from an agricultural sector perspective, including successful products, services or procedures
Reasons for the assumed demand-supply gap for financial services in the agricultural sector and the volume and specific features of this market gap.
1.3.2 Qualitative demand-side assessment: focus group discussions and in-depth interviews
Each focus group consisted of 8—10 participants. The target group was represented by village and private farmers. These were located through the GfK database, through data made available by DerzhStat and through the regional network, including use of the snowball method. The onsite focus groups took place in Kiev and Dnepropetrovsk. Each location involved respondents seg-mented into two different groups: rural households (avg. 2 ha) and private farmers (avg. 100 ha). In addition, GfK conducted six in-depth interviews in Kiev, Dnepropetrovsk and Vinnitsa. These locations were chosen due to their high agricultural production relative to other regions of the country, along with lower overhead costs due to their proximity to each other. The interviews were based on the same set of questions and were conducted with one representative of each of the following four categories:
Corporate farmers (avg. 1,000 ha) — 2 interviews o Grain and oilseed industry o Livestock industry
Processors — 2 interviews o Dairy industry o Canning industry
Input suppliers — 1 interview
Input and output traders — 1 interview.
1.3.3 Quantitative demand-side assessment: face-to-face interviews
The total number of survey respondents was 784, evenly distributed across the surveyed regions. The survey sample had three dimensions: regions, type of agricultural activity and type/size of entity. A pilot survey con-sisting of 30 interviews in both Ukrainian and Russian was used to validate the questionnaire. The survey was conducted in 10 agrarian regions of Ukraine representing all parts of the country (east, west, south and centre) and covering all main agricultural areas:
Central Ukraine (Kiev, Dnepropetrovsk, Poltava, Cherkassy, Vinnitsa)
South Ukraine (Odessa, Kirovograd, Mikolayiv)
Western Ukraine (Lviv)
Eastern Ukraine (Donetsk) The demand survey questionnaire included questions covering the following areas:
Socio-demographic information about the respondent and his/her household
Business information about the MSE (general data, as well as details on credit absorption capacity, creditworthiness, etc.)
Borrowing needs of the MSE and household
Credit history of the owner and business
Experience with existing financial institutions and services
Desired product characteristics
Demand for other products and services, including transfers, savings, insurance, leasing, consumer loans, mobile banking and business development services
Demand for financial literacy or other training related to business operations.

17
2 Relevant economic and political background The Ukrainian economy has slowly recovered from the global financial crisis3 and showed positive trends in the first half of 2011. The recovery process after the crisis led to higher growth rates in the industrial and construction sectors and surging average wages in the first quarter of 2011. Agricultural growth in the first quarter of 2011 was modest at 5.3 per cent, due mainly to growth in the pork and poultry sectors. The overall growth rate of the Ukrainian economy is expected to be 5.5 per cent in 2011.4 However, the current Euro-zone crisis is increasing economic risks. A growing current account deficit, shrinking currency reserves of the National Bank and reduced capital inflows may reduce growth. A devaluation of the Ukrainian currency in 2012 cannot be excluded if international commodity prices important for Ukraine (steel and agriculture) should plummet. IFIs continued their investments in Ukraine in 2011. The World Bank and IMF support the Government of Ukraine and the private sector with financial programmes linked to key sector reforms.6 IFC and EBRD have included the agricultural sector in their lending programmes. The commercial banking sector is again lending to companies, but primarily to big business. Lending to small and medium-sized enterprises and households is still below pre-crisis levels. In the fourth quarter of 2011, the National Bank tightened money supply, lead-ing to a rapid increase in interest rates. The exchange rate of the domestic currency is in practice pegged to the US Dollar.7 A gradual transition to more flexible exchange rate policies (inflation targeting) may emerge as a future option, as part of a strategy to tamp down consumer price inflation and balance Ukraine’s current account deficit and volatile capital in-flows. This factor has to be taken into account by banks and investors. During the last quarter of 2008, the national currency depreciated considerably, leading to severe cash flow problems for investors, including in agribusiness, who had a high proportion of loans in foreign currencies. Currently, the proportion of foreign currency loans is much lower. Russia is increasing its pressure on Ukraine to join the customs union with Russia, Belarus and Kazakhstan. At the same time, negotiations with the EU on a Deep and Comprehensive Free Trade Agreement (DCFTA) are being finalized. At the time of writing this report, it is not yet clear whether the agreement will be signed before the end of the year, as relations with the EU are strained following the imprisonment of former gov-ernment officials in Ukraine. As the EU is a net exporter of many agricultural and food products, the scope for expansion of Ukrainian agrifood exports to the EU is quite limited. However, the DCFTA offers opportunities to upgrade food standards to international levels. It is expected that this will increase the future competi-tiveness of Ukrainian agriculture and food production value chains.
6 Conditionalities mainly include pension reform (retirement age for women should increase from 55 to 60), increase of retail gas prices for households (by 50 per cent) and further support of privatization and structural change. 7 In March 2011 the interbank exchange rate was fixed at UAH 7.97 per USD 1.
18
3 Agricultural sector8
3.1 Overview
Ukraine’s agriculture has considerable potential thanks to its rich agroclimatic endowments. Over half of the country’s territory — 54 per cent or about 32 million ha — is arable land, more than half of which con-sists of the most productive black soils in the world. With about one third of the world’s entire stock of black soils, Ukraine has an excellent basis for the production of crops, livestock and biomass for energy use.9 How-ever, about one-third of all arable land is situated on slopes with eroded soils and thus lower yields. In total, 27.5 million ha are now being used for crop production. The fallow area is only about 300,000 ha, while the area under perennial crops is 900,000 ha. Due to its relatively low ratio of population to arable land,10 Ukraine’s agriculture has considerable export potential. In addition, it is located near the main food and feed importing countries of the EU, North Africa, the Near East and Asia. The country’s ice-free Black Sea ports provide year-round direct access to world mar-kets. In 2010, agriculture accounted for 7.2 per cent of total GDP and provided jobs for about 6 per cent of the employed population. The share of the food processing industry in 2010 was approximately 8 per cent of total GDP, and 4 per cent of all employed workers. If sectors supporting the industry — agricultural machin-ery production, mineral fertilizer production, agrochemicals and feed — are included, the share of GDP of the entire agro-industry increases to about 25 per cent.
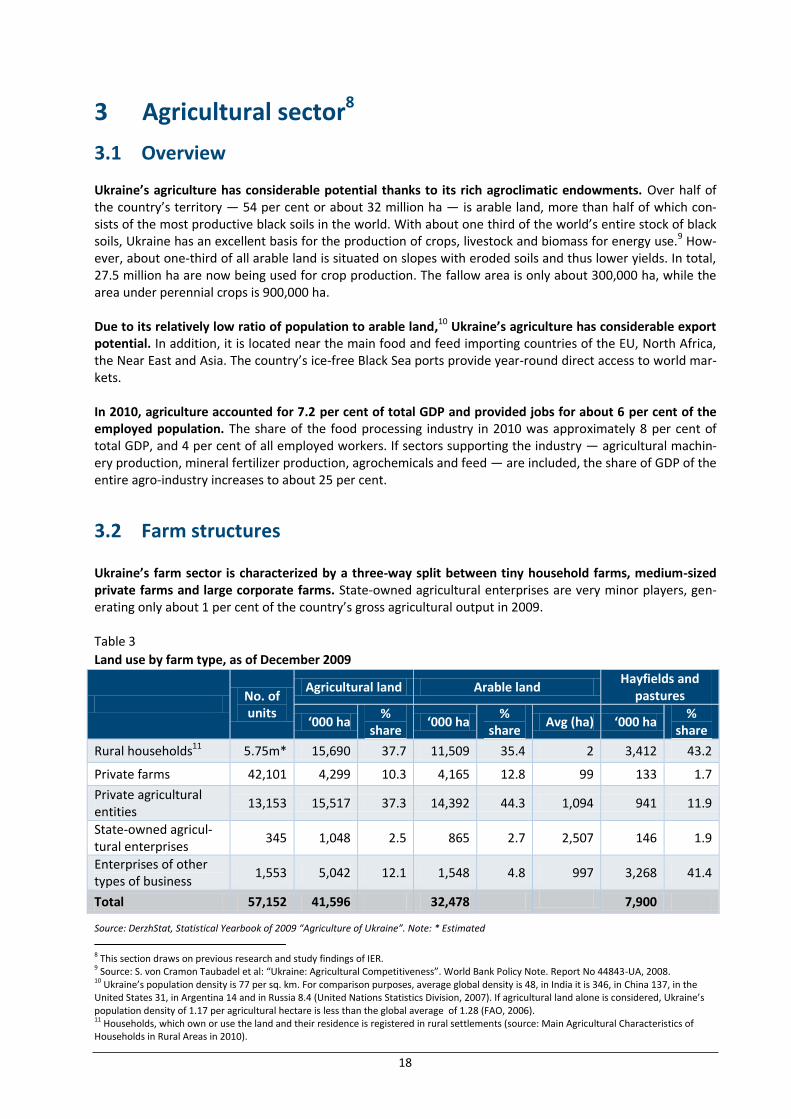
3.2 Farm structures Ukraine’s farm sector is characterized by a three-way split between tiny household farms, medium-sized private farms and large corporate farms. State-owned agricultural enterprises are very minor players, gen-erating only about 1 per cent of the country’s gross agricultural output in 2009. Table 3
Land use by farm type, as of December 2009
No. of units
Agricultural land Arable land Hayfields and
pastures
‘000 ha %
share ‘000 ha
% share
Avg (ha) ‘000 ha %
share
Rural households11 5.75m* 15,690 37.7 11,509 35.4 2 3,412 43.2
Private farms 42,101 4,299 10.3 4,165 12.8 99 133 1.7
Private agricultural entities
13,153 15,517 37.3 14,392 44.3 1,094 941 11.9
State-owned agricul-tural enterprises
345 1,048 2.5 865 2.7 2,507 146 1.9
Enterprises of other types of business
1,553 5,042 12.1 1,548 4.8 997 3,268 41.4
Total 57,152 41,596 32,478 7,900
Source: DerzhStat, Statistical Yearbook of 2009 “Agriculture of Ukraine”. Note: * Estimated
8 This section draws on previous research and study findings of IER. 9 Source: S. von Cramon Taubadel et al: “Ukraine: Agricultural Competitiveness”. World Bank Policy Note. Report No 44843-UA, 2008. 10 Ukraine’s population density is 77 per sq. km. For comparison purposes, average global density is 48, in India it is 346, in China 137, in the United States 31, in Argentina 14 and in Russia 8.4 (United Nations Statistics Division, 2007). If agricultural land alone is considered, Ukraine’s population density of 1.17 per agricultural hectare is less than the global average of 1.28 (FAO, 2006). 11 Households, which own or use the land and their residence is registered in rural settlements (source: Main Agricultural Characteristics of Households in Rural Areas in 2010).

19
Nearly 6 million small household farms, averaging 2 ha of land each, produce food primarily for subsistence purposes. Between them, they manage one third of Ukraine’s total agricultural land and generated nearly 55 per cent of the country’s gross agricultural output in 2009. They are not registered as legal entities. House-hold farms dominate the production of fruit, vegetables and, to a lesser extent, meat. About 42,000 private farms, with an average of 100 ha of arable land, cultivate about 13 per cent of Ukraine’s arable land but only generate 5 per cent of gross agricultural output between them (2009 figures). They are usually run by individual farmers, but are nevertheless formally registered as legal entities. Private farms mainly produce crops rather than livestock. They employ the same cropping patterns as corporate farms, but produce at similar or lower rates of intensity — a clear indicator that they are suffering from com-petitive disadvantage. There are about 13,000 corporate farms (including partnerships, enterprises and cooperatives) in Ukraine, each cultivating an average of 1,000 ha and together generating 39 per cent of gross agricultural output in 2009. They are usually the successors of former collective and State farms. Corporate farms produce most of Ukraine’s grains, sugar beet and rapeseed. In recent years, they have experienced a remarkable process of consolidation leading to fewer but larger farms. An increasing number of corporate farms are coming under the control of agri-holdings. These were creat-ed for different purposes and come in different sizes, shapes and organizational forms, but they share com-mon characteristics. Agri-holdings usually consist of a mother company that in most cases is not involved in primary agricultural production, but decides overall strategy, production orientation and investments and manages access to production factors, including input and output markets, land and finance. Such a mother company is typically “holding” 5-50 individual corporate farms of about 2,000-15,000 ha each, with the total size of the agri-holdings varying from 30,000 to 400,000 ha. The accumulation of these impressive “land banks” is the most visible and publicly discussed feature of agri-holdings. In 2010, agricultural holdings farmed more than 4 million ha of prime agricultural land in Ukraine, or 13 per cent of the total area. Official statistics obscure this trend towards large vertically-integrated structures by counting individual corporate farms but not taking into account their ownership structure. About 150 of the largest Ukrainian corporate farms (mainly agri-holdings) produced 40 per cent of the total output of wheat, 60 per cent of maize, 85 per cent of sunflower seeds, 80 per cent of rapeseeds, 80 per cent of poultry meat, 40 per cent of meat of all types and 20 per cent of raw milk.12 The private farm sector is in a steep decline. It lost more than 2,000 farms in 2010 and is also losing market share. There is wide variance in private farm performance: those with better results are promising, but the majority are trapped in a vicious circle of low liquidity leading to poor performance, low profitability and low investments and thus low growth. The government is reluctant to invest in farm advisory services and sup-port programmes for peasant farms, leaving most farmers to grow crops in low-input/low-output production systems. Structural change will most likely lead to a differentiation between well-performing farms with growth potential and farms without future prospects. The key differentiating factor seems to be the man-agement capacity of the owner.
3.3 Production trends
In total, crops account for about 60 per cent of Ukraine’s gross agricultural output, with livestock and milk contributing the remaining 40 per cent. Farm structures drive the overall agricultural specialization in the country. Labour-intensive crops such as potatoes, fruit and vegetables, but also milk and meat, are primarily produced on household plots while ex-port-oriented cereal and oilseed crops are produced by large corporate farms that benefit from the effects of scale.
12 Ukrainian Agribusiness Club, Ukrainian super-large farms: efficiency and competitiveness, Multi-client study, 2010.

20
3.3.1 Crops
Cereals, oilseeds and potatoes dominate Ukrainian crop production. Wheat, barley and sunflower seeds together cover about 70 per cent of Ukraine’s total arable land. The most impressive expansion has been in rapeseed cultivation, followed by soybean and sunflower seeds, reflecting Ukraine’s comparative advantages and the country’s response to global market develop-ments. Barley and corn have expanded considerably at the expense of rye and oats. The sugar beet area was reduced by three quar-ters and fruit and ber-ries by about two thirds. Grain output is gradual-ly returning to its level of 20 years ago and reached a maximum of 52 million tons in 2008 and 2011 (see Figure 2). Oilseed output has in-creased by even more, to about 10 million tons in 2010. Wheat produc-tion has remained large-ly constant over the last two decades.
3.3.2 Livestock
Over the last two dec-ades, both meat and milk production have declined by more than half. Meat production dropped from 4.4 mil-lion tons in 1990 to 1.9 million in 2010. Over the same period, milk production dropped from 24.3 to 11.3 million tons in 2010. Poultry production, however, has soared in recent years. Growing domestic consumer demand makes meat and milk production attractive for producers. Consump-tion patterns in Ukraine have been following world patterns, with consumption of dairy products, poultry and pork increasing fast. As the population grows richer, old staple foods tend to be replaced by more protein-rich products. For example, according to DerzhStat, consumption of meat and meat products has increased from 32.8 kg per person per year in 2000 to about 50 kg in 2009, while consumption of bread and bakery products has decreased from 128 to 111 kg per person over the same period. Products with a short production cycle show the most impressive growth trends. This is because livestock production requires a high level of investment, with returns dependent on the production life cycle. Poultry meat can be produced in a short period of time, with a high degree of efficiency in transforming feed grain into meat. Two of the biggest agri-holdings, MHP and Agromars, dominate the poultry meat market. The big-gest agri-holding, Avangaard, dominates the egg market. Pork can be produced in 6 months and beef in 18 months with feed conversion rates much lower than for poultry meat. As Ukrainian consumers favour pork, this sector has grown by about 20 per cent over the last three years. Big corporate pig farms are gaining mar-ket share, while household and peasant pork production is stagnating. Investment in milk production faces the longest production cycle; as a result, milk production is stagnating. Even higher milk prices do not immediately translate into higher production, as dairy farming is very capital-intensive, with a capital outlay of about USD 10,000 needed per cow. About USD 1 million is needed for an
Figure 2
Production of key crops and milk, 1990—2010, million tons
Source: DerzhStat, Statistical Yearbook of 2009 “Agriculture of Ukraine”

21
investment in 100 cows with returns in a cash flow stream of about 7 to 8 years which is too long to attract banks and investors in current capital market conditions. This explains why more than 80 per cent of raw milk is currently produced in rural households.
3.3.3 Biomass
Biomass currently constitutes only 0.5 per cent of total energy consumption in Ukraine.13 Ukraine’s energy strategy has set a target of 13 per cent of energy coming from renewable sources (including wind and solar) by 2030. Yet under current prices and without subsidies, most types of renewable energy sources produced from biomass (namely liquid biofuels) are not competitive with fossil fuels, explaining their low production volumes. Solid biomass (wood and straw pellets) currently attracts more investment, with a significant share of wood pellets being exported. Local consumption is limited, partly due to State subsidies for people using traditional fuel (gas and coal). Second-generation biofuels are only at the research and development stage. There are some prospects for making use of straw, which is currently just burned on fields; it is cheap, and there are increasing investments in straw-fired boilers based on Danish technology. Although the Govern-ment has introduced attractive “green” feed-in tariffs for electrical energy using renewable energies, invest-ments remain limited due to the Government’s very restrictive licensing and financial constraints. In Novem-ber 2011, the Government excluded electrical energy produced on the basis of biomass feedstocks from “green tariff” subsidies.
3.4 Trends in foreign trade in agricultural products
Agricultural production and the food processing industry play an increasingly important role in Ukraine’s foreign trade. In 2008, they accounted for 6.8 per cent and 7.1 per cent, respectively, of Ukrainian exports. The net export figures in the table below suggest that agriculture and the food industry are among the most export-oriented sectors in Ukraine’s economy. Table 4
Net exports of main agricultural product categories, 2002—2009, ‘000 tons
Products 2002 2003 2004 2005 2006 2007 2008 2009
Barley 2,621 1,384 4,305 3,898 5,089 995 6,367 6,221
Maize 788 1,238 2,320 2,452 1,003 2,050 5,485 4,990
Oats 6 7 17 0 -5 20 6 5
Rye 142 -90 104 69 2 0 6 56
Wheat 5,759 -3,299 4,369 6,393 3,287 901 12,963 9,309
Sunflower oil 910 978 640 1,514 1,867 1,324 2,098 2,645
Sunflower seeds 330 926 6 215 330 67 761 347
Sugar -1,110 -255 -43 -43 -10 -75 -41 -475
Beef and veal 183 206 106 36 -6 37 -3 15
Pork 0 7 -48 -51 -59 -80 -238 -186
Dairy products 98 135 214 211 142 127 148 82
Source: DerzhStat
Ukraine has emerged as an important supplier for global markets of its leading agricultural export com-modities. Ukraine is the world’s leading sunflower oil exporter with a world market share of about 50 per cent during the last two years. It is also among the top eight suppliers of wheat, barley, and corn. Moreover, Ukraine’s exports of leading agricultural products globally — oilseeds, vegetable oils, and cereals — are cap-turing increasing shares of world trade in growing markets.
13 IER and various policy papers on renewable energy based on Government statistics. These statistics probably underestimate the use of wood for energy in rural areas.

22
3.5 Farm productivity
Crop yields still lag be-hind EU levels, but are slowly increasing (see Figure 3). Average grain yields in Ukraine are about half that of the EU 27. Average yields in Ukraine, however, mask an enormous variation between farms, indicat-ing a significant perfor-mance gap. In the case of winter wheat, for example, average farms produce about 2.2 tons/ha, while “better” farms reach 5-7 tons/ha.
3.6 Agricultural policy and government support
Many independent observers view Ukraine’s agricultural policy framework as unpredictable, inconsistent and opaque. Ad hoc policy changes and the lack of a clear strategy do little to develop the sector and im-prove living conditions for the rural population. Despite formally established government objectives and pub-licized state programmes, actual policy-making continues to appear ad hoc and opportunistic, lacking a cohe-sive and broadly supported long-term strategic perspective based on basic economic principles.14 State support has been unpredictable in terms of both its direction and its volume. Ukraine’s system of State support to agriculture is complex and largely based on product-specific subsidies, causing high transac-tion costs for recipients, especially small- and medium-scale producers, and creating opportunities for cor-ruption. The overall level of support for producers is modest, although the amounts disguise what is generally a taxation of export-oriented sectors and the protection of import-substituting sectors. Ukraine’s WTO commitments locked its State support15 to an upper ceiling of UAH 3.04 billion, equivalent to about USD 613 million. Today’s “market-distorting” part of budgetary support is far below this ceiling. The largest expenditures are incurred in the agricultural education system, the veterinary services (food safety and quality control), the concessional credit programme for producers and direct support (area payments) to horticulture, viticulture and hops. Other payments coupled to production were reduced to insignificant amounts in 2010. Overall government support has increased recently, largely as a consequence of Ukraine’s improved fiscal situation. For 2011 the Government earmarked about UAH 11 billion for its agricultural budget, compared to UAH 7.8 billion in 2010.16 In addition to budget expenditures, the tax benefits provided to farmers through the fixed agricultural tax have been estimated by different sources to be equivalent to UAH 0.7-1.4 billion annually. Even more importantly, the specific value added tax (VAT) regime for agricultural producers gener-ates benefits equivalent to about UAH 10 billion. Agricultural producers are entitled to retain the difference
14 The World Bank, The Battle of the Giants. Serving Vested Interests or Supporting Long-Term and Broad-Based Development? draft report, 2011 (unpublished). 15 The “aggregate measure of support” (AMS). 16 IER calculations based on the Government budget for 2011.
Figure 3
Average yields, tons/ha
Source: DerzhStat, Statistical Yearbook of 2009 “Agriculture of Ukraine”.

23
between VAT paid on inputs purchased and VAT received from the sale of crops if they invest it in produc-tion.
3.7 Investment climate
With an average annual return on capital of over 25 per cent17— the highest of all Ukraine’s key economic sectors between 2002 and 2007 — the agricultural sector offers attractive investment opportunities, but large investments have not materialized. The main reason is that Ukraine’s general investment climate is perceived to be very risky. The World Bank18 demonstrates that the business environment is lagging behind comparable Eastern European and other lower middle-income countries. Political risks, with their implica-tions for the reliability of the policy and regulatory framework, taxation and corruption, were identified in the World Bank’s most recent enterprise survey as the main constraints to business and investment in Ukraine. A recent IFC survey on the investment climate19 confirms this general perception. Access to finance remains a serious concern for the agribusiness sector. According to the forthcoming IFC survey, 75 per cent of firms report poor access to finance as a key barrier to further expansion and invest-ment. Internal self-financing in the form of retained earnings (60 per cent) and personal savings (13 per cent) remain the most prominent sources of funding for agribusiness enterprises. External financing through bank credit (28 per cent) and trade/supplier finance (5 per cent) rarely appears to be a viable option for agribusi-nesses. Lenders in Ukraine tend to focus on larger sized agribusinesses. Since 2007, more than 15 agriculture and food companies have gone public on international stock markets in Warsaw, London, Frankfurt and Paris. This reflects the financial needs of a very capital-intensive sector in an environment that is characterized by high domestic capital costs. Holdings use various methods to attract international capital including initial pub-lic offerings (IPOs), private placements and even the issue of Eurobonds. This financing bias is limiting growth in agriculture and food, especially for small- and medium-sized agri-cultural enterprises and the smallest household producers. It prevents them from making investments that could modernize farm equipment and increase efficiency and profitability. Their weak financial position forc-es them to accept seasonal and working capital finance from any available source and to sell immediately at harvest time when supply is high and prices are usually low. The government’s programme to partially subsidize interest payments for agricultural credits is one of the main pillars of State support to the sector, which began in 2001. Legislation20 specifies that such compensa-tion should be no less than 1.5 times the NBU refinance rate in national currency, and no less than 10 per cent if the loan is in a foreign currency. Agricultural enterprises may receive compensation for short-term loans for covering production costs (e.g., purchases of fuel, feed, spare parts, fertilizers, pests, insurance payments, etc.) as well as for long-term loans, whether obtained in national or in foreign currencies. In 2009, a special law21 also made wholesale markets of agricultural products eligible for interest rate compensation, as well as for other types of support. In a generally corrupt environment, producers benefit only partly from these subsidies, but it is difficult to pin down actual figures.
17 The World Bank, World Development Indicators, 2010. 18 The World Bank, Business Environment Snapshots, 2011. 19 IFC, Investment climate survey (forthcoming). 20 Article 13, law of Ukraine “On State support of agriculture in Ukraine” as of 24 June 2004. 21 The law of Ukraine “On wholesales markets of agricultural products” No.1561-VI as of 25 June 2009.

24
Table 5
Partial interest rate compensation programme, per cent
2002 2003 2004 2005 2007 2008 2009 2010
Interest rates compensated by the Government (percentage points):
Short-term credits*
In UAH 10—7 10—7 8 10 8 11 10.6 Up to
16
In USD 7—5 7—5 6 7 6 6—8 6—8.5 10
Long-term credits**
In UAH 10—7 10—7 14-12 14-12 8 10—15 10—15 Up to
90 per cent
In USD 5—4 7—5 9-8 9-8 5 6—8.5 6—8.5 Up to
90 per cent
Rates eligible for compen-sation
Up to 21—18
Up to 21—18
Up to 19—18
Up to 21—20
N/A N/A N/A Up to
25
NBU refinance rate*** 9.0 7.0 8.7 9.0 8.0 11.0 10.6 8.6
Interest rate of commer-cial banks
25 20.2 17.9 16 13.1 15.5 18.0 12.9
Source: The laws on “State budget of Ukraine” 2002—2005, regulation of MAP and MF #212/427 as of 2 July 2003, regulation of CMU #34 as of 15 January 2005, regulation of CMU #259 as of 21 February 2007, etc., Bulletin of NBU.;
Notes: * From 2007 the rate of compensation is deducted as a fraction of the NBU discount rate: 1.0 times NBU-discount rate for 2007-2009, 2.0 times NBU-discount rate in 2010.
** From 2007 long-term credits also encompass medium-term credits in this table. According to the regulation of CMU #153 as of 26 February 2009, the following classification has been applied: short-term loans — up to 1 year, medium term loans — up to 3 years, long-term loans — up to 5 years. From 2010 long-term loans cover loans granted for more than 3 years (See regulation of CMU #794 as of 11 August 2010).
*** Simple average over the corresponding years if changed during the year.
Table 6 Budget outlays on the partial interest rate compensation programme, UAH million
2000 2001 2002 2003 2004 2005 2006 2007 2008 2009 2010 2011
49.9 127.6 119.6 74.8 141.5 415.1 319.5 551.3 1021.3 373.8 621.6 531.4
Source: Law of Ukraine on “State budget of Ukraine for 2011”; reports of the State Treasury of Ukraine

25
3.8 Land market
Agriculture in Ukraine has been developed on leased land because of a ban on selling agricultural land plots.22 Land is now typically leased for 4—10 years, with a maximum period of 49 years. The average land rent is UAH 278 per ha, but a large share of rent payments is made in kind. In April 2010, there were about 7 million landowners and a total area of about 17.2 million ha was leased out through 4.6 million contracts. The new Government has repeatedly declared its commitment to lifting the moratorium on farmland trade by 2012. This moratorium has been extended several times and effectively prohibits actual sales agreements in the farmland market. The transition provisions of the Land Code set out preconditions for lifting the mora-torium on agricultural land sales — the adoption of the law on land markets and the law on land cadastre. After long and tedious discussions in the Parliament and strong lobbying by agricultural producers for the status quo, the moratorium was again extended at the end of 2011 until January 1, 2013. The law on land markets currently under consideration will most likely include several restrictions on land sales and is ex-pected to be adopted in February 2012.23 The impact on rural financial markets of permitting farmland sales may prove to be limited. The market still faces severe information asymmetry and actors with hidden interests. According to the terms of Ukraine’s accession to WTO, foreign subjects will not be permitted to own farmland. Only individuals and the Govern-ment will be eligible to buy land. This means that the demand side of the land market will be limited to a rel-atively small number of wealthy Ukrainians. On the supply side, most land owners in Ukraine are poorly in-formed about their rights and responsibilities.24 See also the end of section 4.5.1 below. Farmland in Ukraine is expected to be relatively cheap after the moratorium is lifted. Domestic analysts25 and international experience (e.g. in Russia) suggest that the value will average less than USD 1,000 per ha, not least because of the relatively low efficiency of farming and marketing in Ukraine. At the same time, the Government apparently intends to establish normative prices for farmland that lie above its market value, thereby establishing inflated minimum prices for land transactions. This will probably limit the number of land transactions.
22 Article 17 of the Land Code No.2196-XII as of March 13, 1992 prohibited any kind of alienation of land plots obtained from Radas apart from bequest for six years, that is, until 1998. Land owners were formally allowed to sell their plots from 1998 until the new Land Code reintroduced the moratorium on agricultural land sales in 2001. 23 The draft law on land market a.o. includes upper ceilings for the purchase of agricultural land, foresees restrictions on land leasing and is limiting eligible groups for farm land purchases. 24 O. Nivievskyi and S. Kandul, “The value of farmland — expected farmland prices in Ukraine after lifting the moratorium, IER policy paper, 2011. 25 Ibid.
26
4 Supply of agricultural finance
4.1 Banking sector
4.1.1. Overview and recent sector developments
The financial sector in Ukraine was affected by the global economic crisis and faced serious difficulties in 2008 and 2009. During the last quarter of 2008, the national currency depreciated considerably, leading to severe cash flow problems for investors who had a high proportion of loans in foreign currencies. Currency depreciation and the difficult economic conditions for borrowers meant that the average quality of loans de-teriorated dramatically. At the same time, massive runs on deposits led to major liquidity problems. At the peak of the outflows, in early 2009, the banks lost nearly 25 per cent of their household deposit base. In 2009, the banking sector suffered substantial losses. 2010 marked a period of stabilization. Continued economic recovery, returning confidence in the banking system and limited investment options attracted depositors back to banks. The deposits in UAH grew at a much faster pace than FX deposits (41.6 per cent and 17.4 per cent for household deposits, and 34.1 per cent and 1.9 per cent for corporate deposits, respectively) given stable exchange rate expectations and a wide interest rate differential. Overall, bank deposits grew by 26.4 per cent in 2010. Consequently, the banking system achieved and then surpassed its pre-crisis deposit base level. At the same time, the total loan portfo-lio remained almost flat (a mere 1 per cent increase in 2010).26 Banks found it difficult to expand their loan portfolios owing to reduced demand for loans, especially from the retail sector, and more conservative credit policies. Ukrainian banks currently have high liquidity levels. With high deposit inflows and little demand for credit from the private sector, Ukrainian banks followed the global tendency of buying heavily into government se-curities, assets that were perceived to be less risky than loans but at the same time were more lucrative than money market operations. As a result, the proportion of securities in total assets of the banking system dou-bled from 4 per cent to 8 per cent in 2010, while the proportion of loans reduced from 67 per cent to 59 per cent. The strong build-up in the deposit base coupled with almost no growth in the loan portfolio caused a substantial fall in the loan-to-deposit ratio (from 219 per cent at the end of 2009 to 175 per cent one year later). In spite of excessive liquidity, the banking system is experiencing a shortfall of middle-term and long-term resources. Interest rates are highly volatile. Following the vast improvement in liquidity conditions, banks started to cut deposit interest rates with a particular focus on FX deposits (as FX lending was largely frozen).27 The sharp reduction in deposit interest rates, coupled with rising competitive pressures and diminished credit risks, led to a substantial fall in loan interest rates as well. For example, the interest rates on new loans in the corpo-rate segment decreased from 25-28 per cent at the beginning of 2010 to 15-18 per cent by the middle of 2011. In the second half of 2011, interest rates sharply increased again due to restrictive NBU policies con-cerning FX operations and reduced capital inflows caused by the Eurozone crisis. Arrears management remains a top priority for Ukrainian banks. A high level of non-performing loans (NPLs) has been the major drag on the profitability of the Ukrainian banking sector and its ability to extend credit. According to NBU data, the NPL ratio reached 11.2 per cent at the end of 2010 (as compared to 9.4 per cent at the end of 2009), growing by 21 per cent to UAH 85 billion over the year. However, according to other calculations (e.g. by Fitch, Moody’s and the IMF), the ‘true’ NPL levels are much higher. Companies in almost all sectors had significant problems in paying back loans, but with large variations between sectors. The share of overdue loans ranged from 5-7 per cent in professional services and the extractive industry to over 12-15 per cent in transport, manufacturing and trade and to 19 per cent in construction and real estate operations. The financial institutions interviewed almost unanimously reported that the agriculture and food sectors were performing above average.
26 The slight increase in 2010 was mainly due to loans disbursed by Ukraine’s biggest banks to industrial corporations. 27 The high degree of dollarization of the market in previous years had negatively impacted asset quality and led NBU to implement measures aimed at restricting foreign currency lending.

27
The financial position of the banking system has been strengthened, but remains weak. Despite the mod-erate economic recovery, continued deterioration of the loan quality and increased loan impairment charges caused the banking sector to post losses for the second year in a row. However, the total loss was nearly two thirds lower than in the previous year (from UAH 38.4 billion in 2009 down to UAH 13.0 billion in 2010). Ac-cording to NBU, the number of loss-making banks fell from 64 in 2009 to 35 in 2010. Nevertheless, it is prem-ature to conclude that Ukrainian banks have successfully exited the crisis phase and are embarked on a sus-tainable growth path. The general climate of uncertainty caused by changing political and economic condi-tions has resulted in a reduced demand for loans and has thus greatly impacted medium and small-sized banks. In accordance with IMF terms, NBU mandated additional capitalization requirements for banks. Many banks thus received capital injections in 2010 and total paid-in equity grew by 22.7 per cent, reaching USD 18.3 billion. The share of foreign capital in the total capital of the banking system rose from 35.8 per cent at the end of 2009 to 40.6 per cent at the end of 2010. Additional NBU measures aimed at strengthening the banking system and continued support from shareholders occurred throughout 2011. At the end of 2010, the Ukrainian banking sector consisted of 175 operating banks and 18 banks in the pro-cess of liquidation. The banks which were recapitalized by the State nevertheless remain under substantial stress.28 NBU has been reducing the number of problem banks, leaving only four banks under temporary ad-ministration as compared to 12 at the beginning of the year. Seven small banks and UkrPromBank were liqui-dated in 2010, while several resumed normal operations. More banks were turned into public joint stock companies, increasing the transparency of their operations.29 There are currently 55 banks with foreign capi-tal operating in Ukraine (up from 51 in 2009). The banks are divided into four groups, depending on their size. The largest 17 banks (Group 1) ac-counted for 66.7 per cent of total assets, 69.9 per cent of total loans, and 66.4 per cent of total equity as of the end of 2010. Corporate loans continue to repre-sent the largest proportion of bank loan portfolios. Due to decreased lending to households and growth in corporate lending, the share of corporate loans increased from 62.4 per cent at the end of 2009 to 67.0 per cent at the end of 2010 and to 70.4 per cent at the end of September 2011 (see Table above and Figure 4 below). Loans to indi-viduals have seen a dramatic con-traction since 2008. In figure 4 “other residents” include general Government, non-profit organizations and other financial institutions (such as insurance companies, non-State pension funds, etc.). The share of loans to other residents, as well as to non-residents, represents only a small proportion of the total loan portfolio.
28 The Government estimated that 3 banks (UkrGazBank, Rodovid Bank and Kyiv Bank) needed more capital injections, while Ukrainian billion-aire Dmytro Firtash acquired a controlling 89 per cent stake in Nadra Bank in spring 2011. In early August, NBU removed the bank from receiv-ership, allowing Firtash to install a team of managers. 29 See Economic Summary 2010, IER.
Table 7 Composition of the loan portfolio of the Ukrainian banking system, UAH billion Dec-08 Dec-09 Dec-10 Sep-11
Corporate loans 443.66 462.21 500.96 570.11
Agriculture 28.81 26.03 26.55 34.56
Food industry 27.38 27.54 29.69 34.12
Other manufacturing 78.64 77.41 91.84 88.38
Trade 155.82 165.68 174.45 205.58
Other sectors 153.01 165.56 178.44 207.48
Households 280.49 241.25 209.54 207.40
Other residents 9.87 19.83 22.32 24.12
Total residents 734.02 723.30 732.82 801.63
Non-residents 13.08 16.97 14.94 8.23
Total 747.11 740.27 747.77 809.86
USD/UAH rate 7.7000 7.9850 7.9617 7.9727 Source: NBU

28
Within corporate lending, banks lend mostly to companies working in trade and manufacturing. At the end of 2010, trade and manufacturing accounted for 34.8 per cent and 24.2 per cent, respectively, which is simi-lar to the situation in 2008 (35.1 per cent and 23.9 per cent, respectively). Loans to extractive and transport industries have increased in importance in recent years.
4.1.2. Agricultural loans
According to NBU requirements, banks classify their loans by type of industry based on the National Classifier of Ukraine.30 The agri-culture category en-compasses crop pro-duction, animal hus-bandry, forestry, har-vesting of forest products, and hunting or trapping of animals in their natural habi-tat. Food processing is part of the manufac-turing industry and is usually reported as such in aggregated form, without its spe-cific share being visi-ble. However, even the classifier admits that the boundaries between the pro-cessing industry and other economic activi-ties may be ambigu-
30 DK 009:2005 Classification of Economic Activities, approved on 26 December 2005.
Figure 4
Composition of the total loan portfolio of the Ukrainian banks as of 2010
Figure 5
Composition of the corporate loan portfolio of the Ukrainian banks as of 2010
Source: NBU, based on volume Source: NBU, based on volume
Table 8 Top 10 banks serving the agricultural sector (as of the end of 2010), UAH billion
Bank Total loan
portfolio
Loans to agri-
culture
Loans to food
industry
Total agri-
loans
% share of agri-loans in
banking sector
PrivatBank 101.9 3.0 7.0 10.0 17.8
UkrExImBank 52.1 4.6 5.2 9.8 17.4
Raiffeisen Bank Aval 43.9 1.9 2.2 4.1 7.3
Alfa Bank 22.9 0.2 3.7 3.9 6.9
PromInvest Bank 25.7 0.8 2.4 3.2 5.7
Financial Initiative 6.4 2.8 0.0† 2.8 5.0
FUIB 13.6 1.8 0.0‡ 1.8 3.2
Oschadbank 44.8 0.7 1.0 1.7 3.0
Bank Forum 14.1 0.7 0.9 1.6 2.9
Sberbank of Russia 9.0 0.5 0.6 1.1 2.0
Total 10 banks 334.2 17.0 23.1 40.1 71.3
Other banks 413.6 9.6 6.6 16.1 28.7
Total banks 747.8 26.6 29.7 56.2 100.0
Source: Loans to agriculture were taken from the 2010 annual reports of the commercial banks prepared in accordance with the national standards for NBU. Loans to agriculture and the food industry were taken from the 2010 annual reports prepared in accordance with the IFRS (or national standards when the food industry was explicitly reported). † No data could be found. ‡ First Ukrainian International Bank loans to the food industry are included in and reported together with loans to agriculture.
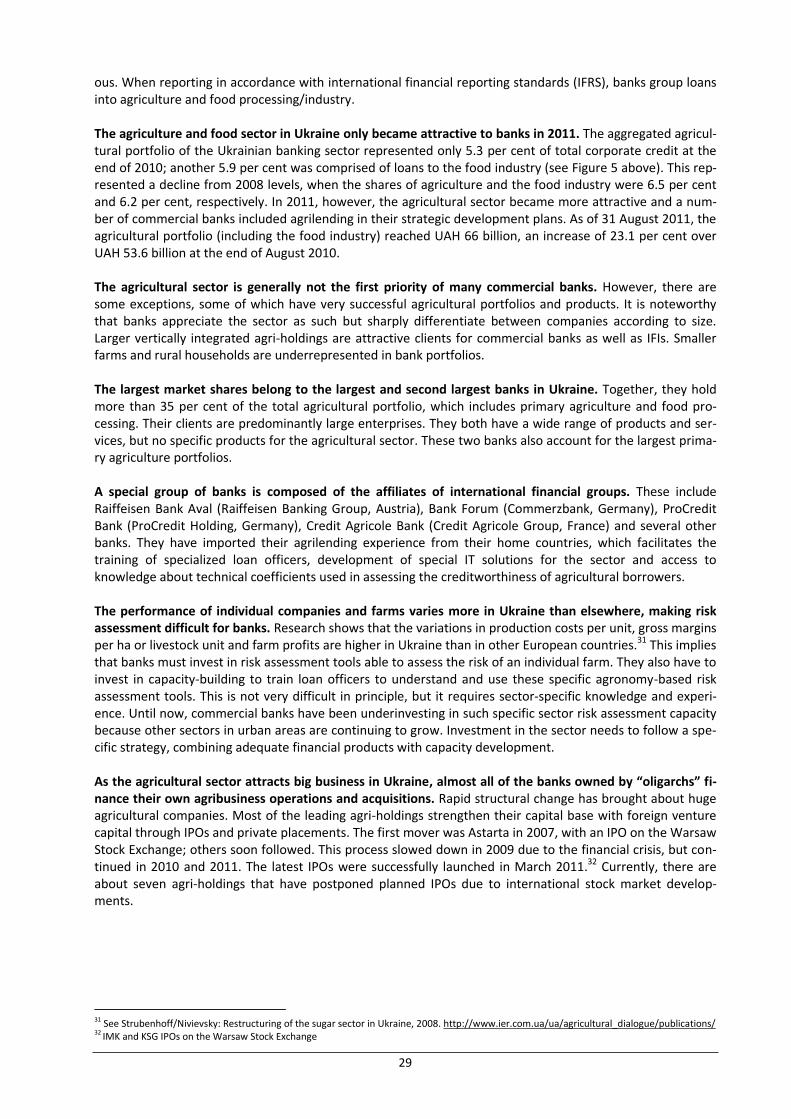
29
ous. When reporting in accordance with international financial reporting standards (IFRS), banks group loans into agriculture and food processing/industry. The agriculture and food sector in Ukraine only became attractive to banks in 2011. The aggregated agricul-tural portfolio of the Ukrainian banking sector represented only 5.3 per cent of total corporate credit at the end of 2010; another 5.9 per cent was comprised of loans to the food industry (see Figure 5 above). This rep-resented a decline from 2008 levels, when the shares of agriculture and the food industry were 6.5 per cent and 6.2 per cent, respectively. In 2011, however, the agricultural sector became more attractive and a num-ber of commercial banks included agrilending in their strategic development plans. As of 31 August 2011, the agricultural portfolio (including the food industry) reached UAH 66 billion, an increase of 23.1 per cent over UAH 53.6 billion at the end of August 2010. The agricultural sector is generally not the first priority of many commercial banks. However, there are some exceptions, some of which have very successful agricultural portfolios and products. It is noteworthy that banks appreciate the sector as such but sharply differentiate between companies according to size. Larger vertically integrated agri-holdings are attractive clients for commercial banks as well as IFIs. Smaller farms and rural households are underrepresented in bank portfolios. The largest market shares belong to the largest and second largest banks in Ukraine. Together, they hold more than 35 per cent of the total agricultural portfolio, which includes primary agriculture and food pro-cessing. Their clients are predominantly large enterprises. They both have a wide range of products and ser-vices, but no specific products for the agricultural sector. These two banks also account for the largest prima-ry agriculture portfolios. A special group of banks is composed of the affiliates of international financial groups. These include Raiffeisen Bank Aval (Raiffeisen Banking Group, Austria), Bank Forum (Commerzbank, Germany), ProCredit Bank (ProCredit Holding, Germany), Credit Agricole Bank (Credit Agricole Group, France) and several other banks. They have imported their agrilending experience from their home countries, which facilitates the training of specialized loan officers, development of special IT solutions for the sector and access to knowledge about technical coefficients used in assessing the creditworthiness of agricultural borrowers. The performance of individual companies and farms varies more in Ukraine than elsewhere, making risk assessment difficult for banks. Research shows that the variations in production costs per unit, gross margins per ha or livestock unit and farm profits are higher in Ukraine than in other European countries.31 This implies that banks must invest in risk assessment tools able to assess the risk of an individual farm. They also have to invest in capacity-building to train loan officers to understand and use these specific agronomy-based risk assessment tools. This is not very difficult in principle, but it requires sector-specific knowledge and experi-ence. Until now, commercial banks have been underinvesting in such specific sector risk assessment capacity because other sectors in urban areas are continuing to grow. Investment in the sector needs to follow a spe-cific strategy, combining adequate financial products with capacity development. As the agricultural sector attracts big business in Ukraine, almost all of the banks owned by “oligarchs” fi-nance their own agribusiness operations and acquisitions. Rapid structural change has brought about huge agricultural companies. Most of the leading agri-holdings strengthen their capital base with foreign venture capital through IPOs and private placements. The first mover was Astarta in 2007, with an IPO on the Warsaw Stock Exchange; others soon followed. This process slowed down in 2009 due to the financial crisis, but con-tinued in 2010 and 2011. The latest IPOs were successfully launched in March 2011.32 Currently, there are about seven agri-holdings that have postponed planned IPOs due to international stock market develop-ments.
31 See Strubenhoff/Nivievsky: Restructuring of the sugar sector in Ukraine, 2008. http://www.ier.com.ua/ua/agricultural_dialogue/publications/ 32 IMK and KSG IPOs on the Warsaw Stock Exchange
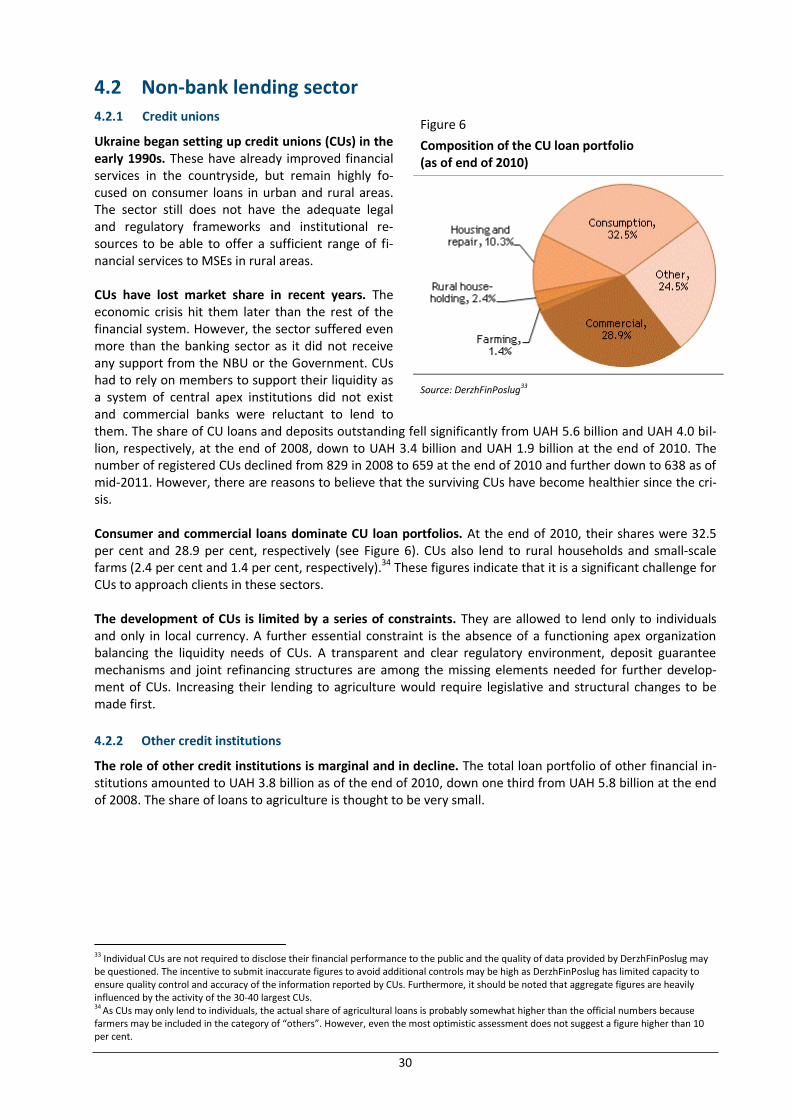
30
4.2 Non-bank lending sector
4.2.1 Credit unions
Ukraine began setting up credit unions (CUs) in the early 1990s. These have already improved financial services in the countryside, but remain highly fo-cused on consumer loans in urban and rural areas. The sector still does not have the adequate legal and regulatory frameworks and institutional re-sources to be able to offer a sufficient range of fi-nancial services to MSEs in rural areas. CUs have lost market share in recent years. The economic crisis hit them later than the rest of the financial system. However, the sector suffered even more than the banking sector as it did not receive any support from the NBU or the Government. CUs had to rely on members to support their liquidity as a system of central apex institutions did not exist and commercial banks were reluctant to lend to them. The share of CU loans and deposits outstanding fell significantly from UAH 5.6 billion and UAH 4.0 bil-lion, respectively, at the end of 2008, down to UAH 3.4 billion and UAH 1.9 billion at the end of 2010. The number of registered CUs declined from 829 in 2008 to 659 at the end of 2010 and further down to 638 as of mid-2011. However, there are reasons to believe that the surviving CUs have become healthier since the cri-sis. Consumer and commercial loans dominate CU loan portfolios. At the end of 2010, their shares were 32.5 per cent and 28.9 per cent, respectively (see Figure 6). CUs also lend to rural households and small-scale farms (2.4 per cent and 1.4 per cent, respectively).34 These figures indicate that it is a significant challenge for CUs to approach clients in these sectors. The development of CUs is limited by a series of constraints. They are allowed to lend only to individuals and only in local currency. A further essential constraint is the absence of a functioning apex organization balancing the liquidity needs of CUs. A transparent and clear regulatory environment, deposit guarantee mechanisms and joint refinancing structures are among the missing elements needed for further develop-ment of CUs. Increasing their lending to agriculture would require legislative and structural changes to be made first.
4.2.2 Other credit institutions
The role of other credit institutions is marginal and in decline. The total loan portfolio of other financial in-stitutions amounted to UAH 3.8 billion as of the end of 2010, down one third from UAH 5.8 billion at the end of 2008. The share of loans to agriculture is thought to be very small.
33 Individual CUs are not required to disclose their financial performance to the public and the quality of data provided by DerzhFinPoslug may be questioned. The incentive to submit inaccurate figures to avoid additional controls may be high as DerzhFinPoslug has limited capacity to ensure quality control and accuracy of the information reported by CUs. Furthermore, it should be noted that aggregate figures are heavily influenced by the activity of the 30-40 largest CUs. 34 As CUs may only lend to individuals, the actual share of agricultural loans is probably somewhat higher than the official numbers because farmers may be included in the category of “others”. However, even the most optimistic assessment does not suggest a figure higher than 10 per cent.
Figure 6
Composition of the CU loan portfolio (as of end of 2010)
Source: DerzhFinPoslug33

31
4.3 Insurance companies
4.3.1 Overview and sector developments
The insurance sector in Ukraine shows signs of re-covery but is still performing below pre-crisis lev-els. In 2010, gross insurance premiums increased by 12.9 per cent compared to 2009, but remained be-low the level of 2008 (see table 9). In 2010, net in-surance premiums amounted to only 83.4 per cent of those in 2008; 2011 promises to be a bit better. Major reforms are needed to stimulate future de-velopment. Of 446 registered insurance companies (as of the end of June 2011), about 300 are believed by market experts to exist only on paper. Weak reg-ulation of the sector, lack of transparency, use of various accounting and reporting standards and lack of minimum capital requirements are among the many problems identified by market players. Auto insurance dominates the portfolio. The share of different auto insurance products (CASCO, civil liabil-ity, green cards) amounted to 38.0 per cent of net insurance premiums in 2010 (see Figure 7). Agricultural insurance represents only a very modest segment of the general insurance system in the country.
4.3.2 Agricultural insurance
Until 2000, most agricultural insurance services were delivered by Oranta, the successor of the Soviet-era state insurer GosStrakh. Oranta inherited the regional network, methodology and strategy of the consolidat-ed insurance system.35 However, economic transformation and the crisis in Ukrainian agriculture immediate-ly after independence in 1991 meant that the financial resources of farms deteriorated and agricultural sec-tor demand for insurance services declined over the 1990s. After 2000, Ukrainian private insurance compa-nies tried to replicate Oranta’s agricultural insurance products, but these products were no longer perform-ing and all market players, including Oranta, had to look for new solutions. In 2002, the Government unsuccessfully tried to introduce a national agricultural risk mitigation system. For this purpose, mandatory agricultural insurance was imposed.36 It obliged all farms to insure their crops under a multi-peril crop insurance programme. The programme resulted in no tangible achievements due to the poor legislative and implementation framework. The Government introduced an agricul-tural insurance subsidy programme in 2005.37 This made a special State entity responsible for compensating producers for 50 per cent of all the premiums paid. Furthermore, participation in other State
35 GosStrakh was the only provider of insurance services in the country. Under this system, insurance was mandatory for all producers of agri-cultural commodities. GosStrakh made payouts to farms which suffered from risk events out of the overall pool of collected premiums. Wide geographical diversification of the insurance portfolio helped to leverage losses. In cases of catastrophic losses the company could ask for gov-ernment assistance. 36 Regulation #1000 from 11 July 2002. 37 Law #1877-VI on State support to agriculture, from 24 June 2004.
Table 9 Key indicators of the insurance sector, UAH billion Dec-08 Dec-09 Dec-10 Jun-11
Gross premiums 24.0 20.4 23.1 11.0
Gross payments 7.1 6.7 6.1 2.5
Net premiums 16.0 12.7 13.3 7.6
Net payments 6.5 6.1 5.9 2.4
Reserves 10.9 10.1 11.4 11.1
Assets 41.9 42.0 45.2 42.8
Statutory capital 13.2 14.9 14.4 13.5
Source: DerzhFinPoslug
Figure 7
Composition of net premiums (2010)
Source: DerzhFinPoslug

32
support programmes38 was made conditional on having crops (ani-mals, assets) insured. The sums earmarked for this programme were limited, however. In 2009-2011, there was no money set aside in the State budget for subsidizing insurance premiums, as a result of which insurance premi-ums plunged.
Farmers do not trust the insurance sector. Insurance companies publicize their payouts but this information usually does not reach farmers. Agricultural producers suffered big crop losses due to winterkill in 2003, and due to severe drought in 2006 and 2010, but tricky contract wording and unclear definitions of terms made it difficult for the insured farms to get payouts. Insurance companies deferred payouts for as long as six months or refused to compensate farmers’ losses even when threatened with court action.
Neither agricultural producers nor lending institutions consider insurance to be a reliable risk mitigation instrument. Farmers purchase the cheapest coverage, choosing high levels of deductible and insuring crops against less important risks. The banks use standing crops as collateral, but mostly only as a supplementary provision. Some banks have their own captive insurance companies and insurance contracts are signed au-tomatically when a credit application is approved. Credit unions and other seasonal finance providers (input suppliers, processors and traders) do not use insurance at all. They usually rely on client monitoring, contract harvesting and pricing strategies to hedge against possible losses. Over the past years, agricultural insurance in Ukraine has covered only a small fraction of agricultural pro-duction. According to IFC,39 the crop area insured between 2005 and 2009 constituted less than 3 per cent of total seeding area (see also Figure 8 above). Estimates for the levels of insurance in livestock production are even lower. The agro-insurance sector is characterized by specialization and rapid structural change. If insurance pack-ages lack the specific features that farmers appreciate and will pay for, many insurance companies will inter-pret the failure of these packages as a sign that the sector itself is too risky and drop out of the market. This leads to a high concentration in the industry, with a large market share concentrated in the hands of a few specialized companies.
38 Forward purchases of grains, State support per hectare of sugar beet, etc. 39 Reference to IFC includes analytical and grey papers of the IFC office in Kyiv.
Figure 8
Selected indicators of agricultural insurance in Ukraine
Source: IFC
13
29
117
155
42
613
48
0
67
236
117
51
73
39
1330
4397
19801637
910
0
50
100
150
200
250
2005 2006 2007 2008 2009
0
500
1000
1500
2000
2500
3000
3500
4000
4500
5000
Premiums, mln UAH State subsidies, mln UAH
Crop area insured, 10 thd ha Number of agreements
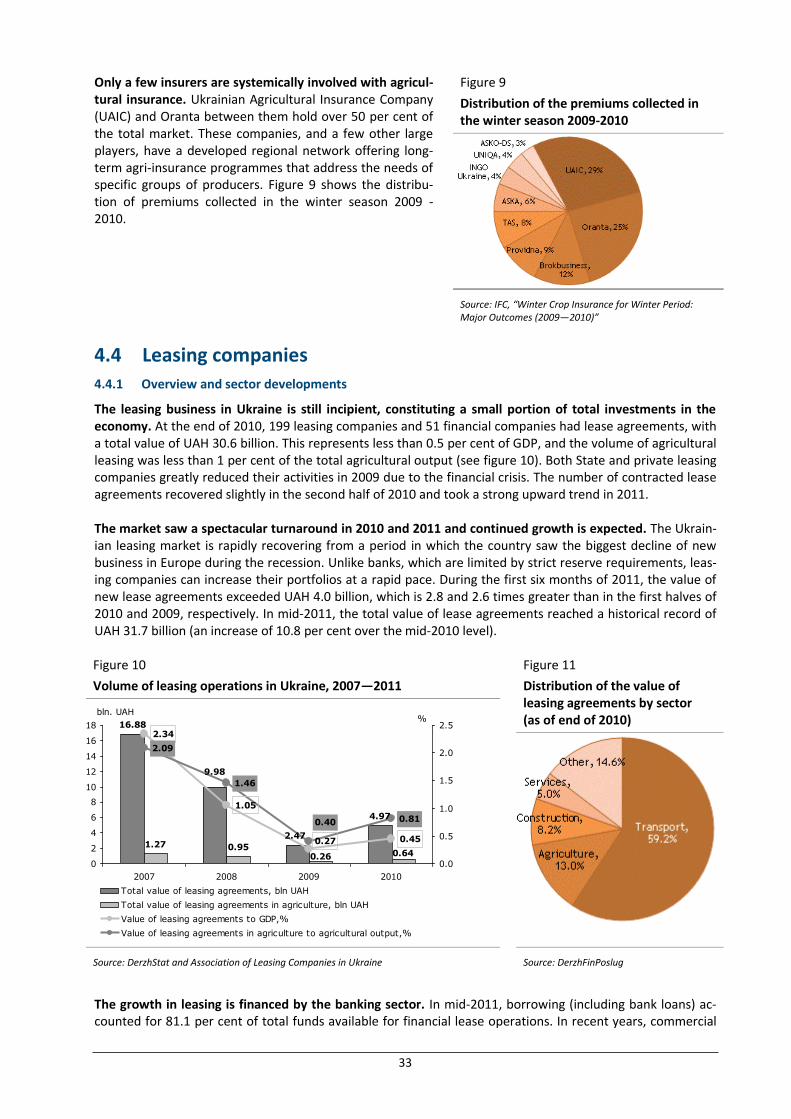
33
Only a few insurers are systemically involved with agricul-tural insurance. Ukrainian Agricultural Insurance Company (UAIC) and Oranta between them hold over 50 per cent of the total market. These companies, and a few other large players, have a developed regional network offering long-term agri-insurance programmes that address the needs of specific groups of producers. Figure 9 shows the distribu-tion of premiums collected in the winter season 2009 -2010.
4.4 Leasing companies
4.4.1 Overview and sector developments
The leasing business in Ukraine is still incipient, constituting a small portion of total investments in the economy. At the end of 2010, 199 leasing companies and 51 financial companies had lease agreements, with a total value of UAH 30.6 billion. This represents less than 0.5 per cent of GDP, and the volume of agricultural leasing was less than 1 per cent of the total agricultural output (see figure 10). Both State and private leasing companies greatly reduced their activities in 2009 due to the financial crisis. The number of contracted lease agreements recovered slightly in the second half of 2010 and took a strong upward trend in 2011. The market saw a spectacular turnaround in 2010 and 2011 and continued growth is expected. The Ukrain-ian leasing market is rapidly recovering from a period in which the country saw the biggest decline of new business in Europe during the recession. Unlike banks, which are limited by strict reserve requirements, leas-ing companies can increase their portfolios at a rapid pace. During the first six months of 2011, the value of new lease agreements exceeded UAH 4.0 billion, which is 2.8 and 2.6 times greater than in the first halves of 2010 and 2009, respectively. In mid-2011, the total value of lease agreements reached a historical record of UAH 31.7 billion (an increase of 10.8 per cent over the mid-2010 level).
The growth in leasing is financed by the banking sector. In mid-2011, borrowing (including bank loans) ac-counted for 81.1 per cent of total funds available for financial lease operations. In recent years, commercial
Figure 9
Distribution of the premiums collected in the winter season 2009-2010
Source: IFC, “Winter Crop Insurance for Winter Period: Major Outcomes (2009—2010)”
Figure 10
Volume of leasing operations in Ukraine, 2007—2011
Figure 11
Distribution of the value of leasing agreements by sector (as of end of 2010)
Source: DerzhStat and Association of Leasing Companies in Ukraine Source: DerzhFinPoslug
16.88
4.97
1.27 0.95
2.47
9.98
0.640.26
2.34
1.05
0.45
2.09
1.46
0.81
0.27
0.40
0
2
4
6
8
10
12
14
16
18
2007 2008 2009 2010
bln. UAH
0.0
0.5
1.0
1.5
2.0
2.5%
Total value of leasing agreements, bln UAH
Total value of leasing agreements in agriculture, bln UAH
Value of leasing agreements to GDP,%
Value of leasing agreements in agriculture to agricultural output,%

34
banks have realized the advantages of leasing over conventional lending, and have begun to actively engage in such activities, typically through daughter companies. The major reasons for the growth in leasing are the improved tax environment and the overall economic recovery. (Some leasing market players claim that the increased involvement of the banks was at least partly driven by their large amounts of repossessed property, including vehicles and equipment that could not be sold in the short term.) Important modifications to the Tax Code, which entered into force at the beginning of January 2011, ended a number of discriminatory practices against leasing companies which had been a major bottleneck for many years. In particular:
The new Tax Code effectively eliminates a rule that required accruing VAT on commission (interest) fees as a part of lease payments under financial lease agreements that exceed the double discount rate set by NBU;
If an asset is leased out under a financial lease agreement upon being returned by the lessee, the leasing company will not incur additional VAT costs, as was the case before the Tax Code came into force; accordingly, such VAT costs do not have to be charged to the client;
As of 1 April 2011, the insurance of leased assets under operating and financial lease agreements is eligible for tax deduction without limitation, whereas according to the previous legislation, such costs could not exceed 5 per cent of companies’ deductible expenses for a reporting period.40
Transport is the dominant sector in leasing, followed by agriculture. At the end of 2010, the value of leasing agreements related to all kinds of transport represented 59 per cent of the total leasing portfolio. Agriculture was the second most important sector for lease transactions with 13 per cent of the total (see Figure below). The share of agriculture has been growing strongly over the last three years, from 7.5 per cent at the end of 2008. There is a high level of specialization among leasing companies. ALD Automotive/First Leasing Company, Avis Ukraine, and Optima Leasing are the most active car leasing companies. Ukrainian Leasing Company, a daughter company of UkrSibBank (BNP Paribas Group) is the leader in equipment leasing. UkrAgroLeasing is a State-owned company specialized in the agricultural sector. The largest universal companies include VTB Leasing, UniCredit Leasing, ING Lease Ukraine, and Raiffeisen Leasing Aval, daughter companies of major in-ternational financial groups. These companies have leasing agreements with the biggest agricultural enter-prises of Ukraine as well as with State monopolies.
4.4.2 Agricultural leasing
UkrAgroLeasing is the leader on the lease market for domestically produced agricultural machinery. From its inception in 1998 until 1 December 2010, the company purchased and leased agricultural machinery and equipment worth UAH 2.8 billion. The agricultural sector received 21,043 units of agricultural machinery, in-cluding 6,780 tractors, 867 grain harvesters, and 10,343 units of tillage and sowing equipment. UkrAgroLeasing leases domestically produced machinery,41 as well as machinery made in Russia and Belarus. In September 2009, State-owned UkrAgroLeasing signed an agreement with the Canadian company SNC-Lavalin Inc. on a loan of USD 600 million for investment projects in the agro-industrial sector. Ukrainian farm-ers get modern grain elevators, milk tanks and equipment for milk collecting stations on financial leasing terms and the equipment is predominantly provided to agriculture service cooperatives. In late September 2011, the Cabinet of Ministers decided to increase the authorized capital of UkrAgroLeasing by UAH 388.8 million. The funds will be used to purchase technical equipment for agriculture and then grant it on financial leasing terms.
40 Since insurance is something that leasing companies are concerned with, this innovation enables them to reduce their direct costs and thus lease conditions are becoming more attractive for their clients. 41 According to Cabinet of Ministers decree #1904 from December 10, 2003 the list of available machinery should be approved by tender com-mittee in the Ministry for Agricultural Policy and Food and notified by a special committee responsible for setting priorities in agricultural ma-chinery production.

35
State support for the leasing of agricultural machinery is channeled through UkrAgroLeasing and SpetsAgroLeasing.42 This support means lower payments for lessees and lower initial coverage require-ments.43 However, during interviews in Ukraine, industry insiders noted that special relationships with deci-sion makers are needed in order to benefit from more advantageous lease terms. Private leasing companies offer agricultural machinery produced in the West. The market leaders are Raiffeisen Leasing Aval, ING Lease, UniCredit Leasing, SG Equipment Leasing and Alef. These companies lease machinery made by Western companies such as Claas, John Deere, AGCO and CNH.
4.5 Assessment of agricultural financial products 4.5.1 Loans
Seasonal loans are the most common financial product offered to agriculture by commercial banks. How-ever, even simple products like these need business-specific risk assessments. It is clear that by investing in a store of knowledge of crop practices, e.g. simple standardized crop budgets with standard input costs and standard yields, banks can lower their lending risks. IFIs may support commercial banks by providing bench-marks and training. Long-term loans need more specific knowledge and risk assessment tools, with advantages accruing to spe-cialized banks with extensive experience in agricultural lending. Best practices may be expected with interna-tional banks with a high agrifinance share in their loan portfolio, using adequate IT tools and employing a deep understanding of the sector. Sector knowledge is very important because even a simple investment in a tractor or combine harvester may have multiple implications for overall farm performance. Without knowing the technical coefficients for tractor use, labour costs, efficiency and expected yield increases and profits, the assessment of a business plan to "purchase a new tractor and combine” becomes quite difficult. Investment in livestock is even more difficult to analyse when the farm is producing feed for animals. Feed crop budgets have to be combined with animal husbandry technical and financial coefficients, making business planning a specialized exercise. IT tools assessing operations across the whole farm, including variable and fixed costs as well as farm profits with and without investment, are necessary. Currently, most Ukrainian banks use rough assessment tools and rules of thumb.44 With a few exceptions, banks do not offer products specifically designed for agriculture. Most of the banks do not have specially-developed agricultural products. They normally serve the sector with generic products in the case of SMEs, or with products tailored for a specific client in case of a large agricultural enterprise. A few banks have products specifically designed for agricultural producers (see Table 10 for an overview). Table 10
Credit products offered specifically to agricultural producers by selected banks
Product description Collateral required Repayment
Bank 1
Agrobusiness credit Currency: UAH, USD, EUR Loan amount: up to USD 1 million Loan term: up to 60 months
Vehicles, equipment, working capital or products, immoveable property, farm machinery, livestock guarantee
Flexible; grace period of 8 months
42 SpetsAgroLeasing was created on September 7, 2010, by the Ministry of Agrarian Policy in order to implement the decree of the Cabinet of Ministers, which approved an allocation from the Stabilization Fund for the purchase of pedigree heifers and cows and domestic agricultural machinery to be leased to farmers. For 2011, SpetsAgroLeasing and UkrAgroLeasing received UAH 25 million and UAH 200 million, respectively. 43 UkrAgroLeasing received both irrevocable transfers from the State budget and the funds that were supposed to be recovered from lessees. The total amount of support for agricultural producers should thus be assessed by comparing the contract features of UkrAgroLeasing and the typical conditions of leasing agreements in the market. 44 Banks currently finance 50 per cent of the asset value of agricultural machinery at farms of at least 2,000 ha.

36
Product description Collateral required Repayment
Agromachinery loan Currency: UAH, USD, EUR Loan amount: up to USD 1 million Loan term: up to 60 months
Farm machinery to be purchased, guarantee, vehicles, immoveable property, agricultural machinery, live-stock
Flexible; grace period of 8 months
Seasonal loan Currency: UAH, USD, EUR Loan amount: up to USD 1 million Loan term: up to 12 months
Immoveable property, vehicles, equipment, guarantee, deposits in the bank
One balloon pay-ment or 2-3 equal installments at the end; grace period of 8 months
Credit line Currency: UAH, USD, EUR Loan amount: up to USD 1 million Loan term: up to 12 months
Vehicles, equipment, working capital or products, immoveable property, farm machinery, livestock guarantee
Interest paid monthly; loan re-payment in equal installments not later than the last 3 months
Overdraft Currency: UAH Loan amount: up to 30% of the avg. month-ly current account turnover in the bank over the last 3 months45 Loan term: up to 12 months
For loans up to UAH 250,000 no collat-eral required If more than UAH 250,000: goods for sale, property, equipment, vehicles, personal guarantee
Interest paid monthly; manda-tory repayment at maturity
Bank 2
Agricultural loan for SME clients Currency: UAH, USD or EUR Loan amount: up to EUR 1.5 mln Annual interest rate: 15-20% Loan term: 12 to 60 months
Agricultural machinery and equipment, warehouses, residential and commer-cial real estate, livestock, future har-vest
Flexible (standard or individual); in-dividual grace pe-riod
Bank 3
Working capital finance Currency: UAH, USD, or EUR Annual interest rate: 20% Loan term: 12 months (limit of 3 years)
Agricultural machinery and equipment, real estate, future grain harvest
Flexible (adapted to harvest sale)
Investment finance for agricultural machin-ery and equipment Currency: UAH or USD, or EUR Annual interest rate: 17% Loan term: up to 60 months
Agricultural machinery and equipment being bought
Source: publicly available information;
The moratorium on farm land sales still limits the use of agricultural land as collateral. The moratorium was included in the Land Code at the time of land privatization (1992) and has been extended ever since. In 2011, the new law on land markets and law on land cadastre, adoption of which is a precondition for lifting the moratorium, have been in development. The lifting of the moratorium has been repeatedly promised for 2012 by the new Government. The topic of freeing up the trade in land is politically a very hot topic in Ukraine and there is no clear consensus about the impact the new legislation might have. Optimists believe that, after the moratorium is lifted, land plots will rapidly find appropriate owners and agricultural producers will be able to use their land plots as collateral and thus significantly improve their access to finance. Sceptics highlight several problems that may inhibit the development of the land market and the use of land as collateral. These include the following:
45 Possibility to increase limit up to 50 per cent of average monthly turnover.

37
It is generally believed that a considerable number of land plots have been distributed extralegally, generating a lot of land ownership issues;
The national land cadastre largely exists on paper only and contains a lot of potential mistakes. One of the biggest problems relates to the different systems of coordinates used by different administra-tive units. A World Bank project is currently trying to assess the effort needed to build an electronic database linked to a single system of coordinates. During the site visit, insiders claimed that up to 30 per cent of the cadastre cases may be inaccurately registered and would require correction;
According to the draft law (as of September 2011), land can be bought by the State and individuals. If this stays unchanged, the new law will exclude agricultural companies (of any size) from participating in the trade in land and the overall situation will not change significantly. On the other hand, if legal entities are allowed to buy agricultural land, further consolidation of land might be expected, with al-ready large agri-holdings becoming even larger; the share of agricultural SMEs could decrease fur-ther;46
The market still faces severe information asymmetry. Most land owners in Ukraine are poorly in-formed about their rights and obligations;
Use of land as collateral on a large scale could be limited due to the relatively high costs related to its valuation as a non-standard asset. This will be especially problematic for SMEs, who borrow smaller amounts;
The ease with which banks may repossess agricultural land is another concern, given the currently poor law enforcement environment.
4.5.2 Insurance
Agricultural insurance in Ukraine is mostly offered on the basis of traditional products. Insurance compa-nies have understood that the quality of insurance services and products did not meet the demands of farm-ers in the past and have been trying to improve agricultural insurance practices. About a dozen insurance companies currently offer several basic products, including multi-peril crop insurance, named perils and sin-gle peril coverage. Agricultural producers prefer to insure strategic field crops (wheat, rapeseed and barley), which insurance companies expect to help them reach some tangible volumes. Insurance of fruit and vegeta-bles is essentially not offered. Several insurance companies have tried to launch livestock insurance pro-grammes but they have not been successful because of methodological issues and lack of client supervision. The index concept was introduced in 2001, but got off to a slow start. Until 2005, insurance companies pro-vided index crop insurance through area-based yield index programmes. The first weather index transactions (lack of rainfall index) were executed in 2005 for winter wheat in southern Ukraine. The pilot project on weather index insurance was conducted by the World Bank Commodity Risk Management Group and the IFC Agribusiness Development Project in 2003-2006. The project team proposed assistance in the design and promotion of weather index insurance products but the project had little follow-up. Although Ukraine has good quality weather data and crop yield data that is sufficient for the design of weather structures and has sufficient scientific and practical expertise to design and support index structures, weather index insurance is not favoured by the insurance companies. Both the insurers and producers need further information and education about index-based weather insurance. Furthermore, Government‐subsidized programmes have likely contributed to the collapse of a commercial index insurance product in Ukraine.
4.5.3 Leasing
Leasing companies offer a wide range of agricultural machinery and equipment made by both domestic and foreign producers. The down payment is normally 20-30 per cent, and the lease term can be as long as seven years. The interest rates are 7-8 per cent in foreign currency and 18-20 per cent in UAH. Note that the interest rates follow the volatile trend of the interest rates on bank investment loans observed over the last year.
46 Further consolidation is expected by some market players regardless of whether the land moratorium is lifted. Their view is based on recent developments and the overall environment in the country allowing such developments.
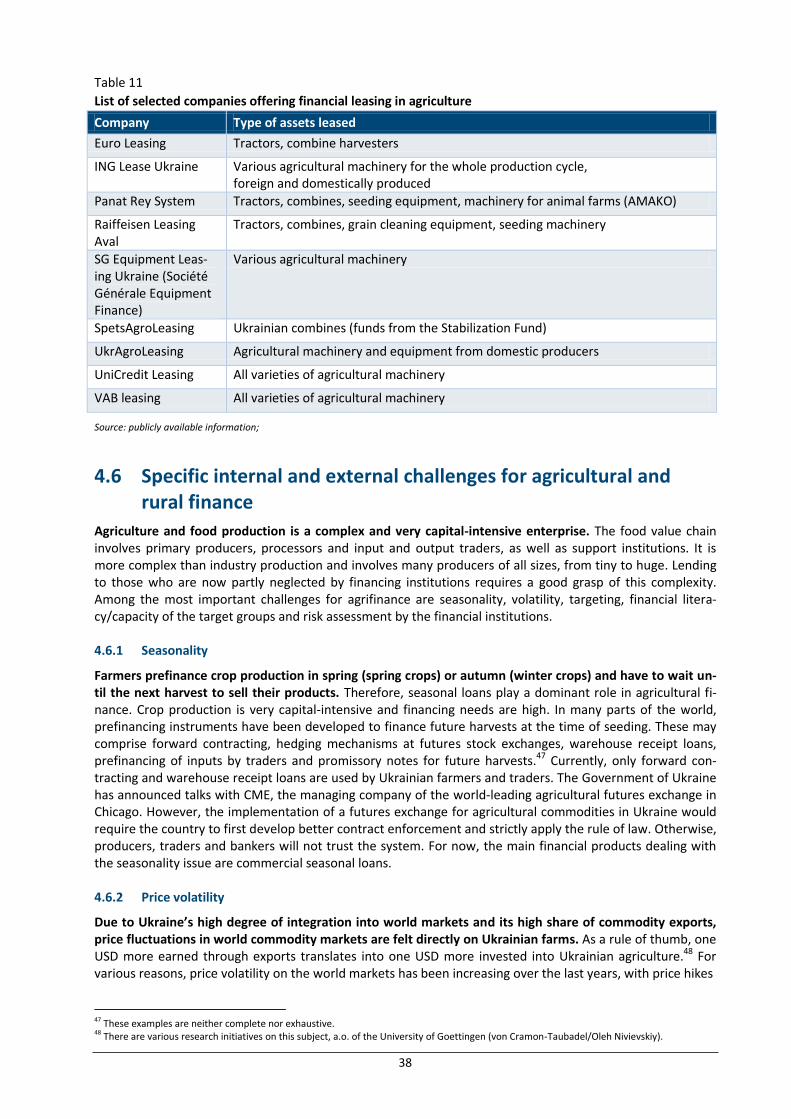
38
Table 11
List of selected companies offering financial leasing in agriculture
Company Type of assets leased
Euro Leasing Tractors, combine harvesters
ING Lease Ukraine Various agricultural machinery for the whole production cycle, foreign and domestically produced
Panat Rey System Tractors, combines, seeding equipment, machinery for animal farms (AMAKO)
Raiffeisen Leasing Aval
Tractors, combines, grain cleaning equipment, seeding machinery
SG Equipment Leas-ing Ukraine (Société Générale Equipment Finance)
Various agricultural machinery
SpetsAgroLeasing Ukrainian combines (funds from the Stabilization Fund)
UkrAgroLeasing Agricultural machinery and equipment from domestic producers
UniCredit Leasing All varieties of agricultural machinery
VAB leasing All varieties of agricultural machinery
Source: publicly available information;
4.6 Specific internal and external challenges for agricultural and rural finance
Agriculture and food production is a complex and very capital-intensive enterprise. The food value chain involves primary producers, processors and input and output traders, as well as support institutions. It is more complex than industry production and involves many producers of all sizes, from tiny to huge. Lending to those who are now partly neglected by financing institutions requires a good grasp of this complexity. Among the most important challenges for agrifinance are seasonality, volatility, targeting, financial litera-cy/capacity of the target groups and risk assessment by the financial institutions. 4.6.1 Seasonality
Farmers prefinance crop production in spring (spring crops) or autumn (winter crops) and have to wait un-til the next harvest to sell their products. Therefore, seasonal loans play a dominant role in agricultural fi-nance. Crop production is very capital-intensive and financing needs are high. In many parts of the world, prefinancing instruments have been developed to finance future harvests at the time of seeding. These may comprise forward contracting, hedging mechanisms at futures stock exchanges, warehouse receipt loans, prefinancing of inputs by traders and promissory notes for future harvests.47 Currently, only forward con-tracting and warehouse receipt loans are used by Ukrainian farmers and traders. The Government of Ukraine has announced talks with CME, the managing company of the world-leading agricultural futures exchange in Chicago. However, the implementation of a futures exchange for agricultural commodities in Ukraine would require the country to first develop better contract enforcement and strictly apply the rule of law. Otherwise, producers, traders and bankers will not trust the system. For now, the main financial products dealing with the seasonality issue are commercial seasonal loans. 4.6.2 Price volatility
Due to Ukraine’s high degree of integration into world markets and its high share of commodity exports, price fluctuations in world commodity markets are felt directly on Ukrainian farms. As a rule of thumb, one USD more earned through exports translates into one USD more invested into Ukrainian agriculture.48 For various reasons, price volatility on the world markets has been increasing over the last years, with price hikes
47 These examples are neither complete nor exhaustive. 48 There are various research initiatives on this subject, a.o. of the University of Goettingen (von Cramon-Taubadel/Oleh Nivievskiy).

39
in 2008 and 2011.49 To benefit from price fluctuations, farmers must invest in stocks and warehouses and closely follow input and output markets. This is difficult for poor farmers. Due to liquidity constraints and a lack of storage capacity, about half of producers sell more than 80 per cent of their harvest immediately.50 At harvest time, prices obviously tend to be lower than during the rest of the year. For poor farmers, liquidity matters more than profitability. To benefit from such price hikes, Ukrainian farmers will have to invest in modern post-harvest technologies and storage facilities. In Western Europe, farmers usually sell half of their harvest to traders half a year before harvest. Some of them are hedging market risks at commodity futures exchange markets. Also, the available storage facilities are much larger there, so that producers can react flexibly to market developments. This is not the case in Ukraine. Neither hedging instruments nor sufficient on-farm storage facilities are available. 4.6.3 Targeting
Currently, financial institutions have only limited interest in supporting small and poor farmers and rural households. Most of the agrifinance banks prefer big players, as was confirmed in interviews with several banks (see Figure 12 below). Targeting requires that financial institutions better understand their target groups. Smallholders do not necessarily pose higher lending risks — indeed, sometimes the opposite holds true, as examples from other countries have shown. For this reason, credit unions and representatives of the NBU’s Project Monitoring Unit (which administers the German-Ukrainian Fund) see good potential in rural households and smaller farms.
4.6.4 Financial literacy/capability
Farmer support organizations such as advisory services and farmers’ lobbying groups are comparatively weak in Ukraine. Investments in extension services, know-how and new technology are generally low. Farm-ers usually need this support because they tend to be neither frequent nor sophisticated borrowers. Devel-oping a bankable business plan is a challenge for those without such experience. Right now the Govern-ment’s major focus is food security for its population. This is a legitimate goal, as the share of food in con-sumer purchases is high. However, in future, efficiency and export promotion goals will necessarily play a
49 It seems that additional demand for biofuels and lower stocks in the world, in particular in the EU, are the most important factors contrib-uting to the greater volatility of markets for grains, sugar and oilseeds. 50 According to a 2009 poll conducted by the information agency APK Inform.
Figure 12
Level of importance of various agricultural client groups for financial institutions in terms of their future growth
Source: supply survey
Key: 1—least important; 7—most important
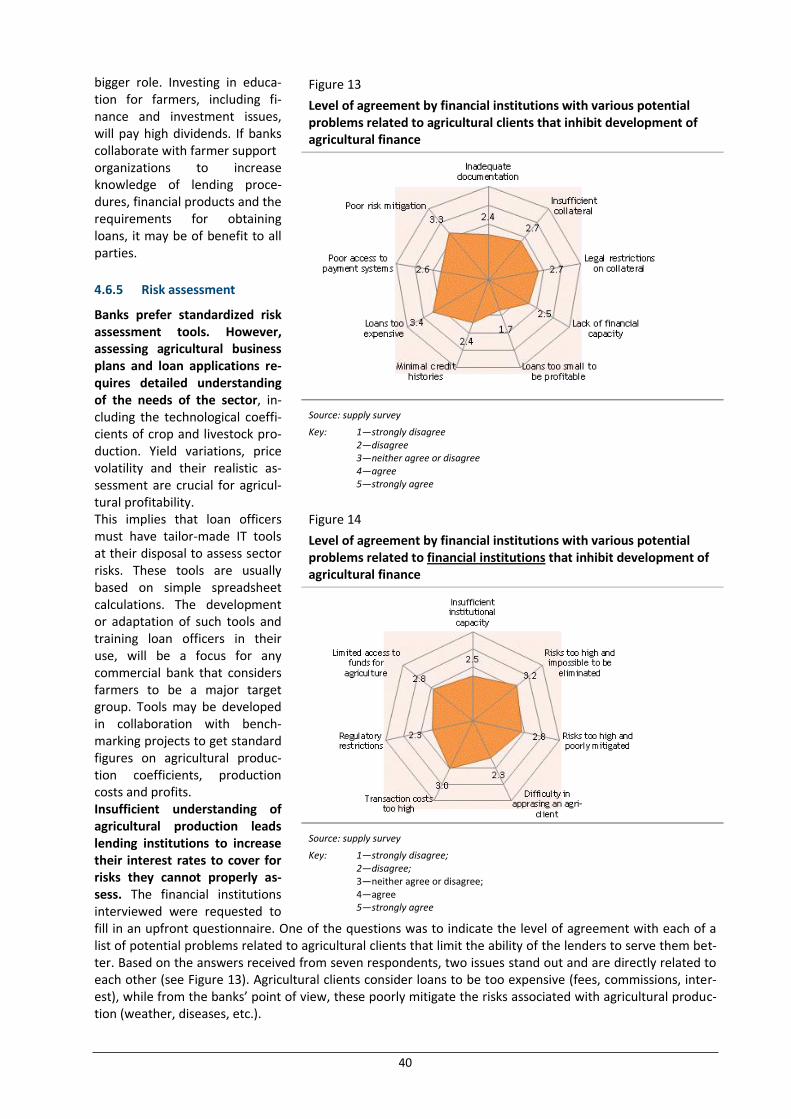
40
bigger role. Investing in educa-tion for farmers, including fi-nance and investment issues, will pay high dividends. If banks collaborate with farmer support organizations to increase knowledge of lending proce-dures, financial products and the requirements for obtaining loans, it may be of benefit to all parties.
4.6.5 Risk assessment
Banks prefer standardized risk assessment tools. However, assessing agricultural business plans and loan applications re-quires detailed understanding of the needs of the sector, in-cluding the technological coeffi-cients of crop and livestock pro-duction. Yield variations, price volatility and their realistic as-sessment are crucial for agricul-tural profitability. This implies that loan officers must have tailor-made IT tools at their disposal to assess sector risks. These tools are usually based on simple spreadsheet calculations. The development or adaptation of such tools and training loan officers in their use, will be a focus for any commercial bank that considers farmers to be a major target group. Tools may be developed in collaboration with bench-marking projects to get standard figures on agricultural produc-tion coefficients, production costs and profits. Insufficient understanding of agricultural production leads lending institutions to increase their interest rates to cover for risks they cannot properly as-sess. The financial institutions interviewed were requested to fill in an upfront questionnaire. One of the questions was to indicate the level of agreement with each of a list of potential problems related to agricultural clients that limit the ability of the lenders to serve them bet-ter. Based on the answers received from seven respondents, two issues stand out and are directly related to each other (see Figure 13). Agricultural clients consider loans to be too expensive (fees, commissions, inter-est), while from the banks’ point of view, these poorly mitigate the risks associated with agricultural produc-tion (weather, diseases, etc.).
Figure 13
Level of agreement by financial institutions with various potential problems related to agricultural clients that inhibit development of agricultural finance
Source: supply survey
Key: 1—strongly disagree 2—disagree 3—neither agree or disagree 4—agree 5—strongly agree
Figure 14
Level of agreement by financial institutions with various potential problems related to financial institutions that inhibit development of agricultural finance
Source: supply survey
Key: 1—strongly disagree; 2—disagree; 3—neither agree or disagree; 4—agree 5—strongly agree

41
Lenders further disagree with the suggestion that the loans requested are too small for an acceptable level of profit, only to confirm that the interest rates are not high enough. Banks are skeptical about the ability of agricultural clients to adequately eliminate risks as-sociated with production. An-other question in the survey asked respondents to indicate the level of agreement with each of a list of potential prob-lems related to financial institu-tions that limit the ability of the lenders to serve them better. Based on the answers from six banks, lenders tend to believe that the agricultural sector is highly risky and the risks cannot be adequately eliminated (see Figure 14). They are on average neutral about whether transaction costs are too high to profitably serve agricultural clients. Due to their special status, credit unions have a different perspective. The biggest problem for them is that they are restricted by regulatory requirements related to agricultural financing (i.e. for lending to legal enti-ties from agricultural sector). At the same time, transaction costs are not a problem for credit unions. Lenders would welcome external assistance to improve their risk management function. The supply survey shows that financial institutions would prefer international donor institutions to focus on risk management support when developing agricultural lending operations (see Figure 15 above). Training of front-office staff, as well as development of new products, is also of high importance.
4.7 Value chain financing
4.7.1 Overview
The food value chain is usually characterized by many producers of raw materials, a few processors, a few wholesale traders and many retail traders. In any given agricultural value chain, many producers deliver raw materials (raw milk, sugar beet, fruit and vegetables, grains and oilseeds) to a few processing plants (dairy plants, sugar factories, canning and fruit juice factories, grain mills and oilseed crushers). Processors add val-ue through grading, sorting, processing, packaging and logistical operations, and sell the processed agrifood products on to wholesale and retail traders. Access to finance is much easier for processors and wholesalers selling large quantities with a shorter pro-ject cycle than for primary agricultural producers. This offers opportunities for specific value chain financing schemes where the primary producers need finance and technology and the processors or wholesale traders need big quantities of appropriate raw materials. Processors or wholesale traders may be willing to support financing institutions to channel loans into the primary sector. This approach, involving three parties (primary producers, processors or wholesale traders and financing institutions), has been successfully implemented in many parts of the world. It offers benefits to all three partners. Banks can limit their lending risks, processors or traders receive raw materials that meet their needs and primary producers get access to market outlets.
Figure 15
Level of importance of various areas to develop agricultural lending
Source: supply survey
Key: 1—not important 2—important 3—very important

42
4.7.2 Financing through processors
The dairy and fruit and vegetable sectors in Ukraine offer interesting opportunities for value chain financ-ing. These subsectors are characterized by many small and very small producers facing tremendous produc-tion and marketing challenges. At the same time, processors (dairies, canning factories and fruit juice pro-ducers) have huge problems procuring raw materials which meet their quality standards and their quantity and timing expectations. All parties could benefit from such value chain financing. The experience of IFIs (mainly EBRD and IFC) and commer-cial banks in other countries shows that programmes offer-ing technical advice and financial support to small farmers are also in the interests of the vertically integrated pro-cessing companies. A processing company may therefore be willing to support technical advice and loan financing for smallholders. Participating banks may reduce their risks by channelling financial resources through the processing com-pany to raw material producers. Financing institutions bene-fit in this way from the technical knowledge of the agribusi-ness partner. Smallholders benefit from both technical ad-vice from competent agribusinesses and from financial means from financing institutions. In some cases, farmers form producer groups representing them. The development of such value chain financing schemes is in its infancy in Ukraine, albeit with some promising examples in the dairy and fruit sectors. Two international dairy companies based in France (Danone and Lactalis) have entered into partnership programs with Credit Agricole Bank and large milk producers. The classical French view of agriculture “par filière” instead of separating primary agriculture and the food sector is certainly facilitating this approach. The producers benefit from the development of their milk suppliers (in terms of both quantity and quality), while Credit Agricole Bank benefits from the technical knowledge of the milk processors. The farmers, in turn, obtain a stable business environment, which includes discounted credit, technical support and guaranteed market outlets. Investments in cows, milking and cooling equipment are supported for farmers willing to in-vest in between 200 and 600 cows. Credit Agricole Bank can accept a lower interest rate on the loans ex-tended to the selected partners - milk suppliers because of the reduced risk premium, coming from a more secure selection of potential borrowers due to their experience with the milk processors. In some cases, the milk processor may even agree to subsidize the interest rate to support the development of a strategic milk supplier. For smaller farmers, Danone has launched the Ukraine milk communities project, implemented by Heifer Ukraine and financed by the Danone Ecosystem Fund. The project aims to create 20 agricultural coopera-tives, each including between 60 and 80 smallholders based in regions close to the Danone production site in Kherson. The partnership between Heifer and Danone is already well known in Ukraine and abroad. The headquarters of Heifer International (US) has decided to support this partnership through a special appeal campaign to match the funds of the Danone Ecosystem Fund with money to be raised in the United States. The organization of small producers into milk cooperatives is still regarded with a high degree of scepticism by commercial banks,51 which refused an invitation to participe in the programme. Instead, special micro-credit programmes are being designed with credit unions. These promising pilot financing schemes, which seem likely to get rolled out to the whole country — with a dairy sector consisting of about one million small-scale producers — could have a very large impact on agricultural and rural development. Another promising example of value chain financing is the Ukraine Horticulture Development Project. This project is being implemented by Mennonite Economic Development Associates (MEDA) in conjunction with
51 The establishment of milk collection centres for small and the smallest village producers may be a promising option, although previous efforts in Ukraine have had mixed results. IFC, for example, supported the establishment of milk collection centres in the region of Vinnitsya.
Figure 16
General scheme of trilateral cooperation to reach small farmers

43
the Canadian International Development Agency (CIDA). The project works in southern Ukraine and the Cri-mea on several fronts: greenhouse-grown vegetables, berries, medicinal herbs, and table grapes. The main idea is to convince farmers that they can strengthen their position through consolidation into groups and give them new skills for work in such groups, enabling them to organize value chains and to work directly with big wholesale enterprises and final consumers. The potential processor needs the raw materials at precise mo-ments, with clear quality specifications. The selection of seeds and other inputs, the timing of seeding and harvesting, as well as the storage, transportation and delivery of raw materials are crucial for the processing company. Given these facts, integrated packaging and processing companies may be willing to support tech-nical assistance and finance programmes for smallholders.
4.7.3 Financing through input suppliers
Innovation is also being driven by input sup-pliers. Some international agrochemical com-panies are developing input financing schemes for agricultural producers. As the input suppli-er’s interest is greater than that of other par-ticipants (it will earn income on the products sold), it provides a certain level of first loss guarantee on a portfolio basis. The remaining risk is then evenly divided among the partici-pants, i.e. one third each (see Figure 17). Addi-tional risk and conflict mitigation measures ensure the transparency and fairness of the arrangement. Another approach to input financing is for agricultural producers to receive finance at the time of sowing, when they purchase in-puts (seeds, agrochemicals and fertilizers). The input supplier sells to the producer and receives a promissory note. The promissory note is then handed over to a financing institution providing funds for the input pur-chase. Such a mechanism has been successfully implemented in Brazil and is one of the major elements in Brazil’s agricultural development success story. To make this attractive for financial institutions, the quality of the notes is important. This document should allow the financial institutions to get access to assets in a very short period of time. A well-functioning judicial system and a specific regulatory environment are needed for the success of this kind of financing scheme. Currently, the legal framework is not adequate for such schemes in Ukraine. The future crop is treated as immovable property and belongs to the current owner or lessee of the respective land plot — not to the farmer who actually sowed it. No registration is required. Therefore, fraudulent schemes have been devel-oped in which a new “farmer” signs new lease contracts after seeding with the same lessors of the seeded land and becomes the new legal owner of the crop. The old lessee can try and reinstate his ownership but the crop has already been harvested and sold. As the new “owner” is not committing a criminal offence, the two lessees have only a civil dispute.
4.7.4 Financing through traders
Grain and oilseed traders offer forward contracts a few months before harvest time for selected farmers. This scheme is also used by the Government of Ukraine for purchases by the State Intervention Fund. Private traders admit that the share of forward contracts will remain small as long as contract enforcement is weak in Ukraine. Big traders and agri-holdings operating internationally may also be able to use international hedging in-struments at futures stock exchanges. A large producer or trader would use such a futures contract to bene-fit from probable future price rises or to hedge risks of probable future decreasing prices. He would either buy futures options at higher prices (going long) or would buy futures options at lower prices (going short) according to his risk perception and market expectations.
Figure 17
Risk-sharing scheme with input suppliers

44
The grain warehouse receipt programme funded by EBRD created a system that enables farmers or traders to store some of their grain after harvest and use it as collateral for loans based on the market value of the commodity, providing the funds needed to cover immediate expenses and prepare for the next harvest. As the produce is no longer brought immediately to the market, this system also helps to stabilize prices. Major users of this system are large domestic and international exporters of agricultural commodities.

45
5. Demand for agricultural finance (results of the demand-side survey)
5.1 Perceived access to finance for small farmers and rural house-holds
5.1.1 Past experience with getting loans
Three quarters of survey respondents had never taken out a loan. Respondents active in crop production and agricultural processing were more likely than others to have borrowed in the past. Most past borrowers had taken out their loans in 2009. In subsequent years, both accessibility and availabil-ity of loans for agricultural business decreased. Agricultural processors were the exception to this rule, with more companies taking out loans in 2011 than had borrowed in either 2009 or 2010. In contrast, the service segment recorded the steepest drop. Borrowers usually took one or (more rarely) two loans from a single lender. Multiple loans commonly origi-nated from suppliers of inputs or from buyers of produce. PrivatBank was the most important lender. Forty-two per cent of past borrowers named PrivatBank as the provider of their loan(s); for those working in animal husbandry, the rate was an even higher 60 per cent. Raiffeisen Bank Aval was the second most frequent lender, named by 11 per cent. Most respondents with loan experience needed less than five days to get a loan. About 60 per cent of respondents with borrowing experience had taken loans with terms not longer than a year. Service companies reported terms of 7-12 months, while those active in agricultural processing were more likely to borrow for longer terms (37-60 months). More than 50 per cent of respondents paid an annual interest rate of 15 per cent or less, but 41 per cent of stockbreeders took loans with an interest rate of more than 20 per cent. Over 50 per cent of crop and livestock producers pledged no collateral. Those who did usually pledged machinery and equip-ment. Enhancing the existing business (50 per cent) and household con-sumption (38 per cent) were the two main purposes for loans. Notable departures from the norm were agricultural processors, only 23 per cent of which borrowed for household consump-tion and other proces-sors, 15 per cent of which borrowed to
Figure 18
Collateral pledged
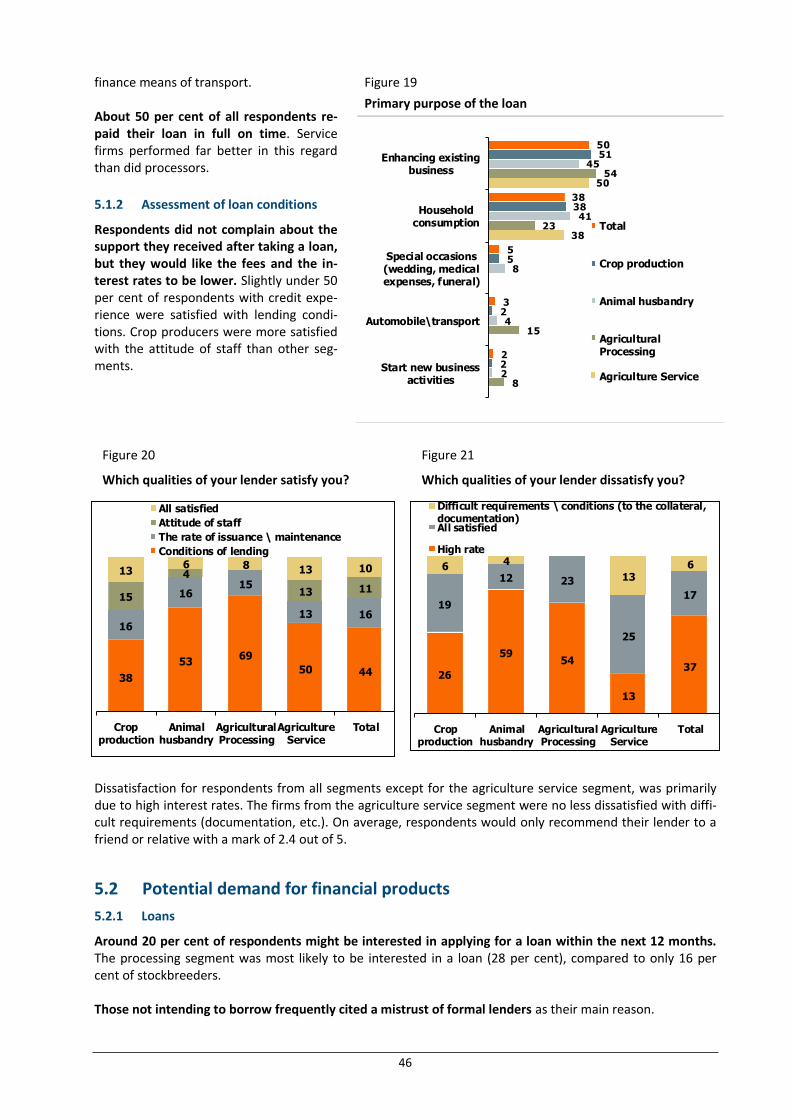
46
finance means of transport. About 50 per cent of all respondents re-paid their loan in full on time. Service firms performed far better in this regard than did processors.
5.1.2 Assessment of loan conditions
Respondents did not complain about the support they received after taking a loan, but they would like the fees and the in-terest rates to be lower. Slightly under 50 per cent of respondents with credit expe-rience were satisfied with lending condi-tions. Crop producers were more satisfied with the attitude of staff than other seg-ments.
Figure 20
Which qualities of your lender satisfy you?
Figure 21
Which qualities of your lender dissatisfy you?
Dissatisfaction for respondents from all segments except for the agriculture service segment, was primarily due to high interest rates. The firms from the agriculture service segment were no less dissatisfied with diffi-cult requirements (documentation, etc.). On average, respondents would only recommend their lender to a friend or relative with a mark of 2.4 out of 5.
5.2 Potential demand for financial products
5.2.1 Loans
Around 20 per cent of respondents might be interested in applying for a loan within the next 12 months. The processing segment was most likely to be interested in a loan (28 per cent), compared to only 16 per cent of stockbreeders. Those not intending to borrow frequently cited a mistrust of formal lenders as their main reason.
38
5369
50 44
16
1615
13 16
15
4
13 11
136 8 13 10
Cropproduction
Animalhusbandry
AgriculturalProcessing
AgricultureService
Total
All satisfied
Attitude of staff
The rate of issuance \ maintenance
Conditions of lending
26
5954
13
37
19
12 23
25
17
6 4
136
Cropproduction
Animalhusbandry
AgriculturalProcessing
AgricultureService
Total
Difficult requirements \ conditions (to the collateral,documentation)All satisfied
High rate
Figure 19
Primary purpose of the loan
50
38
5
3
2
51
38
5
2
2
45
41
8
4
2
54
23
15
8
50
38
Enhancing existingbusiness
Householdconsumption
Special occasions(wedding, medicalexpenses, funeral)
Automobile\transport
Start new businessactivities
Total
Crop production
Animal husbandry
AgriculturalProcessing
Agriculture Service

47
About 60 per cent of respondents interested in a loan would like to borrow UAH 50,000 or less. Agri-cultural service providers were more likely to re-quire larger loans, with a quarter of them indicating credit needs exceeding UAH 300,000. More than 50 per cent of interested respondents would like banks to make a decision about the loan in less than 5 days and 94 per cent of respondents would prefer to bor-row in the local currency. About 40 per cent of respondents would choose a loan term of up to 12 months; just under 30 per cent would like to borrow for 1—2 years and the rest would prefer longer loan terms. This indicator varied across sectors. Two thirds of crop producers would like to borrow for less than 12 months, while 44 per cent of livestock producers and 37 per cent of service firms would prefer loan terms of 2-5 years. Figure 22. Desired loan amount (UAH) Figure 23. Desired loan term (months)
In total, just over 50 per cent of interested respondents would take a loan with an interest rate higher than 5 per cent. Firms from the processing segment were more likely to choose lower interest rates, while almost a half of interested livestock producers were ready to pay rates higher than 10 per cent. The vast majority of interested respondents considered banks as the main potential lenders. Firms from the agriculture service segment were significantly more likely than others to approach friends or credit un-ions for a loan. Enhancing the existing business (68 per cent) and household consumption (20 per cent) were the major purposes for a loan named by potential future borrowers. Of firms in the service segment, 89 per cent would borrow for business purposes, while 45 per cent of processors would take a loan to boost household consumption.
2918
3324
938
22
25
19
20
9 11
25
17
20 12 11
13
16
9 9 11
13
10
8 15 11
2511
4 2
Cropproduction
Animalhusbandry
AgriculturalProcessing
AgricultureService
Total
more than 1 000 001 UAN 300 001 – 1 000 000
100 001 – 300 000 50 001 – 100 000
30 001 – 50 000 10 001 – 30 000
less than 10 000 UAN
65
23
40
25
49
17
28
40
38
24
17
44
20
3825
1 5 2
Cropproduction
Animalhusbandry
AgriculturalProcessing
AgricultureService
Total
less than 12 months 13-24
25-60 more than 61 months
Table 12 Most important factors for selecting a lender (where 1 is the most important and 9 is the least important)
Factors Means
Cost of loan (interest rate, fees) 1.74
Loan currency (USD, EUR, UAH) 2.24
Amount of loan 3.50
Length of loan 3.66
Flexible repayment schedule 4.57
Minimal or no collateral requirements 4.54
Convenient location of the lender 4.88
Quality of service (fast, transparent, friendly, etc)
6.73
Availability of other financial services from same institution (insurance, sav-ings, transfers, etc.)
7.29
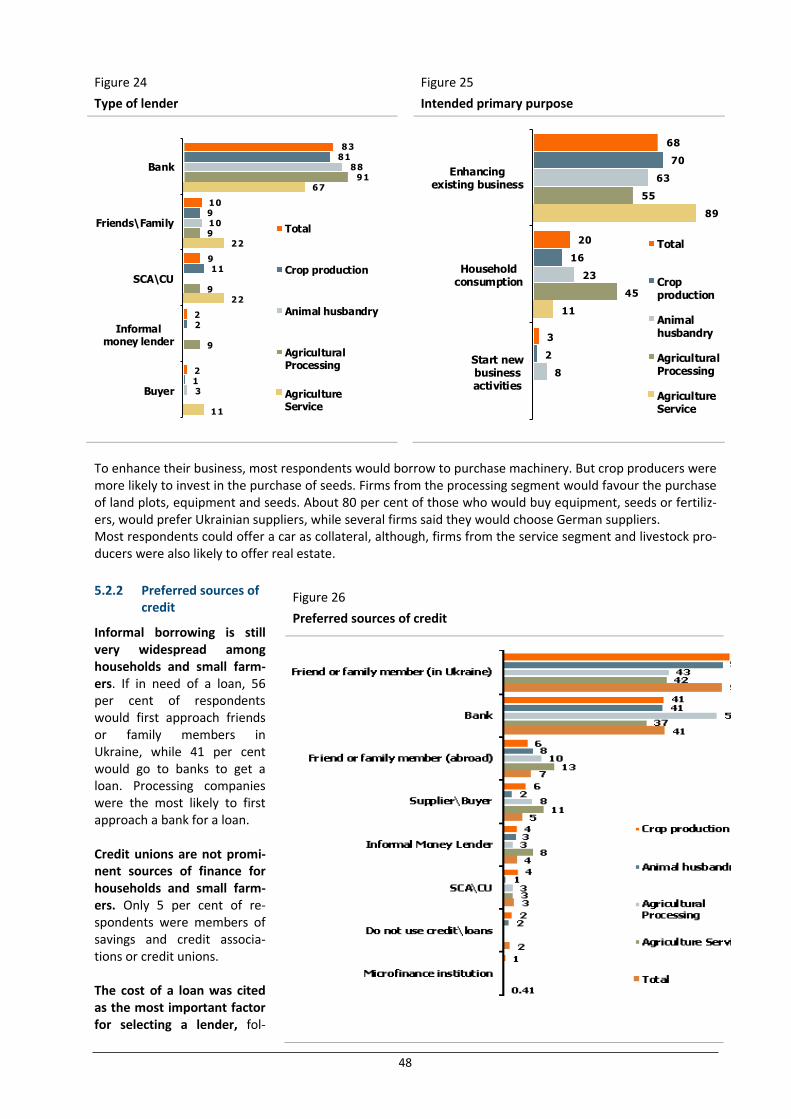
48
Figure 24
Type of lender
Figure 25
Intended primary purpose
To enhance their business, most respondents would borrow to purchase machinery. But crop producers were more likely to invest in the purchase of seeds. Firms from the processing segment would favour the purchase of land plots, equipment and seeds. About 80 per cent of those who would buy equipment, seeds or fertiliz-ers, would prefer Ukrainian suppliers, while several firms said they would choose German suppliers. Most respondents could offer a car as collateral, although, firms from the service segment and livestock pro-ducers were also likely to offer real estate.
5.2.2 Preferred sources of credit
Informal borrowing is still very widespread among households and small farm-ers. If in need of a loan, 56 per cent of respondents would first approach friends or family members in Ukraine, while 41 per cent would go to banks to get a loan. Processing companies were the most likely to first approach a bank for a loan. Credit unions are not promi-nent sources of finance for households and small farm-ers. Only 5 per cent of re-spondents were members of savings and credit associa-tions or credit unions. The cost of a loan was cited as the most important factor for selecting a lender, fol-
Figure 26
Preferred sources of credit
83
10
9
2
2
81
9
11
2
1
88
10
3
91
9
9
9
67
22
22
11
Bank
Friends\Family
SCA\CU
Informalmoney lender
Buyer
Total
Crop production
Animal husbandry
AgriculturalProcessing
AgricultureService
68
20
3
70
16
2
63
23
8
55
45
89
11
Enhancingexisting business
Householdconsumption
Start newbusinessactivities
Total
Cropproduction
Animalhusbandry
AgriculturalProcessing
AgricultureService
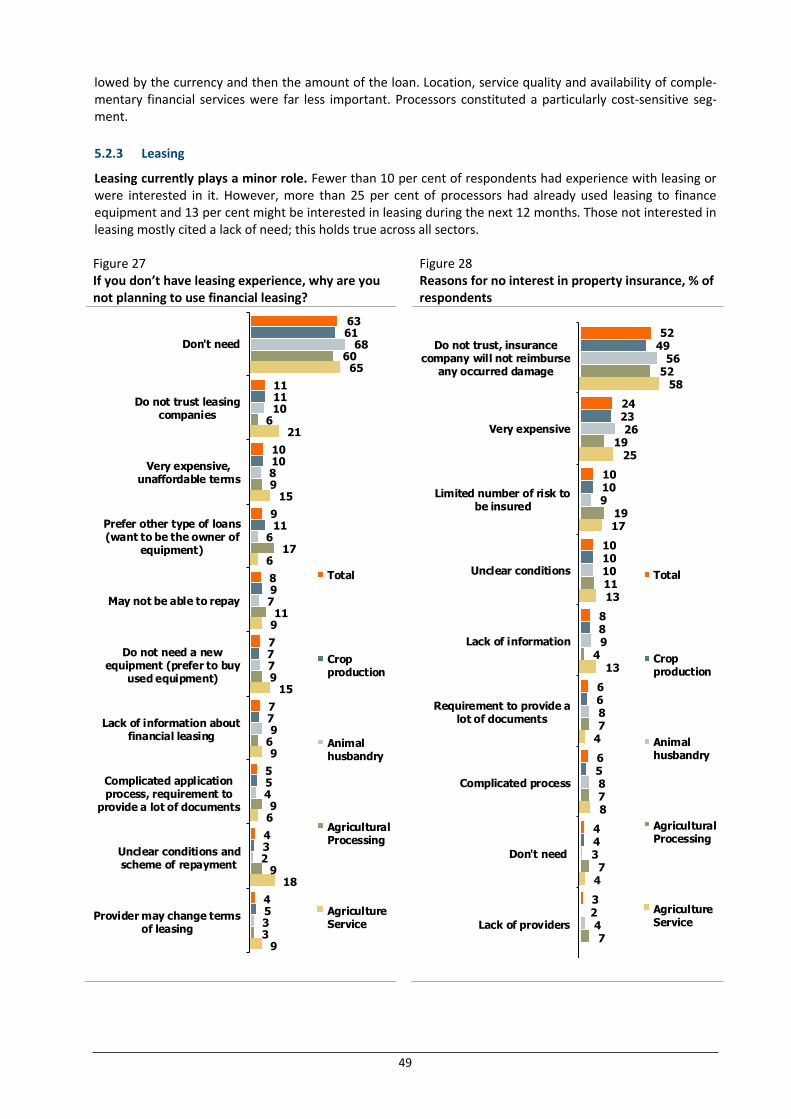
49
lowed by the currency and then the amount of the loan. Location, service quality and availability of comple-mentary financial services were far less important. Processors constituted a particularly cost-sensitive seg-ment.
5.2.3 Leasing
Leasing currently plays a minor role. Fewer than 10 per cent of respondents had experience with leasing or were interested in it. However, more than 25 per cent of processors had already used leasing to finance equipment and 13 per cent might be interested in leasing during the next 12 months. Those not interested in leasing mostly cited a lack of need; this holds true across all sectors. Figure 27 If you don’t have leasing experience, why are you not planning to use financial leasing?
Figure 28 Reasons for no interest in property insurance, % of respondents
63
11
10
9
8
7
7
5
4
4
61
11
10
11
9
7
7
5
3
5
68
10
8
6
7
7
9
4
2
3
60
6
9
17
11
9
6
9
9
3
65
21
15
6
9
15
9
6
18
9
Don't need
Do not trust leasingcompanies
Very expensive,unaffordable terms
Prefer other type of loans(want to be the owner of
equipment)
May not be able to repay
Do not need a newequipment (prefer to buy
used equipment)
Lack of information aboutfinancial leasing
Complicated applicationprocess, requirement to
provide a lot of documents
Unclear conditions andscheme of repayment
Provider may change termsof leasing
Total
Cropproduction
Animalhusbandry
AgriculturalProcessing
AgricultureService
52
24
10
10
8
6
6
4
3
49
23
10
10
8
6
5
4
2
56
26
9
10
9
8
8
3
4
52
19
19
11
4
7
7
7
7
58
25
17
13
13
4
8
4
Do not trust, insurancecompany will not reimburse
any occurred damage
Very expensive
Limited number of risk tobe insured
Unclear conditions
Lack of information
Requirement to provide alot of documents
Complicated process
Don't need
Lack of providers
Total
Cropproduction
Animalhusbandry
AgriculturalProcessing
AgricultureService

50
5.2.4 Property insurance
Property insurance is not popular among households and small farmers. More than 60 per cent of respond-ents in each segment had never purchased property insurance. The agricultural service segment was the most insurance-friendly, with nearly a quarter of respondents currently holding a policy. Almost 20 per cent of respondents were interested in purchasing property insurance in the next 12 months. Service and processing companies showed greater interest than crop producers. More than 50 per cent of respondents not interested in property insurance cited a lack of trust, fearing that an insurance company would not actually reimburse any damages, while 25 per cent cited the high cost of insurance.
5.2.5 Crop insurance
Crop insurance is rare among households and small farmers. Only 11 per cent of all respondents had experi-ence with crop insurance in total and no more than 16 per cent in any of the segments. The share of those who would be interested in such insurance in the next 12 months was no higher. The most interest and expe-rience was shown in the processing segment. A lack of trust was the most frequently cited reason for a lack of interest in crop insurance, followed by the high cost of insurance and the limited number of risks that can be insured.
5.2.6 Household savings
Over 50 per cent of the households in each segment had savings. Moreover, the households from the agri-culture service segment were the most likely to save money. About 50 per cent of respondents in every seg-ment who had savings claimed that their family contributed irregularly to their savings. Most respondents in every segment were saving money primarily for emergency expenses and kept their savings in cash at home. Only in the agriculture service segment were respondents more likely to keep their savings in banks than at home. About 40 per cent of respondents had savings of less than UAH 15,000. Busi-nessmen from the agriculture service segment were more likely to have larger amounts of savings. Nearly 25 per cent of them had more than UAH 20,000.
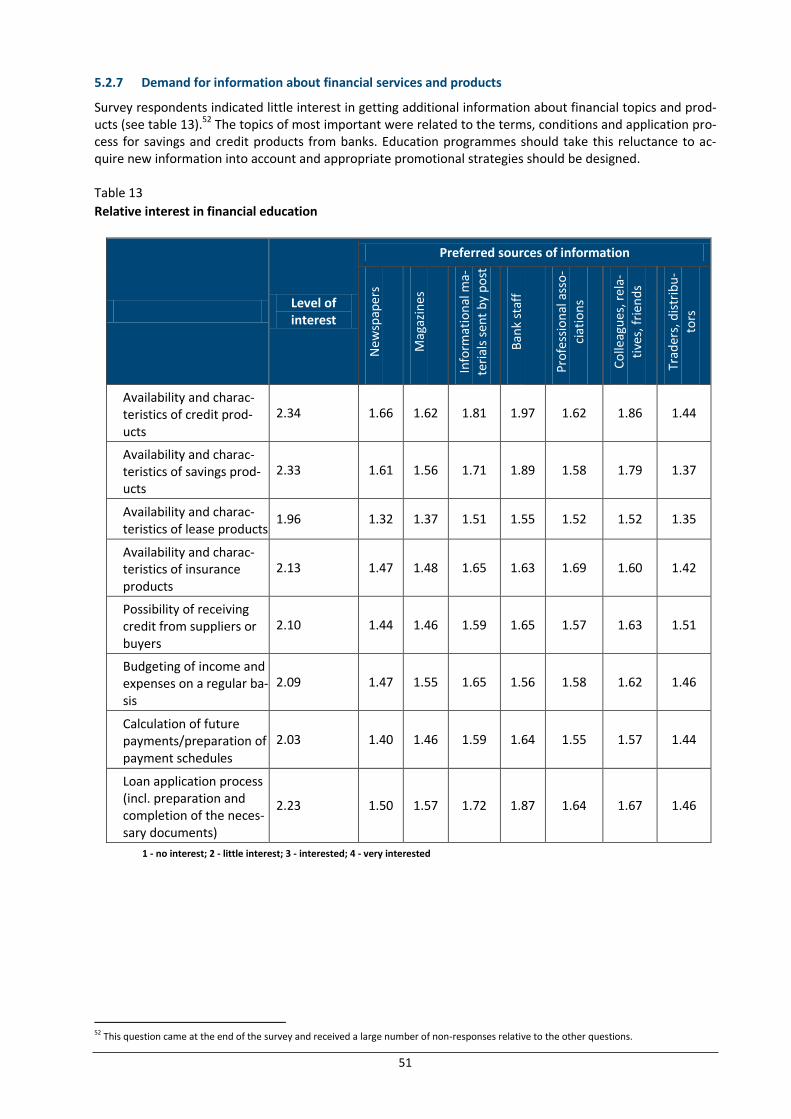
51
5.2.7 Demand for information about financial services and products
Survey respondents indicated little interest in getting additional information about financial topics and prod-ucts (see table 13).52 The topics of most important were related to the terms, conditions and application pro-cess for savings and credit products from banks. Education programmes should take this reluctance to ac-quire new information into account and appropriate promotional strategies should be designed. Table 13
Relative interest in financial education
Level of interest
Preferred sources of information
Ne
wsp
aper
s
Mag
azin
es
Info
rmat
ion
al m
a-te
rial
s se
nt
by
po
st
Ban
k st
aff
Pro
fess
ion
al a
sso
-ci
atio
ns
Co
lleag
ues
, rel
a-ti
ves,
fri
end
s
Trad
ers,
dis
trib
u-
tors
Availability and charac-teristics of credit prod-ucts
2.34 1.66 1.62 1.81 1.97 1.62 1.86 1.44
Availability and charac-teristics of savings prod-ucts
2.33 1.61 1.56 1.71 1.89 1.58 1.79 1.37
Availability and charac-teristics of lease products
1.96 1.32 1.37 1.51 1.55 1.52 1.52 1.35
Availability and charac-teristics of insurance products
2.13 1.47 1.48 1.65 1.63 1.69 1.60 1.42
Possibility of receiving credit from suppliers or buyers
2.10 1.44 1.46 1.59 1.65 1.57 1.63 1.51
Budgeting of income and expenses on a regular ba-sis
2.09 1.47 1.55 1.65 1.56 1.58 1.62 1.46
Calculation of future payments/preparation of payment schedules
2.03 1.40 1.46 1.59 1.64 1.55 1.57 1.44
Loan application process (incl. preparation and completion of the neces-sary documents)
2.23 1.50 1.57 1.72 1.87 1.64 1.67 1.46
1 - no interest; 2 - little interest; 3 - interested; 4 - very interested
52 This question came at the end of the survey and received a large number of non-responses relative to the other questions.

52
6. Conclusions and recommendations This study confirms the constrained access to finance of village households, private farms and corporate farms below 2,000 ha. Most of these agricultural producers are mainly using the retained earnings of their farm businesses to finance investments, although a minority of agricultural producers get loans from financial institutions. Most of these loans are short-term seasonal loans. This contributes to the underinvestment and low growth rates in the sector. Financing institutions are reluctant to invest in agronomy-based risk assessment and capacity. This is re-flected in the small number of banks with an agrifinance share in their credit portfolio that matches the over-all size and capital intensity of the sector. Banks are focusing on the lowest-hanging fruit. This means financing agri-holdings with huge land banks, food industry players with established food market shares, and international and domestic input and output traders. Microfinance institutions, including credit unions, are weak and are not expected to increase their market share in agrifinance above 10 per cent in the near future.
6.1 Estimation of the agrifinance market gap
There is an agrifinance gap of USD 8.7 billion in the Ukraine. The current agrifinance supply of about USD 3.3 billion falls short of meeting overall demand, estimated at USD 12 billion.
We now examine the demand for credit in selected subsectors, including grains, oilseeds, milk and pork production in order to facilitate future decision-making and investment by Ukrainian and international fi-nancing institutions.53
Methodological steps
The farm-level database of IER with more than 9,000 Ukrainian agricultural enterprises contains a breakdown of the production costs for each crop and livestock product for individual farms. From this database, we ex-tracted crop specific variable costs and fixed amortization costs for each farm. The variable costs reflect the needs for seasonal finance and the amortization costs reflect the need to periodically replace machinery and equipment. Applying the data on individual farms for each crop and livestock product resulted in an estimate of the total amount of variable and fixed costs for the total harvested area of the specific crop or the total herd size in the case of livestock. As the database represents only a part of total national production, we applied the total production numbers of the State Statistics Committee to estimate the total variable and fixed amortization costs for selected products. The fixed amortization costs reflect only the actual reinvestments of agriculture given current finance con-straints. To compare this with the potential demand for agrifinance if these constraints were removed, we assessed the investment needs for agricultural machinery, milk and pork production separately, based on the total number of tractors, combine harvesters, cows and pigs. For this assessment we used data from the State Statistics Committee.
53 The fruit and vegetable sector has not been included in the estimate for reasons of uncertainty about the quality of the data.

53
Table 14
Total variable costs and fixed amortization costs for selected crop and livestock products in Ukraine (estimated 2010)
Produc-tion
Variable costs,
‘000 UAH
Fixed amorti-zation costs, ‘000 UAH
Ha
Total ha, State Sta-
tistics Commit-
tee
Total esti-mated var-iable costs, ‘000 UAH
Total es-timated
fixed amortiza-
tion costs,
‘000 UAH
Total esti-mated
costs, ‘000 UAH
Costs per ha
USD
Wheat 6,048,788 612,709 3,670,143 6,284,000 10,356,703 1,049,077 11,405,780 227
Barley 2,285,132 248,137 1,890,497 4,317,000 5,218,159 566,626 5,784,785 168
Corn 4,301,571 360,800 1,588,795 2,648,000 7,169,308 601,336 7,770,643 367
Sunseed 4,220,663 469,960 2,649,813 4,526,000 7,209,083 802,713 8,011,796 221
Rapeseed 1,418,785 128,101 542,781 863,000 2,255,812 203,675 2,459,486 356
Soybean 1,512,475 141,761 741,670 1,037,000 2,114,736 198,210 2,312,946 279
Milk 2,540,562 154,461 472,002 2,736,500 14,729,276 895,507 15,624,784 714
Pork 3,276,301 204,857 2,463,486 7,576,600 10,076,463 630,049 10,706,512 177
Total ‘000 UAH
64,076,733
Total ‘000 USD
8,009,592
Source: IER, DerzhStat, own calculations
The figures above reflect only a part of total agriculture in Ukraine. The area of about 20 million ha is lower than the total cultivated area in 2010 amounting to about 27 million ha. Total arable land in Ukraine is 32.5 million ha. Livestock production would also comprise beef and poultry production. In addition, intensive land use under irrigation in southern Ukraine is neglected. We therefore believe that the figures in the table above should be about 50 per cent higher to reflect the total variable and fixed amortization costs of Ukraini-an agriculture in 2010. Thus, the total demand for finance of these costs would be about USD 12 billion. It is striking that the total variable amortization costs are low, representing only about 10 per cent of the variable costs. This reflects the rather long amortization rates of the Ukrainian tax authorities and the gener-ally decrepit state of agricultural machinery in Ukraine, where about 80 per cent of agricultural machinery has been written off. Therefore, our results underestimate the real investment needs. To assess the real in-vestment needs for combines and tractors in Ukraine, we made the following additional calculations based on the total numbers of both types of agricultural machinery in the country. Table 15 Reinvestment needs for tractors and combine harvesters in Ukraine
No. of tractors, corporate farms
No. of tractors, private farms and
households
No. of tractors, corporate farms
No. of combines, private farms and
households
2009 153,791 164,997 36,783 19,797
Total 318,788 56,580
Average replacement costs/unit
USD 90,000 USD 180,000
80% replacement USD 22.95 billion USD 8.15 billion
20 % replacement USD 5.74 billion USD 2.04 billion
Source: DerzhStat, own calculations. Note: Based on rough-cut average figures. Real prices may vary.
54
The calculations above suggest that actual investments partly reflect the constraints on access to finance in agriculture. With improved access to finance, investments would increase significantly in a highly profitable sector. The figures above also confirm the perceived needs of agricultural producers expressed in the de-mand survey. Of course, even with constraints on access to finance removed, the actual demand would be lower than the figures above may suggest: for instance, creditworthiness would be a serious constraint on the demand side for a considerable proportion of farms. Many Ukrainian farms are trapped in a vicious circle of low solvency, low yields, low margins, bad manage-ment and therefore low creditworthiness. We estimate that about 35 per cent of all farms suffer from this negative dynamic.54 Coupled with the results of the supply side survey, the figures above show that there is a considerable market gap. Agrifinance supply in 2010 amounted to about UAH 26.6 billion or USD 3.3 billion. Actual agrifinance needs for working capital and re-investment in 2010 are estimated at about USD 12 billion. This confirms the findings of the demand-side survey that the majority of agricultural producers, in particular the smaller ones, self-finance their operations using the retained earnings of the previous season.55 If finance constraints were removed potential demand would be far higher than current demand. The mar-kets for agricultural machinery, fertilizers, agrochemicals and seed products could double or triple in size.
6.2 Opportunities for financial products
6.2.1 Seasonal loans
There is considerable market potential for seasonal loans, as the assessment of the demand for finance in crop and livestock production shows. Variable costs, reflecting seasonal working capital needs, are much higher than the current capital replacement costs. The annual working capital needs in crop production are about USD 300/ha. Total cropland in 2011 is 27.5 million ha. Thus, annual working capital needs for crop pro-duction are estimated at about USD 8 billion in 2011 (see above). Only a minor share of this demand is cur-rently being financed. We estimate the current supply at about USD 2 billion, covering about 25 per cent of market needs. As-suming a 50 per cent self-financing rate, this would offer commercial banks an additional market of about USD 2 billion. We agree with the biggest investor in Ukrainian agriculture, Oleg Bakhmatyuk, that the market segment from 500 to 2,000 ha in particular offers interesting opportunities for banks. They would simply have to lower their current financing threshold of 2,000 ha. The challenge for financing institutions is to assess risks in a sector with widely varying levels of perfor-mance. The average profitability and growth potential of farms is misleading. Current risk assessment tools cannot capture individual client risks in primary agriculture. Banks must invest in enhancing sector knowledge and create agronomy-based risk assessment tools. Risk assessment can be done with simple crop budgets based on benchmarking results. Financial risk assessments would then be complemented by agronomic risk assessments involving technical and financial farming coeffi-cients (costs/ha, yields, gross margin/ha, input and output price levels). These coefficients could be analysed by loan officers and sector staff, allowing detailed cash flow projections of crop production to complement clients’ sometimes misleading financial accounts. Simple spreadsheet calculations, including benchmark re-sults for the most relevant crops, would be sufficient to get a realistic picture of farm businesses. Competi-tion between banks is likely to grow as more banks realize this market potential.
54 Based on the IER database covering 9,000 corporate farms in Ukraine. 55 These results are also confirmed by a recent IFC study, Investment Climate in Ukraine – as Seen by Private Businesses, October 2011.

55
6.2.2 Leasing
The removal of tax constraints has led to a spectacular turnaround in leasing, with very interesting growth perspectives. Both agricultural machinery and food equipment offers the best opportunities for leasing. Agri-cultural machinery replacement needs are estimated at about USD 31 billion. The current market is estimated at about USD 1.5 billion annually.56 Potential demand is estimated at about USD 5 billion annually. The growth of leasing will most likely continue, with huge growth potential for specialized leasing companies. Due to the interest rate differential, cross-border leasing and cross-border guarantees will also grow.57 Financial leasing products for agriculture are very similar to leasing products in the transport sector. The central challenge is risk assessment. Currently, the higher end of the market is most attractive, consist-ing as it does of agriholdings or bigger farms with international accounting standards and international finan-cial management practices. In future, competition between leasing companies will grow. Financing institu-tions collaborating with agricultural machinery and equipment producers will have a competitive advantage.
6.2.3 Value chain financing
The advantages of milk value chain schemes are obvious and pro-poor: village producer groups get access to finance to invest in a milk collection centre (about USD 50,000 to 100,000); dairies get an additional share of raw milk that is cheaper than milk from corporate farms; and banks get additional loan business with probable guarantees from the dairy industry. These schemes can be scaled up and would reach a large num-ber of small household producers in villages. It would have a very positive impact on rural development and the rural poor. Further opportunities for value chain financing with a significant impact on small producers exist in the fruit and vegetable production zones in southern Ukraine which have a functioning irrigation infrastruc-ture.58 Fruit juice producers or vegetable canning factories (including tomato processing companies) are usu-ally very open to supporting the small producers around their processing plants. Such schemes may also work as a tripartite agreement, including producer groups, food processors and banks. The potential demand for value chain financing depends on a large number of factors and decisions outside the scope of this study. However, we believe that the potential is great enough to justify investments in product development by commercial banks. The total number of cows in Ukraine is about 2.7 million. About 80 per cent, or more than 2 million, are village cows in poor rural households.
56 Oral information from agricultural machinery producers and traders. 57 Many exporting countries support agricultural machinery exports through special publicly funded export guarantee facilities, e.g. US EximBank or German Hermes. 58 During the Soviet period the irrigation area was about 2 million ha. Currently, it is estimated at about 1 million ha.

56
Table 16 Overview of proposed financial products
Description Target group
Loan pur-pose
Loan size (USD)
Loan pricing
Term Collateral Loan pro-cessing time
Risk level
Level of effort
Agricultural machinery leasing
Farms 500—2000 ha
Mov-able assets
100-500k
Above aver-age
3-5 years
Equip-ment to be pur-chased
10 days Me-dium
Low
Seasonal crop loans
Farms 500—2000 ha
Work-ing capi-tal
75-150k
Market rates
12 months
Fixed and movable assets
2 days Me-dium
Low
Investment loans for village milk tanks
Village house-holds with 1—3 cows
Fixed assets
50–100k
Above aver-age
3-5 years
Equip-ment to be pur-chased
30 days Me-dium
High
Investment loans for village cold stores
Village house-holds and small farms (2—100 ha)
Fixed assets
50-100k
Above aver-age
4-6 years
Equip-ment to be pur-chased
30 days High High
6.3 Technical assistance
The financial products described above need sector-specific support to be implemented by commercial banks.
Tailor-made financial products for primary agriculture require special attention because of the various in-ternal and external challenges of the sector. Seasonal loans appear to be simple at first glance, but need business-specific risk assessment. This is particularly important in a sector with widely varying levels of per-formance by individual farms. Investment in agronomy-based risk assessment tools is a precondition for sus-tainable and successful banking operations in the sector, in particular in the recommended target group of farms of 500 to 2,000 ha. Agricultural leasing requires even more specific knowledge and risk assessment. The product itself is not very different from transport leasing, which is widely known by leasing companies and banks in Ukraine. But the application of modern technology and farm practices requires specific tools. Usually, international agri-cultural machinery producers are ready to collaborate with banks to improve the capacity of bank staff. However, banks need impartial knowledge to assess the risks of individual borrowers. Without in-house knowledge of the technical coefficients and potential benefits of improved farm technology, lending is risky. To mitigate risks, leasing companies and banks should invest in adequate IT tools for assessing the operations of the farm business, including variable and fixed costs as well as expected cash flows and profits. On the demand side, farms need advice to improve their business planning to make them more bankable. Value chain financing with tripartite agreements between commercial banks, food processing companies and small primary producers requires strong common interests and good will from all parties involved to succeed. There are only a few examples in Ukraine where smallholders are involved. IFIs and donor organiza-tions providing TA may be willing to support the sector in developing pilot operations that can be scaled up if successful. HEIFER and MEDA are two organizations with TA experience in the dairy and fruit sectors in Ukraine. DANONE and CREDIT AGRICOLE are also showcases of good practice in value chain financing. With-out intensive TA in the beginning, the chances of successful implementation of such schemes will be small.

57
The investment in a milk collection centre with cooling equipment and a milk tank in a village is a simple technical step. However, to organize small village producers around this activity is time-consuming and needs dedicated village advisors to guide and monitor the implementation process. Table 17 Overview of the technical assistance requirements on the supply side
Financial product Awareness
building Staff capac-
ity
Product develop-
ment
Risk man-agement
Efficiency of opera-
tions
Infrastruc-ture and IT
Seasonal loan Low Medium Low High Low Medium
Agricultural leasing Low Medium Low High Low High
Long-term loan for village milk tank
High High High Very high High Medium
Long-term loan for village cold store
High High High Very high High Medium

European Fund For Southeast Europe
www.efse.lu To download or to order a printed version please go to: www.efse.lu
______________________________________________________________________________________
EFSE – A DEVELOPMENT FINANCE INITIATIVE SUPPORTED BY
______________________________________________________________________________________
Initiator and Lead Investor
Fund Manager
Fund Advisor
Disclaimer: The Fund is a specialized investment fund governed by Luxembourg law and is reserved for institutional, professional or other well-informed investors as defined by Luxembourg law. The adequacy or accuracy of the issue document or the assets held in the Fund have however not been approved or disapproved by any authority. The information given herein constitutes neither an offer nor a solicitation of any action based on it, not does it constitute a commitment of the Fund to offer its shares to any investor. No guarantee is given or intended as to the completeness, timeliness or adequacy of the information provided herein. No investment may be made except upon the basis of the current issue document of the Fund, which is obtainable free of charge from Oppenheim Asset Management Services S.à r.l., 4 rue Jean Monnet, L-2180 Luxembourg. Not for distribution in or into the United States of America, Canada, Japan or Australia or to any U.S. person or in any other jurisdiction in which such distribution would be prohibited by applicable law. This document does not necessarily deal with every important topic or cover every aspect of the topics with which it deals. The information in this document does not and shall not be construed to constitute the provision of investment, legal, tax or any other advice. It has been prepared without regard to the individual financial and other circumstances of persons who receive it.
© European Fund for Southeast Europe (EFSE) 2012. All rights reserved. Translation, reprinting, transmission, distribution, presentation, use of illustrations and tables or reproduction or use in any other way is subject to permission of the copyright owner acknowledging the source. Investors must not rely on LuxFLAG or the LuxFLAG Label with regard to investor protection issues and LuxFLAG cannot incur any liability related to financial performance or default of the Fund. The LuxFlag label has been granted to the Fund until 31. December 2012.