potential effects of highway mortality … effects of highway mortality and habitat fragmentation on...
TRANSCRIPT
R E S E A R C H P R O G R A M S
POTENTIAL EFFECTS OF HIGHWAY MORTALITY AND HABITAT FRAGMENTATION ON A POPULATION OF PAINTED TURTLES IN MONTANA
Final Reportprepared for THE STATE OF MONTANA DEPARTMENT OF TRANSPORTATION
in cooperation withTHE U.S. DEPARTMENT OF TRANSPORTATIONFEDERAL HIGHWAY ADMINISTRATION
October 2006prepared by
Kathleen GriffinDaniel H. Pletscher
Wildlife Biology ProgramUniversity of MontanaMissoula, MT 59812
You are free to copy, distribute, display, and perform the work; make derivative works; make commercial use of the work under the condition that you give the original author and sponsor credit. For any reuse or distribution, you must make clear to others the license terms of this work. Any of these conditions can be waived if you get permission from the sponsor. Your fair use and other rights are in no way affected by the above.

Potential effects of highway mortality and habitat fragmentation
on a population of painted turtles in Montana
Final Report
by
Kathleen Griffin, PhD Candidate
and
Daniel H. Pletscher
Wildlife Biology Program University of Montana Missoula, MT 59812
A report prepared for the
Montana Department of Transportation 2701 Prospect Avenue
Helena, MT 59620
in cooperation with
U.S. Department of Transportation Federal Highways Administration
September 2006

TECHNICAL REPORT DOCUMENTATION PAGE
1. Report No. FHWA/MT-06-010-8169
2. Government Accession No.
3. Recipient’s Catalog No. 5. Report Date September 2006
4. Title and Subtitle Potential effects of highway mortality and habitat fragmentation on a population of painted
turtles in Montana.
6. Performing Organization Code
7. Author(s) Griffin, Kathleen A. and Daniel H. Pletscher
8. Performing Organization Report No. 10. Work Unit No. (trais) 9. Performing Organization Name and Address
University of Montana Wildlife Biology Program 32 Campus Dr. Missoula, MT 59812 Tel: 406-243-5292 Fax: 406 243-4557
11. Contract or Grant No. 8169
13. Type of Report and Period Covered Final Report June 2002 – September 2006
12. Sponsoring Agency Name and Address Research Programs Montana Department of Transportation 2701 Prospect Avenue PO Box 201001 Helena, MT 59620-1001
14. Sponsoring Agency Code 5401
15. Supplementary Notes Research preformed in cooperation with the Montana Department of Transportation and the US Department of Transportation, Federal Highway Administration. This report can be found at http:www.mdt.mt.gov/research/docs/research_proj/turtle/final_report.pdf 16. Abstract Highways and other road systems can present problems to wildlife populations though direct mortality and indirectly by reducing landscape connectivity by creating significant barriers to movement. These impacts can lead to fragmented populations, alteration of animal behavior, lowered population sizes and, thus, lowered population viability for some species. This research examined the potential effects of human-caused fragmentation on a population of western painted turtles (Chrysemys picta bellii) in northwestern Montana. Two studies were conducted: 1) a Capture-Mark-Recapture (CMR) study to examine survival and movement rates and 2) road mortality surveys to examine the number of road kills and the potential affect on the population. Together these studies help to determine the overall affect of the highway on the population and on the landscape level connectivity of the population. In a 6.4-km (4-mile) stretch of Highway 93 in the Ninepipe/Ronan area, a total of 1,040 turtles were killed from 2002 to 2004. Three priority areas were identified where road mortality levels were very high; the 2 kettle ponds split by the highway and the area near the scenic turnout at Beaverhead Lane. Typically, overwinter survival rates were very high (0.8 - 0.9) and summer survival rates were lower (0.8 – 0.4) when turtles were more likely to be moving and encountering the highway. Annual apparent survival rates were between 0.85 and 0.13 and would not be sustainable in a closed population. These survival rates are confounded with permanent emigration. During the drought, turtles moved off the study site to refugia habitats indicating a larger regional population (i.e., not a closed population), thus, maintaining connectivity across the landscape is essential in order to sustain viable populations in the future. A review of available fencing methods used in herpetofauna-highway interaction projects is provided in Appendix A. An experiment to examine the effectiveness of flashing material as a barricade on low fencing was conducted (Appendix B). Turtles were able to climb fencing material that did not have a flashing barrier. Therefore, incorporating fencing as a barricade or to direct turtles to crossing structures needs to take into account the climbing ability of the turtles. Ultimately, the information in this report can be used to guide design and placement of wildlife crossing structures during the Highway 93 reconstruction project. 17. Key Words Population dynamics, survival, habitat connectivity, road mortality, road-kill, western painted turtle, Chrysemys picta bellii, capture-mark-recapture, wildlife crossing structures, wildlife fencing, Wildlife
18. Distribution Statement Unrestricted. This document is available through the National Technical Information Service. Springfield, VA 21161
19. Security Classification (of this report) Unclassified
20. Security Classification (of this page) Unclassified
21. No. of Pages 76
22. Price
ii
DISCLAIMER STATEMENT This document is disseminated under the sponsorship of the Montana Department of Transportation and the United States Department of Transportation in the interest of information exchange. The State of Montana and the United States Government assume no liability of its contents or use thereof. The contents of this report reflect the views of the authors, who are responsible for the facts and accuracy of the data presented herein. The contents do not necessarily reflect the official policies of the Montana Department of Transportation or the United States Department of Transportation The State of Montana and the United States Government do not endorse products of manufacturers. Trademarks or manufacturers' names appear herein only because they are considered essential to the object of this document. This report does not constitute a standard, specification, or regulation. ALTERNATIVE FORMAT STATEMENT MDT attempts to provide accommodations for any known disability that may interfere with a person participating in any service, program, or activity of the Department. Alternative accessible formats of this information will be provided upon request. For further information, call (406) 444-7693 or TTY (800) 335-7592 or by calling Montana Relay at 711. ACKNOWLEDGEMENTS Additional funding for this project was provided by the Confederated Salish Kootenai Tribes, the Summerlee Foundation, and the Western Transportation Institute. Larissa Bailey, Bill Kendall, and Jim Nichols, Researchers at the USGS Patuxent Wildlife Research Center, Laurel, Maryland, provided invaluable quantitative support.
CONVERSION CHART Metric English
1 millimeter (mm) 0.039 inches (in) 1 centimeter (cm) 0.394 in
39.4 in 1 meter (m) 3.3 feet (ft) 1 kilometer (km) 0.62 miles (mi) 1 gram (g) 0.035 ounces (oz) 1 hectare (ha)_ 2.5 acres (ac)
iii

TABLE OF CONTENTS
INTRODUCTION............................................................................................................. 1 METHODS ........................................................................................................................ 5
Study Area ..................................................................................................................... 5 Study Area .................................................................................................................. 5 Study Sites .................................................................................................................. 5
Field Methods ................................................................................................................ 7 Road Mortality Surveys .............................................................................................. 7 Capture – Mark – Recapture Study............................................................................. 8
Analytical Methods ..................................................................................................... 10 Model Selection ........................................................................................................ 11 Goodness of Fit ......................................................................................................... 11 Population Level Effects........................................................................................... 12
RESULTS ........................................................................................................................ 13 Road Mortality Surveys ............................................................................................. 13
Road Mortality Surveys ............................................................................................ 13 Traffic Volumes ........................................................................................................ 18
Capture – Mark – Recapture (CMR) Study............................................................. 19 Descriptive Demographics........................................................................................ 19 Modeling................................................................................................................... 21
Population Level Mortality ........................................................................................ 30 DISCUSSION .................................................................................................................. 31
Survival ........................................................................................................................ 31 Population Structure .................................................................................................. 33 Movements................................................................................................................... 34 Population Dynamics and Connectivity.................................................................... 35
RECOMMENDATIONS................................................................................................ 37 LITERATURE CITED .................................................................................................. 40 APPENDIX A. Fencing Methods and efficacy for minimizing turtle road kill ........... A-1 APPENDIX B. Use of low fencing with aluminum flashing as a barrier for turtles .... B-1 APPENDIX C. Road mortality data for all species ...................................................... C-1
iv

LIST OF FIGURES
Figure 1. Road system effects on animals at various levels from individuals to
populations.................................................................................................................... 2
Figure 2. Aerial view map of study area............................................................................ 6
Figure 3. Average road mortality on a 6.4 km section of Highway 93 separated out by
weekly time periods and sex……………………………………............................ ...14
Figure 4. Average road mortality on a 6.4 km section of Highway 93 separated out by
weekly time periods and age class……………………..............................………….15
Figure 5. Road mortality marker locations along Highway 93 and the total number of
turtle road mortalities corresponding to road markers……………………………….16
Figure 6. The number of adult and juvenile turtles that moved separated out by sex and
distance (m) categories ............................................................................................... 20
Figure 7. Movement estimates for adult turtles by season for various types of movements
..................................................................................................................................... 24
Figure 8. Estimates of adult turtles apparent survival rates by pond over the course of the
study............................................................................................................................ 27
Figure 9. Probability of capture (p) for adult turtles within the pond complexes............ 28
Figure 10. Adult turtle abundance estimates for pond complexes over the seasons........ 29
Figure 11. Total adult turtle abundance estimates for all pond complexes combined..... 30
Figure A-1. Wire fence with plastic fabric mesh……………………………………… A-3
Figure A-2. Wire fence with smaller mesh at the bottom……………………………... A-3
Figure A-3. Smaller mesh fence..……………………………...……………………….A-5
Figure A-4. Florida softshell turtle climbing over fabric silt fence…………………… A-5
Figure A-5. Galvanized steel rail with lip for amphibians and reptiles……………….. A-6
Figure A-6. Metal rails with lip for amphibians and reptiles…………………………..A-6
Figure A-7. Paynes Prairie Ecopassage concrete wall with lip………………………...A-7
Figure A-8. Paynes Prairie Ecopassage – Artist rendition, concrete wall with lip……. A-8
Figure A-9. Paynes Prairie Ecopassage – Artist rendition, roadside view……………..A-9
Figure A-10. Type-A fence/guardrail………………………………………………….A-10
Figure A-11. Vegetation growing along concrete wall………………………………...A-12
v

Figure A-12. Example of combination of barrier methods. Arched culvert with large
fencing and metal rail for amphibians and reptiles…………………………………..A-13
Figure B-1. Wire enclosures with aluminum flashing used to test turtle’s climbing
ability………………………………………………………………………………….B-3
Figure B-2. Turtles in fencing enclosure with aluminum flashing……………………….B-3
Figure B-3. Turtle about to breach fencing enclosure without aluminum flashing………B-4
Figure C-1. Road mortalities of major taxonomic groups (no reptiles) over a three year
period………………………………………………………………………………….C-3
Figure C-2. Road mortalities of major taxonomic groups over a three year period……...C-3
LIST OF TABLES
Table 1a. The number of road-killed turtles by year, sex, and age class found along a 6.4
km section of Highway 93 ..............................................................................................13
Table 1b. The number of road killed turtles by year, sex, and age class found within the
Capture – Mark – Recapture study area..........................................................................13
Table 2. Number of marked1/ adult and juvenile turtles found dead from overwinter and
road mortality..................................................................................................................17
Table 3. Description of road types within the project area and traffic volumes..................18
Table 4. Number of female and male adult turtles in each pond complex encountered
during the Capture – Mark – Recapture study................................................................19
Table 5. Mark-recapture models of adult painted turtles used to estimate movement
probabilities between pond complexes ...........................................................................23
Table 6. Mark-recapture models of adult painted turtles used to estimate survival
probabilities within pond complexes ..............................................................................26
Table 7. Estimates of adult turtle apparent survival probabilities by season and annually .27
Table C-1. The number of individual animals (not including turtles) found during road
mortality surveys along a 6.4 km section of Highway 93.............................................C-2
vi

INTRODUCTION
Highways and other road systems can present problems to wildlife populations though
direct mortality and indirectly by reducing landscape connectivity by creating significant barriers
to movement. These impacts can lead to fragmented populations, alteration of animal behavior,
lowered population sizes and, thus, lowered population viability for some species (Ruediger
1996, Trombulak and Frissell 2000). Both wildlife managers and government agencies
responsible for transportation have expressed concern over wildlife-highway interactions. Much
attention has been paid to highway-wildlife interactions during the past decade via international
conferences on ecology and transportation (Evink et al. 1996, 1999, ICOET 2003, 2005). The
degree to which roads affect wildlife depends on many factors including road densities, road
widths, traffic volumes, and the physical ability and behavior of each species.
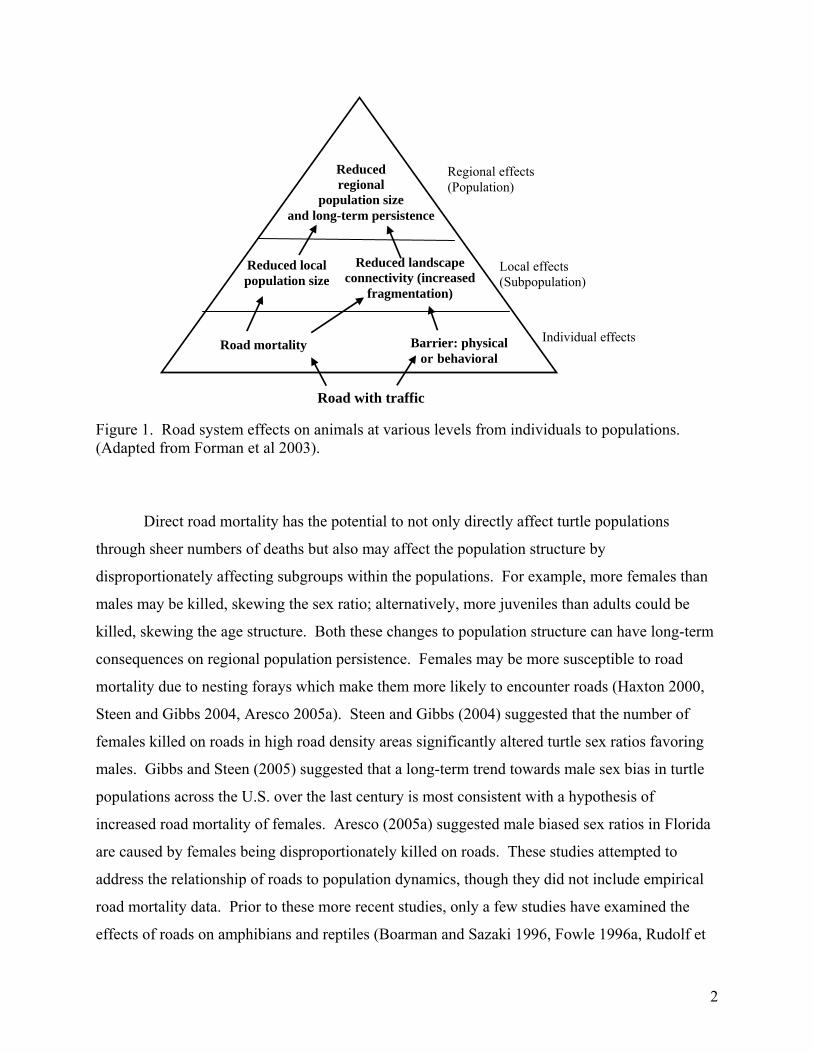
Sheer numbers of individuals killed on the road can affect local population size which, in
turn, can impact the regional population size and, ultimately the long-term population persistence
(Figure 1). Direct road mortality is expected to have negative impacts on turtle population
dynamics because of their life history traits. Most turtle species have low recruitment rates,
delayed sexual maturity, and low natural adult mortality. This combination of traits makes turtle
populations susceptible to declines and possibly extirpations when road mortality or other
anthropogenic causes increase adult mortality. Low recruitment rates of juveniles result in very
slow recovery from increased adult mortality (Gibbons 1987, Brooks et al. 1991, Congdon et al.
1994, Heppell 1998). Sustained levels of unusually high adult mortality have long-term
consequences in that populations may never be able to recover.
1
Reduced Regional effects regional (Population)
population size and long-term persistence
Figure 1. Road system effects on animals at various levels from individuals to populations. (Adapted from Forman et al 2003).
Direct road mortality has the potential to not only directly affect turtle populations
through sheer numbers of deaths but also may affect the population structure by
disproportionately affecting subgroups within the populations. For example, more females than
males may be killed, skewing the sex ratio; alternatively, more juveniles than adults could be
killed, skewing the age structure. Both these changes to population structure can have long-term
consequences on regional population persistence. Females may be more susceptible to road
mortality due to nesting forays which make them more likely to encounter roads (Haxton 2000,
Steen and Gibbs 2004, Aresco 2005a). Steen and Gibbs (2004) suggested that the number of
females killed on roads in high road density areas significantly altered turtle sex ratios favoring
males. Gibbs and Steen (2005) suggested that a long-term trend towards male sex bias in turtle
populations across the U.S. over the last century is most consistent with a hypothesis of
increased road mortality of females. Aresco (2005a) suggested male biased sex ratios in Florida
are caused by females being disproportionately killed on roads. These studies attempted to
address the relationship of roads to population dynamics, though they did not include empirical
road mortality data. Prior to these more recent studies, only a few studies have examined the
effects of roads on amphibians and reptiles (Boarman and Sazaki 1996, Fowle 1996a, Rudolf et
Individual effects
Local effects (Subpopulation)
Reduced local population size
Reduced landscape connectivity (increased
fragmentation)
Barrier: physical or behavioral
Road mortality
Road with traffic
2
al. 1998, Means 1999) and none have been able to document the effects of mortality on
population dynamics.
Human created barriers such as roads can fragment wildlife populations. This
fragmentation – the reduction and isolation of patches of natural habitat – is a major threat to
species conservation (Gilpin and Soule 1986, Morrison et al. 1992, Fahrig and Merriam 1994,
Harrison 1994). Barriers reduce the amount of movement on the landscape by direct mortality
and avoidance which fragments the population by creating smaller, more isolated local
populations that are at greater risk of extinction from catastrophes, demographic stochasticity,
and genetic deterioration (Morrison et al. 1992) (Figure 1).
One of the major consequences of fragmentation caused by roads is the change in
landscape connectivity among remnant habitat patches (Morrison et al. 1992, Fahrig and
Merriam 1994, Mills et al. 2003). Landscape connectivity is important for 2 main reasons. First,
many animals regularly move across the landscape to obtain their daily or life time needs.
Second, landscape connectivity allows for movements to recolonize (or repopulate) areas that
have undergone population declines or extinctions. In the case of turtles, many make regular
seasonal movements for reproduction (nesting or mate seeking), locating hibernation sites,
and/or to depart from unsuitable habitat, such as when ponds begin to dry up and repopulate
ponds when water returns (Gibbons 1990). Ultimately, reduced connectivity results in lower
regional population sizes and lower long-term persistence (Figure 1).
Movement between habitat patches creates connectivity across the landscape and is the
process that allows local populations to be interconnected into a functional demographic unit on
a regional scale (Merriam 1984). Semi-aquatic pond turtles, such as painted turtles, are
especially vulnerable to barriers to movement and fragmentation because, although these turtles
use terrestrial landscapes for nesting and seasonal movements, they have limited abilities to
move effectively across the landscape (Mitchell and Klemens 2000).
This research was designed to examine the potential effects of human-caused
fragmentation on a population of western painted turtles (Chrysemys picta bellii) in northwest
Montana. Although this pothole region has a high level of natural fragmentation, fragmentation
due to anthropogenic factors is likely to increase given anticipated growth in development and
traffic volumes (FHWA and MDT 2000). Currently, an 18 km section of roadway in the
Ninepipe/Ronan section of the existing U.S. Highway 93 is proposed for improvements (FHWA
3

et al. 2005). The highway project may increase the width of the highway which could exacerbate
the current issue of turtle mortality along roads in this area. However, planned mitigation
measures (e.g., wildlife crossing structures/culverts) could positively affect the population in
terms of both reduced road mortality and maintaining landscape connectivity.
Objectives
The primary goal of this research was to build on existing knowledge of the painted turtle,
its demography, and patterns of movement to gain a landscape-level understanding of
connectivity and the potential effects of a highway on the population. Two main studies were
conducted, 1) a Capture-Mark-Recapture (CMR) study, and 2) a road mortality study. More
specifically, there were 5 objectives:
1. To determine the demographic rates of survival in and movements between ponds;
2. To determine the extent to which the highway acts as a barrier to movements;
3. To examine the potential affects of road mortality on the population;
4. To compare available fencing methods used in herpetofauna-highway interaction projects
and assess their effectiveness at minimizing turtle road kill as well as directing turtles to
wildlife crossing structures (Appendix A);
5. To test flashing material as a barricade on fences to keep turtles from breaching barriers
or directional fencing (Appendix B).
4

METHODS
Study Area
Study Area
The study area is located in the Mission Valley of northwestern Montana (47◦ 27' N, 114◦
04' W) at an elevation of about 940 m. Historically, the Mission Valley was Palouse prairie but
over time it has been extensively modified by agriculture and development. The study site is an
area of high-density wetlands with over 2,000 permanent and ephemeral wetlands in an area of
approximately 78 km2 (Fowle 1996b). The wetlands are primarily palustrine emergent basins
with various water regimes ranging from permanent to seasonally flooded (Cowardin et al.
1979). The permanent ponds are characterized by very little emergent vegetation although some
cattails (Typha spp.), rushes (Juncus spp.), and duckweed (Lemna spp.) occur along the edges of
some ponds. Submergent vegetation in the permanent ponds is sparse and consists mostly of
milfoil (Myriophyllum spp.). The ponds are surrounded by grasslands, some of which were
heavily grazed until 2001. Currently, the grasslands are ungrazed and dominated by western
wheatgrass (Agropyron smithii), Kentucky bluegrass (Poa pratensis), fescue (Festuca spp.) and
invasive species such as spotted knapweed (Centaures maculosa), erect cinquefoil (Potentilla
recta), whitetop (Cardaria draba), mustard (Brassica spp.), and thistle (Cirsium spp.) (Anderson
2003).
Many land ownerships cover this pothole region including federal (Waterfowl Production
Areas), Tribal (Ninepipe National Wildlife Refuge and trust lands of the Confederated Salish and
Kootenai Tribes), state (Ninepipe Wildlife Management Area), and private lands. The Montana
Department of Transportation has management responsibility for the right-of-way along
Highway 93.
Study Sites
Two different areas were used for the 2 different studies: road mortality surveys and the
Capture-Mark-Recapture (CMR) study. The road mortality survey area consisted of a 6.4 km
section of Highway 93 from Olson Road, north to Beaverhead Lane; Mollman Pass Trail Road
from Highway 93 east 2.4 km; and Duck Road from Highway 93 west 1.6 km (Figure 2).
5

0 290 580 870 1,160145Meters
Highw
ay 93
Mollman Pass
Beaverhead Lane
Duck Road
Highway 212
Eagle Pass
Olson Road
A
E
D
CBKicking Horse Reservoir
Ninepipe Reservoir
MONTANA
Missoula
Figure 2. Aerial view map of study area. Road Mortality survey area along Highway 93 is from Olson Road to Beaverhead Lane (dots indicate survey road markers). Capture-mark-recapture survey area is indicated by pond complex circles (labeled A through E).
6

The CMR study site consisted of 5 pond complexes adjacent to Highway 93 between
Highway 212 and Beaverhead Lane (Figure 2). A pond complex was identified as a 300 m
radius circle centered on a permanent pond. All wetlands that held water within the circle were
surveyed during the trapping sessions (described below). The 5 permanent ponds at the center of
the complexes are important overwintering ponds for turtles.
Field Methods
Road Mortality Surveys
Roads within the study area were walked approximately once a week from mid-May
through late August, 2003-2005. In 2002, surveys were conducted between mid-July and mid-
September. In 2003 and 2004, surveys began in mid-May and continued through mid-September
with 1 final survey the first week of October. Crews walked each side of the roadways
simultaneously and documented road-killed turtles as well as all other dead vertebrates.
Animal locations were referenced to approximately evenly spaced (160 m) numbered
reflector posts along the highway and numbered telephone poles along the secondary roads.
Although this report focuses on road morality of turtles, road mortality counts and road locations
for all vertebrate species encountered during surveys were summarized (Appendix C). Dead
turtle locations were estimated to the nearest marker or the nearest mid-way point between
markers (e.g., approximately to the nearest 45 m). All turtle mortalities were examined in an
attempt to identify marked turtles and to determine sex and age class (when possible).
All road mortality counts are considered minimum counts because there is no information
on the probability of recovery of road killed individuals. For example, some turtle carcasses may
have been removed from the highway by scavengers or thrown off the survey strip by large
vehicles. Road kills were recovered as quickly as possible to minimize the loss of uncounted
individuals.
Traffic volume on Highway 93, Mollman Pass Trail Road, and Duck Road were counted
using Montana Department of Transportation (MDT) traffic counters. Traffic volumes were
measured at various times throughout the summer.
7

Capture – Mark – Recapture Study
Capturing and Marking Turtles
Painted turtles were captured using seine nets, basking traps, and dip nets to minimize the
potential for sampling bias by sex or age class (Ream and Ream 1966, Gibbons 1990, Koper &
Brooks 1998). The following measurements were taken the first time a turtle was captured each
year: plastron length and width, straight carapace length and width, body height, and weight. On
subsequent recaptures within a year, only turtle identification, location, and sex were recorded.
Gender was determined by examining secondary sexual characteristics and age by using an
annuli aging technique for turtles about 4 - 5 years old (Graham 1979). Reliability of this
method decreases with age due to shedding of the scutes (Sexton 1959, Wilbur 1975); therefore,
turtles are grouped into stage classes (see below).
Size is more important in determining maturity in turtles than age (Ernst et al. 1994).
Seventy-nine mm was the smallest plastron length (PL) where male secondary sexual
characteristics (elongated foreclaws and elongated preanal region of the tail, [Frazer et al. 1993])
were observed. By 105 mm PL virtually all males exhibited secondary sexual characteristics.
Stage classes were broken into 2 categories: juveniles and adults. Juveniles were turtles with a
PL ≤ 104 mm (≤ approximately 4 years old) and sex is considered unknown; however, this
category does include some male turtles that exhibited secondary sexual characteristics. Sex
determination for most turtles in this size category cannot be determined; therefore sex is
considered unknown in the analysis. Males that exhibited secondary sexual characteristics made
up less than 1.8% of the turtles in this category. Adults were considered sexually mature
individuals with a PL ≥ 105 mm (greater than 4 years old). Any individual that was at least 105
mm PL and not showing signs of secondary sexual characteristics was considered female
(Mitchell 1985). Based on subsequent recaptures, all male turtles exhibited secondary sexual
characteristics by 105 mm PL.
Each turtle was individually marked by drilling the margins of the carapace (Cagle 1939)
as well as injected with a Biomark™ passive integrated transponder (PIT) tag (Buhlmann and
Tuberville 1998). Each PIT tag had a unique 10 digit alpha-numeric code that was activated by a
hand-held recorder, allowing recaptured turtles to be quickly identified with little to no error.
8

Turtles smaller than 50 mm PL (about 30 grams) did not receive a PIT tag because of their size.
Hatchlings and some juveniles were notched using nail clippers rather than drilling because some
of these shells were not yet fully calcified.
Pond Measurements
Pond depth was measured during each trapping session using a graduated pole.
Measurements were taken in the center of small, uniformly-shaped ponds. In larger, irregular
shaped ponds, 3 depth measurements were taken across the pond and averaged. Pond volume
was calculated using pond depth from measurements taken in the field and pond circumference,
determined from Geographic Information System (GIS) data layers at a high-water period (April
2001); therefore, calculated volumes represent a relative measure of volume based on the high
water mark.
Sampling Sessions
Following the Multistate Robust Design capture-recapture model (described below), there
were 7 primary periods (trapping sessions) between 2002 and 2004. In 2002, only the fall
trapping session (August 13-24) was conducted. In 2003 and 2004, there were 3 primary periods
a year: spring (May 21-June 1), summer (July 2-13) and fall (August 13-24). Primary periods
lasted 12 – 13 days during which all ponds in all complexes were sampled between 2 and 4 times
(secondary periods). In spring, ponds were generally only sampled twice because of the large
number of temporary ponds within the complexes due to spring rains and snow melt. By
summer and fall trapping sessions, virtually all temporary ponds dried up, consequently all
remaining ponds were sampled 4 times. The spring session was timed to capture turtles before
they moved out of their overwinter ponds. The fall session was timed to occur when presumably
turtles had moved back to overwinter ponds.
9

Analytical Methods
An information-theoretic approach (Burnham and Anderson 1998) was used to
simultaneously evaluate relative support of multiple models describing relationships between
survival and movement and variables of interest. A priori models were developed to address
biological questions regarding survival and movement and were implemented in Program
MARK Version 4.3 (White and Burnham 1999, Cooch and White 2002).
A Multistate Robust design module within Program MARK was used to generate point
estimates of survival (S), movement probabilities (Psi), and capture probabilities (p) and their
precision to evaluate relative support for candidate models given observed data. Program
MARK uses generalized linear models to generate maximum likelihood estimates of regression
coefficients and their associated sampling variances and covariances.
The Multistate Robust design combines a Pollock’s Robust design and Multistate designs
(Arnason 1973, Pollock 1982, Hestbeck et al. 1991, Brownie and Robson 1993, Nichols et al.
2000, Williams et al. 2002). Pollock’s Robust Design (Pollock 1982) requires sampling at 2
temporal scales. Primary periods are those between which the population is considered open
(allows births, deaths, and movements). Populations are assumed to be closed during the
secondary periods, within primary periods. The Robust Design models also allow for modeling
temporary emigration which increases the precision on the survival parameter (Kendall and
Nichols 1995, Kendall et al. 1995, Kendall et al. 1997). Apparent survival rates estimate the
product of survival and fidelity to the study area (i.e., that the individual stayed on the study
area). There are 2 situations in which an individual may be off the study site; 1) temporary
emigration and 2) permanent emigration. Emigration lowers the true survival rate but can not be
separated out from mortality; hence, apparent survival is estimated. The Robust Design (which
is able to estimate temporary emigration) allows for an apparent survival rate that is closer to the
true survival because an individual only temporarily off the study site is accounted for and
therefore not counted as a mortality.
Multistate Designs (Arnason 1973, Hestbeck et al. 1991, Brownie and Robson 1993)
require sampling at multiple locations during each sampling period and allows for movements
between locations. In this study, the locations are the 5 pond complexes (Ponds A – E; Figure 2).
The multistate models allowed examination of the amount of movement occurring between pond
10
complexes and whether the movement was affected by variables of interest such as the presence
of an intervening road.
Only 1 juvenile turtle moved between pond complexes, therefore, the analysis was
restricted to adults. All adults were considered mature; all males had developed secondary
sexual characteristics by 105 mm PL and Mitchell (1985) found all females greater than 105 mm
PL were mature.
Model Selection
Hypotheses were evaluated using model selection based on Akaike’s Information Criteria
(AIC) (Akaike 1973) specifically, AICc was used which includes a small sample-size, second-
order bias adjustment and is recommended when the number of estimated parameters is large
relative to the sample size (Burnham and Anderson 1998). Models within 2 AIC values of the
best approximating model were considered in the discussion (Burnham and Anderson 1998).
Model selection uncertainty in the parameter estimates was incorporated by model averaging.
Goodness of Fit
Goodness-of-fit (GOF) is a diagnostic procedure for testing the assumptions underlying
the models. The assumptions for this model include those for the respective closed (Seber 1982,
Pollock et al. 1990) and the open models. When there is a lack of fit or overdispersion in the
data, this reflects either a lack of independence or heterogeneity among individuals (Pollock et
al. 1990). The overdispersion factor (ĉ) was estimated from the Pearson goodness-of-fit (GOF)
chi-square statistic of the most general model and its degrees of freedom (ĉ = χ2/df) (Lebreton et
al. 1992) using MSSRVRD (Multi-stratum Survival and Robust Design; available on-line at
www.mbr-pwrc.usgs.gov/software.html). Individual covariates cannot be included in the
MSSRVRD program; therefore, ĉ was estimated using the most highly parameterized model
possible without including covariates. When overdispersion was detected (i.e., ĉ >1), the quasi-
likelihood AIC (QAIC) was used which inflates the sampling variance by multiplying those
values by ĉ (Burnham and Anderson 1998).
11

Population Level Effects
Data from both the road mortality and the CMR surveys were needed to determine the
percentage of the regional turtle population killed on the roads. Both the upper and lower
boundaries of the percentage of the population affected by road mortality were estimated to
incorporate the uncertainty in both the abundance and road mortality estimates. For the lower
boundary, the population abundance was estimated via modeling which only included adult
turtles within the pond complexes and the road mortality estimate used only adult mortalities
known to be marked from within the CMR study area (from Highway 212 to Beaverhead Lane).
This road mortality estimate is a conservative estimate because any turtle not positively
identifiable to age class or whether marked was not included. Using this conservative estimate
of road mortality allowed the lower boundary of the affect of the highway on the adult
population to be estimated.
For the upper boundary, the minimum number of all turtles (adults and juveniles), caught
each year throughout the entire study area (i.e., not only within pond complexes) was used. This
value does not take into account the probability of detection that the modeling value used above
does and, therefore, under represents the total population size. All road mortalities (adult,
juveniles, and unknown) were included in this estimation. This combination of a conservative
population estimate and all road mortalities provides the upper boundary of the effect of the
highway on the population.
In general, both of these estimates are conservative because the road mortality surveys
did not include a probability of detecting dead-on-the-road turtles. It is likely that the actual
number of road kill is higher than reported because some carcasses may have been removed
(e.g., by scavengers) or thrown off the road before being counted. Therefore, all road mortality
estimates are considered minimum values.
12
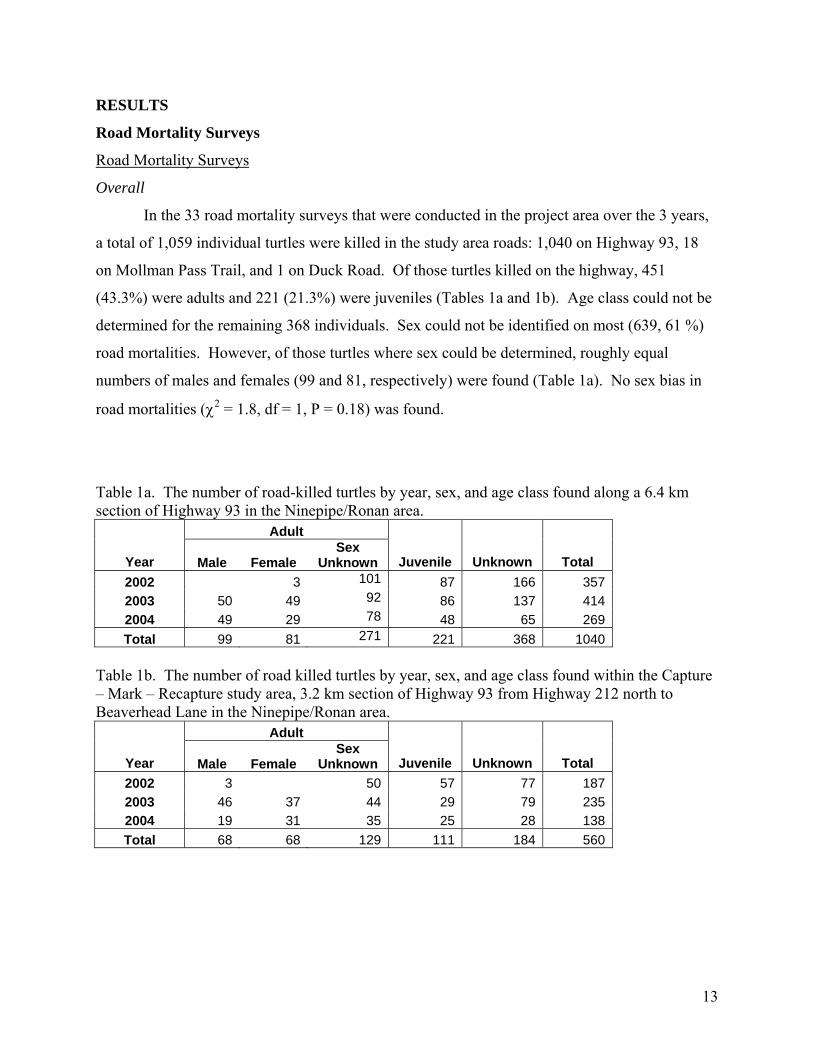
RESULTS
Road Mortality Surveys
Road Mortality Surveys
Overall
In the 33 road mortality surveys that were conducted in the project area over the 3 years,
a total of 1,059 individual turtles were killed in the study area roads: 1,040 on Highway 93, 18
on Mollman Pass Trail, and 1 on Duck Road. Of those turtles killed on the highway, 451
(43.3%) were adults and 221 (21.3%) were juveniles (Tables 1a and 1b). Age class could not be
determined for the remaining 368 individuals. Sex could not be identified on most (639, 61 %)
road mortalities. However, of those turtles where sex could be determined, roughly equal
numbers of males and females (99 and 81, respectively) were found (Table 1a). No sex bias in
road mortalities (χ2 = 1.8, df = 1, P = 0.18) was found.
Table 1a. The number of road-killed turtles by year, sex, and age class found along a 6.4 km section of Highway 93 in the Ninepipe/Ronan area.
Adult
Year Male Female Sex
Unknown Juvenile Unknown Total 2002 3 101 87 166 357 2003 50 49 92 86 137 414 2004 49 29 78 48 65 269 Total 99 81 271 221 368 1040
Table 1b. The number of road killed turtles by year, sex, and age class found within the Capture – Mark – Recapture study area, 3.2 km section of Highway 93 from Highway 212 north to Beaverhead Lane in the Ninepipe/Ronan area.
Adult
Year Male Female Sex
Unknown Juvenile Unknown Total 2002 3 50 57 77 187 2003 46 37 44 29 79 235 2004 19 31 35 25 28 138 Total 68 68 129 111 184 560
13
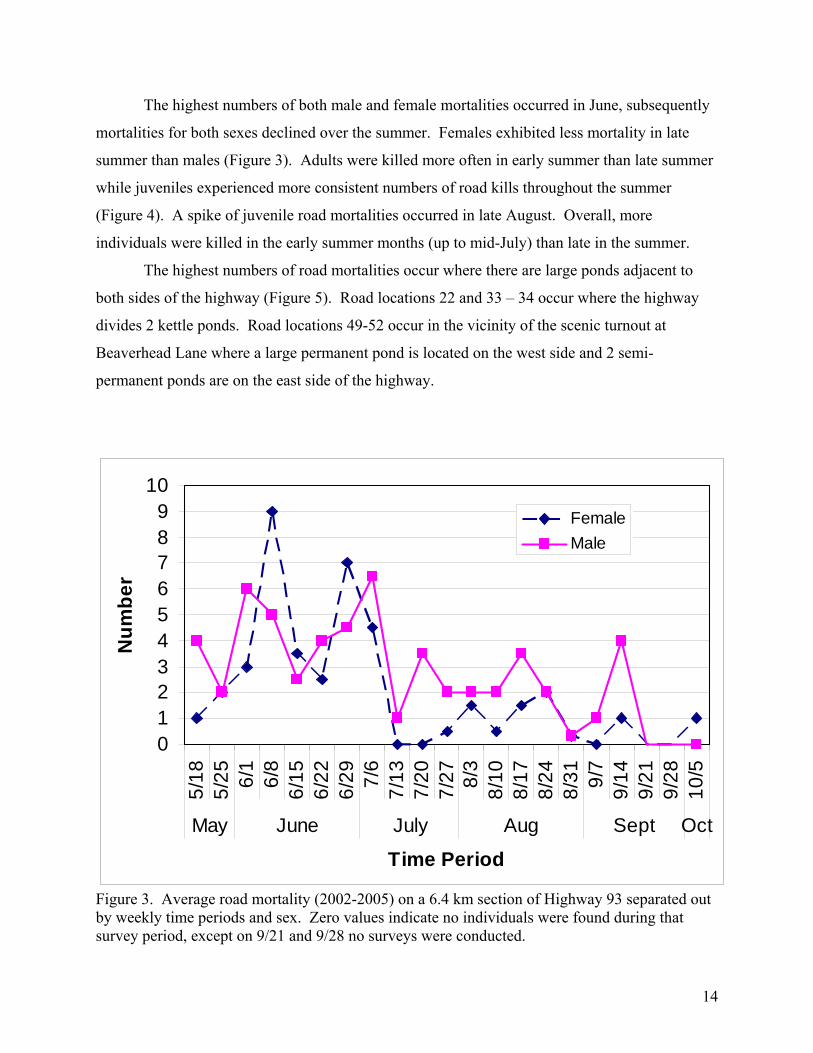
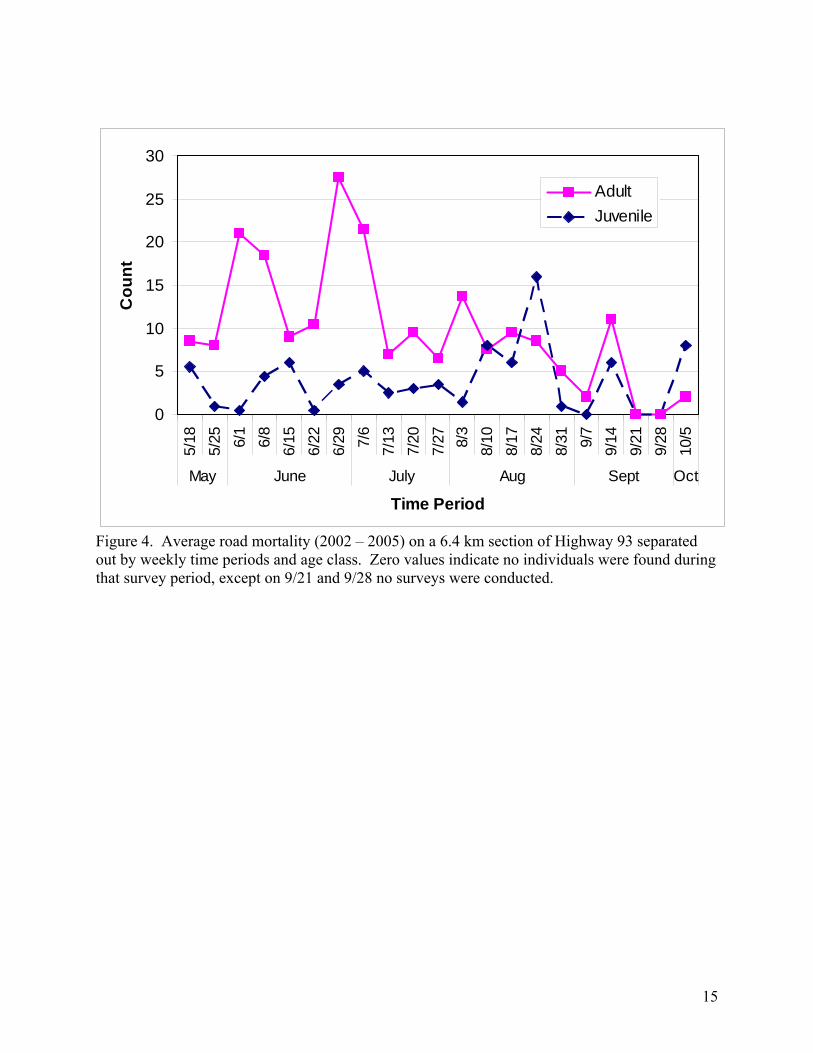
The highest numbers of both male and female mortalities occurred in June, subsequently
mortalities for both sexes declined over the summer. Females exhibited less mortality in late
summer than males (Figure 3). Adults were killed more often in early summer than late summer
while juveniles experienced more consistent numbers of road kills throughout the summer
(Figure 4). A spike of juvenile road mortalities occurred in late August. Overall, more
individuals were killed in the early summer months (up to mid-July) than late in the summer.
The highest numbers of road mortalities occur where there are large ponds adjacent to
both sides of the highway (Figure 5). Road locations 22 and 33 – 34 occur where the highway
divides 2 kettle ponds. Road locations 49-52 occur in the vicinity of the scenic turnout at
Beaverhead Lane where a large permanent pond is located on the west side and 2 semi-
permanent ponds are on the east side of the highway.
0123456789
10
5/18
5/25 6/
16/
86/
156/
226/
29 7/6
7/13
7/20
7/27 8/
38/
108/
178/
248/
31 9/7
9/14
9/21
9/28
10/5
May June July Aug Sept Oct
Time Period
Num
ber
FemaleMale
Figure 3. Average road mortality (2002-2005) on a 6.4 km section of Highway 93 separated out by weekly time periods and sex. Zero values indicate no individuals were found during that survey period, except on 9/21 and 9/28 no surveys were conducted.
14
0
5
10
15
20
25
30
5/18
5/25 6/1
6/8
6/15
6/22
6/29 7/6
7/13
7/20
7/27 8/3
8/10
8/17
8/24
8/31 9/7
9/14
9/21
9/28
10/5
May June July Aug Sept Oct
Time Period
Cou
nt
AdultJuvenile
Figure 4. Average road mortality (2002 – 2005) on a 6.4 km section of Highway 93 separated out by weekly time periods and age class. Zero values indicate no individuals were found during that survey period, except on 9/21 and 9/28 no surveys were conducted.
15

!
!
!
!
!
!
!
!
!
!
!
!
!
!
!
!
!
!
!
!
!
!
!
!
!
!
!
!
!
!
!
!
!
!
!
!
!
!
!
!
!
!
!
!
!
!
!
!
!
!
!
!
!
!
987654321
54
23
5251504948474645444342414039383736353433323130
292827
262524
222120191817
16151413
121110
53
0 400 800200
Meters
Legend! Road Markers
0 10 20 30 40 50 60
1
3
5
7
9
11
13
15
17
19
21
23
25
27
29
31
33
35
37
39
41
43
45
47
49
51
53
Beaverhead Lane Scenic Turnout
Kettle Pond # 2
Highway 212
Kettle Pond # 1
Highway 93
Olson Rd Number Road Mortality Turtles
Figure 5. On the left, road marker locations along Highway 93. On the right, the total number (2002-2004) of turtle road mortalities corresponding to mapped road markers. Road marker 1 occurs at Olson Road and Marker 54 occurs at Beaverhead Lane. The markers are approximately every 160 m.
16
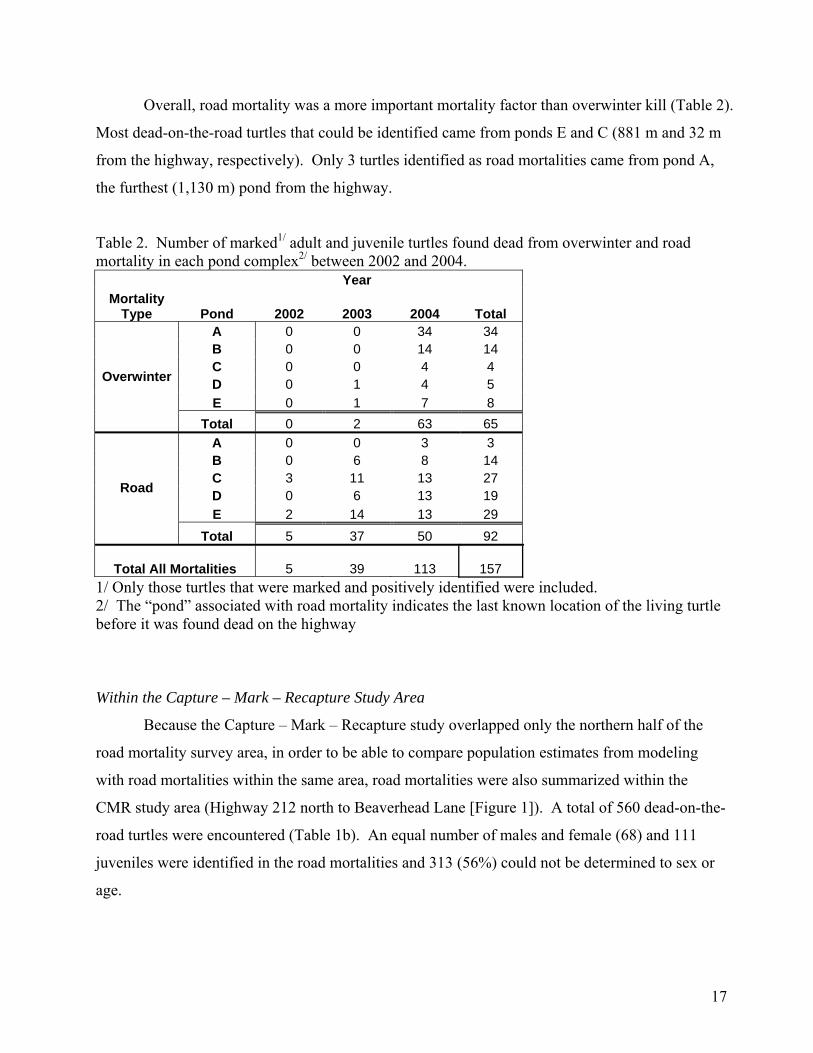
Overall, road mortality was a more important mortality factor than overwinter kill (Table 2).
Most dead-on-the-road turtles that could be identified came from ponds E and C (881 m and 32 m
from the highway, respectively). Only 3 turtles identified as road mortalities came from pond A,
the furthest (1,130 m) pond from the highway.
Table 2. Number of marked adult and juvenile turtles found dead from overwinter and road mortalit
1/
y in each pond complex2/ between 2002 and 2004. Year Mortality
Type Pond 2002 2003 2004 Total A 0 0 34 34 B 0 0 14 14 C 0 0 4 4 D 0 1 4 5 E 0 1 7 8
Overwinter
Total 0 2 63 65 A 0 0 3 3 B 0 6 8 14 C 3 11 13 27 D 0 6 13 19 E 2 14 13 29
Road
Total 5 37 50 92
Total All Mortalities 5 39 113 157 1/ Only those turtles that were marked and positively identified were included. 2/ The “pond” associated with road mortality indicates the last known location of the living turtle before it was found dead on the highway
Within the Capture – Mark – Recapture Study Area
Because the Capture – Mark – Recapture study overlapped only the northern half of the
road mortality survey area, in order to be able to compare population estimates from modeling
with road mortalities within the same area, road mortalities were also summarized within the
CMR study area (Highway 212 north to Beaverhead Lane [Figure 1]). A total of 560 dead-on-the-
road turtles were encountered (Table 1b). An equal number of males and female (68) and 111
juveniles were identified in the road mortalities and 313 (56%) could not be determined to sex or
age.
17
Traffic Volumes
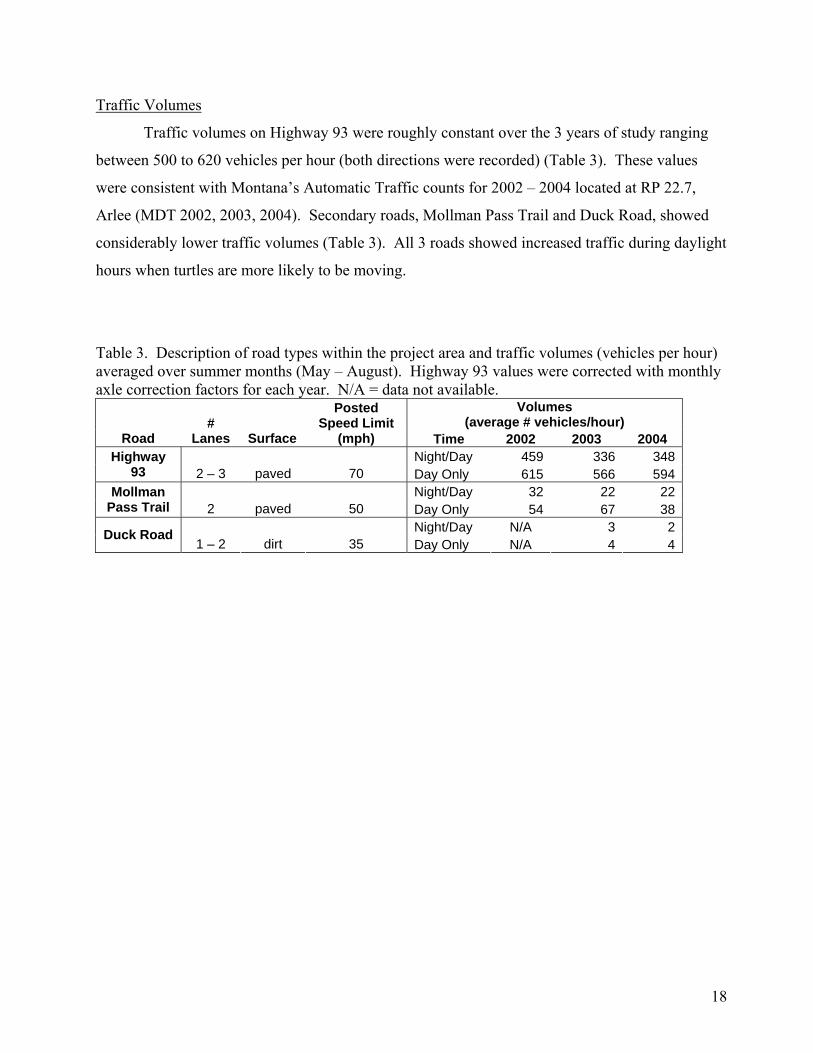
Traffic volumes on Highway 93 were roughly constant over the 3 years of study ranging
between 500 to 620 vehicles per hour (both directions were recorded) (Table 3). These values
were consistent with Montana’s Automatic Traffic counts for 2002 – 2004 located at RP 22.7,
Arlee (MDT 2002, 2003, 2004). Secondary roads, Mollman Pass Trail and Duck Road, showed
considerably lower traffic volumes (Table 3). All 3 roads showed increased traffic during daylight
hours when turtles are more likely to be moving.
Table 3. Description of road types within the project area and traffic volumes (vehicles per hour) averaged over summer months (May – August). Highway 93 values were corrected with monthly axle correction factors for each year. N/A = data not available.
Volumes (average # vehicles/hour)
Road #
Lanes Surface
Posted Speed Limit
(mph) Time 2002 2003 2004 Night/Day 459 336 348Highway
93 2 – 3 paved 70 Day Only 615 566 594Night/Day 32 22 22Mollman
Pass Trail 2 paved 50 Day Only 54 67 38Night/Day N/A 3 2Duck Road
1 – 2 dirt 35 Day Only N/A 4 4
18
Capture – Mark – Recapture (CMR) Study
Descriptive Demographics
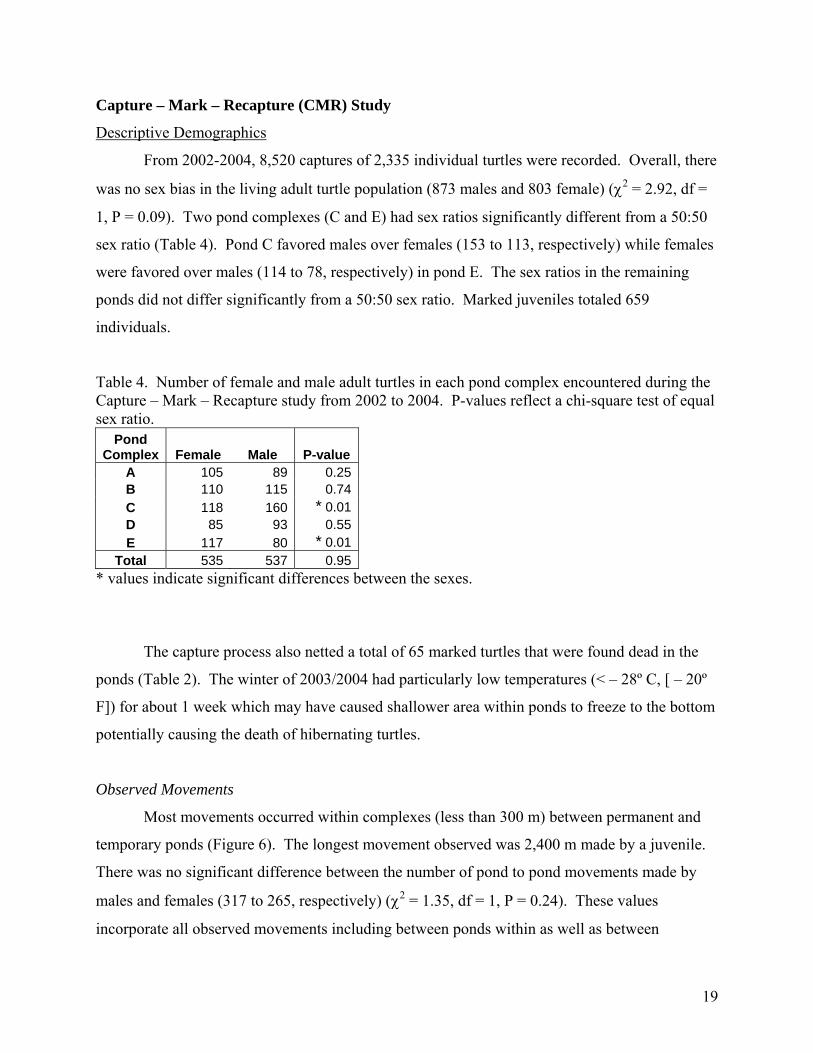
From 2002-2004, 8,520 captures of 2,335 individual turtles were recorded. Overall, there
was no sex bias in the living adult turtle population (873 males and 803 female) (χ2 = 2.92, df =
1, P = 0.09). Two pond complexes (C and E) had sex ratios significantly different from a 50:50
sex ratio (Table 4). Pond C favored males over females (153 to 113, respectively) while females
were favored over males (114 to 78, respectively) in pond E. The sex ratios in the remaining
ponds did not differ significantly from a 50:50 sex ratio. Marked juveniles totaled 659
individuals.
Table 4. Number of female and male adult turtles in each pond complex encountered during the Capture – Mark – Recapture study from 2002 to 2004. P-values reflect a chi-square test of equal sex ratio.
Pond Complex Female Male P-value
A 105 89 0.25B 110 115 0.74C 118 160 * 0.01D 85 93 0.55E 117 80 * 0.01
Total 535 537 0.95* values indicate significant differences between the sexes.
The capture process also netted a total of 65 marked turtles that were found dead in the
ponds (Table 2). The winter of 2003/2004 had particularly low temperatures (< – 28º C, [ – 20º
F]) for about 1 week which may have caused shallower area within ponds to freeze to the bottom
potentially causing the death of hibernating turtles.
Observed Movements
Most movements occurred within complexes (less than 300 m) between permanent and
temporary ponds (Figure 6). The longest movement observed was 2,400 m made by a juvenile.
There was no significant difference between the number of pond to pond movements made by
males and females (317 to 265, respectively) (χ2 = 1.35, df = 1, P = 0.24). These values
incorporate all observed movements including between ponds within as well as between
19
complexes and some individuals moved more than once. With CMR techniques, an individual
would have to be captured in 2 different ponds for movement to be observed, therefore, female
nesting forays (leaving to nest on land and returning to the same pond) cannot be assessed using
these movement data.
0
10
20
30
40
50
60
1
100
200
300
400
500
600
700
800
900
1000
1100
1200
1300
1400
1500
1600
1800
2400Distance (m)
Num
ber
Female
Male
Juvenile
Figure 6. The number of adult and juvenile turtles that moved separated out by sex and distance (m) categories. Some individuals moved more than once. Approximately 95 % of the marked turtles remained in their original pond with no recorded movements.
20

Fine-Scale Movement and the Highway (Ponds B and C)
Movements and road mortality data between pond complexes B and C (the 2 kettle ponds
split by the highway) were investigated to examine fine-scale movements. Turtles made 106
movements away from pond B without crossing the highway. In pond C, 78 turtles moved away
from the pond without crossing the highway. Forty adult individuals from these ponds
successfully crossed the highway. However, 150 road mortalities were recorded between the
complexes (between road markers 30 – 36), of which 69 were known to be adult and of these 36
(52%) were known to be marked. Therefore, about half (47%) of the turtles that attempted to
cross the road were killed (40 crossed successfully while 36 known marked were killed). This
percentage of successful crossings (53%) is a high estimate because it could not be determined if
some dead-on-the-road turtles were marked (19 were unknown).
Modeling
Only adult turtles captured within pond complexes were included in the CMR modeling
analyses. A total of 1,032 individuals were used with 4,652 recaptures. The most parameterized
model was
S(Pond * Season) Psi(Distance Category * Season + Temporary Emigration) p(Pond * Session).
Where S = survival probability is a function of the interaction between pond and season; Psi =
movement probability is a function of an interaction between distance category and season and
temporary emigration; and p = capture probability is a function of the interaction between pond
and trapping session. This model was used to test goodness of fit. The variance inflation factor
was estimated as ĉ = 2.61 (χ2 = 1174.9, df with pooling = 450). The most parsimonious model
was
S(Pond + Season + Drought) Psi(Distance + Volume + Season + Temporary Emigration) p(Pond * Session).
Where S = survival probability was a function of pond and season and drought in 2004; Psi =
movement probability was a function of distance between ponds, volume, season, and temporary
emigration; and p = capture probability was a function of the interaction between pond and
trapping session. A sequential modeling process in which parsimonious models for capture
probabilities were sought first and then the resulting parameterizations were used as the basis for
developing models of survival and movement probabilities separately.
21

22
Probability of Movement
Within the candidate set of models, 6 models with alternative movement variables were
within 2 QAICc of the best approximating model (Table 5). The best models were a function of
distance between ponds, season (winter, early summer, late summer), occurrence of temporary
emigration, presence of an intervening road, and/or sex. The use of QAICc weights to assess
model support indicates that these 6 best-fit models have 95% of the support of the data.
Consequently, inferences were based on these 6 models and model averaging was used to
calculate weighted estimates and standard errors that reflect model uncertainty for all parameters
(Burnham and Anderson 1998). Overall, the probability of movement between pond complexes
was very low ranging from a high of approximately 0.026 (SE = 0.001) a year for the 2 closest
ponds (B and C) to less than 0.01 for all remaining pond complexes (Figure 7). Three of the 6
best-fitting models included the presence of an intervening road and/or sex as factors influencing
movement probabilities and were supported by the data (Table 5). The effect size of an
intervening road was fairly large and negative (β = – 0.82, SE = 0.87) but the 95% confidence
intervals included 0 (95 % CI = – 1.8 to 0.27). Females had a slightly higher movement
probability than males (β = 0.31; SE = 0.29) but also had a 95% confidence interval that included
0 (95 % CI = – 0.27 to 0.90). Although the inclusion of these variables in the model was
supported by data, both had confidence intervals that overlap 0 so there is a lack of information
to definitely determine the degree of the relationship with movement. Models that included
temporary emigration were more supported than the model without temporary emigration
(∆QAICc = 20.7) (Table 5). Temporary emigration rates were high in winter/early spring and
early summer (0.07 -0.09, SE = 0.03) compared to movement rates between pond complexes
(Figure 7).
23
Table 5. Mark-recapture models of adult painted turtles used to estimate movement probabilities between pond complexes. Factors affecting probability of survival and capture were held constant. Models ranked from best (lowest delta QAICc value) to worst. Shaded models were used for model averaging movement estimates.
Models
Survival (S) Movement (Psi) Capture (p) QAICc Delta
QAICc QAICc
Weights K Q
Deviance Distance + Volume + Season + Temporary Emigration 6115.91 0 0.2677 50 6016.84Distance + Season + Temporary Emigration 6116.67 0.764 0.1827 49 6019.65Distance + Volume + Season + Temporary Emigration + Sex 6116.84 0.932 0.1680 51 6015.73Distance + Volume + Season + Temporary Emigration + Road 6117.10 1.19 0.1480 51 6015.99Distance + Volume + Season + Temporary Emigration + Road + Sex 6117.98 2.07 0.0950 52 6014.83
Pond + Season + Drought
Distance Categories + Season + Temporary Emigration
Pond * Session
6118.22 2.31 0.0842 49 6021.20Distance + Season + Temporary Emigration Categories + Road 6119.09 3.18 0.0545 51 6017.98Distance + Season + No Temporary Emigration 6136.59 20.69 0.00001 48 6041.61
Pond + Season + Drought
Constant
Pond * Session
6141.11 25.20 0 45 6052.25K = Number of parameters Distance = Actual distance between ponds used as a covariate Distance Categories = Long (>1000 m), Medium (80 - 1000 m), and Short (< 80 m). Temporary Emigration = Temporary movements out of the pond complexes and, therefore, off the study-site. Temporary Emigration Categories = Temporary movements out of the pond complexes grouped into 2 categories dependent on pond densities outside complex. Drought = Drought conditions in 2004. Pond*Session = Interaction term between pond and trapping session.

0.00
0.02
0.04
0.06
0.08
0.10
0.12
0.14
Winter/EarlySpring
Early Summer Late Summer
Season
Prob
abili
ty o
f Mov
emen
t Long Distancebtwn Complexes
Short Distancebtwn Complexes
Temp.Emigration - ToOff-Complex
Figure 7. Movement estimates for adult turtles by season for various types of movements. Bars represent standard errors.
Probability of Survival
To assess variation in survival probabilities within pond complexes, factors affecting
probability of movement and capture were held constant. Within the candidate set of models, 2
models with alternative survival variables were within 2 QAICc of the best approximating model
(Table 6). These best approximating models indicated that pond, season, and time (either
drought or time over the study) were important factors affecting the probability of survival
(Table 6). Survival was not influenced by distance to road (∆QAICc = 16.0) or by specific pond
(∆QAICc = 99.7). Season consists of the intervals between trapping sessions: “winter” is 9
months from September to May; “early summer” is 1.5 months from about late May to July; and
“late summer” is 1.9 months from about mid-July to late August. Weighted average apparent
seasonal survival rates ranged from a high of 0.998 (SE = 0.003) in ponds B and C which
retained water during the drought to a low of 0.475 (SE = 0.70) in pond E which virtually dried
up (Table 7). Survival rates in all pond complexes were higher overwinter than during summer
24

25
seasons and 2003 rates were higher than 2004 rates for all seasons (Table 7 and Figure 8). Ponds
that retained water over the course of the study (B and C) had higher survival rates than ponds
that did not (A, D, and E).
Apparent annual survival rates were higher in 2003 then in 2004 in all pond complexes
(Table 7). Apparent annual survival rates ranged from a high of 0.86 in pond C in 2003 to a low
of 0.131 in 2004 in pond E (Table 7).
26
Table 6. Mark-recapture models of adult painted turtles used to estimate survival probabilities within pond complexes. Factors affecting probability of movement and capture held constant. Models ranked from best (lowest delta QAICc value) to worst. Shaded models were used for model averaging survival estimates. See Table 5 for more detailed description of variables.
Models
Survival (S) Movement (Psi) Capture (p) QAICc Delta
QAICcQAICc
Weights K Q
Deviance Pond + Season + Drought 6116.7 0 0.6839 49 6019.65
Pond + Time
Distance between Ponds + Volume + Season + Temporary Emigration .
Pond*Session 6118.2 1.57 0.3120 51 6017.13
Pond + Season + Drought + Sex 6127.0 10.33 0.0039 50 6032.03Distance to Highway + Season + Drought 6132.6 15.97 0.0002 46 6041.75Pond 6216.3 99.65 0 46 6125.42Volume 6219.8 103.16 0 43 6135.05Distance to Highway 6220.3 103.60 0 43 6135.49Constant
Distance between Ponds + Volume + Season + Temporary Emigration
Pond*Session
6234.2 117.51 0 42 6151.43

Table 7. Estimates of adult turtle apparent survival probabilities by season and annually for each pond complex.
2003 2004 Pond
Complex Season1/Seasonal Survival SE
Annual Survival SE
Seasonal Survival SE
Annual Survival SE
Winter 0.989 0.03 0.823 0.09 Early Summer 0.893 0.08 0.841 0.10 A Late Summer 0.892 0.05
0.788 0.060.778 0.10
0.539 0.34
Winter 0.998 0.00 0.981 0.03 Early Summer 0.911 0.04 0.874 0.06 B Late Summer 0.930 0.07
0.845 0.200.788 0.06
0.676 0.16
Winter 0.998 0.00 0.993 0.01 Early Summer 0.934 0.04 0.907 0.06 C Late Summer 0.927 0.04
0.864 0.240.809 0.04
0.728 0.12
Winter 0.963 0.04 0.814 0.08 Early Summer 0.703 0.05 0.661 0.05 D Late Summer 0.855 0.05
0.579 0.110.592 0.06
0.309 0.07
Winter 0.835 0.08 0.503 0.09 Early Summer 0.584 0.06 0.547 0.07 E Late Summer 0.673 0.06
0.377 0.130.475 0.07
0.131 0.05
1/ Winter (9 months) is September through May; Early summer (1.5 months) is June through mid-July; and Late Summer (1.5 months) is mid-July through August.
0.40
0.50
0.60
0.70
0.80
0.90
1.00
winter earlysummer
latesummer
winter earlysummer
latesummer
2003 2004
Season
Prob
abili
ty o
f Sur
viva
l
ABCDE
Figure 8. Estimates of adult turtles apparent survival rates by pond over the course of the study. Bars represent standard errors.
27

Probability of Capture
Capture probability was a function of pond and trapping session but not sex.
Animal behavior (i.e., trap happy or trap shy individuals) did not affect capture probability
(K. Griffin, unpublished data). Capture probability ranged widely within and between
ponds, with a low of 0.009 (SE = 0.009) when pond A was drying to a high of 0.771 (SE =
0.073) in pond D (Figure 9).
0.00
0.10
0.20
0.30
0.40
0.50
0.60
0.70
0.80
Fall Spring Summer Fall Spring Summer Fall
2002 2003 2004
Sessions
Prob
abili
ty o
f Cap
ture
ABCDE
Figure 9. Probability of capture (p) for adult turtles within the pond complexes for each trapping session from 2002 - 2004. Bars represent standard errors.
Abundance Estimates
The Multistate Robust Design model allows for the derived estimation of
abundance. Abundances within pond complexes varied over the seasons of the study.
The 2 deepest ponds (B and C) had the most consistent abundance values (Figure 10).
Abundances in ponds A, D, and E changed dramatically over the study (from highs in the
high 100’s to the low 200’s to dropping to less than 9 in pond E). Depth in all ponds
28
decreased over the study but these 3 ponds were particularly affected by the drought
because they were originally not deep ponds. Pond A decreased from 1.4 m to 0.03 m,
Pond D decreased from 1.7 m to 0.7 m, and Pond E went from 0.9 m to 0.1 m. Virtually
all adult turtles left these ponds by the end of the study.
The regional adult population abundance also declined over the course of the study
(Figure 11). The population peaked in spring 2003 at 854 (SE = 117) individuals and fell
to 372 (SE = 67) in fall 2004.
0
50
100
150
200
250
300
Fall
Spr
ing
Sum
mer
Fall
Spr
ing
Sum
mer
Fall
2002 2003 2004
Season
Abu
ndan
ce (N
)
ABCDE
Figure 10. Adult turtle abundance estimates for pond complexes over the seasons. Bars represent standard errors.
29

300
400
500
600
700
800
900
1000
Fall Spring Summer Fall Spring Summer Fall
2002 2003 2004
Seasons
Tota
l Abu
ndan
ce
(All
Com
plex
es)
Figure 11. Total adult turtle abundance estimates for all pond complexes combined for each season. Bars represent standard errors.
Population Level Mortality
Both ways of estimating the percentage of the population killed by the highway
are considered conservative because road mortality counts are considered a minimum
count due to the possibility of not locating all mortalities. The percentage of the
population killed on the highway ranged from a lower estimate of 6.0 % in 2003 (7.9 %
in 2004) to a less conservative estimate of 16.9 % in 2003 (13.0 % in 2004).
30

DISCUSSION
The main ways that a highway may affect turtle populations are by 1) affecting the
survival rate through direct road mortality; 2) changing the population structure through
disproportionate road mortality of either sex causing biased sex ratios; and 3) changing
movement rates or patterns which ultimately affects population connectivity. The first
potential affect, direct road mortality, can have immediate consequences on population
viability, while the second 2 potential effects, changing population structure and level of
connectivity, may have long-term consequences on population viability.
Survival
This is the first study to allow for survival estimates of painted turtles partitioned
seasonally. Modeling showed the most important factor in probability of surviving was
the individual pond complex in combination with time (either season or time over the
course of study). The model with the most weight (0.68) indicates that season and
drought were the most important factors affecting survival rates. Drought conditions
appear to have had a strong influence on survival; this study was conducted during a
period when the Mission Valley experienced lower than average rain and snowfall in 7
out of the previous 10 years.
‘Distance to road’ was expected to be an important predictor of survival rate,
however this variable was not supported by the data largely due to the fact that ponds far
from the highway were still affected by road mortality. Hydrology of the ponds was
more important than distance to the highway. Interestingly, pond E, the second furthest
(881 m) pond from the highway and greatly affected by the drought, had the highest
number of turtles encountered dead-on-the-road. Once the pond began to dry, road
mortality data indicate that many turtles attempted to move to the large pond on the west
side of the highway at Beaverhead Lane (across from the scenic turnout). This pond is
hydrologically connected to Crow Creek and retained water during the drought.
Adult turtles are expected to have high survival rates. Turtles that reach adult size
have few predators and, typically, there is little risk of death during winter when turtles
hibernate. Apparent annual survival rates in this study range from 0.86 to 0.13. Other
studies on painted turtles have estimated annual survival rates between 0.76 and 0.96
31

(Wilbur 1975, Tinkle et al. 1981, Mitchell 1988). High survival rates are expected in
species that have low recruitment rates and hatchling survival (Brooks et al. 1991,
Heppell 1998). Annual survival rates are lower 2004 than in 2003. Apparent survival
rates are affected by both road mortality and permanent emigration as turtles left ponds
for refugia habitats off the study site. The 2 ponds that retained water (ponds B and C)
experienced higher survival rates than the other ponds. It is likely these ponds
experienced less permanent emigration than ponds that lost significant water. Therefore,
these survival rates are less confounded with permanent emigration. This is also
indicated by the fact that the percentage of the population killed on the road matches the
survival rates in these ponds, particularly in 2003 when the area was less affected by the
drought (about 0.17 to 0.15, respectively).
Ponds that lost significant water over the course of the study had extremely low
survival rates. For example, survival rates in ponds D and E drop from 0.60 to 0.31 and
0.38 to 0.13, respectively. These survival estimates are confounded with permanent
emigration. As these ponds began to lose water, turtles moved off the study site in search
of suitable habitat. It is not possible to determine if the turtles survived off the site or
died. Many turtles that were last seen alive in these ponds were encountered dead on the
highway. The fact that the turtles are moving makes them more susceptible to road
mortality. In the area of the split kettle ponds, roughly only half the turtles that attempted
to cross the highway succeeded.
Seasonal survival rates varied widely. As expected, winter survival rates were
higher than summer survival rates. However, winter survival was higher in winter 2002-
2003 then in 2003-2004, likely due to a combination of drought lowering water levels
and severe winter temperatures. Dead turtles were recovered in all ponds in early spring
2004. These carcasses were completely intact; therefore, mortality was not due to
predation. Hibernating turtles may have gotten caught in shallow areas of ponds that
froze to the bottom killing the turtles, thus decreasing winter survival rates in 2004.
Road mortality is expected to reduce summer survival rates. The probability of
survival dropped in both the early summer and late summer seasons when turtles were
expected to move. The drop in survival rates corresponds to when known turtle road
mortalities occurred. In 2003, when the landscape was less affected by the drought, in
32

general survival rates decreased in early summer and increased again in late summer.
This corresponds to the road mortality and the movement data, both of which were
highest in the same early summer period.
Population Structure
Overall, the population structure does not appear to be affected by the highway.
The living turtle sex ratio was not significantly different than 50:50 males to females.
Recent studies have stated that there is disproportionate road mortality of females due to
higher chances of encountering roads during nesting forays (Steen and Gibbs 2004,
Aresco 2005a, Gibbs and Steen 2005). Females were only slightly more likely to make
long distance (between pond complex) movements than males, according to the CMR
modeling. Examining all movement data (i.e., not only between complexes), no
difference in pond to pond movement between the males and females was found.
However, this may be misleading because if a female turtle made a nesting foray and
returned to the same pond this type of movement would not be detected. Males are not
expected to make similar types of there-and-back-again movements for breeding because
breeding takes place in the ponds. Therefore, female movements may be
underrepresented in the data.
There does not appear to be disproportionate road mortality on females as no sex
bias in road mortalities was found. Although most road mortalities could not be
identified to sex due to degradation, there is no reason to expect a bias in sex ratio of
identifiable and unidentifiable turtles.
Although the overall population sex ratio does not appear to be altered, Pond C,
which is adjacent to the highway, did have a significantly male biased sex ratio. It is
interesting to note that pond B directly across the highway from pond C did not. Road
mortality may be affecting the sex ratio of this particular pond (C). Pond C may be an
important pond for reproduction as it had the highest number of hatchling and juveniles
caught each year. If more females in pond C than in other ponds were conducting nesting
forays and encountering the road, then road mortality could be affecting this local
population. However, road mortality data indicates more males than females were
33

encountered dead on the road between ponds B and C. This may indicate factors other
than disproportionate road mortality of females may be affecting the sex ratio of this
pond.
Movements
Very little movement (between 1 % and 2 %) a year occurs between pond
complexes; therefore, what movement does occur is important in providing connectivity
to the local populations in each pond complex. Modeling indicates there is a
considerable amount (7-10%) of temporary movement out of the complexes. The
complexes were designed as an attempt to incorporate typical daily and seasonal
movements of turtles out to temporary ponds in which they may find suitable habitat
especially in the spring when temporary ponds warm up faster than the deeper permanent
ponds and, therefore, may have more available food resources. The 300 m radius of the
complexes was used based on values in the literature as to the distance of typical
movements. The fact that there was a considerable amount of temporary emigration
outside of the complexes indicates that painted turtles may regularly use larger areas on a
seasonal basis than previously thought.
Over the course of the study, the drought caused all permanent ponds to lose
water and there were also considerably fewer temporary ponds on the landscape. It
appears many turtles moved off the study site and did not return (i.e., permanent
emigration) in order to find favorable habitats. The study area has 2 permanent reservoirs
(Kicking Horse and Ninepipe) and Crow Creek between approximately 1.5 km and 2.0
km from the closest pond complexes. As the complex ponds became unsuitable, turtles
may have moved to these more permanent water bodies, thus lowering the apparent
survival rate within the complexes in year 2004. This suggests that turtles are moving
outside the complexes but not to other studied complexes. This indicates that other large
permanent bodies of water such as Crow Creek and Kicking Horse and Ninepipe
reservoirs are important refugia habitats when the smaller permanent ponds become
affected by drought.
34
Movements appear to be hindered by the presence of the highway. The model
most supported by the data showed that roads decreased turtle movement rates.
Individuals were less likely to move long distances in the presence of an intervening
road. As expected, turtles were more likely to move short rather than long distances in
the presence of an intervening road. Unfortunately, a situation with 2 permanent ponds
relatively close together (30 m) without an intervening road was not available in the
vicinity of the study area. This would have allowed examination of short distance
movement rates with and without an intervening road. Though the modeling indicates
roads decrease turtle movements, it is not possible to determine if turtles are avoiding the
highway or if they are simply unsuccessful at crossing the road. Road mortality data can
help examine these possibilities.
Focusing at a fine-scale, where 2 ponds are separated by the highway (ponds B
and C), CMR data indicate that more movements were made away from the highway
from ponds B and C (106 and 78, respectively) than across it (40). However, the fact that
there were 150 road mortalities on the highway that falls within these pond complexes
suggests that turtles were not avoiding the highway but rather killed attempting to cross
it.
Population Dynamics and Connectivity
Highway 93 in the Ninepipe/Ronan area appears to be affecting the turtle
population both through direct mortality and reduced landscape connectivity.
Conservative estimates of the percentage of the population killed by the highway range
from 6.0 % to 17.0 %. Turtles are long-lived, slow growing animals with delayed sexual
maturity and low juvenile survival rates. This combination of life history traits is poorly
adapted to high rates of adult mortality (Gibbons et al. 1990, Heppell 1998). Such
species often can not replace adult losses quickly and are susceptible to local extinctions
(Brooks et al. 1991). Population effects of road mortalities may be exacerbated for
wetland species such as turtles when periodic drying results in increased migrations and
thus an increased probability of encountering a road (Gibbons et al. 1983, Aresco 2005a).
Drought conditions coupled with severe winters can have an even greater affect, lowering
survival rates even further because hibernating turtles are at increased risk of freezing in
35

shallow waters. Lowered survival rates for even a short period can cause severe
population declines that take years to recover (Fonnesbeck and Dodd 2003). The level of
observed mortality during this study would not be sustainable if this were a closed
population. Due to the amount of both temporary and permanent emigration it is evident
that the regional population likely includes Crow Creek, Kicking Horse Reservoir, and
Ninepipe Reservoir. Given this, maintaining connectivity across this landscape is
extremely important for this species.
Currently, the highway appears to be a semi-permeable barrier to movements,
reducing landscape connectivity for turtles. Although some turtles successfully crossed
the highway, road mortality data indicate that most did not; e.g., 40 successful crossings
observed in an area where 150 mortalities were recorded. It is important to maintain
connectivity for long-term population viability and to maintain the possibility of
recolonization of ponds that may lose their local populations such as occurred in ponds
A, D, and E during these drought conditions. This study conducted during drought
conditions shows the importance of maintaining connectivity to suitable refugia habitat
such as Ninepipe and Kicking Horse reservoirs so that recolonization is possible when
conditions permit.
36

RECOMMENDATIONS
Three areas of high priority based on road mortality data were found: the 2 kettle
ponds at road locations 22 and 33 (1 just south, the other just north of Highway 212
junction) and the area immediately south of the scenic turnout at Beaverhead Lane. This
last area has a permanent pond on the west side and 2 semi-permanent ponds on the east
side of the road. All 3 of these areas also appear to have important nesting areas on and
adjacent to the road banks.
Culverts and fencing systems have been shown to be effective in reducing turtle
road mortality (Dodd et al. 2004, Aresco 2005b). In Florida, turtle mortality declined
dramatically with the construction of the barrier wall-culvert system; from 374
mortalities preconstruction to 7 post-construction (Dodd et al. 2004). Turtles used 2.7 m
x 2.7 m, inundated, partially submerged box culverts; 0.9 m cylindrical culverts when wet
with earthen substrates; and 1.8 m x 1.8 m dry box culverts. All of these culverts were 44
m in length and the smaller ones (the 1.8 m x 1.8 m box culvert and the 0.9 m diameter
cylindrical culverts) had light boxes. If light boxes are not used, we recommend over-
sizing the culverts to allow light to be seen through the culvert. Painted turtles do not
burrow and may show reluctance to enter dark areas.
The Supplemental Draft Environmental Impact Statement (FHWA et al. 2005) for
the Ninepipe/Ronan area is considered a “30 % design” document. This means that many
construction details have yet to be determined. As more design considerations become
known more detailed and area specific recommendations can be provided. Current
recommendations for reducing the effects of Highway 93 on turtle populations in the
Ninepipe/Ronan area of the Mission Valley are below. Note: all recommended culverts
would also be beneficial to other wildlife in the area.
1. Construct bridges or over-sized cement box or over-sized metal culverts in the
high priority areas that naturally would be water crossings. In particular, these
should be placed in the 2 kettle ponds.
2. Construct over-sized cement box culverts in dry crossing areas such as near the
scenic turn-out at Beaverhead Lane and just north of Olson Road. Dry land
culverts should be flat bottom with an earthen substrate to facilitate turtle
terrestrial movements through them.
37

3. Construction time frame. Movements are highest from mid-May to mid-July.
Minimizing construction in the 3 high priority areas during these months would
minimize disturbance and mortality.
4. Monitor construction in the kettle ponds due to their importance in overwinter,
reproduction, and refugia habitat. The kettle ponds are likely to have detours that
could possibly hinder turtle movements as they attempt to avoid construction
activities. Providing safe passage under the detours will be important. The
placement and timing of the detour is important in minimizing the effects of
construction activities on the turtles (see Recommendation #3). As design
considerations become known for the area, other recommendations may be
warranted such as having on-site inspectors to monitor turtle movements during
construction. Monitoring of construction projects has been accomplished on other
projects in coordination with the Confederated Salish Kootenai Tribes and
contractors (Pers. Comm. Pat Bastings, MDT - Environmental).
5. Install wing or directional fencing to funnel turtles to the culverts (see Appendices
A and B). The fencing would be necessary only in the vicinity of the crossing
structures and nesting areas. Install low fencing that can not be breached
regardless of whether bridges or culverts are implemented because of the nesting
that occurs on and adjacent to the road bank in the high priority areas. Even
though passages are provided, females may still be drawn to the road edge to nest
and consequently be at risk of road mortality and risking human safety.
6. Install ‘Turtle Crossing’ warning signs to increase awareness of motorists. More
general “Wildlife Crossing” signs may not be sufficient to warn motorists to the
presence of turtles because most motorists expect large game animals when they
see “Wildlife Crossing” signs. Standard warning signs do not appear to affect
motorists therefore; signs should be enhanced, and location and time specific.
These types of modifications to standard signage have been useful in modifying
human behavior (Messmer et al. 2000, Sullivan and Messmer 2003, Al-Ghamdi
and AlGadhi 2004, Hardy et al. in press). Signs could be enhanced by using a
larger size, reflective color (i.e. neon yellow/green), or additional flagging. Signs
should only be visible from June – September when turtles are likely to be
38

encountered on the road. Sign location should be limited to the Ninepipe/Ronan
area of Highway 93. A north bound sign could be placed near Gunlock Road and
a south bound sign could be placed near Beaverhead Lane. Limiting the time
frame and location may also minimize motorists’ habituation to the signs.
7. Post-construction study. It will be possible to identify turtles marked in this study
for many years. A post-construction study will provide valuable data on turtle use
and efficacy of the wildlife crossing structures in providing landscape
connectivity. Currently only 2 studies (Dodd et al. 2004, Aresco 2005b) exist that
includes pre- and post-construction effects on connectivity and these do not
include pre-construction population data population data as this study does. This
study combined with a post-construction study provides a unique opportunity to
determine the long-term effects of the highway on connectivity and population
dynamics.
39
LITERATURE CITED
Akaike, H. 1973. Information theory as an extension of the maximum likelihood principle. Pages 267-281 in Second International Symposium on Information Theory. Akademiai Kiado, Budapest.
Al-Ghamdi, A.S. and S.A. AlGadhi. 2004. Warning signs as countermeasures to camel-vehicle collisions in Saudi Arabia. Accident Analysis and Prevention 36: 749-760.
Anderson, J. L. 2003. Using successional theory to guide restoration of invasive plant dominated rangeland. Master of Science in Land Rehabilitation, Montana State University, Bozeman, Montana.
Aresco, M. J. 2005a. The effects of sex-specific terrestrial movements and roads on the sex ratio of freshwater turtles. Biological Conservation 123:37-44.
_____. 2005b. Mitigation measures to reduce highway mortality of turtles and other herpetofauna at a north Florida lake. Journal of Wildlife Management 69:549-560.
Arnason, A. N. 1973. The estimation of population size, migration rates and survival in a stratified population. Researches on Population Ecology 15:1-8.
Boarman, W. I., and M. Sazaki. 1996. Highway mortality in desert tortoises and small vertebrates: success of barrier fences and culverts. in ICOWET, Trends in addressing transportation related wildlife mortality: Proceedings of the transportation related wildlife mortality seminar. Tallahassee Florida.
Brooks, R. J., G. P. Brown, and D. A. Galbraith. 1991. Effects of a sudden increase in natural mortality of adults on a population of the common snapping turtle (Chelydra serpentina). Canadian J. Zoology 69:1314-1320.
Brownie, C., and D. S. Robson. 1993. Estimation of time-specific survival rates from tag-resighting samples: a generalization of the Jolly-Seber model. Biometrics 39:437-435.
Buhlmann, K. A., and T. D. Tuberville. 1998. Use of passive integrated transponder (PIT) tags for marking small freshwater turtles. Chelonian Conservation and Biology 3:102-104.
Burnham, K. P., and D. R. Anderson. 1998. Model selection and inference: a practical information-theoretic Approach. Springer-Verlag, New York.
Cagle, F. R. 1939. A system of marking turtles for future identification. Copeia 1939:170-173.
Congdon, J. D., A. E. Dunham, and R. C. van Loben Sels. 1994. Demographics of common snapping turtles (Chelydra serpentina): Implications for conservation and management of long-lived organisms. American Zoologist 34:397-408.
Cooch, E. G., and G. C. White. 2002. MARK - an introductory guide. in Available from http://www.phidot.org/software/mark/docs/book/.
Cowardin, L. M., V. Carter, F. C. Golet, and E. T. LaRoe. 1979. Classification of wetlands and deepwater habitats of the United States. Department of the Interior. U.S. Fish and Wildlife Service, Washington, D.C.
Dodd, C. K. J., W. J. Barichivich, and L. L. Smith. 2004. Effectiveness of a barrier wall and culverts in reducing wildlife mortality on a heavily traveled highway in Florida. Biological Conservation 118:619-631.
40
Ernst, C. H., R. W. Barbour, and J. E. Lovich. 1994. Chrysemys picta (Schneider, 1783). Pages 276-296 Turtles of the United States and Canada. Smithsonian Institute Press, Washington.
Evink, G. L., P. Garrett, D. Zeigler, and J. Berry. 1996. in Trends in addressing transportation related wildlife mortality. Proceedings of the transportation related wildlife mortality seminar. Tallahassee, FL.
_____. 1999. in Proceedings of the third international conference on wildlife ecology and transportation. Missoula, MT.
Fahrig, L., and G. Merriam. 1994. Conservation of fragmented populations. Conservation Biology 8:50-59.
FHWA, and MDT. 2000. Reevaluation of the Final Environmental Impact Statement and Section 4 (f) Evaluation. F 5-1(9)6 U.S. Highway 93, Evaro - Polson, Missoula and Lake Counties, Montana. Federal Highway Administration and the Montana Department of Transportation.
FHWA, MDT, and CSKT. 2005. US Highway 93 Ninepipe/Ronan Improvement Project: Draft Supplemental Environmental Impact Statement and Section 4(f) Evaluation. Montana Department of Transportation and Federal Highway Administration. Report FHWA-MDT-EIS-95-01-DS.
Fonnesbeck, C. J., and C. K. J. Dodd. 2003. Estimation of flattened musk turtle (Sternotherus depressus) survival, recapture, and recovery rate during and after a disease outbreak. Journal of Herpetology 37:602-607.
Forman, R. T. T., D. Sperling, J. A. Bissonette, A. P. Clevenger, C. D. Cutshall, V. H. Dale, L. Fahrig, R. France, C. R. Goldman, K. Heanue, J. A. Jones, F. J. Swanson, T. Turrentine, and T. C. White. 2003. Road Ecology: Science and solutions. Island Press, Washington.
Fowle, S. 1996a. Effects of roadkill mortality on the western painted turtle (Chrysemys picta belli) in the Mission Valley, western Montana. Pages 220-234 in ICOWET, Trends in addressing transportation related wildlife mortality: Proceedings of the transportation related wildlife mortality seminar. Tallahassee, Florida.
_____. 1996b. The painted turtle in the Mission Valley of western Montana. Masters of Science, University of Montana, Missoula, MT.
Frazer, N. B., J. L. Greene, and J. W. Gibbons. 1993. Temporal variation in growth rate and age at maturity of male painted turtles, Chrysemys picta. American Midland Naturalist 130:314-324.
Gibbons, J. W. 1987. Why do turtles live so long? BioScience 37:262-269. _____. 1990. Life history and ecology of the slider turtle. Smithsonian Institution Press,
Washington, D.C. Gibbons, J. W., J. L. Greene, and J. D. Congdon. 1983. Drought-related responses of
aquatic turtle populations. Journal Herpetology 17:242-246. _____. 1990. Temporal and spatial movement patterns of slider and other turtles. Pages
201-215 in J. W. Gibbons, editor. Life history and ecology of the slider turtle. Smithsonian Institution Press, Washington, D.C.
Gibbs, J. P., and D. A. Steen. 2005. Trends in sex ratios of turtles in the United States: Implications of road mortality. Conservation Biology 19:552-556.
41

Gilpin, M., E., and M. E. Soule. 1986. Minimum viable populations: processes of species extinction. Pages 18-34 in M. E. Soule, editor. Conservation Biology: the science of scarcity and diversity. Sinauer Associates Inc., Sutherland, Massachusetts.
Graham, T. E. 1979. Life history techniques. Pages 73-95 in M. Harless, and H. Morlock, editors. Turtles: perspectives and research. Robert Krieger Publishing Co., Malabar. Florida.
Hardy, A.R., S. Lee and A.F. Al-Kaisy. In press (2006). Effectiveness of animal advisory messages as a speed reduction tool: A case study in Montana. Accepted for publication in Transportation Research Record; volume and pages pending.
Harrison, S. 1994. Metapopulations and conservation. Pages 111-128 in P. J. Edwards, R. M. May, and N. R. Webb, editors. Large scale ecology and conservation ecology. Blackwell Scientific Publishers, Oxford.
Haxton, T. 2000. Road mortality of snapping turtles, Chelydra serpentina, in central Ontario during their nesting period. Canadian Field-Naturalist 114:106-110.
Heppell, S. A. 1998. Application of life-history theory and population model analysis to turtle conservation. Copeia 1998:367-375.
Hestbeck, J., B., J. D. Nichols, and R. A. Malecki. 1991. Estimates of movement and site fidelity using mark-resight data of wintering Canada geese. Ecology 72:523-533.
ICOET. 2003. Proceedings of the International Conference on Ecology and Transportation. Lake Placid, NY.
_____. 2005. Proceedings of the International Conference on Ecology and Transportation. in On The Road To Stewardship. San Diego, CA.
Kendall, W. L., and J. D. Nichols. 1995. On the use of secondary capture-recapture samples to estimate temporary emigration and breeding proportions. Journal of Applied Statistics 22:751-760.
Kendall, W. L., J. D. Nichols, and J. E. Hines. 1997. Estimating temporary emigration using capture-recapture data with Pollock's robust design. Ecology 78:563-578.
Kendall, W. L., K. H. Pollock, and C. Brownie. 1995. A likelihood-based approach to capture-recapture estimation of demographic parameters under the robust design. Biometrics 51:293-308.
Koper, N., and R. J. Brooks. 1998. Population-size estimators and unequal catchability in painted turtles. Canadian J. Zoology 76:458-465.
Lebreton, J.-D., K. P. Burnham, J. Clobert, and D. R. Anderson. 1992. Modeling survival and testing biological hypotheses using marked animals: a unified approach with case studies. Ecological Monographs 62:67-118.
MDT. 2002. Montana's Automatic Traffic Counters. Montana Department of Transportation. Traffic Data Collection Section. http://www.mdt.mt.gov/publications/docs/datastats/atr/atrbook02.pdf.
_____. 2003. Montana's Automatic Traffic Counters. Montana Department of Transportation. Traffic Data Collection Section. http://www.mdt.mt.gov/publications/docs/datastats/atr/atrbook03.pdf.
_____. 2004. Montana's Automatic Traffic Counters. Montana Department of Transportation. Traffic Data Collection Section. http://www.mdt.mt.gov/publications/docs/datastats/atr/atrbook04.pdf.
Means, D. B. 1999. The effects of highway mortality on four species of amphibians at a small, temporary pond in northern Florida. Pages 123-126 in Proceedings of the
42

third international conference on wildlife ecology and transportation. Missoula, Montana.
Merriam, G. 1984. Connectivity: a fundamental ecological characteristic of landscape pattern. Pages 5-15 in Proceedings of the first international seminar on methodology in landscape ecological research and planning. Roskilde, Denmark.
Messmer, T. A., C. W. Hendricks, and P. W. Klimack. 2000. Modifying human behavior to reduce wildlife-vehicle collisions using temporary signing. Pages 134-140 in 7th Annual Meeting of The Wildlife Society. Wildlife and Highways: Seeking Solutions to an Ecological and Socio-Economic Dilemma. Nashville, TN.
Mills, L. S., M. K. Schwartz, D. A. Tallmon, and K. P. Lair. 2003. Measuring and interpreting connectivity for mammals in coniferous forests. Pages 587-613 in C. J. Zabel, and R. G. Anthony, editors. Mammal community dynamics in western coniferous forests: management and conservation in the new millennium. Cambridge University Press.
Mitchell, J. C. 1985. Female reproductive cycle and life history attributes in a Virginia population of painted turtles, Chrysemys picta. Journal Herpetology 19:218-226.
_____. 1988. Population ecology and life histories of the freshwater turtles Chrysemys picta and Sternotherus odoratus in an urban lake. Herpetological Monographs 2:40-61.
Mitchell, J. C., and M. W. Klemens. 2000. Primary and secondary effects of habitat alteration. Pages 5-32 in M. W. Klemens, editor. Turtle conservation. Smithsonian Institutional Press, Washington.
Morrison, M. L., B. G. Marcot, and R. W. Mannan. 1992. Wildlife-habitat relationships: concepts and applications. University of Wisconsin Press, Madison, Wisconsin.
Nichols, J. D., J. E. Hines, J. D. Lebreton, and R. Pradel. 2000. Estimation of contributions to population growth: A reverse-time capture-recapture approach. Ecology 21:3362-3376.
Pollock, K. H. 1982. A capture-recapture design robust to unequal probability of capture. Journal of Wildlife Management 46:752-761.
Pollock, K. H., J. D. Nichols, C. Brownie, and J. E. Hines. 1990. Statistical inference for capture-recapture experiments. Wildlife Monographs 107:1-97.
Ream, C., and R. Ream. 1966. The influence of sampling methods on the estimation of population structure in painted turtles. The American Midland Naturalist 75:325-338.
Rudolf, D. C., S. J. Burgdorf, R. N. Conner, and J. G. Dickson. 1998. The impacts of roads on timber rattlesnakes (Crotalus horridus) in eastern Texas. Pages 236-239 in Proceedings of the International Conference on Wildlife Ecology and Transportation. Ft. Meyers, Florida.
Ruediger, B. 1996. The relationship between rare carnivores and highways. Pages 1-7 in Trends in addressing transportation related wildlife mortality seminar. Tallahassee, Florida.
Seber, G. A. F. 1982. The estimation of animal abundance and related parameters. MacMillan, New York.
Sexton, O. J. 1959. A method of estimating the age of painted turtles for use in demographic studies. Ecology 40:716-718.
43

Steen, D. A., and J. P. Gibbs. 2004. Effects of roads on the structure of freshwater turtle populations. Conservation Biology 18:1143-1148.
Sullivan, T. L. and T. A. Messmer. 2003. Perceptions of deer-vehicle collision management by state wildlife agency and department of transportation administrators. Wildlife Society Bulletin 31: 163-173.
Tinkle, D. W., J. D. Congdon, and P. C. Rosen. 1981. Nesting frequency and success: Implications for the demography of painted turtles. Ecology 62:1426-1432.
Trombulak, S. C., and C. A. Frissell. 2000. Review of ecological effects of roads on terrestrial and aquatic communities. Conservation Biology 14:18-30.
White, G. C., and K. P. Burnham. 1999. Program MARK: survival estimation from populations of marked animals. Bird Study 46 (suppl.):S120-139.
Wilbur, H. M. 1975. The evolutionary and mathematical demography of the turtle Chrysemys picta. Ecology 56:64-77.
Williams, B. K., J. D. Nichols, and M. J. Conroy. 2002. Analysis and management of animal populations. Academic Press, San Francisco.
44

APPENDIX A. Fencing Methods and Efficacy for Minimizing Turtle Road Kill and Directing Turtles to Crossing Structures. The following report was submitted to the Montana Department of Transportation in 2004. Based on MDT reviewer comments, revisions have been incorporated into the document.
FENCING METHODS AND EFFICACY FOR MINIMIZING
TURTLE ROAD KILL AND DIRECTING TURTLES TO CROSSING STRUCTURES
Submitted by
Kathy Griffin, PhD Candidate, And
Daniel H. Pletscher Wildlife Biology Program, School of Forestry
University of Montana Missoula, MT 59812
Submitted to
MONTANA DEPARTMENT OF TRANSPORTATION 2701 PROSPECT AVENUE
HELENA, MT 59620
May 2006
A-1

INTRODUCTION This report documents a variety of barrier and fencing designs that have been
used in wildlife-highway interaction projects and their effectiveness in keeping
herpetofauna off roadways and directing them towards wildlife crossing structures.
The National Cooperative Highway Research Program has produced the most
extensive synthesis of wildlife and highway issues in the Interaction Between Roadways
and Wildlife Ecology: A Synthesis of Highway Practices report (Evink 2002). A survey
conducted for that report indicates that many states are attempting to address wildlife-
highway issues. Out of the 34 states that responded to the survey, 28 are using fencing to
protect wildlife with the most frequent use being to keep deer off the roads.
Because fences are likely to increase the fragmentation effects of highways, the
use of culverts and other crossing structures are important in maintaining connectivity
(Boarman and Sazaki 1996, Evink 2002). Drainage culverts are one means of providing
connectivity. These types of culverts are typically used where highways cross wetlands
with fluctuating water levels. Theses culverts then become dual purpose; water transport
or hydrological leveling as well as wildlife corridors. The current design proposal for the
expansion of Highway 93 in the area of Ninepipe Wildlife Refuge includes the use of
culverts as wildlife crossing corridors (Federal Highway Administration and Montana
Department of Transportation 2000). The proposed wildlife crossing structures will be at
least 1.2 x 1.8 m concrete culverts and will likely be larger in many areas. In addition to
the wildlife crossing structures, numerous smaller culverts will be used for hydrological
leveling.
In an unpublished report to the Minnesota Department of Natural Resources, Lang
(2000) conducted a culvert size and shape experiment with 400 Blanding’s turtles
(Emydoidea blandingii). He used corrugated metal culverts ranging in size from 0.9 –
1.2 m in diameter and varying in shape from round to arched. Although not mentioned
specifically in the report, the length of the culverts appears to be that of a paved 2-lane
road (approximately 18 - 25 m). Lang found that Blanding’s turtles moved through each
of the culverts presented. Turtles did not demonstrate a clear preference for culvert size
or shape, or light intensity at the far end, given the available choices.
A-2

In Europe, culverts for mammals with widths from 5 to 12 m are common and, in
general, heights of 3 to 5 m have been successful (Bank et al. 2002).
Jackson conducted experiments on eastern painted turtles’ use of “culverts”(S.
Jackson, Extension Service Program Director for Natural Resources, Massachusetts, Pers.
Comm.). He observed turtles using a 0.6 x 0.6 x 6 m wooden box “culvert”. Females
used the box readily whether it was lighted or not. The unhesitant use by females
however may indicate a drive to reach breeding sites.
Given the information above on the culvert sizes used on other projects, it is
likely that the smaller culverts used for hydrological leveling will be dual purpose, that is,
serving as wildlife crossing structures as well.
TYPE OF BARRIERS Fencing
Typical fencing is rectangular mesh or chain link fence from 2.6 – 3.0 m in
height. Specific measurements depend on the target species. For small mammals and
herpetofauna often smaller mesh (2 x 2 cm to 4 x 4 cm) is attached to the existing chain
link or larger mesh fence (Evink 2002) (Figures A-1 and A-2). This mesh is often buried
20 – 40 cm into the ground and then extending to a height of 0.5 to 1 m. To keep reptiles
and amphibians from climbing the fence, the upper edge of the finer mesh is often bent
out at a 90-degree angle to create a lip.
Figure A-1. Wire fence with plastic fabric mesh (France). Photo: Bank et al. 2002.
Figure A-2. Wire fence with smaller mesh at the bottom. Photo: Bank et al. 2002.
A-3

In 1990, a 24 km desert tortoise (Gopherus agassizii) barrier fence was erected by
the California Department of Transportation. The fence consists of 60-cm wide, 1.3 cm
mesh of galvanized steel hardware cloth buried to 15 cm and extending 45 cm in height
(Boarman and Sazaki 1996, Boarman et al. 1997). The fence is supported by a six-strand
wire fence; the top 3 are barbed and the bottom 3 are unbarbed to allow easy installation
of the hardware cloth. Boarman and Sazaki (1996) found 88% fewer vertebrate roadkill
and 93% fewer tortoise roadkill along the fenced section of highway, therefore, the fence
was highly successful at reducing road mortality. Later, gaps due to poor maintenance
allowed tortoises to access the highway suggesting the need for proper maintenance.
The Iowa Department of Transportation considered many types of fencing to keep
ornate box turtles (Terrapene ornate), snakes, and small mammals off the highway
including half pipes and solid concrete walls. After taking cost and maintenance issues
into consideration they are installing 0.6 cm steel mesh attached to regular Type-47 field
fence (woven wire livestock fence). The mesh will be buried 20 cm and extend 1 m
above ground. This project is currently under construction with completion expected
summer 2004, therefore no indications of the effectiveness of this fence type are available
(R. Ridnour, Iowa Department of Transportation, Pers. Comm.). The mesh could be bent
outward at the top to create a lip, however, it may be time consuming to actually
accomplish this, as it is not prefabricated.
In Nebraska, a 0.9 m high chain link fence, buried 15.2 cm, was used to direct
Blanding’s turtles towards corrugated metal culverts with sizes varying from 0.6 to 0.91
m diameters with flared end sections and lengths from 18 to 36.5 m. The fence was
about 1.6 km in length and it appeared to work well in that section, however, road
mortality continued near the ends of the fence (L. Rowe, District Engineer, Nebraska
Department of Roads, Pers. Comm.).
Problems with Fencing
There are many problems associated with fencing. Overall, depending on the
fence type, fencing can be expensive to build, maintenance costs are high, and some
people do not like the aesthetics of wire fencing (Figure A-3).
A-4

More specifically, if the mesh sizes are too
large turtles, especially hatchlings and juveniles,
can pass through or get stuck in the openings.
Therefore, smaller mesh attached to the bottom of
larger mesh fences is necessary. Some turtle
species, including painted turtles, are good
climbers (M. Aresco, Florida State University,
Pers. Comm.; S. Jackson Extension Service,
Program Director for Natural Resources,
University of Massachusetts, Pers. Comm.).
Creating a lip at the top of the smaller mesh is
important to prevent climbing over the top (M.
Aresco, Wildlife Biologist, Florida State
University, Pers. Comm.) (Figure A-4). Another
problem is storm water run-off which can cause
erosion and often undermines the f
the mesh can minimize this problem
however, proper installation an
regular inspection/maint
required.
ence. Burying
d
enance is
Silt fencing which is made
either of cloth or fabric should only be
used as a temporary solution because
of its short life span. Silt fencing can
be climbed, can be overgrown quickly,
and can rip and tear easily, especially
when weathered. All of these
compromise the effectiveness of this
type of barrier.
Figure A-3. Smaller mesh fence. Note potential problem with litter build up and fence not connected to outer edge of culvert. Photo: Bank et al. 2002.
Figure A-4. Florida softshell turtle climbing over fabric silt fence. Photo: M. Aresco
A-5

Rails and Curved Pipes
Europeans have used a PVC barrier with an angled lip or fabricated galvanized steel
rails with a lip along the upper edge as a barrier for amphibians and reptiles (Bank et al.
2002, Frey and Niederstraßer 2000) (Figures A-5 and A-6). A 30 cm diameter PVC pipe,
sliced down the middle and half buried has been used in Massachusetts to keep box, wood,
and spotted turtles off the roadway (S. Smyers, Wildlife Biologist, Oxbow Associates, Pers.
Comm.). Although these barriers are cheap and fairly easy to install, keeping vegetation
from growing over them is a constant maintenance problem and they only work for small
mammals, reptiles, and amphibians. Also, any vegetation (even short vegetation) growing
near-by can drastically reduce their effectiveness. This creates a virtually constant
maintenance problem. However, if the rail were built into an asphalt strip or pad these
problems could be minimized.
Figure A-5. Galvanized steel rail with lip for amphibians and reptiles (Germany). Photo: Bank et al. 2002.
Figure A-6. Metal rails with lip for amphibians and reptiles (Germany). Photo: Bank et al. 2002.
A-6

Concrete Walls
The Payne’s Prairie Ecopassage project near Gainesville, Florida has incorporated
the dual-use (hydrological leveling and wildlife crossing) culverts and barriers which
have been successful in providing connectivity for a wide range of terrestrial and aquatic
wildlife. This project has the most pre- and post-construction data available of any
wildlife crossing culverts and directional barrier project (Barichivich and Dodd 2002).
A suite of structures including lipped concrete walls, concrete square box
culverts, precast concrete bottomless culverts, round concrete pipes, open median drains,
and reverse mount guardrail barriers (Type A fencing, see next section below) combine to
reduce mortality and allow animals to cross under the highway. The 1.1-m concrete wall
with a 15.2-cm lip keeps small mammals, reptiles, and amphibians off the highway
(Figures A-7 and A-8).
The concept of a lipped wall can be used in any area where barrier fence for small
animals (reptiles, amphibians, small mammals, or even flightless stages of birds such as
ducklings) is desired. The height of the wall can be based on whatever species are in the
area of concern. Because the Paynes Prairie project had species that were able to climb
high walls, it is likely that most situations would need shorter walls.
Figure A-7. Paynes Prairie Ecopassage (Florida) – Artist rendition. Concrete wall with lip. Photo: D. Forsyth. www.fhwa.dot.gov/environment/wildlifecrossings/amphibian.htm
A-7
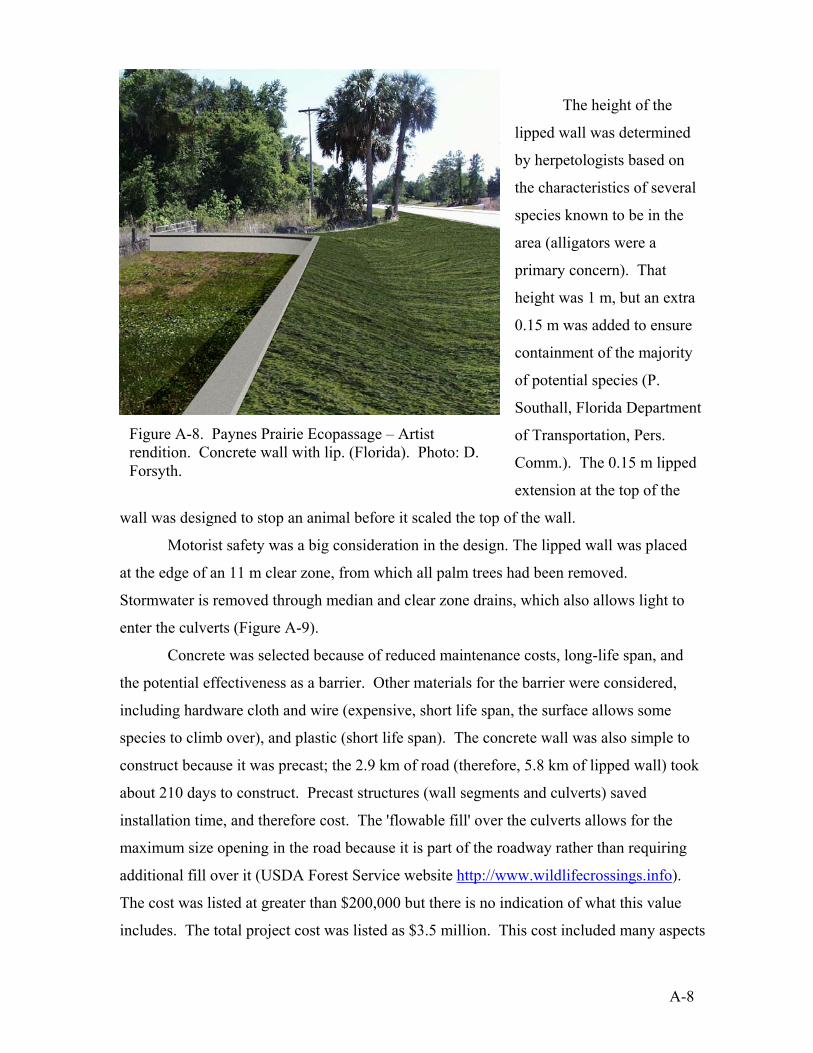
The height of the
lipped wall was determined
by herpetologists based on
the characteristics of several
species known to be in the
area (alligators were a
primary concern). That
height was 1 m, but an extra
0.15 m was added to ensure
containment of the majority
of potential species (P.
Southall, Florida Department
of Transportation, Pers.
Comm.). The 0.15 m lipped
extension at the top of the
wall was designed to stop an animal before it scaled the top of the wall.
Figure A-8. Paynes Prairie Ecopassage – Artist rendition. Concrete wall with lip. (Florida). Photo: D. Forsyth.
Motorist safety was a big consideration in the design. The lipped wall was placed
at the edge of an 11 m clear zone, from which all palm trees had been removed.
Stormwater is removed through median and clear zone drains, which also allows light to
enter the culverts (Figure A-9).
Concrete was selected because of reduced maintenance costs, long-life span, and
the potential effectiveness as a barrier. Other materials for the barrier were considered,
including hardware cloth and wire (expensive, short life span, the surface allows some
species to climb over), and plastic (short life span). The concrete wall was also simple to
construct because it was precast; the 2.9 km of road (therefore, 5.8 km of lipped wall) took
about 210 days to construct. Precast structures (wall segments and culverts) saved
installation time, and therefore cost. The 'flowable fill' over the culverts allows for the
maximum size opening in the road because it is part of the roadway rather than requiring
additional fill over it (USDA Forest Service website http://www.wildlifecrossings.info).
The cost was listed at greater than $200,000 but there is no indication of what this value
includes. The total project cost was listed as $3.5 million. This cost included many aspects
A-8
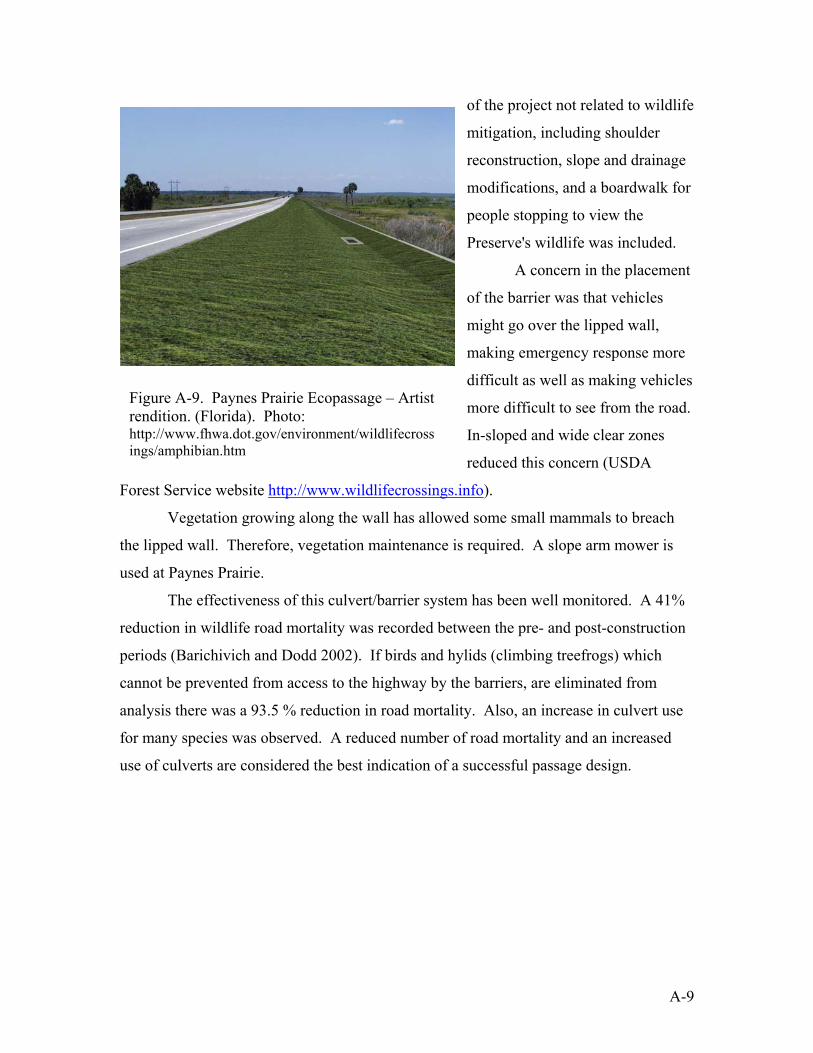
of the project not related to wildlife
mitigation, including shoulder
reconstruction, slope and drainage
modifications, and a boardwalk for
people stopping to view the
Preserve's wildlife was included.
A concern in the placement
of the barrier was that vehicles
might go over the lipped wall,
making emergency response more
difficult as well as making vehicles
more difficult to see from the road.
In-sloped and wide clear zones
reduced this concern (USDA
Forest Service website http://www.wildlifecrossings.info
Figure A-9. Paynes Prairie Ecopassage – Artist rendition. (Florida). Photo: http://www.fhwa.dot.gov/environment/wildlifecrossings/amphibian.htm
).
Vegetation growing along the wall has allowed some small mammals to breach
the lipped wall. Therefore, vegetation maintenance is required. A slope arm mower is
used at Paynes Prairie.
The effectiveness of this culvert/barrier system has been well monitored. A 41%
reduction in wildlife road mortality was recorded between the pre- and post-construction
periods (Barichivich and Dodd 2002). If birds and hylids (climbing treefrogs) which
cannot be prevented from access to the highway by the barriers, are eliminated from
analysis there was a 93.5 % reduction in road mortality. Also, an increase in culvert use
for many species was observed. A reduced number of road mortality and an increased
use of culverts are considered the best indication of a successful passage design.
A-9

Guardrail (Type-A Fence)
As part of the Paynes Prairie Ecopassage project, a reverse mount guardrail
barrier made of metal with wood posts facing the traffic was installed at both ends of the
wetland to reduce animals traveling around the ends of the lipped wall (Figure A-10).
These were buried with hardware cloth to prevent animals from digging under the
guardrail. The guardrails were placed in reverse to prevent snakes from climbing the
posts and crossing (USDA Forest Service website http://www.wildlifecrossings.info).
Some problems with drainage have occurred in the reverse guardrail barrier.
Animals have been able to enter the roadway where water run-off from the road has
created gaps under the barrier. Pete Southall (Florida Department of Transportation,
Pers. Comm.) believes that if the guardrail were constructed with an asphalt footprint
base this would eliminate the drainage and vegetation concerns. In this situation the
guardrail may be very effective and have lower maintenance costs. A slope mower arm
would be able to mow over the top of the guardrail easily. The reverse mount guardrail
was considered effective for smaller animals (P. Southall, Florida Department of
Transportation, Pers. Comm.).
Figure A-10. Type-A fence (Paynes Prairie, Florida) Photo: Barichivich and Dodd 2002.
A-10

Rock Walls
Rock walls have also been used, usually in association with fencing, to keep small
animals off the road. Gabion ™ is a type of wire cage that can be filled with rocks and
wired shut. There are 2 examples of the use of Gabion baskets by the New Jersey
Department of Transportation. In both cases, Gabion was used as a means to minimize
erosion and to keep turtles off a roadway (J. Campy, New Jersey Department of
Transportation, Pers. Comm.). The rock wall was about 1 m2 wide and 91 m long. There
was no monitoring of the sites post-construction but the belief is that there was no longer
a problem with road mortality. In the approximately 2 years since the rock wall has been
in place there has been no maintenance issues (J. Campy, New Jersey Department of
Transportation, Pers. Comm.). In the Ninepipe area of Highway 93 this system may not
be effective because of the climbing ability of painted turtles.
POTENTIAL ISSUES
In general, amphibians and reptiles are potentially less amenable to mitigation
using crossing structures and barriers than mammal species. This is a consequence of the
limited movements by many species and the low potential for learning compared with
large animals (Rudolph 2000). However, movements through the culverts by at least a
few individuals should be sufficient to maintain genetic exchange while at the same time
significantly decreasing wildlife road mortality (Barichivich and Dodd 2002).
Animals on the wrong side
One problem associated with fencing is that animals can get trapped on the wrong
side of the fence. Bissonette and Hammer (2000) found that deer used earthen ramps
about 10 times more often than one-way gates. Scott Jackson (Extension Service,
Program Director for Natural Resources, University of Massachusetts, Pers. Comm.) used
earthen ramps with flaps cut into silt fencing as “jump outs” for turtles. Two turtles were
observed using these.
A-11

Erosion
Sheet erosion and other drainage issues can cause problems and breaching of most
types of barriers. Burying galvanized metal or aluminum flashing to a depth of 20 cm
could significantly decrease access to the road by small animals such as turtles and
snakes (Barichivich and Dodd 2002). Also, using asphalt “pads” may also minimize this
problem (see discussion under “Guardrail” section). Regular inspection of the barrier
should be required.
Vegetation
During the Paynes Prairie Ecopassage
project, small mammals, snakes, and treefrogs
were observed climbing vegetation adjacent to
the concrete wall (Barichivich and Dodd
2002) (Figure A-11). Vegetation generally
needs mechanical mowing once a year.
Approved aquatic pesticides are used about
twice a year on the Paynes Prairie project (P.
Southall, Florida Department of
Transportation, Pers. Comm.).
Maintenance
Because of the above issues, regular inspe
incorporated into highway plans. On the Paynes
occurs about once a year and approved aquatic pe
Figure A-11. Vegetation growing along concrete wall with lip (Paynes Prairie, Florida) Photo: Barichivichand Dodd 2002.
ction and maintenance needs to be
Prairie Ecopassage project mowing
sticides are used about twice a year.
A-12

RECOMMENDATIONS
There are many different types of barriers that have proven to be effective in
minimizing wildlife-highway interactions. The type, dimensions, and materials used are
often dictated by the needs of the species of most concern on the project. Given that the
Highway 93 Reconstruction through the Ninepipes area is likely to encounter many
different types of construction needs, no one type of wildlife barrier can be
recommended. Like the Paynes Prairie Ecopassage project, a combination of methods
mentioned above is likely to be needed to accommodate the various situations
encountered along this stretch of highway (Figure A-12). Where wildlife crossing
culverts are located, concrete walls or the galvanized steel railings might easily be
incorporated into the design because mechanically stabilized earth will be needed (G.
Smith, Senior Project Manager, Skillings Connolly, Pers. Comm.).
Figure A-12. Example of a combination of barrier methods. Arched culvert with large fence along highway and metal rail for amphibians and reptiles (Germany). Photo: Bank et al. 2002.
A-13
LITERATURE REVIEW
Bank, F.G., C.L. Irwin, G.L. Evink, M.E. Gray, S. Hagood, J.R. Kinar, A. Levy, D. Paulson, B. Ruediger, R.M. Sauvajot. 2002. Wildlife habitat connectivity across European highways. Federal Highway Administration FHWA-PL-02-011.
Barichivich, W.J. and C.K. Dodd, Jr. 2002. The effectiveness of wildlife barriers and
underpasses on U.S. Highway 441 across Paynes Prairie State Preserve, Alachua County, Florida. Phase II Post-Construction Final Report, Florida Department of Transportation Contract No. BB-854. July 2002. Pp 37.
Bissonette, J.A., and M. Hammer. 2000. Effectiveness of earthen return ramps in
reducing big game highway mortality in Utah, Final Report. Utah Cooperative Fish and Wildlife Research Unit, Report UT-01.09, Logan UT.
Boarman, W.I. and M. Sazaki. 1996. Highway mortality in desert tortoises and small
vertebrates: success of barrier fences and culverts. in G. L. Evink, P. Garrett, D. Zeigler, and J. Berry, editors. International Conference of Wildlife Ecology and Transportation (ICOWET), Trends in addressing transportation related wildlife mortality: proceedings of the transportation related wildlife mortality seminar, Tallahassee Florida.
Boarman, W.I., M. Sazaki and W.B. Jennings. 1997. The effects of roads, barrier fences,
and culverts on desert tortoise populations in California, USA. Proceeding of Conservation, Restoration and Management of Tortoise and Turtles – An International Conference. New York Turtle and Tortoise Society, NY.
Evink, G.L. 2002. Interaction between roadways and wildlife ecology: a synthesis of
highway practice. National Cooperative Highway Research Program, Synthesis 305. Transportation Research Board – The National Academies, Washington, D.C. Pp 86. Available at the following website: http://gulliver.nationalacademies.org/publications/nchrp/nchrp_syn_305.pdf
Federal Highway Administration and the Montana Department of Transportation. 2000.
Reevaluation of the Final Environmental Impact Statement and Section 4 (f) Evaluation. F 5-1(9)6 U.S. Highway 93, Evaro - Polson, Missoula and Lake Counties, Montana. Montana Department of Transportation. Helena, Montana.
Frey, E., and J. Niederstraßer, 2000. Baumaterialien für den amphibienschutz an straBen:
Ergebnisseder eignungsprufung an einer anlage (Construction materials for amphibian protection along roads: results of suitability analysis of a site) (de) Naturschutz-Praxis, Artenschutz. 3, Landesanstalt für Umweltschutz Baden-Württemberg, Karlsruhe. Pp 159.
A-14

Lang, Jeffrey. 2000. Blandings turtles, roads, and culverts at Weaver Dunes. Report for the Minnesota Department of Natural Resources. Rochester, MN. Pp 30.
Rudolph, C. 2000. An overview of the impact of roads on amphibian and reptiles. In R.
Craig, editor. An overview of the impact of roads on amphibian and reptiles. Wildlife and highways: seeking solutions to an economic and socioeconomic dilemma. 7th annual meeting of The Wildlife Society, Sept. 12-16, 2000, Nashville, TN.
PERSONAL COMMUNICATIONS AND WEBSITES Aresco, Matt. Wildlife Biologist, Department of Biological Science, Florida State
University, Tallahassee, Florida 32306-1100 Email: [email protected] Phone: (850) 562-3093
Campy, John. New Jersey Department of Transportation. Trenton, NJ Phone: (609) 292-6500 Jackson, Scott. Extension Service, Program Director for Natural Resources, University of
Massachusetts. Phone: (413) 545-4743 Ridnour, Ron. Iowa Department of Transportation Phone: (515) 239-1613 Rowe, Larry. District Engineer, Nebraska Department of Roads
Phone: (402) 387-2471 Smyers, Scott. Wildlife Biologist Consultant, Oxbow Associates, MA.
Phone: (978) 929-9058 Smith, Gerry. Senior Project Manager, Skillings Connolly, Missoula, MT Phone: (406) 541-7877 Southall, Pete. Florida Department of Transportation Phone: (386) 961-7470
A-15

USDA Forest Service. Wildlife Crossing Toolkit http://www.wildlifecrossings.info/beta2.htm
If you go to “simple search” and type in “Paynes Prairie”, then click on the name “Paynes Prairie” detailed information on design dimensions and engineering drawings can be found.
This website is directed by Jacobson, Sandra. Wildlife Biologist, USDA Forest Service, Pacific Southwest Research Station, Arcata, CA Phone: (707) 826-1276 Email: [email protected]
BIBLIOGRAPHY U.S. Dept of Transportation, Federal Highway Administration. Critter Crossings:
Linking Habitats and Reducing Roadkill http://www.fhwa.dot.gov/environment/wildlifecrossings/main.htm
U.S. Dept of Transportation, Federal Highway Administration. Keep it simple: easy
ways to help wildlife along roads. http://www.fhwa.dot.gov/environment/wildlifeprotection/
U.S.G.S. Paynes Prairie Ecopassage Project
http://www.fcsc.usgs.gov/Amphibians_and_Reptiles/Paynes_Prairie_Project/paynes_prairie_project.html. For detailed information on design dimensions including engineering drawings, see the USDA Forest Service Wildlife Crossing Toolkit website.
A-16

APPENDIX B. Use of Low Fencing with Aluminum Flashing as a Barrier for Turtles. The following paper was presented at and appears in the Proceedings the 2005 International Conference on Ecology and Transportation (ICOET) which occurred from August 29 through September 2, 2005 in San Diego, California. Griffin, K.A. 2005. Use of low fencing with aluminum flashing as a barrier for turtles. In
Proceedings of the 2005 International Conference on Ecology and Transportation, edited by C. Leroy Irwin, Paul Garrett, and K.P. McDermott. Raleigh, NC: Center for Transportation and the Environment, North Carolina State University.
USE OF LOW FENCING WITH ALUMINUM FLASHING AS A BARRIER FOR TURTLES. Abstract I examined the effects of road mortality on a population of western painted turtles (Chrysemys picta belli) in west-central Montana; these turtles make up the majority of road mortalities in a section of highway that bisects the Ninepipe National Wildlife Refuge. The objective of the barrier fencing experiment was to determine whether turtles were able to breach fencing designed to direct turtles towards crossing structures and thereby keep them off the road. I constructed 45.7 cm high turtle enclosures out of 2 by 5 cm fencing with and without 10 or 15 cm high flashing attached at the top. Turtles were placed in the enclosures and behavior was observed for 1 hour. Of 124 turtles, only 4 (3.2%) were able to climb to the flashing. No turtles climbed over the flashing within the time allowed. In enclosures without flashing, 2 (3.8 %) were able to breach the fencing. The results of this experiment will help in the design of appropriate barriers to keep turtles off the road and direct them towards crossing structures.
Introduction In northwestern Montana, U.S. Highway 93 has been slated for capacity and reconstruction improvements along a 90 km (56 mile) section. An approximately 7 km (4.3 miles) portion of this highway bisects a prairie pothole ecosystem that currently supports a variety and abundance of wildlife. One species, the western painted turtle (Chrysemys picta belli), comprises the majority of wildlife road mortalities in this area. Through a cooperative agreement involving the Montana Department of Transportation (MDT), the Federal Highway Administration (FHWA), and the Confederated Salish and Kootenai tribes (CSKT), a series of wildlife mitigation measures involving wildlife crossing structures and other design features will be implemented to decease the amount of road mortality and fragmentation that currently exists (FHWA, MDT, and CSKT 2000).
B-1
A variety of barrier and fencing designs have been used in wildlife-highway interaction projects to keep wildlife off roadways and direct them towards wildlife crossing structures. Because barriers and fencing are likely to increase the fragmentation effects of highways, the use of culverts and other crossing structures are important in maintaining connectivity (Dodd et al. 2004, Aresco 2005). Amphibians and reptiles are potentially less amenable to mitigation using crossing structures and barriers. This is a consequence of the limited movements by many species and the low potential for learning compared with large animals (Yanes et al. 1995). However, movements through the culverts by at least a few individuals should be sufficient to maintain genetic exchange while at the same time significantly decreasing wildlife road mortality (Rudolf 2000). Various turtle species are known to use culverts as crossing structures (Foresman 2004, Pelletier 2005, Walsh 2005). Rails and curved pipes have been used as barriers for amphibians and reptiles (Barichivich and Dodd 2002), (Frey and Niederstraßer 2000), (Bank et al. 2002), as have concrete walls (Barichivich and Dodd 2002), guardrails (Barichivich and Dodd 2002), and fencing (Banks et al. 2002, Evink 2002). Herpetofauna can be directed by drift fences, which have been very effective in directing movements especially during capture sessions (Gibbons et al. 1990, Morreale et al. 1984.). Ruby et al. (1994) compared behavioral responses of captive desert tortoises to various barriers and fences. They found tortoises responded differently to the different barrier types. Tortoises were also observed attempting to climb those barriers constructed of wood (Puky and Vogel 2003). While anecdotal evidence exists that some turtle species (including painted turtles) are good climbers, no one has examined barrier fencing can be breached. My objective was to determine if aluminum flashing at the top of a wire fence would be sufficient to stop western painted turtles from climbing over barrier fencing. The particular fencing type in combination with aluminum flashing was used to represent a potentially low-cost alternative for use as barrier and directional fencing at crossing structures. Methods: The enclosure trials were conducted at various ponds within the Mission Valley, Montana (T20N, R20W, Sections 24-26). All trials were conducted during activity periods of turtles (1335 – 1800 Mountain Daylight Time), between July 4 and 11, 2004 and May 26 and 30, 2005. Eight circular enclosures were built of 2.5 x 5 cm welded wire. The enclosures were 61 cm in diameter and 45.7 cm high with an open top and bottom. On the inside top of each enclosure either 10 cm or 15 cm of aluminum flashing (#68-010) was attached flush with the top of the enclosure (Figures B-1 and B-2). Four enclosures of each type were made for a total of 8 enclosures. Because of the different flashing widths the distance from the ground to the bottom of the flashing was different for the 2 types of enclosures. Therefore, the enclosures with 10 cm of flashing had 35.6 cm of exposed wire and the enclosures with 15 cm of flashing had 30.5 cm of exposed wire. For the 2005 trials, the flashing was removed making the enclosures 45.7 cm of fencing.
B-2

Figure B-1. Wire enclosures with aluminum flashing used to test turtle’s climbing ability.
Figure B-2. Turtles in fencing enclosure with aluminum flashing. The enclosures were placed at the edge of a pond so that the substrate was always dried mud. Enclosures were placed such that the interior was bare or had little vegetation and no food, water, or shelter was provided. Trials were conducted with wild-caught, naïve animals that had no known previous experience with enclosures. Each trial began by randomly assigning 2 turtles to each enclosure and placing the turtles in the center of the enclosure. A total of 177 turtles were used for the trials. Each trial lasted 1 hour during which turtle behavior was noted. Each time a turtle attempted to climb the fencing the highest level it reached was recorded. A turtle was considered to have reached that level if at least 1 claw held onto that rung of wire. If a turtle fell onto its back it was left alone to see if it could right itself. If after 1 minute the turtle was unable to right itself it was turned over by the observer. Trials were run simultaneously in all 8 enclosures and observational data were collected during the entire hour period. Crewmembers were responsible for observations in 2
B-3
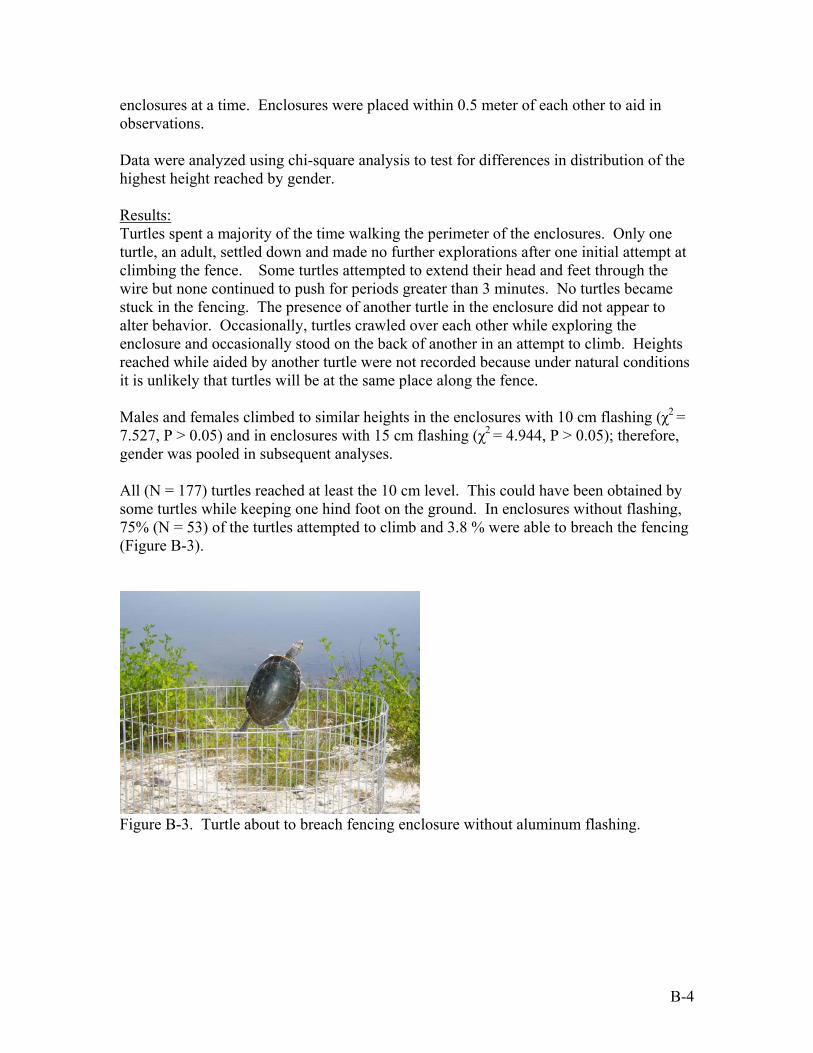
enclosures at a time. Enclosures were placed within 0.5 meter of each other to aid in observations. Data were analyzed using chi-square analysis to test for differences in distribution of the highest height reached by gender. Results: Turtles spent a majority of the time walking the perimeter of the enclosures. Only one turtle, an adult, settled down and made no further explorations after one initial attempt at climbing the fence. Some turtles attempted to extend their head and feet through the wire but none continued to push for periods greater than 3 minutes. No turtles became stuck in the fencing. The presence of another turtle in the enclosure did not appear to alter behavior. Occasionally, turtles crawled over each other while exploring the enclosure and occasionally stood on the back of another in an attempt to climb. Heights reached while aided by another turtle were not recorded because under natural conditions it is unlikely that turtles will be at the same place along the fence. Males and females climbed to similar heights in the enclosures with 10 cm flashing (χ2 = 7.527, P > 0.05) and in enclosures with 15 cm flashing (χ2 = 4.944, P > 0.05); therefore, gender was pooled in subsequent analyses. All (N = 177) turtles reached at least the 10 cm level. This could have been obtained by some turtles while keeping one hind foot on the ground. In enclosures without flashing, 75% (N = 53) of the turtles attempted to climb and 3.8 % were able to breach the fencing (Figure B-3).
Figure B-3. Turtle about to breach fencing enclosure without aluminum flashing.
B-4

In enclosures with flashing, 82% (N = 124) attempted to climb the fencing (climbing was defined as reaching 15 cm [6 in.] which meant that at least both front feet were off the ground). No turtles were able to breach the flashing in any enclosure, however, 2 adult turtles in both the 10 cm and 15 cm flashing enclosures reached the flashing (3.6% and 3.8%, respectively). All turtles that were able to touch the flashing fell to the ground. All turtles, except 1, were able to right themselves within a matter of a minute. Digging behavior was only observed 3 times during the trials and in no instance was the turtle able to breach the fence. Discussion Turtles are known to make seasonal movements (Sexton 1959, Gibbons et al. 1990) and given urban development today they are likely to encounter roadways during these movements. Turtles are susceptible to road mortality due to their slow movements; therefore, fencing is an important issue. With the increase in the use of barrier fencing to direct wildlife towards crossing structures, it is important to determine what methods or designs are most effective. One commonly held belief is that turtles are good climbers and, thus, potentially able to breach fencing that is designed to keep them off the roadway. I found that although turtles were able to climb wire fencing, it is unlikely that many, if any, turtles are able to breach even relatively low fencing if aluminum flashing is attached at the top. Digging behavior may not have been an issue during this experiment however; longer confinement may have been needed in order for digging behavior to begin. This information can be helpful for agencies, such as transportation departments, in deciding what types of barrier fencing to use. There are some potential problems associated with fencing. Overall, depending on the fence type, fencing can be expensive to build, maintenance costs can be high, and aesthetics of wire fencing may be an issue. For turtles, if the mesh sizes are too large, hatchlings and juveniles can pass through or get stuck in the openings. Therefore, smaller mesh attached to the bottom of larger mesh fences is necessary (Evink 2002). Fencing should be buried to minimize the chance of turtles breaching the fencing by digging. The type, dimensions, and materials used for barrier fencing should be dictated by the needs of the species of most concern in the project area. In general, more studies are needed to find the most effective and low cost fencing so that a system of crossing structures and barriers will likely be successfully implemented and maintained. Some specific questions that need to be addressed include whether and how far turtles will follow fencing and if there are specific conditions that cause turtles to turn away from fencing rather than travel along them.
B-5

Acknowledgements: Funding was provided by the Montana Department of Transportation Project #8169 entitled “Potential effects of road mortality and habitat fragmentation on a population of painted turtles in Montana”. Additional support for the overall project was provided by the Confederated Salish Kootenai Tribes, the Summerlee Foundation, and the Western Transportation Institute. Dan Pletscher, Professor of Wildlife Biology and Director of the Wildlife Biology Program, University of Montana, provided important input and support throughout the course of the project.
Biographical Sketch: Kathleen Griffin is currently a Ph.D. candidate in the Wildlife Biology Program, College of Forestry and Conservation, University of Montana in Missoula, MT. Her current research focuses on population dynamics and movements of freshwater turtles in Montana. Literature Cited Aresco, M. J. 2005. Mitigation measures to reduce highway mortality of turtles and other
herpetofauna at a north Florida lake. Journal of Wildlife Management 69:549-560. Bank, F., G., C. L. Irwin, G. L. Evink, M. E. Gray, S. Hagood, J. R. Kinar, A. Levy, D.
Paulson, B. Ruediger, and R. M. Sauvajot. 2002. Wildlife habitat connectivity across European highways. Page 60. U.S. Department of Transportation, Federal Highways Administration.
Barichivich, W. J., and C. K. J. Dodd. 2002. The effectiveness of wildlife barriers and underpasses on U.S. Highway 441 across Paynes Prairie State Preserve, Alachua County, Florida. Page 37. Florida Department of Transportation.
Dodd, C. K. J., W. J. Barichivich, and L. L. Smith. 2004. Effectiveness of a barrier wall and culverts in reducing wildlife mortality on a heavily traveled highway in Florida. Biological Conservation 118:619-631.
Evink, G. L. 2002. Interaction between roadways and wildlife ecology: A synthesis of highway practices. Page 77. Transportation Research Board - The National Academies, Washington, D.C.
FHWA, MDT, and CSKT. 2000. Memorandum of agreement - U.S. 93 Evaro to Polson. U.S. Department of Transportation, Federal Highway Administration, Montana Department of Transportation and Confederated Salish and Kootenai Tribes. Dec 20 2000.
Foresman, K.R. 2004. The effects of highways on fragmentation of small mammal populations and modifications of crossing structures to mitigate such impacts. Final report to Montana Department of Transportation. March 2004.
Frey, E., and J. Niederstraßer. 2000. Baumaterialien für den Amphibienschutz an Strassen : Ergebnisse der Eignungsprüfung an einer Anlage. Page 159. Landesanstalt für Umweltschutz Baden- Württemberg, Karlsruhe.
Gibbons, J.W., J.L. Greene, and J.D. Congdon. 1990. Temporal and spatial movement patterns of slider and other turtles. Pages 201-215 in J. W. Gibbons, editor. Life history and ecology of the slider turtle. Smithsonian Institute Press, Washington D.C.
B-6

Morreale, S.J., J.W. Gibbons, and J.D. Congdon. 1984. Significance of activity and movements in the yellow-bellied slider turtle (Pseudemys scripta). Canadian Journal Zoology 62:1038-1042.
Pelletier, S. 2005. Railroad crossing structures for spotted turtles. Presentation at the International Conference on Ecology and Transportation. San Diego, CA. August 29 - September 2, 2005.
Puky, M. and Z. Vogel. 2003. Amphibian mitigation measures on Hungarian roads: design, efficiency, problems and possible improvements, need for a co-ordinated European environmental education strategy. Habitat Fragmentation due to Transportation Infrastructure-IENE 2003:pp. 13.
Ruby, D. E., J. R. Spotila, S. K. Martin, and S. J. Kemp. 1994. Behavioral responses to barriers by desert tortoises: Implications for wildlife management. Herpetological Monographs 8:144-160.
Rudolf, D.C. 2000. An overview of the impact of roads on amphibians and reptiles. in D.C. Rudolf, editor, Wildlife and highways: seeking solutions to an economic and socioeconomic dilemma. 7th Annual Meeting of The Wildlife Society, Nashville, TN.
Sexton, O.J. 1959. Spatial and temporal movements of a population of the painted turtle, Chrysemys picta marginata (Agassiz). Ecological Monographs 29:113-140.
Walsh, K. 2005. Spotted turtles use of a culvert under relocated Route 44 in Carver, Massachusetts. Presentation at the International Conference on Ecology and Transportation. San Diego, CA. August 29 - September 2, 2005.
Yanes, M., J. M. Velasco, and F. Suarez. 1995. Permeability of roads and railways to vertebrates: the importance of culverts. Biological Conservation 71:217-222.
B-7

APPENDIX C. Road Mortality Data for All Species. The following table and graphs depict all road mortalities encountered during road mortality
surveys along Highway 93 from 2002 to 2004. Surveys were conducted along a (6.4-km [4-mile]
stretch between Gunlock-Olson Road and Beaverhead Lane.
Roads within the study area were walked approximately once a week from mid-May through
late August, 2003-2005. In 2002, surveys were conducted between mid-July and mid-September.
In 2003 and 2004, surveys began in mid-May and continued through mid-September with 1 final
survey the first week of October. Crews walked each side of the roadways simultaneously and
documented all dead vertebrates. Animal locations were referenced to approximately evenly spaced
(0.16 km) numbered reflector posts along the highway. These road markers start at 1.0 at Gunlock-
Olson Road and are approximately 160 m apart. See Figure 5 in the main document for details on
marker locations.
All road mortality counts are considered minimum counts because there is no information on
the probability of recovery of road killed individuals. For example, some animal carcasses may
have been removed from the highway by scavengers or blown off before being counted.
C-1

Table C-1. The number of individual animals (not including turtles) found during road mortality surveys along a 6.4 km section of Highway 93 in the Ninepipe/Ronan area from 2002 through 2004.
Large Mammals4/
2002 2003 2004 2002 2003 2004 2002 2003 2004 2002 2003 2004 20031 0 0 0 1 2 2 0 2 3 0 1 0 0 12 0 0 0 2 2 0 0 2 1 0 2 1 0 13 0 0 0 7 5 1 0 0 1 0 1 1 0 14 0 1 0 0 3 1 3 1 0 0 0 0 05 1 0 0 7 4 0 0 1 0 0 2 0 0 16 0 1 1 9 7 2 0 2 2 1 2 1 0 27 1 2 0 9 5 0 0 0 0 0 0 0 0 18 0 0 0 15 6 4 1 0 1 2 1 0 0 39 0 0 0 22 18 11 1 1 2 0 0 1 0 510 2 0 1 8 11 2 0 1 0 0 1 0 0 211 0 0 1 3 6 1 0 1 0 2 1 1 0 112 2 0 0 1 2 2 2 0 2 2 2 1 0 113 0 0 0 1 4 0 0 0 0 0 1 0 014 0 1 0 3 0 2 0 0 1 2 5 0 0 115 0 1 0 0 2 0 0 0 0 0 1 1 016 0 0 0 4 1 1 0 0 0 1 4 1 0 117 0 3 0 0 9 2 0 1 0 3 1 0 0 118 0 6 0 1 5 1 0 0 0 1 3 1 0 119 0 5 1 1 1 0 1 0 2 1 2 1 1 120 0 4 0 0 1 1 1 0 0 0 2 0 021 0 1 0 1 0 0 0 0 0 0 0 0 022 0 0 0 3 0 2 0 0 0 1 3 1 0 123 0 1 0 4 1 0 0 0 1 1 2 0 0 124 0 0 0 3 1 0 0 0 3 0 2 0 025 0 0 4 1 2 3 0 0 0 0 0 1 0 126 0 1 0 2 1 1 0 0 0 2 6 0 0 127 0 0 0 4 3 2 0 0 0 0 5 0 0 128 0 2 1 2 3 0 1 0 0 0 0 0 029 1 1 0 8 1 0 1 0 1 0 4 0 0 130 0 1 1 7 0 0 1 0 0 3 1 0 0 131 0 0 0 9 2 1 0 0 0 2 2 0 0 132 0 0 1 1 2 1 0 0 0 1 3 0 033 0 0 0 1 4 0 0 1 1 1 1 1 0 134 1 1 0 3 5 0 0 0 0 1 0 0 0 135 0 0 0 0 3 0 0 0 0 2 0 0 036 0 0 0 0 1 1 0 1 0 0 1 0 037 1 3 0 4 1 0 0 0 0 1 0 0 2 138 0 0 0 4 1 0 0 1 0 1 0 0 039 1 1 0 2 2 0 0 0 0 0 1 0 040 0 10 0 5 0 1 2 0 0 0 0 0 0 141 0 6 0 8 5 1 0 1 0 2 1 0 0 242 0 0 0 2 1 1 0 0 0 1 0 0 043 0 1 1 0 1 1 0 0 0 0 0 0 044 0 2 1 0 0 0 1 0 0 2 0 0 045 0 0 0 1 0 2 0 0 0 0 1 0 046 0 1 0 1 0 0 0 1 0 0 0 0 047 0 0 0 2 2 2 0 1 0 0 0 0 048 0 0 0 1 1 0 0 0 0 0 0 0 049 0 0 0 2 1 0 0 3 0 0 0 0 050 0 0 0 0 0 0 0 0 1 0 0 0 051 0 2 0 1 1 1 0 0 0 0 0 0 052 0 1 0 1 6 1 1 1 0 0 0 0 0 153 0 0 0 0 3 2 0 0 0 0 2 0 054 0 1 0 1 0 0 0 0 0 0 0 0 0
Subtotal 10 60 13 178 148 56 16 22 22 36 67 13 3 644Total Across Years 3 64483 382 60 116
Reptiles- Amphibians1/ Birds2/ Small Mammals
Medium Mammals3/ Grand
TotalRoad
Location106958706666645298692009134974690154277845464372615172
1/ Reptiles/Amphibians does not include turtles (see main report for details on turtles). All mortalities but 1 (amphibian) were snakes. 2/ Birds. Swallows made up the greatest number (57) while blackbirds (41) and pheasants (30) were next abundant in mortality. 3/ Medium mammals includes badgers, skunks, canines, cats, weasels, muskrats. The majority of road mortalities in this category were muskrats
which accounted for 93 out of the 116 total. 4/ Large mammals consisted solely of deer species. This value may be low because deer could have been cleared from the road by transportation or
safety agencies before being counted.
C-2
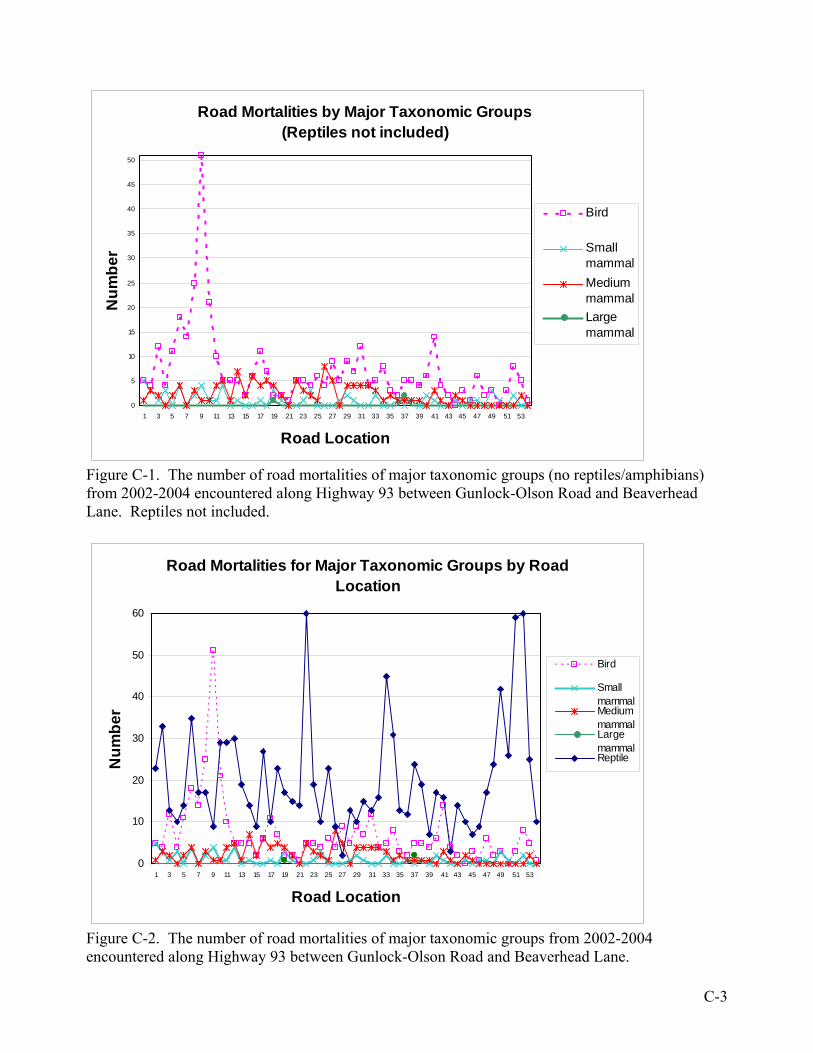
Road Mortalities by Major Taxonomic Groups (Reptiles not included)
0
5
10
15
20
25
30
35
40
45
50
1 3 5 7 9 11 13 15 17 19 21 23 25 27 29 31 33 35 37 39 41 43 45 47 49 51 53
Road Location
Num
ber
Bird
SmallmammalMediummammalLargemammal
Figure C-1. The number of road mortalities of major taxonomic groups (no reptiles/amphibians) from 2002-2004 encountered along Highway 93 between Gunlock-Olson Road and Beaverhead Lane. Reptiles not included.
Road Mortalities for Major Taxonomic Groups by Road Location
0
10
20
30
40
50
60
1 3 5 7 9 11 13 15 17 19 21 23 25 27 29 31 33 35 37 39 41 43 45 47 49 51 53
Road Location
Num
ber
Bird
SmallmammalMediummammalLargemammalReptile
Figure C-2. The number of road mortalities of major taxonomic groups from 2002-2004 encountered along Highway 93 between Gunlock-Olson Road and Beaverhead Lane.
C-3

150 copies of this public document were produced at an
estimated cost of $1.94 each, for a total cost of $290.68. This includes $120.84 for postage and $169.84 for printing.