postseismic deformation of the andaman islands following the 26
TRANSCRIPT

Postseismic deformation of the Andaman Islands following the
26 December, 2004 Great Sumatra–Andaman earthquake
J. Paul,1 A. R. Lowry,2 R. Bilham,3 S. Sen,4 and R. Smalley Jr.1
Received 20 June 2007; revised 20 August 2007; accepted 5 September 2007; published 13 October 2007.
[1] Two years after the Great Sumatra-Andamanearthquake the 3.1 m WSW coseismic displacement atPort Blair, Andaman Islands, had increased by 32 cm.Postseismic uplift initially exceeded 1 cm per week anddecreased to <1 mm/week. By 2007 points near Port Blairhad risen more than 20 cm, a 24% reversal of coseismicsubsidence. Uplift at eight GPS sites suggests a gradualeastward shift of the coseismic neutral axis separatingsubsidence from uplift. Simulations of the GPS postseismicdisplacements as viscoelastic relaxation of coseismic stresschange and as slip on the plate interface indicate that slipdown-dip of the seismic rupture dominates near-fielddeformation during the first two years. Postseismic slipbeneath the Andaman Islands released moment equivalentto a magnitude Mw � 7.5 earthquake, and the distributionsuggests deep slip in the stable frictional regime acceleratedto catch up to the coseismic rupture. Citation: Paul, J., A. R.
Lowry, R. Bilham, S. Sen, and R. Smalley Jr. (2007), Postseismic
deformation of the Andaman Islands following the 26 December,
2004 Great Sumatra–Andaman earthquake, Geophys. Res. Lett.,
34, L19309, doi:10.1029/2007GL031024.
1. Introduction
[2] The December 26th 2004, Mw = 9.3 Sumatra-Andaman earthquake ruptured 1600 km of subduction thrustat the east boundary of the Indian plate. In addition to severalmeters of southwestward coseismic displacement (Figure 1,inset), Global Positioning System (GPS) instruments mea-sured 60 cm of coseismic uplift at Diglipur in the NorthernAndaman Islands, 84 cm subsidence at Port Blair, 7 cmsubsidence at Havelock island, and 34 cm uplift at Hut Bay[Freymueller et al., 2007]. Remote sensing and visualinspection of shoreline changes provide evidence for bothuplift and subsidence, ranging from +40 to �70 cm, whichMeltzner et al. [2006] characterize as separated by a hingeline. Others have used the term pivot line. Because thecoseismic surface flexure is not truly a planar tilt, in thisarticle we refer to this line of zero uplift as a neutral axis.Postseismic processes discussed here have translated thisline eastward (Figure 1).[3] We collected GPS measurements of postseismic de-
formation at eleven sites in the Andaman Islands (Figures 1
and 2). We initiated continuous GPS recording at Port Blair(CARI) three weeks after the earthquake, Havelock (HAV2)in January 2007, and on Little Andaman (HUTB) inDecember 2006. Other sites were occupied for periods ofseveral days at intervals of several months. The data affordsufficient spatial and temporal sampling to characterizenear-field postseismic deformation.[4] Three deformation processes are likely candidates for
postseismic response to coseismic stress change: (1) poroe-lastic relaxation moderated by flow of interstitial fluids[Peltzer et al., 1998]; (2) viscoelastic relaxation of themantle [Rundle, 1978]; and (3) aseismic slip in velocity-strengthening frictional conditions [Tse and Rice, 1986].Surface deformation caused by these processes can looksimilar, such that the effects of one process may bemismodeled using the physics of another [Thatcher andRundle, 1979; Fialko, 2004]. Laboratory deformationexperiments leave little doubt that all three processescontribute to transient deformation after earthquakes, butthe relative contribution of each should depend on temporaland spatial scales of measurement. Where data are ade-quately sampled in both time and space, all three processesmay be required to fit the observations [Freed et al., 2006].However examples of great earthquake postseismic defor-mation sampled densely in both time and space are few.Consequently questions remain as to the roles of these threeprocesses in the earthquake cycle, and even whether theyplay a similar role on all fault zones or in subsequent eventson the same fault zone.[5] In this article we combine campaign and continuous
GPS data to examine end-member models of postseismicdeformation. The first two years of near-field Andamandeformation predominantly reflects postseismic slip down-dip of the coseismic rupture, consistent with simulations offrictional slip dynamics.
2. Data and Analysis
[6] GPS measurements were initiated at six sites (CARI,WNDR, HAVE, RUTL, RMNG and MHRT) within two tosix weeks after the earthquake. We collected three to fiveepochs of data at seven sites during the first two years(Figure 2). All of the campaign GPS monuments consist ofsteel pins drilled into rock. At continuous sites, monumentsconsist of 4 m concrete pillars that rise to 2 m above ground.At 2 m depth, the pillars are anchored to a 30 cm thick, 4 �4 m reinforced concrete foundation. Data analysis at theUniversity of Memphis used GAMIT/GLOBK. Twelveregional IGS sites were used to determine the ITRF2000reference frame.[7] In the first two years beginning 20 days after the
mainshock, station CARI moved 7.5 cm south, 31 cm west
GEOPHYSICAL RESEARCH LETTERS, VOL. 34, L19309, doi:10.1029/2007GL031024, 2007ClickHere
for
FullArticle
1Centre for Earthquake Research and Information, Memphis, Tennessee,USA.
2Department of Geology, Utah State University, Logan, Utah, USA.3Department of Geological Sciences, University of Colorado, Boulder,
Colorado, USA.4Society for Andaman and Nicobar Ecology, Middle Point, Port Blair,
India.
Copyright 2007 by the American Geophysical Union.0094-8276/07/2007GL031024$05.00
L19309 1 of 6
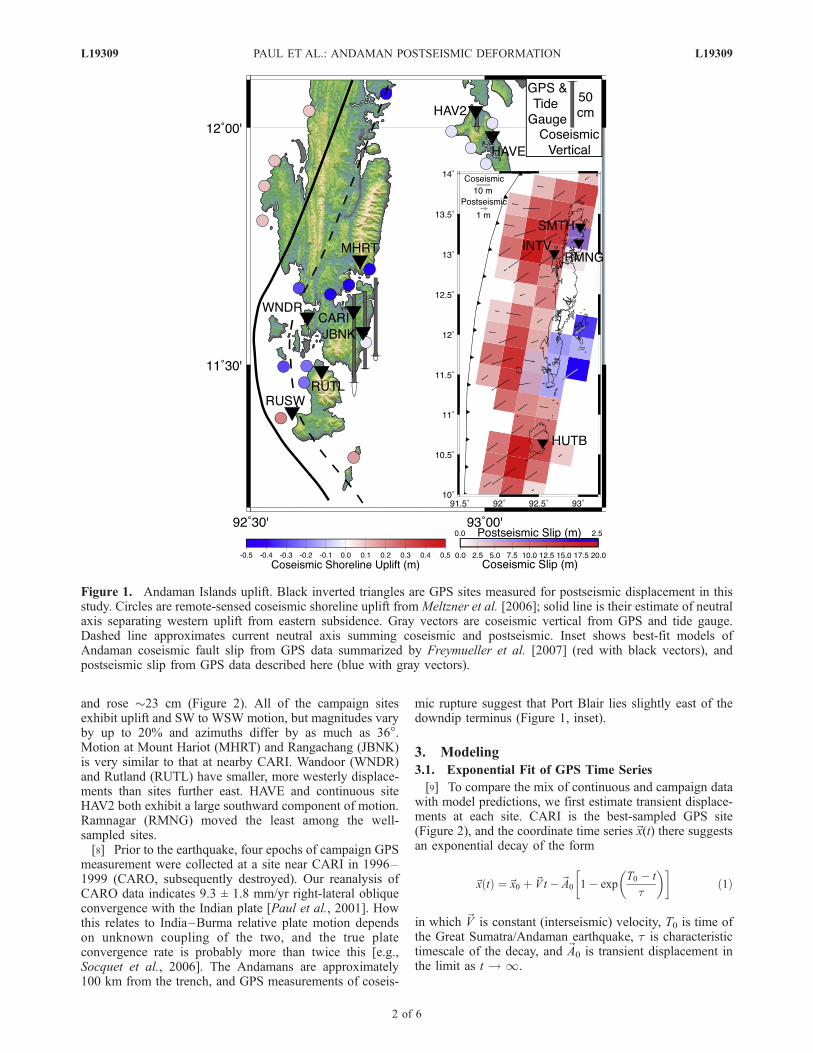
and rose �23 cm (Figure 2). All of the campaign sitesexhibit uplift and SW to WSW motion, but magnitudes varyby up to 20% and azimuths differ by as much as 36�.Motion at Mount Hariot (MHRT) and Rangachang (JBNK)is very similar to that at nearby CARI. Wandoor (WNDR)and Rutland (RUTL) have smaller, more westerly displace-ments than sites further east. HAVE and continuous siteHAV2 both exhibit a large southward component of motion.Ramnagar (RMNG) moved the least among the well-sampled sites.[8] Prior to the earthquake, four epochs of campaign GPS
measurement were collected at a site near CARI in 1996–1999 (CARO, subsequently destroyed). Our reanalysis ofCARO data indicates 9.3 ± 1.8 mm/yr right-lateral obliqueconvergence with the Indian plate [Paul et al., 2001]. Howthis relates to India–Burma relative plate motion dependson unknown coupling of the two, and the true plateconvergence rate is probably more than twice this [e.g.,Socquet et al., 2006]. The Andamans are approximately100 km from the trench, and GPS measurements of coseis-
mic rupture suggest that Port Blair lies slightly east of thedowndip terminus (Figure 1, inset).
3. Modeling
3.1. Exponential Fit of GPS Time Series
[9] To compare the mix of continuous and campaign datawith model predictions, we first estimate transient displace-ments at each site. CARI is the best-sampled GPS site(Figure 2), and the coordinate time series~x(t) there suggestsan exponential decay of the form
~x tð Þ ¼~x0 þ ~Vt �~A0 1� expT0 � t
t
� �� �ð1Þ
in which ~V is constant (interseismic) velocity, T0 is time ofthe Great Sumatra/Andaman earthquake, t is characteristictimescale of the decay, and ~A0 is transient displacement inthe limit as t ! 1.
Figure 1. Andaman Islands uplift. Black inverted triangles are GPS sites measured for postseismic displacement in thisstudy. Circles are remote-sensed coseismic shoreline uplift from Meltzner et al. [2006]; solid line is their estimate of neutralaxis separating western uplift from eastern subsidence. Gray vectors are coseismic vertical from GPS and tide gauge.Dashed line approximates current neutral axis summing coseismic and postseismic. Inset shows best-fit models ofAndaman coseismic fault slip from GPS data summarized by Freymueller et al. [2007] (red with black vectors), andpostseismic slip from GPS data described here (blue with gray vectors).
L19309 PAUL ET AL.: ANDAMAN POSTSEISMIC DEFORMATION L19309
2 of 6
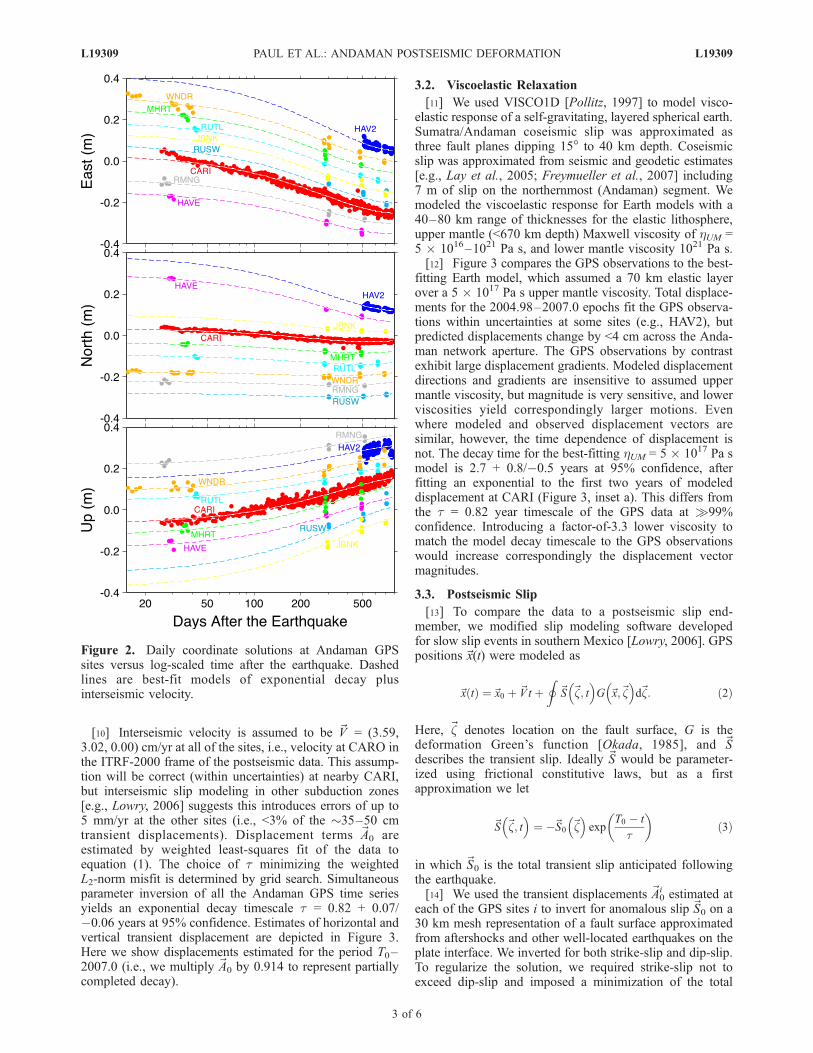
[10] Interseismic velocity is assumed to be ~V = (3.59,3.02, 0.00) cm/yr at all of the sites, i.e., velocity at CARO inthe ITRF-2000 frame of the postseismic data. This assump-tion will be correct (within uncertainties) at nearby CARI,but interseismic slip modeling in other subduction zones[e.g., Lowry, 2006] suggests this introduces errors of up to5 mm/yr at the other sites (i.e., <3% of the �35–50 cmtransient displacements). Displacement terms ~A0 areestimated by weighted least-squares fit of the data toequation (1). The choice of t minimizing the weightedL2-norm misfit is determined by grid search. Simultaneousparameter inversion of all the Andaman GPS time seriesyields an exponential decay timescale t = 0.82 + 0.07/�0.06 years at 95% confidence. Estimates of horizontal andvertical transient displacement are depicted in Figure 3.Here we show displacements estimated for the period T0–2007.0 (i.e., we multiply ~A0 by 0.914 to represent partiallycompleted decay).
3.2. Viscoelastic Relaxation
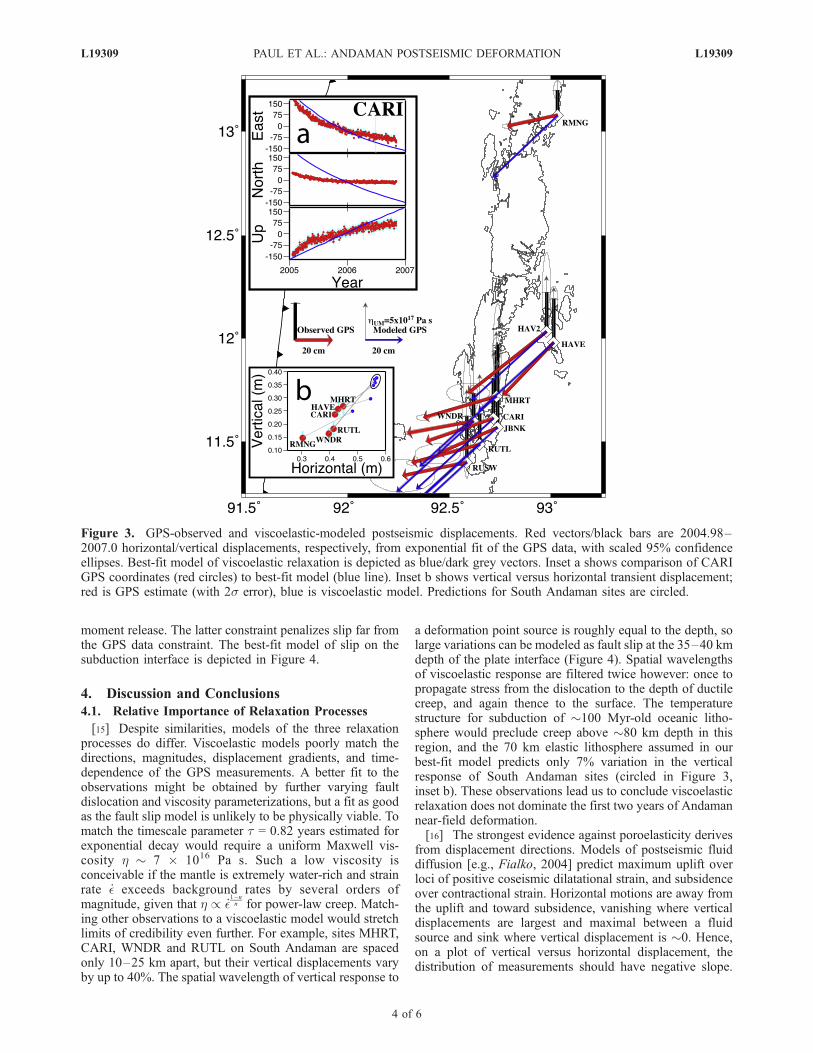
[11] We used VISCO1D [Pollitz, 1997] to model visco-elastic response of a self-gravitating, layered spherical earth.Sumatra/Andaman coseismic slip was approximated asthree fault planes dipping 15� to 40 km depth. Coseismicslip was approximated from seismic and geodetic estimates[e.g., Lay et al., 2005; Freymueller et al., 2007] including7 m of slip on the northernmost (Andaman) segment. Wemodeled the viscoelastic response for Earth models with a40–80 km range of thicknesses for the elastic lithosphere,upper mantle (<670 km depth) Maxwell viscosity of hUM =5 � 1016–1021 Pa s, and lower mantle viscosity 1021 Pa s.[12] Figure 3 compares the GPS observations to the best-
fitting Earth model, which assumed a 70 km elastic layerover a 5 � 1017 Pa s upper mantle viscosity. Total displace-ments for the 2004.98–2007.0 epochs fit the GPS observa-tions within uncertainties at some sites (e.g., HAV2), butpredicted displacements change by <4 cm across the Anda-man network aperture. The GPS observations by contrastexhibit large displacement gradients. Modeled displacementdirections and gradients are insensitive to assumed uppermantle viscosity, but magnitude is very sensitive, and lowerviscosities yield correspondingly larger motions. Evenwhere modeled and observed displacement vectors aresimilar, however, the time dependence of displacement isnot. The decay time for the best-fitting hUM = 5 � 1017 Pa smodel is 2.7 + 0.8/�0.5 years at 95% confidence, afterfitting an exponential to the first two years of modeleddisplacement at CARI (Figure 3, inset a). This differs fromthe t = 0.82 year timescale of the GPS data at �99%confidence. Introducing a factor-of-3.3 lower viscosity tomatch the model decay timescale to the GPS observationswould increase correspondingly the displacement vectormagnitudes.
3.3. Postseismic Slip
[13] To compare the data to a postseismic slip end-member, we modified slip modeling software developedfor slow slip events in southern Mexico [Lowry, 2006]. GPSpositions~x(t) were modeled as
~x tð Þ ¼~x0 þ ~Vt þI
~S ~z; t� �
G ~x;~z� �
d~z: ð2Þ
Here, ~z denotes location on the fault surface, G is thedeformation Green’s function [Okada, 1985], and ~Sdescribes the transient slip. Ideally ~S would be parameter-ized using frictional constitutive laws, but as a firstapproximation we let
~S ~z; t� �
¼ �~S0 ~z� �
expT0 � t
t
� �ð3Þ
in which ~S0 is the total transient slip anticipated followingthe earthquake.[14] We used the transient displacements ~A0
i estimated ateach of the GPS sites i to invert for anomalous slip ~S0 on a30 km mesh representation of a fault surface approximatedfrom aftershocks and other well-located earthquakes on theplate interface. We inverted for both strike-slip and dip-slip.To regularize the solution, we required strike-slip not toexceed dip-slip and imposed a minimization of the total
Figure 2. Daily coordinate solutions at Andaman GPSsites versus log-scaled time after the earthquake. Dashedlines are best-fit models of exponential decay plusinterseismic velocity.
L19309 PAUL ET AL.: ANDAMAN POSTSEISMIC DEFORMATION L19309
3 of 6
moment release. The latter constraint penalizes slip far fromthe GPS data constraint. The best-fit model of slip on thesubduction interface is depicted in Figure 4.
4. Discussion and Conclusions
4.1. Relative Importance of Relaxation Processes
[15] Despite similarities, models of the three relaxationprocesses do differ. Viscoelastic models poorly match thedirections, magnitudes, displacement gradients, and time-dependence of the GPS measurements. A better fit to theobservations might be obtained by further varying faultdislocation and viscosity parameterizations, but a fit as goodas the fault slip model is unlikely to be physically viable. Tomatch the timescale parameter t = 0.82 years estimated forexponential decay would require a uniform Maxwell vis-cosity h � 7 � 1016 Pa s. Such a low viscosity isconceivable if the mantle is extremely water-rich and strainrate _� exceeds background rates by several orders ofmagnitude, given that h / _�
1�nn for power-law creep. Match-
ing other observations to a viscoelastic model would stretchlimits of credibility even further. For example, sites MHRT,CARI, WNDR and RUTL on South Andaman are spacedonly 10–25 km apart, but their vertical displacements varyby up to 40%. The spatial wavelength of vertical response to
a deformation point source is roughly equal to the depth, solarge variations can be modeled as fault slip at the 35–40 kmdepth of the plate interface (Figure 4). Spatial wavelengthsof viscoelastic response are filtered twice however: once topropagate stress from the dislocation to the depth of ductilecreep, and again thence to the surface. The temperaturestructure for subduction of �100 Myr-old oceanic litho-sphere would preclude creep above �80 km depth in thisregion, and the 70 km elastic lithosphere assumed in ourbest-fit model predicts only 7% variation in the verticalresponse of South Andaman sites (circled in Figure 3,inset b). These observations lead us to conclude viscoelasticrelaxation does not dominate the first two years of Andamannear-field deformation.[16] The strongest evidence against poroelasticity derives
from displacement directions. Models of postseismic fluiddiffusion [e.g., Fialko, 2004] predict maximum uplift overloci of positive coseismic dilatational strain, and subsidenceover contractional strain. Horizontal motions are away fromthe uplift and toward subsidence, vanishing where verticaldisplacements are largest and maximal between a fluidsource and sink where vertical displacement is �0. Hence,on a plot of vertical versus horizontal displacement, thedistribution of measurements should have negative slope.
Figure 3. GPS-observed and viscoelastic-modeled postseismic displacements. Red vectors/black bars are 2004.98–2007.0 horizontal/vertical displacements, respectively, from exponential fit of the GPS data, with scaled 95% confidenceellipses. Best-fit model of viscoelastic relaxation is depicted as blue/dark grey vectors. Inset a shows comparison of CARIGPS coordinates (red circles) to best-fit model (blue line). Inset b shows vertical versus horizontal transient displacement;red is GPS estimate (with 2s error), blue is viscoelastic model. Predictions for South Andaman sites are circled.
L19309 PAUL ET AL.: ANDAMAN POSTSEISMIC DEFORMATION L19309
4 of 6

Inset b of Figures 3 and 4 exhibits a positive slopedistribution.[17] Although fault slip apparently dominates the Anda-
man Islands postseismic response, both viscoelastic andporoelastic processes must contribute. Viscoelastic model-ing using reasonable viscosity structures predict displace-ments of up to 8 cm during the 2004.98–2007.0 epoch.Models of poroelastic response to earthquakes elsewherealso predict displacements of order several cm [e.g., Fialko,2004]. Hence, one reasonably might expect up to 25% errormodeling the deformation as pure fault slip. Inspection ofresiduals at IGS sites used in our analysis suggest anadditional 3% error in realization of the reference frame,related to large-scale postseismic deformation. Separatingthese effects will require additional data that sample thediffering temporal and spatial scales of the three processes,and future efforts will address this.
4.2. Implications of the Slip Model
[18] We modeled ten coseismic GPS vectors summarizedby Freymueller et al. [2007] using a minimum-moment
constraint. The best-fit estimate of slip averaged 9.8 mwithin a rupture zone averaging about 90 km width(Figure 1, inset). The corresponding coseismic momentrelease for the 500 km Andaman segment is equivalentMw = 8.6, comparable to the Freymueller et al. [2007] Mw =8.5 estimate in five rectangular dislocation patches, and alsoconsistent with the Mw = 8.6 estimate from seismic dataafter combining the rapid (1–2 m in the first ten minutes)and slow (5 m over the next hour) slip averaged over a160 km width [Lay et al., 2005].[19] Despite possible contamination by other processes,
the postseismic slip model is intriguing. The minimum-moment constraint images slip only where data are avail-able, but there the slip magnitude and relative contributionof strike slip increase with depth. Slip vectors at depthmirror the surface GPS displacements, which are smallerand more trench-normal at western sites (Figure 4). Post-seismic moment release is equivalent to a Mw � 7.5earthquake, or about 10% of coseismic, and is probably
Figure 4. Andaman data modeled as slip on the subduction thrust. Red vectors are 2004.98–2007.0 displacements fromexponential fit of the GPS data, with scaled 95% confidence ellipses. Blue vectors are the best-fit model of postseismic slip.Red patches with thin black vectors indicate the magnitude and direction of modeled slip. Inset a shows comparison ofCARI GPS coordinates (red circles) to best-fit model (blue line). Inset b shows vertical versus horizontal transientdisplacement; red is GPS estimate (with 2s error), blue is slip model. Dashed line schematically shows negative slope ofporoelastic response.
L19309 PAUL ET AL.: ANDAMAN POSTSEISMIC DEFORMATION L19309
5 of 6

larger given that a small fraction of the Andaman segment issampled by data presented here.[20] Postseismic slip overlaps slightly with the coseismic
slip estimate (Figure 1, inset), but most of the momentrelease is further downdip. This pattern mirrors simulationsof coseismic and postseismic slip in elastodynamic modelsof rate- and state-dependent friction [e.g., Lapusta et al.,2000], in which slip deficit accumulates in velocity-strengthening conditions during interseismic periods andcatches up to coseismic slip over several years’ time.Andaman data prior to 2004 are insufficient to assessinterseismic coupling where we now identify postseismicslip. However modeling of interseismic slip and stress ratesfrom GPS data at the Cocos-North America subductionboundary suggests locking above the frictional transitionbuffers stress accumulation in the shallow velocity-strengthening regime [Lowry, 2006], thus enabling slipdeficit to accumulate that can drive slip following anearthquake.
[21] Acknowledgments. We thank V. K. Gaur (Indian Institute ofAstrophysics), Samir Acharya (Society of Andaman and Nicobar Ecology)and T. V. R. S. Sharma (Central Agricultural Research Institute) for theirpartnership in this project. We also thank Anjan Battacharya for obtainingpermission to set up GPS site CARI, and Tom Herring for help and adviceon GAMIT processing. This paper was improved by thoughtful suggestionsof reviewers Cristophe Vigny and Fred Pollitz. CERI publication 517.Support for this research was provided by NSF grants EAR-0523319 andEAR-0537559.
ReferencesFialko, Y. (2004), Evidence of fluid-filled upper crust from observations ofpostseismic deformation due to the 1992 Mw7.3 Landers earthquake,J. Geophys. Res., 109, B08401, doi:10.1029/2004JB002985.
Freed, A. M., R. Brgmann, E. Calais, J. Freymueller, and S. Hreinsdttir(2006), Implications of deformation following the 2002 Denali, Alaska,earthquake for postseismic relaxation processes and lithospheric rheol-ogy, J. Geophys. Res., 111, B01401, doi:10.1029/2005JB003894.
Freymueller, J. T., A. Shuler, C. P. Rajendran, A. Earnest, and K. Rajendran(2007), Coseismic and preseismic displacements in the Andaman and
Nicobar islands, and implications for the regional tectonics, Bull. Seismol.Soc. Am., in press.
Lapusta, N., J. R. Rice, Y. Ben-Zion, and G. Zheng (2000), Elastodynamicanalysis for slow tectonic loading with spontaneous rupture episodes onfaults with rate- and state-dependent friction, J. Geophys. Res., 105,23,765–23,789.
Lay, T., et al. (2005), The great Sumatra-Andaman earthquake of26 December 2004, Science, 308(5725), 1127–1133.
Lowry, A. R. (2006), Resonant slow fault slip in subduction zones forcedby climatic load stress, Nature, 442(7104), 802–805.
Meltzner, A. J., K. Sieh, M. Abrams, D. C. Agnew, K. W. Hudnut, J.-P.Avouac, and D. H. Natawidjaja (2006), Uplift and subsidence associatedwith the great Aceh-Andaman earthquake of 2004, J. Geophys. Res., 111,B02407, doi:10.1029/2005JB003891.
Okada, Y. (1985), Surface deformation due to shear and tensile faults in ahalf-space, Bull. Seismol. Soc. Am., 75, 1135–1154.
Paul, J., et al. (2001), The motion and active deformation of India, Geophys.Res. Lett., 28(4), 647–650.
Peltzer, G., P. Rosen, F. Rogez, and K. Hudnut (1998), Poroelastic reboundalong the Landers 1992 earthquake surface rupture, J. Geophys. Res.,103, 30,131–30,145.
Pollitz, F. F. (1997), Gravitational-viscoelastic postseismic relaxation on alayered spherical Earth, J. Geophys. Res., 102, 17,921–17,941.
Rundle, J. B. (1978), Viscoelastic crustal deformation by finite, quasi-staticsources, J. Geophys. Res., 83, 5937–5945.
Socquet, A., C. Vigny, N. Chamot-Rooke, W. Simons, C. Rangin, andB. Ambrosius (2006), India and Sunda plates motion and deformationalong their boundary in Myanmar determined by GPS, J. Geophys. Res.,111, B05406, doi:10.1029/2005JB003877.
Thatcher, W., and J. B. Rundle (1979), A model for the earthquake cycle inunderthrust zones, J. Geophys. Res., 84, 5540–5556.
Tse, S. T., and J. R. Rice (1986), Crustal earthquake instability in relation-ship to the depth variation of frictional slip properties, J. Geophys. Res.,91, 9452–9472.
�����������������������R. Bilham, Department of Geological Sciences, University of Colorado,
Boulder, CO 80309-0399, USA. ([email protected])A. R. Lowry, Department of Geology, Utah State University, Logan, UT
84322-4505, USA. ([email protected])J. Paul and R. Smalley Jr., Centre for Earthquake Research and
Information, 3876 Central Ave., Memphis, TN 38152, USA. ([email protected]; [email protected])S. Sen, Society for Andaman and Nicobar Ecology, Port Blair 744101,
India. ([email protected])
L19309 PAUL ET AL.: ANDAMAN POSTSEISMIC DEFORMATION L19309
6 of 6