postpartum ultrasound - diva portal170138/fulltext01.pdf · iii mulic-lutvica a. and axelsson o....
TRANSCRIPT

ACTAUNIVERSITATISUPSALIENSISUPPSALA2007
Digital Comprehensive Summaries of Uppsala Dissertationsfrom the Faculty of Medicine 254
Postpartum Ultrasound
AJLANA MULIC-LUTVICA
ISSN 1651-6206ISBN 978-91-554-6873-6urn:nbn:se:uu:diva-7830


”Med varje steg framåt,
med varje nytt problem vi löser,
upptäcker vi inte bara nya och olösta problem,
utan vi upptäcker också
att där vi trodde att vi stod på fast och säker mark
är allting i själva verket osäkert och flytande”.
Karl R. Popper
To my family: an inexhaustible source of energy.

Cover: made by N. Lutvica. From “Labor and puerperium” A.M-Lutvica and O. Axelsson In The Textbook of Perinatal Medicine 2nd Edition 2005; Editors A. Kurjak and F. Chervenak. With kind permission of the Informa Healthcare UK, 2007

LIST OF PAPERS
This thesis is based on the following papers, which are referred to in the text by their Roman numerals
I Mulic-Lutvica A, Bekuretzion M, Bakos O and Axelsson O. Ultrasonic evaluation of the uterus and uterine cavityafter normal, vaginal delivery. Ultrasound Obstet Gynecol 2001;18:491-498
II Mulic-Lutvica A. and Axelsson O. Ultrasound finding of an echogenic mass in women with secondary postpartum hemorrhage is associated with retained placental tissue. Ultrasound Obstet Gynecol 2006;28:312-319
III Mulic-Lutvica A. and Axelsson O. Postpartum ultrasound in women with postpartum endometritis, after cesarean sec-tion and after manual evacuation of the placenta. Acta Obstet Gynecol Scand, 2007;86:210-217
IV Mulic-Lutvica A. Eurenius K. and Axelsson O.Longitudinal study of Doppler flow resistance indices of the uterine arteries after normal vaginal delivery.Submitted for publication.
V Mulic-Lutvica A. Eurenius K. and Axelsson O. Uterine artery Doppler ultrasound in postpartum women withretained placental tissue.Manuscript
Reprints were made by kind permission from the publishers.


CONTENTS
INTRODUCTION 11General Background 11
Physiology of Normal Puerperium 12Patophysiology of the Puerperium 14
Ultrasound findings of the Normal Puerperium 15Gray-scale Ultrasound 16Doppler Ultrasound 16
Ultrasound findings after caesarean section 17Ultrasound findings associated with postpartum complications 18
Retained placental tissue - Gray scale US 18Retained placental tissue – Doppler US 18Postpartum endometritis 19Manual evacuation of the placenta 19
Ethical considerations 19
AIMS OF THE STUDIES 21
MATERIAL AND METHODS 22Population, study settings and design 23Normal Puerperium (Study I and IV) 24
Gray-scale Ultrasound (Study I) 24Doppler Ultrasound (Study IV) 25
Pathological Puerperium (Study II, III and V) 27Retained placental tissue - Gray-scale Ultrasound (Study II) 27Endometritis, Cesarean section and Manual evacuation of the placenta, Gray-scale Ultrasound (Study III) 28
Statistical analysis 30
RESULTS 32Normal puerperium - Gray-scale Ultrasound 32Study I 32Pathological puerperium - Gray-scale Ultrasound 36Study II 36Study III 39

Normal puerperium - Doppler Ultrasound 41Study IV 41Pathological puerperium - Doppler Ultrasound 44Study V 44
DISCUSSION 49General discussion 49Study I 49Study II 54Study III 57Study IV 58Study V 62Methodological considerations and limitations of the study 63Strengths of the study 65Clinical implications 66
CONCLUSIONS 67
ACKNOWLEDGEMENTS 68
REFERENCES 72

ABBREVIATIONS
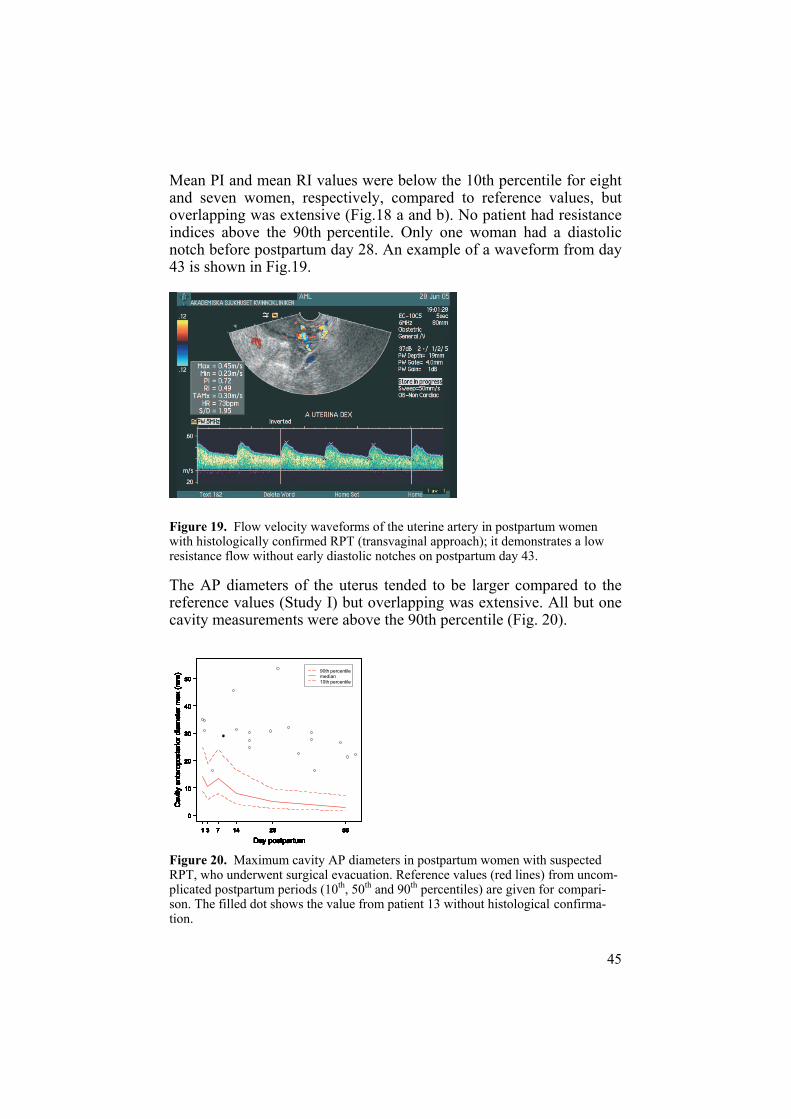
US Ultrasound AP Anteroposterior RPT Retained placental tissue SPH Secondary postpartum hemor-
rhagePPH Primary postpartum hemorrhage CS Cesarean section PI Pulsatility index RI Resistance index CEMD Confidential enquiry into maternal
deathAV Arteriovenous malformation TA Transabdominal TV Transvaginal SE Sensitivity SP Specificity PPV Positive predictive value NPV Negative predictive value FPR False positive rate FNR False negative rate


11
INTRODUCTION
General Background
The puerperium is defined as the period 6–8 weeks after birth. Pri-mary and secondary postpartum hemorrhage and postpartum septic endometritis are among the major causes of maternal mortality and morbidity. In the last triennial report “Why Mothers Die 2000 - 2002” (CEMD report) in the United Kingdom, 10 of the 17 maternal deaths were due to postpartum hemorrhage.
Retained placental tissue (RPT) in the uterine cavity postpartum is associated with a high risk of excessive bleeding. Primary postpartum hemorrhage (PPH), defined as hemorrhage within the first 24 hours postpartum (Dewhurst, 1966), requires manual or instrumental evacuation of the uterine cavity and the diagnosis is clinical. Secon-dary postpartum hemorrhage (SPH), defined as any abnormal bleeding from the uterus occurring between 24 hours and 12 weeks postpartum (Rome, 1975), is also a major threat to mothers, but its invasive treat-ment also carries a risk of complications. In developing countries, SPH is still a major contributor to maternal death (Alexander et al, 2002; Hoveyda and MacKenzie, 2001). In developed countries, more than half of women admitted to hospital with SPH undergo uterine surgical evacuation (Rome, 1975; King et al, 1989; Hoveyda and MacKenzie, 2001; Alexander et al, 2002). Histological confirmation of RPT is obtained in only 30-50% of these cases. Moreover, puer-peral curettage may traumatise the uterine wall and provoke additional bleeding, which can be life-threatening and require hysterectomy. Per-foration of the uterus after curettage occurs in 3% and hysterectomy in about 1% (Hoveyda and MacKenzie, 2001). A recently published audit of 200 cases concerning puerperal curettage (Pather et al, 2005)showed that 8.5% of patients experienced major morbidity and 7% required a repeat procedure with further morbidity. Several predispos-ing factors for SPH have been established: prolonged third stage of labor (Lester, 1956), incomplete placenta and/or membranes passed at

12
birth (Dewhurst, 1966; Rome, 1975), PPH (Rome, 1975) and maternal smoking (Marchant, 1999).
In addition to immediate complications, late sequelae related to surgi-cal treatment of SPH may influence the reproductive health of women. If curettage damages the endometrium 1 to 4 weeks post partum, the endometrium may fail to regenerate, leading to Asherman’s syndrome (Jensen and Stromme, 1972). Westendorp et al. (1998) prospectively examined 50 women undergoing either a repeat removal of placental remnants after delivery or a repeat curettage for incomplete abortion. At a later hysteroscopy, 20 out of 50 (40%) women had intrauterine adhesions. The prevalence of Asherman’s syndrome is 2% after man-ual evacuation of the placenta but 37.5% after postpartum curettage (Westendorp et al, 1998). More recently, an update on intrauterine adhesions has been published and the importance of prevention has been emphasized (Al-Inany, 2001).
In a Cochrane Review, Alexander et al. (2002) identified 45 papers on the management of SPH and concluded that little information is avail-able from randomized trials to guide clinicians in the management of this condition. Since the causes of SPH may vary the best treatment options should be chosen according to the underlying cause of bleed-ing. However, an essential problem is that the underlying cause of SPH often is unknown and that clinical or ultrasonic diagnosis of RPT, which is the indication for surgical treatment, is still a contro-versial issue.
It would be useful to know the normal US appearance of the uterus throughout the entire puerperal period in order to improve our ability to distinguish puerperal pathology from normal conditions and thus avoid unnecessary invasive procedures. Moreover, the knowledge obtained through US examinations can help us to better understand the physiology of the puerperium.
Physiology of Normal Puerperium
During the 6-8 weeks of normal puerperium the reproductive tract anatomically and physiologically returns to the non-pregnant state. When the infant has been born and the placenta expelled, two physio-logical lifesaving processes occur: myotamponade (compression of the vessels by myometrial contraction) and thrombotamponade (en-

13
hanced blood clotting activity). The aim of these initial processes, known as the “physiological sutures” or “living ligatures” (Baskett, 2000), is to prevent blood loss from the torn vessels of the placental bed. A main characteristic of the puerperium is the involution of the uterus, an extremely dynamic process of physiological transformation of the uterus involving the myometrium, decidua and uterine arteries. The uterine dimensions diminish progressively and substantially dur-ing the puerperium so that the uterus, weighing more than 1 kg soon after delivery, weighs only 80g at the end of the puerperium (Hytten, 2001). Concomitant with the changes of the uterus, the uterine cavity with the placental bed goes through a marked process of involution. The decidua is divided into a basal, a spongy and a superficial layer. The separation of the placenta and membranes generally occurs in the spongy layer, although the level varies (Williams 1931). Already in 1931 Williams wrote concerning the line of separation of the placenta and membranes:
“While separation generally occurs in the spongy layer, the line is very irregular so that in places a thick layer of decidua is re-tained, in others only a few layers of cells remain, while in still others the muscularis is practically bare” .
The initially remaining spongy and superficial layers of the decidua, including uteroplacental decidual arteries often infiltrated with blood, undergo necrosis and are cast off. The basal layer close to the myo-metrium remains in the cavity and serves as a cell source from which a new endometrium is regenerated. As evidenced by endometrial bi-opsies, the endometrium is fully restored by the 16th day post partum (Sharman, 1953). Complete disappearance of the placental site, how-ever, takes up to 6 weeks (Williams, 1931). Moreover, the duration of puerperal lochia may be up to 60 days in 13% of women (Oppen-heimer, 1986). Similarly, in a recently published study on the duration of postpartum bleeding among 477 breast-feeding women it was re-ported that the median duration of lochia was 27 days with a range of 5-90 days (Visness et al, 1997). Only 15 % of the women reported that their lochia had stopped within 2 weeks post partum. Visness et al. (1997) also pointed out that bleeding associated with the postpartum healing process commonly stops and starts again.So, the normal physiological time span for the placental site to recover is probably 4-6 and not 2 weeks as often believed.
Frank Hytten has described deeper mystical significance of the figure 40 days, the time during which the woman was considered “unclean”:

14
“Orthodox Russians believed that soul was judged 40 days after death, and the Bible abounds with examples: Noah’s flood; the time Moses spent in the mountains; the embalming of Jacob; the time spent by the heads of the children of Israel spying out the land of Canaan; Moses lying before the Lord; the time the food lasted Elijah on the journey to Mount Horeb; the time Jesus fasted; the time in the wilderness and the 40 days between the Passion and the Ascension, among others. Even the number of days patients with infectious diseases should be isolated (quar-antine), not to mention Ali Baba’s 40 thieves, 40 winks and the 40 years at which life is said to begin. Even more bizarre are the wide spread differences observed for “uncleanness” which de-pend on the sex of the child. The Hippocratic School believed that purification required 30 days after the birth of a son, but 40 days after a daughter.”
During normal pregnancy a large network of new vessels in the uterus is created by a direct angiogenic effect of human chorionic gonadotro-phin, hCG (Zygmunt, 2003). Moreover, the existing uterine vessels dilate and allow a substantial increase in blood flow to meet the in-creased requirements of the fetus and placenta (Brosens et al, 1967; Andrew et al, 1989). These physiological changes of maternal spiral arteries occur by cytotrophoblastic invasion of the placental bed, which destroys and replaces their media layer (Brosens et al, 1967; Andrew et al, 1989). As a result, first the intradecidual and later the intramyometrial portions of the spiral arteries convert to non-muscular, dilated, low-resistance uteroplacental vessels with markedly increased blood flow. Consequently, dramatic regressive changes must occur after delivery. From histological studies we know that normal involuted placental bed is characterized by a disappearance of trophoblasts and completely thrombosed spiral arteries (Andrew et al, 1989; Khong and Khong, 1993).
Patophysiology of the Puerperium
Normal detachment of the placenta requires the presence of a normal spongy decidua vera, where shearing of the placenta from the myo-metrium occurs. Defective decidua, which can be scanty or completely absent in some women, is a predisposing factor for abnormal attach-ment of the placenta, implying abnormal growth into the myometrium, and thus even for RPT in forthcoming pregnancies (Williams, 1931).Necrosis and deposition of fibrin in RPT can form a “placental polyp”, which is usually larger than the placental remnant.

15
Carlan (Carlan et al, 1997) performed manual exploration of the cav-ity in 131 asymptomatic women 5 min after placental delivery and within 2 minutes after an US examination. They found that 24 of 131(18.8%) women had documented evidence of RPT. This is a sur-prisingly high figure compared to Jones et al, (1966) who performed manual intrauterine explorations routinely after 1000 births and re-moved placental fragments or bits of membranes in only 2.4% of cases. In a study of 24750 deliveries, clinically significant RPT requir-ing manual evacuation was found in 0.6% of the women (Tandberg et al, 1999).
Suspicion of RPT usually arises when SPH, lower abdominal pain and/or postpartum fever occur or if an incomplete placenta is sus-pected at delivery (Andrew et al, 1989; Khong and Khong, 1993).SPH occurs in 1-2 % of deliveries (Dewhurst 1975; Rome, 1975; Kinget al, 1989; Hoveyda and MacKenzie, 2001). The most common causes of SPH are RPT, abnormal involution of the placental site in the uterine cavity, and endometritis. Subinvolution of the placental bed in the absence of RPT or endometritis is a distinctive entity, char-acterized by widely distended spiral arteries, only partly occluded by thrombosis. The diagnosis, however, requires histological examination and clinically it is a diagnosis of exclusion.
Vascular abnormalities of the uterus have recently been described as possibly more common causes of severe SPH than previously thought (Kelly et al, 2003; Müngen et al, 1997; Timmerman et al, 2000; 2003). True arteriovenous (AV) malformations are rare errors of mor-phogenesis, which do not regress spontaneously (Müngen, 2003). Ac-quired AV abnormalities are associated with trauma after previous intrauterine procedures, RPT, infection or malignancy (Zimon et al, 1999; Wald, 2003; Aziz et al, 2004; Wong et al, 2005). It has been hypothesised that some viable trophoblast cells may remain in “pla-cental polyps”, and vessels below the RPT may show persistent dilata-tion (Khong and Khong, 1993).
Ultrasound findings of the Normal Puerperium
Our knowledge about postpartum changes in the uterus has mainly been based on clinical examinations as well as on histological studies from the end of the 19th century and the early part of the 20th century when maternal death during the puerperium was commonplace (Hyt-ten, 1996). The involution of the uterus, as a main characteristic of the

16
puerperium was previously assessed by palpation of the fundal height, which can be imprecise in obese women and in women with uterine myoma (Beazley and Underhill, 1970).
Gray-scale Ultrasound
Since the introduction of US in clinical practice by Ian Donald et al. in 1958, the uterus became one of the first organs to be examined. How-ever, few studies have focused on US investigations during the puer-perium and results of published studies are not unambiguous. The ma-jor disadvantages of published studies from the 1970s are that old scanners with poor image resolution were used (Robinson, 1972; Mal-vern et al, 1973; Szoke and Kiss, 1976; Defoort et al, 1976). The ac-curate timing of measurements was not always specified (Defoort etal, 1978; Lee et al, 1981). Pathological conditions were evaluated without knowledge of US images of the normal puerperal uterus (Rob-inson, 1972; Malvern et al, 1973; Rodeck and Newton, 1976). Most studies from the 1980s were cross-sectional and the examinations were most often restricted to the early puerperium (Lee et al, 1981; Van Rees et al, 1981; Madrazo, 1985). Data are also conflicting about the best indicator of the involution process. Length (Szoke and Kiss, 1976; Defoort et al, 1976; Lee et al, 1981; Van Rees et al, 1981; Lav-ery and Shaw, 1991; Tekay and Jouppila, 1993), width (Lee et al, 1981; Van Rees et al, 1981; Wachsberg et al, 1994), AP diameter (Defoort et al, 1976; Lavery and Shaw, 1991; Wachsberg et al, 1994, Sokol et al, 2004), area (Van Rees et al, 1981) and volume (Edwards and Ellwood, 2000) of the uterus have all been used, as well as thick-ness of the uterine wall (Lee et al, 1981; Madrazo, 1985). As regards the uterine cavity, there is a notable lack of studies during the normal puerperium and the results from the few studies are contradictory (Madrazo, 1985; Lavery and Shaw, 1991; Edwards and Ellwood, 2000; Sokol et al, 2004).
Doppler Ultrasound
Doppler ultrasound has been used to measure flow resistance indices of the uterine arteries during the normal menstrual cycle (Long et al, 1989; Steer et al, 1990; Bernstein et al, 2002), during both normal (Bernstein et al, 2002; Campbell et al, 1983; Deutinger et al, 1988; Schulman et al, 1986; Baumann et al, 1988) and pathological preg-nancies (Harrington et al, 1991; 1996) and during labor (Janbu et al,

17
1985; 1987, Brar et al, 1988). High diastolic flow velocities in com-bination with a disappearance of the early diastolic notch are the main characteristics of the uterine artery Doppler flow pattern from gesta-tional week 20-26. They reflect the physiological conversion from a high (non-pregnant) to a low (pregnant) resistance state (Campbell et al, 1983; Schulman et al, 1986; Deutinger et al, 1988; Bernstein et al, 2002). How rapidly these physiological changes return to the non-pregnant state is a controversial issue.A small number of Doppler US studies has been published regarding the hemodynamic events that occur during the puerperium, and the results have been contradictory (Bauman et al, 1988; Kirkinen et al, 1988; Hata et al, 1988; Tekay and Jouppila, 1993; Jaffa et al, 1996).
By colour Doppler, a hypervascular area with turbulent flow at the implantation site representing the “peritrophoblastic flow” (Laing and Frates, 2000; Zygmunt, 2003) is observed in early pregnancy. Doppler studies of the post-abortion appearance of the uterus showed that the hypervascularity disappears gradually and its regression is prolonged in the presence of retained products of conception (Laing and Frates, 2000). Numerous papers about this hypervascular area have recently been published but only one focused on colour Doppler during the normal puerperium (Van Schoubreck et al, 2004). There is confusion as to how US findings of such a hypervascular area should be inter-preted as this area was observed in both normal and pathological pu-erperium.
Ultrasound findings after caesarean section
During the last ten years the CS rate has been steadily rising and we can expect more placental complications in forthcoming years (Zelopand Heffner, 2004). Caesarean section (CS) is one of the leading pre-disposing factors for puerperal endometritis (Stovall et al, 1998). The involution of the uterus after CS has been studied but the results are inconclusive (Meyenburg et al, 1983; Negishi et al, 1999; Shalev et al, 2002). The majority of published studies were related to postoperative complications (Baker et al, 1984; Lavery et al, 1985; Deutchman and Hartmann, 1993). The US appearance of the uterine wound after CS has been sparsely studied (Burger et al, 1983; Kousougeras et al, 2003, Yazicioglu et al 2006).
18
Ultrasound findings associated with postpartum complications
Retained placental tissue - Gray scale US
In patients with SPH, ultrasound should help verify or rule out RPT. Robinson and Malvern published the first descriptions of US images of RPT in 1972 and 1973, respectively. These studies were performed with old compound US equipment and showed a high rate of false-positive diagnoses. Similar results have been obtained with modern US equipment. Published studies have demonstrated a varying sensi-tivity (42-94%) and specificity (62-92%) for Gray-scale US diagnosis of RPT (Lee et al, 1981; Hertzberg and Bowie, 1991; Neill et al, 2002; Ben-Ami et al, 2005; Durfee et al, 2005). As echogenic masses have been found in asymptomatic women (Edwards and Ellwood, 2000; Sokol et al, 2004) the previously held opinion that an echogenic mass in the cavity represents RPT responsible for postpartum bleeding (Malvern et al, 1973; Lee et al, 1981; Hertzberg and Bowie, 1991; Carlan et al, 1997) has been challenged. Moreover, in the majority of studies, distinction between an echogenic mass and a mixed echo pat-tern is not well established and there is confusion as to how ultrasound images of the intracavitary content should be described.
Retained placental tissue – Doppler US
The physiological involution of the uterus postpartum, involving the uterine arteries and their branches at the placental site, may be delayed in the presence of RPT in the uterine cavity (Brosens et al, 1967; An-drew et al, 1989; Khong and Khong, 1993). There is a shortage of publications and knowledge concerning the association between uter-ine artery Doppler flow resistance indices and RPT. Previously pub-lished studies has focused on colour Doppler of the uterus and RPT (Kido et al, 2003; Durfee et al, 2005). Despite the fact that US tech-nology has become more powerful with the introduction of the trans-vaginal (TV) approach (Achiron et al, 1993; Alcazar et al, 1996) and sonohysterography (Zalel et al, 2002) in combination with Doppler modalities, demonstration of RPT is difficult and still represents a clinical challenge.

19
Postpartum endometritis
Although postpartum endometritis is one of the most common clinical conditions that develops in 2-5% of women following delivery (De-whurst, 1966), US findings of the uterus and uterine cavity have not been studied extensively. Previously, the presence of gas in the uterine cavity has been believed to be the typical US finding of endometritis (Lee et al, 1981; Madrazo, 1985; Merwe and Kock, 1989). Uterine involution may be delayed in cases of endometritis, particularly if en-domyometritis is present (Deutchman et al, 1993). Clinical and US findings of RPT and endometritis have also been considered to over-lap (Lee et al, 1981) and results of previously published studies on endometritis are contradictory (Pelage et al, 1999; Sakki and Kirki-nen, 1996; Pather et al, 2005; Ben-Ami et al, 2005). Some overlap between clinical findings of postpartum endometritis and SPH should exist since they are not mutually exclusive conditions (Alexander et al, 2002).
Manual evacuation of the placenta
The reported incidence of manual evacuation of the placenta varies between 0.8 – 5.5% depending mostly on the diagnostic criteria used (Tandberg et al, 1999). US findings in women who have undergone manual evacuation of the placenta have not been studied to any extent.
Ethical considerations
All women participating in this study received written and oral information about the study. The ethics committee of the Medical Faculty of Uppsala University, Sweden, approved the study. According to the first rule of ethics “Do not harm” it is desirable to avoid unnecessary invasive procedures that can imply serious maternal morbidity. Since curettage in the postpartum period may be hazardous, it is indicated only if a clinically significant amount of placental tissue remains in the uterine cavity. Therefore, a tool capable of demonstrating RPT would be valuable. Conflicting data on the US diagnosis of RPT exist and US has been reported to have limited diagnostic accuracy concerning SPH. Knowledge of the normal invo-lution process, including the ultrasonic appearance of the uterus and
20
uterine cavity throughout the puerperium is a pre-requisite for optimal interpretation of US findings in pathological states. Therefore, as a first step, we decided to conduct a study of the US findings associated with the normal puerperium (Study I).
With regard to study II, patients with SPH were informed that US di-agnosis of RPT is ambiguous and that re-bleeding may occur in spite of conservative treatment. The sonographers were informed about the clinical data but were not responsible for the management of the pa-tients. The physician responsible for the patient received descriptive information of the US findings and made the decision for either surgi-cal or conservative treatment of the patient. It was not considered ethi-cally correct to withhold the US findings from the clinicians responsi-ble for the participating patients. Although the golden standard for the diagnosis of RPT is histological confirmation, which requires an inva-sive procedure, the physicians responsible for the patients avoided such a procedure when the description of the uterine content was in accordance with normal US findings.
Although a randomized study would be the desirable design to evalu-ate the best treatment choice for SPH, as suggested in the Cochrane review on SPH, ethical issues make this type of study difficult to con-duct. To randomize women with severe/moderate bleeding or puer-peral sepsis and US finding of an echogenic mass to conservative treatment appears unjustifiable. On the other hand, to randomize women with severe/moderate SPH and an US finding of an empty cavity or a mixed echo pattern in the cavity to surgical evacuation may be even more unethical. Such a study would demand the definition of strict inclusion/exclusion criteria.

21
AIMS OF THE STUDIES
General aim
To study uterine and uterine cavity changes throughout the puer-perium as revealed by gray-scale and Doppler US, after normal deliv-ery and in puerperal complications, particularly RPT.
Specific aims
Study I To describe uterine and uterine cavity changes after uncomplicated vaginal, term delivery and uneventful puerperal course, as revealed by gray-scale US. A secondary aim was to see if the uterine involution process was influenced by parity, infant birth-weight, breast-feeding or maternal smoking.
Study II To assess US findings associated with RPT in patients with SPH, and to compare these findings with those of the normal puerperium.
Study III To describe US findings in women with postpartum endometritis, after caesarean delivery and after manual evacuation of the placenta, and to compare these findings with those of the normal puerperium.
Study IV To measure Doppler flow resistance indices in the uterine artery and to observe when the early diastolic notches appear during the puer-perium in women with uncomplicated pregnancy and delivery.
Study V To measure uterine artery Doppler flow resistance indices in patients with clinical and ultrasonic suspicion of RPT who were to undergo surgical evacuation, and to compare these findings with those of the normal puerperium.
22
MATERIAL AND METHODS
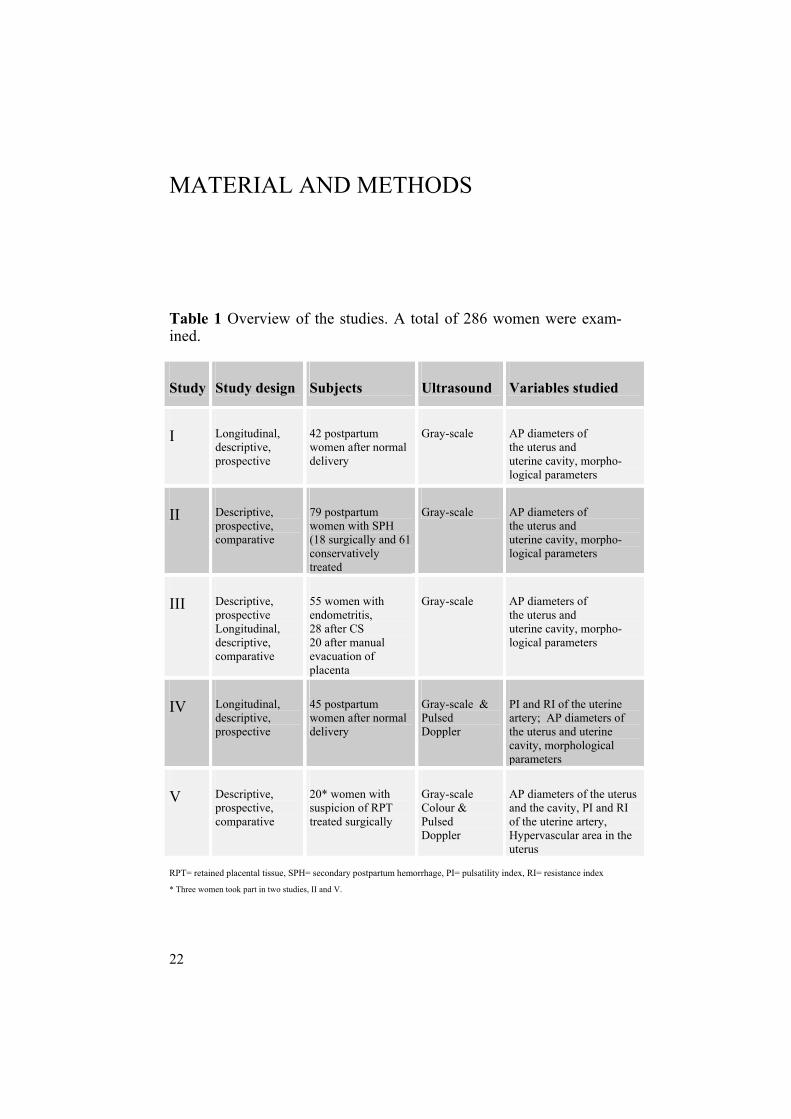
Table 1 Overview of the studies. A total of 286 women were exam-ined.
Study Study design Subjects Ultrasound Variables studied
I Longitudinal, descriptive, prospective
42 postpartum women after normal delivery
Gray-scale AP diameters of the uterus and uterine cavity, morpho-logical parameters
II Descriptive, prospective, comparative
79 postpartum women with SPH (18 surgically and 61 conservatively treated
Gray-scale AP diameters of the uterus and uterine cavity, morpho-logical parameters
III Descriptive, prospective Longitudinal, descriptive,comparative
55 women with endometritis, 28 after CS 20 after manual evacuation of placenta
Gray-scale AP diameters of the uterus and uterine cavity, morpho-logical parameters
IV Longitudinal, descriptive,prospective
45 postpartum women after normal delivery
Gray-scale & Pulsed Doppler
PI and RI of the uterine artery; AP diameters of the uterus and uterine cavity, morphological parameters
V Descriptive, prospective, comparative
20* women with suspicion of RPT treated surgically
Gray-scale Colour & Pulsed Doppler
AP diameters of the uterus and the cavity, PI and RI of the uterine artery, Hypervascular area in the uterus
RPT= retained placental tissue, SPH= secondary postpartum hemorrhage, PI= pulsatility index, RI= resistance index * Three women took part in two studies, II and V.

23
Population, study settings and design
A total of 339 postpartum women were invited to participate in the studies. Twenty-seven (7.9%) women declined participation, the rea-son for non-consenting being exhaustion after delivery. Another 26 (7.7%) women were excluded due to various puerperal complications. Informed consent was obtained from the remaining 286 women. Three women took part in two studies, II and V.
The studies were conducted in two hospitals, Uppsala University Hos-pital (study I-V) and Gävle County Hospital (study I). The overall design was exploratory, hypothesis generating and prospective. De-scriptive statistics was the main tool used for analysis.
US examinations in study I were performed with real-time US ma-chines (Acuson 128, Mountain View, CA, USA; Siemens sonoline SI-400, Erlangen, Germany; Toshiba Sonolayer Capasee SSA, Tokyo, Japan) with a 3.5-MHz transabdominal (TA) convex probe and a 5-MHz transvaginal (TV) probe. In all other studies the Acuson Sequoia 512 (Acuson, Mountain View, CA, USA) with a 3.5- or 4-MHz TA convex probe or a 6-10 MHz TV probe, was used.
Examinations were scheduled for postpartum days 1, 3, 7, 14, 28 and 56. The first four examinations were performed transabdominally (TA) and the last two transvaginally (TV). The urinary bladder was moderately filled during the TA examinations and empty during the TV examinations. Gentle compression with the probe was used and the measurements were made between uterine contractions. The uterus was assessed in longitudinal, transverse and coronal sections (Fig. 1). The coronal section was analyzed in order to exclude uterine malfor-mations. In the longitudinal section the maximum anteroposterior (AP) diameters of the uterus and uterine cavity were measured per-pendicular to the endometrium. The form and position of the uterus were recorded, as were the presence of fluid, heterogeneous contents, echogenic mass or gas in the uterine cavity. If only an echogenic cen-tral line was visualized from the fundus to the lower uterine segment, the cavity was defined as empty. Fluid in the cavity was defined as a space separating the anterior from the posterior wall. A mixed echo-pattern was defined as echogenic material mixed with fluid compo-nents of varying proportions. An echogenic mass was defined as a circumscript mass, often with a lobulated appearance and calcifica-tions, without any fluid components. US appearance of gas is seen as

24
an intensively hyperechogenic focus equivalent in echogenicity to bowel gas with clean or dirty shadowing or a reverberation artifact (Ziskin et al, 1982; Carson, 1991).
Figure 1. Three standard sections of early puerperal uterus , (A) longitudinal, (B) coronal and (C) transverse.
Normal Puerperium (Study I and IV)
Gray-scale Ultrasound (Study I)
Sixty postpartum women who had uncomplicated, singleton pregnan-cies with a term vaginal delivery and an uneventful puerperal course were invited to participate in a prospective, longitudinal, descriptive study conducted at Uppsala University Hospital and Gävle County Hospital between 1994 and 1998. Seven women declined participa-tion. Four took part only in the first US examination; mood changes being the reason for drop-out from the study. These four women were excluded as all participants should have had at least four of six US examinations done. Seven women developed puerperal pathology and were moved to pathological groups. Thus, informed consent was ob-tained from the remaining 42 women. The influence on the involution process of parity, breast-feeding, ma-ternal smoking and infant birth-weight were also evaluated.

25
Demographic and obstetric data on maternal age, parity, smoking hab-its, gestational age at delivery, infant birth-weight and breast- or bot-tle-feeding, were obtained from the medical records and are shown in Table 2.
Table 2. Demographic and obstetric data on the women in the studies on normal puerperium (I and IV).
Study I Study IV N=42 N=45
Age (years) (median, range)
28 (19-41)
30 (20-44)
Gestational age at delivery (weeks) (me-dian, range)
39 (37-42)
40 (37-42)
ParityPrimiparous Multiparous
18 (42.8%) 24 (57.2%)
26 (57.8%) 19 (42.2%)
Breast-feeding (yes) (no)
22 (52.3%) 20 (47.7%)
34 (75.5%) 11 (24.5%)
Smoking (yes) (no)
5 (11.9%) 37 (88.1%)
2 (4.4 %) 43 (95.6%)
Birth weight (g) (median, range)
3545 (2640-4510)
3580 (2390-4460)
Doppler Ultrasound (Study IV)
Sixty women who had given birth at between the 37th and 43rd gesta-tional weeks by uncomplicated, vaginal delivery were invited to par-ticipate in this study conducted from April 2004 to September 2005. Six women declined participation. Nine women were excluded from the study because of PPH (1), CS (1), preterm delivery (1), SPH (3) and endometritis (3). Informed consent was obtained from the remain-ing 45 women.

26
All women received 5 IU Oxytocin after delivery. At the TA examina-tions the uterine artery was identified by colour Doppler, directing the transducer to the lateral wall of the uterus in the region of the lower uterine segment. The measurements were done at the point where the uterine artery crossed the external iliac artery (Fig. 3, arrow).
Figure 3. Normal flow velocity waveforms of the uterine artery at postpartum day 1 (transabdominal approach).
When the TV probe was used the measurements were made at the level of the internal os of the uterine cervix. The sample volume was placed on the main branch of the uterine artery. The sample gate was set between 3 and 6 mm and the heart rate range between 60 and 120 beats per minute. The PI and RI in both uterine arteries were measured by Pulsed Doppler. The PI (S-D/Mean) and the RI (S-D/S) are two semi-quantitative, angle-independent indices, where S is the maxi-mum and D is the minimum of the Doppler shift frequency through a cardiac cycle (Fig. 4). The presence or absence of early diastolic notches was noted (Fig. 4, arrow). We also measured the uterus and uterine cavity diameters for comparison with reference values from study I on the normal puerperium.

27
S-D S-D PI = ________ RI = ________
Mean S
Figure 4. The measurement of resistance flow indices, PI and RI from the flow velocity waveforms of the uterine artery postpartum. An early diastolic notch is seen on the image (arrow).
Pathological Puerperium (Study II, III and V)
Retained placental tissue - Gray-scale Ultrasound (Study II)
From 1996 to 2004 ninety women with SPH were invited to partici-pate in a study focused on SPH. The women gave birth between the 24th and 42nd week of pregnancy. Eight women declined to partici-pate and three women were excluded because of large fibromyomas. Although postpartum endometritis may cause SPH, patients with pre-dominant clinical symptoms of puerperal endometritis were analyzed separately (Study III). Seventy-nine women remained in the study. The sonographers were informed about the clinical data but were not responsible for the management of the patients. The physician respon-sible for the patient received descriptive information of the US find-ings. In order to compare results with the reference values from study I, a similar study design was used. The first day of examination was the day that clinical symptoms arose. The examinations were contin-ued until uterine surgical evacuation was performed or until the bleed-
S
D

28
ing stopped. If for instance a woman presented with SPH on day 9, the findings were compared with reference findings from day 7 and the scans were repeated on days 14, 28 and 56 postpartum. Demographic and obstetric data on the women in the studies on SPH (II and V) are shown in Table 3.
Endometritis, Cesarean section and Manual evacuation of the placenta, Gray-scale Ultrasound (Study III)
During the same time period, between 1996 and 2004, 110 women were invited to participate in a study focused on the pathological pu-erperium. Six women declined participation and one was excluded because of pulmonary embolus. One hundred and three women re-mained in the study. Fifty-five women had clinical symptoms of post-partum endometritis (Group 1), 28 had undergone CS of which 17 were emergency procedures and 11 were elective (Group 2), and 20 had undergone manual evacuation of the placenta (Group 3). Each woman belonged to one group only. If a woman delivered by CS or underwent manual removal of the placenta, and presented with clinical symptoms of endometritis, she was moved to the endometritis group. For patients recruited following CS or manual evacuation of the pla-centa, the study design used in study I was applied. If a woman re-cruited for paper I presented with clinical signs of endometritis she was also moved to the endometritis group. For the other women with endometritis, the first examination was done on the day they presented with clinical symptoms. Gestational age at delivery was between the 24th and 43rd weeks of pregnancy. All women with endometritis had fever (temperature > 38oC) and/or elevated (>10 mg/l) serum C-reactive protein (CRP) in combination with low abdominal pain, an enlarged, soft, tender uterus or foul-smelling discharge. All these women were treated with antibiotics and the majority was given utero-tonics.
Retained placental tissue - Doppler Ultrasound (Study V)
Twenty-two women with suspected RPT by clinical and ultrasonic criteria who were to undergo surgical evacuation of the uterine cavity participated in this study conducted between 2002 and 2007. Three of them also participated in Study II. The women had given birth be-tween the 24-th and 42-nd week of pregnancy.

29
Table 3. Demographic and obstetric data on the women in the studies on SPH (II and V).
Study II(Group 1)
Study II(Group 2)
Study V
Age (years) (median, range)
30 (22-40) 30 (20-43) 31 (25-42)
Parity PrimiparousMultiparous
7/18 (38.9%) 11/18 (61.1%)
27/61 (44.3%) 34/61 (55.7%)
11/20 (55.0%) 9/20 (45.0%)
Gestational age at delivery (weeks) (median, range)
39 (24-41) 39 (24-42) 39 (24-42)
Mode of delivery Spontaneous vaginal Cesarean section Ventouse
17/18 (94.4%) 01/18 (5.6%)
51/61 (83.6%) 4/61 (6.6%) 6/61 (9.8%)
18/20 (90.0%) 2/20 (10.0%)
Birth weight (g) (median, range)
3540 (798-6200)
3470 (553-5660)
3560 (571-4850)
Breast-feeding (yes/no) 14/18 (77.8%) 50/61 (81.9%) 15/20 (75.0%)
Smoking (yes/no) 5/18 (27.8%) 10/61 (16.4%) 5/19 (26.3%)
Estimated bleeding at delivery (ml) (median, range)
500 (100-2800)
1200 (200-3500)
750 (300-2800)
Blood transfusion (yes/no) 8/18 (44.4%) 11/60 (18.3%) 6/20 (30.0%)
Manual evacuation of the placenta (yes/no)
4/18 (22.2%) 6/61 (9.8%) 6/20 (30.0%)
Interval between PPH and SPH, (days) (median, range)
10 (1-60) 9 (1-95) 19 (1-60)
Surgical treatment 18/18 0/61 20/20
30
Two women were excluded since tissue was not sent for histology, leaving twenty participants. The sonographers were informed about the clinical data but were not responsible for the management of the patients. The physician responsible for the patient had already decided on surgical treatment before the US examination. All examinations were performed before the first surgical evacuation in cases with more than one such procedure. The first day of examination was the day that clinical symptoms arose. Clinical symptoms included were SPH, fever, low abdominal pain or suspected incomplete placenta at deliv-ery. If a woman presented with symptoms, for instance on day 16, the findings were compared with reference findings from day 14.
Statistical analysis
Descriptive statistics were used for the entire study population and expressed as median and range for continuous variables as maternal age, gestational age at delivery, infant’s birth-weight and estimated bleeding at delivery. Categorical variables such as parity, maternal smoking, history of prior postpartum bleeding, mode of delivery, breast-feeding, blood transfusion and the use of uterotonics and anti-biotics were described using frequency distributions presented as per-centages.
Study I
Comparisons between groups were carried out using the t-test. A p-value <0.05 was considered to be statistically significant.
Study II
Quantitative values from pathological pregnancies were plotted on the reference curves made up from the population in Study I, where the 10th, 50th and 90th percentiles were denoted (red lines). T-tests were used to compare mean values of demographic and obstetric variables. For categorical data chi-square tests or in case of sparse data the Fischer exact test, were used to compare group proportions. A p-value <0.05 was considered to be statistically significant.

31
Study III
Quantitative values from pathological pregnancies were plotted on the reference curves, where the 10th, 50th and 90th percentiles were de-noted (red lines). They were also presented as means with standard deviations (SD) and range. Wilcoxon rank sum test was used to com-pare quantitative parameters between elective and emergency CS
Study IV
Doppler flow indices, PI and RI, are presented as means from the left and right uterine artery with standard deviations (SD) as well as indi-vidual values for each woman in the graphs. T-tests were used to compare PI and RI means at different postpartum days with the mean values at day 1. A scatter plot is used to visually detect any differences in Doppler flow indices between the left and the right uterine artery. In order to evaluate the variation pattern, Bland-Altman plots (Blandand Altman, 1986) of the differences in Doppler flow indices between the right and left uterine artery in relation to the mean of the right and left artery are presented. The plots present the mean difference and the limits of agreement.
Study V
Quantitative values for PI and RI were plotted on the reference curvesfrom study IV, where the 10th, 50th and 90th percentiles were denoted (red lines). Quantitative values for uterine cavity AP diameters were plotted on the reference curves from study I, where the 10th, 50th and 90th percentiles were denoted (red lines).
32
RESULTS
Normal puerperium - Gray-scale Ultrasound
Study I
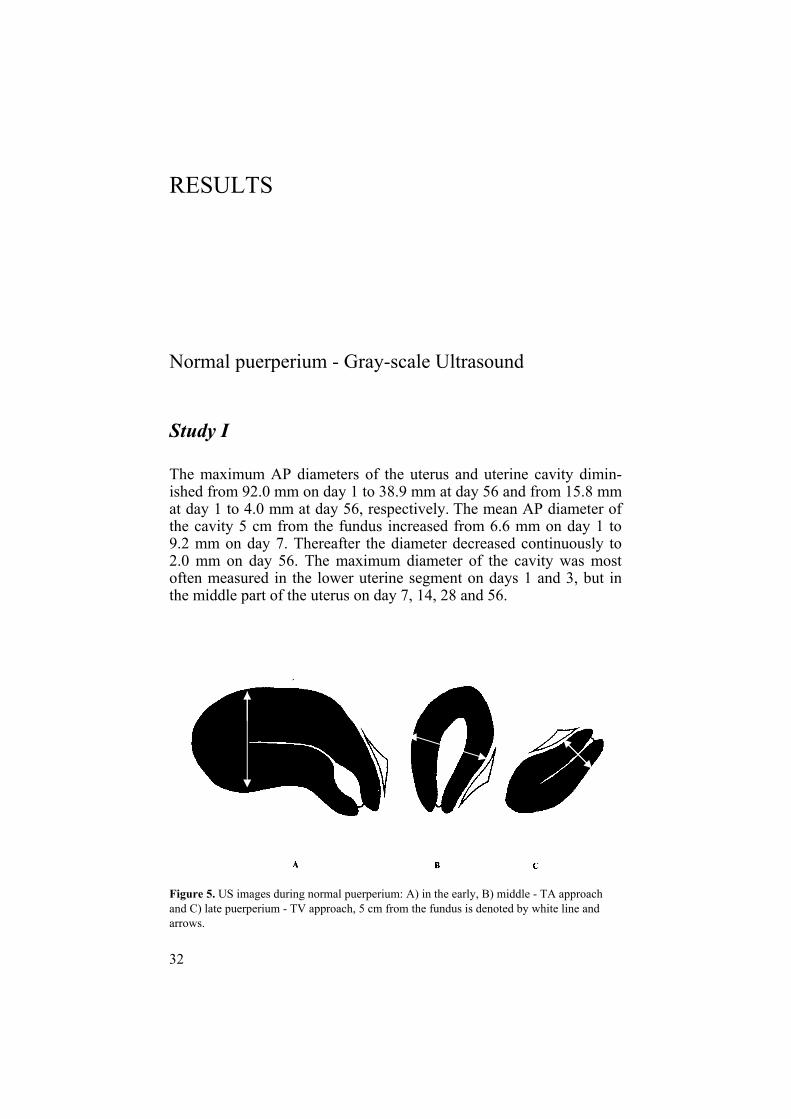
The maximum AP diameters of the uterus and uterine cavity dimin-ished from 92.0 mm on day 1 to 38.9 mm at day 56 and from 15.8 mm at day 1 to 4.0 mm at day 56, respectively. The mean AP diameter of the cavity 5 cm from the fundus increased from 6.6 mm on day 1 to 9.2 mm on day 7. Thereafter the diameter decreased continuously to 2.0 mm on day 56. The maximum diameter of the cavity was most often measured in the lower uterine segment on days 1 and 3, but in the middle part of the uterus on day 7, 14, 28 and 56.
Figure 5. US images during normal puerperium: A) in the early, B) middle - TA approach and C) late puerperium - TV approach, 5 cm from the fundus is denoted by white line and arrows.
33
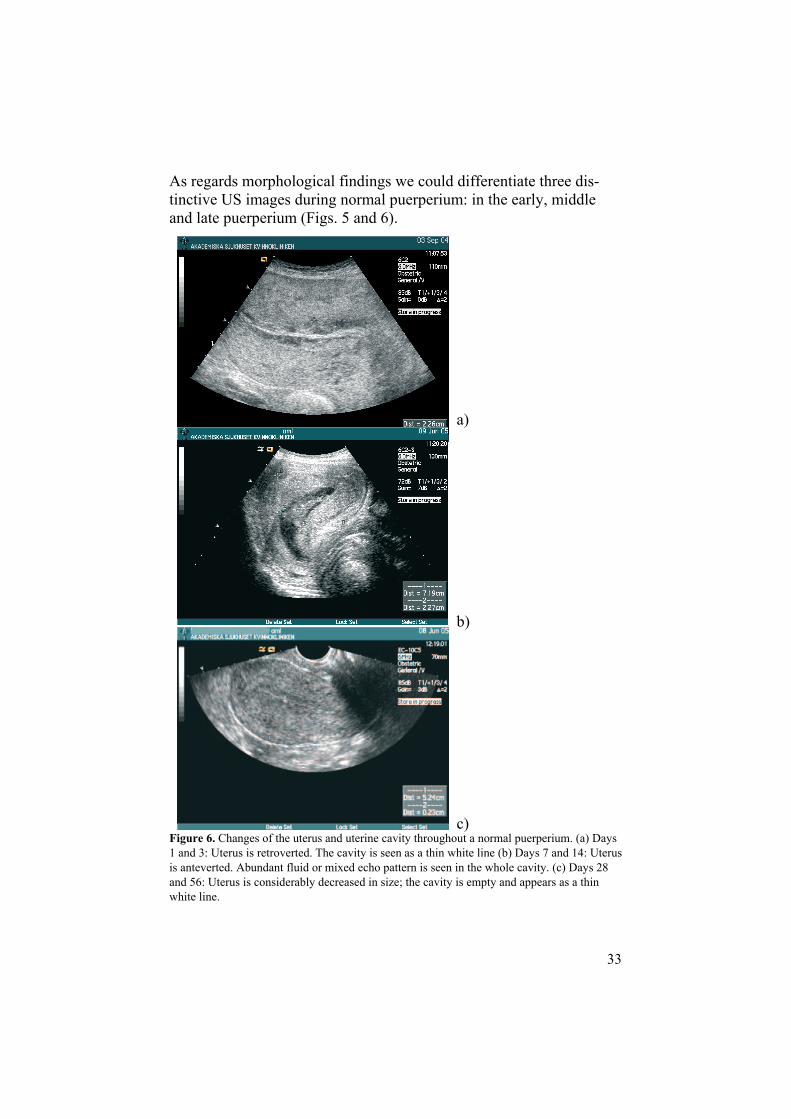
As regards morphological findings we could differentiate three dis-tinctive US images during normal puerperium: in the early, middle and late puerperium (Figs. 5 and 6).
Figure 6. Changes of the uterus and uterine cavity throughout a normal puerperium. (a) Days 1 and 3: Uterus is retroverted. The cavity is seen as a thin white line (b) Days 7 and 14: Uterus is anteverted. Abundant fluid or mixed echo pattern is seen in the whole cavity. (c) Days 28 and 56: Uterus is considerably decreased in size; the cavity is empty and appears as a thin white line.
a)
b)
c)

34
The uterus was most often retroverted and empty in the early puer-perium (in 92.9% on day 1 and 83.3% on day 3). Fluid and a mixed echo pattern in the whole cavity were seen in the middle part of the puerperium (in 90.2% on day 7 and 75.6% on day 14). In late puer-perium the cavity was empty and appeared as a thin white line (in 74.4% on day 28 and 95.1% on day 56). Minor amounts of endo-metrial fluid or a mixed echo pattern were rare findings during the late puerperium (4.9% on day 56) (Fig 7a).
a)
b)
Figure 7 a) Transvaginal ultrasound image of the uterus on day 28 postpartum. A small amount of fluid with echogenic foci is seen in the cavity (arrow). b). Trans-vaginal ultrasound image of a retroverted uterus at day 56 postpartum. The cavity is empty and a thin endometrium is seen (arrow).
35
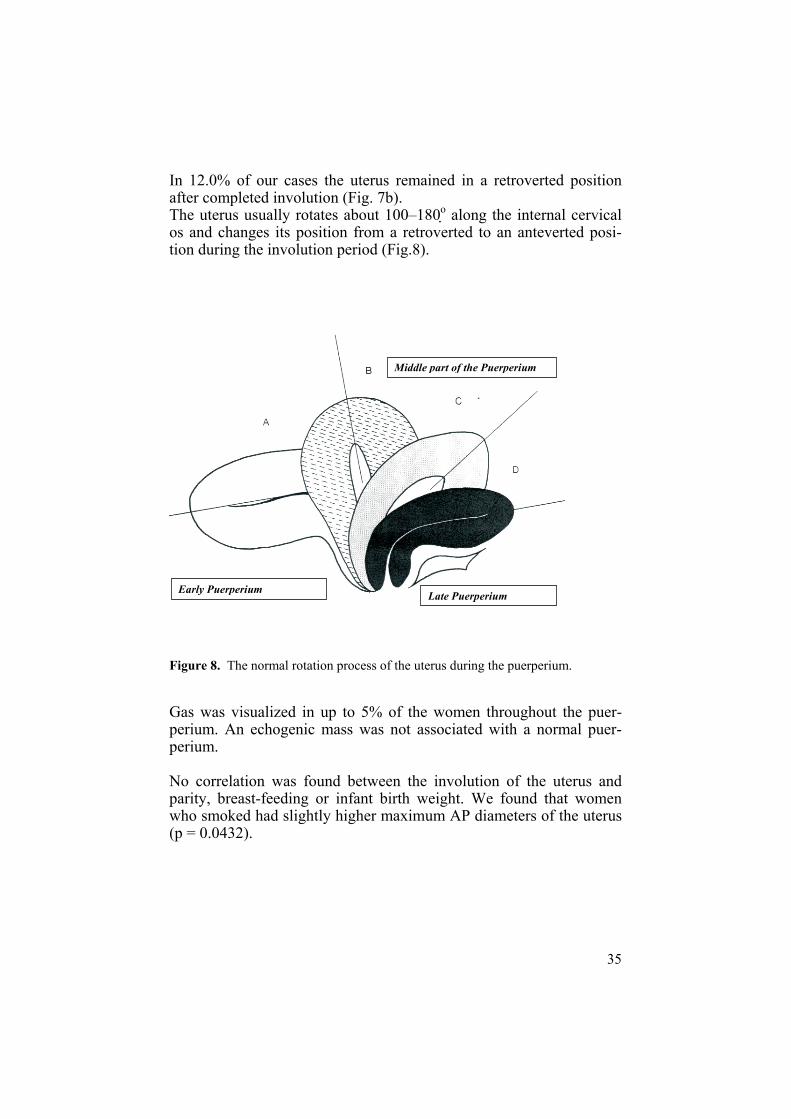
In 12.0% of our cases the uterus remained in a retroverted position after completed involution (Fig. 7b).The uterus usually rotates about 100–180o along the internal cervical os and changes its position from a retroverted to an anteverted posi-tion during the involution period (Fig.8).
Early Puerperium Late Puerperium
Middle part of the Puerperium
Figure 8. The normal rotation process of the uterus during the puerperium.
Gas was visualized in up to 5% of the women throughout the puer-perium. An echogenic mass was not associated with a normal puer-perium.
No correlation was found between the involution of the uterus and parity, breast-feeding or infant birth weight. We found that women who smoked had slightly higher maximum AP diameters of the uterus (p = 0.0432).

36
Pathological puerperium - Gray-scale Ultrasound
Study II
Seventy-nine patients with SPH were assigned to one of two groups according to choice of treatment. Group 1 (n=18, 22.8%) consisted of patients who underwent surgical evacuation. Tissue was sent for his-tology in 16 of these 18 cases but was inconclusive for two. Three patients required two evacuations. US revealed an echogenic mass in the uterine cavity in 17 patients from group 1 and in 14 of these pa-tients histology confirmed placental tissue (Figs. 9 and 12). Group 2 (n=61, 77.2%) was treated conservatively, consisting of expectant management alone or in combination with uterotonic drugs and/or antibiotics (Fig.10). Twenty-five of the 79 (31.6%) patients had both PPH and SPH, nine from group 1 and 16 from group 2. The median time intervals between PPH and SPH were 10 days (range 1-60) in group 1 and 9 days (range 1-95) in group 2, respectively (Table 3). Ten of the 79 (12.6%) patients had undergone primary manual evacuation of the placenta, four from group 1 and six from group 2. All except one patient (case 15), who underwent manual evacuation of the placenta, had PPH. The initial treatment for PPH, apart from man-ual evacuation of the placenta, was conservative with uterotonic drugs. More patients from group 1 received blood transfusions and antibiotics.
Figure 9. Transvaginal ultrasound image of the uterus on day 30 postpartum. A large echogenic mass in the uterine cavity is seen (arrow).

37
Figure 10. Flow chart of the patients from Study II.
The AP diameter of the uterine cavity was above the 90th percentile in all but one of these 14 patients (Fig. 11). Only one patient from group I had a mixed echo-pattern. Histology was not available for this pa-tient. In 18 patients from group 2 the cavity was empty and in 43 a mixed echo pattern was found. The uterine cavity was wider com-pared to the reference values, but overlap was extensive.

38
Cavity anteroposterior diameter, maximum. - Group I
020
4060
80
1 7 14 28 56
Cav
ity a
nter
opos
terio
r dia
met
er, m
axim
um (m
m)
Postpartum day
Figure 11. AP diameters of the uterine cavity from women in group I with reference values from uncomplicated postpartum periods (10th, 50th, and 90th percentiles).
a) b)
Figure 12. (a) A large echogenic mass (short arrow) in the uterine cavity before surgical evacuation and (b) an empty cavity soon after surgical treatment. Hypere-chogenic gas with posterior shadowing is seen (long arrow) (with kindness of Dr Elisabeth Ljunger).

39
Study III
Compared to reference values, the AP diameters of the uterus and uterine cavity overlapped, to a great extent, in all 3 groups. The invo-lution process was completed on day 56 postpartum and the uterus had achieved the same dimensions as found in our reference population from Study I and IV.
Figure 13. Transabdominal ultrasound image of the uterus on day 8 postpartum in a patient with postpartum endometritis. A large amount of mixed echo pattern separat-ing the anterior from the posterior wall is seen in the cavity (arrow).
Group 1: Clinical symptoms of endometritis started most often during the second puerperal week (median 9, range 1-40 days). Among the 55 women with endometritis 19 (34.5%) women had an operative de-livery; 11 (20.0%) by CS, (7 emergency and 4 elective) and 8 (14.5%) by vacuum extraction. In one case manual evacuation of the placenta had been performed and 4 patients suffered from PPH. An anteverted position of the uterus was less common on days 14 and 28 compared to the reference population. An empty cavity was less common on days 1 and 3, 14 and 28 postpartum. In a majority of cases the intrau-terine content showed a mixed echo pattern or fluid alone (Fig.13). Gas was present more often on day 3 postpartum. This difference dis-appeared if patients with intrauterine procedures were omitted.

40
Group 2: Among the 28 women delivered by CS (17 emergency and 11 elective), 6 (21.4%) had fever and were treated with antibiotics. They were not moved to the endometritis group since the causes of puerperal infection were breast engorgement, urinary tract infections or infection of the skin incision. Six women (21.4%) suffered from PPH. There were more cases of PPH among women delivered by elec-tive (4 of 11) than among those delivered by emergency CS (2 of 17). Blood transfusions were given in 7 of the 28 patients (25.0%). The AP diameters of the uterus did not differ between women delivered by elective and emergency CS.
Figure 14. Transvaginal ultrasound image of the uterus on day 56 postpartum in a patient who had undergone cesarean delivery. Several echogenic foci in the lower uterine segment (arrow) represent the scar at the incision site.
The AP diameters of the cavity were larger on days 1 and 3 in women delivered by elective (26.1 and 21.2mm) than by emergency CS (14.9 and 14.0 mm). An anteverted position of the uterus was less common on days 7, 14 and 28 compared to the normal population. An empty cavity was less common on days 1 and 3. Gas in the cavity was more common on days 1, 3 and 7. The incision site in the lower uterine segment was visible in all cases after CS (Fig.14).
41
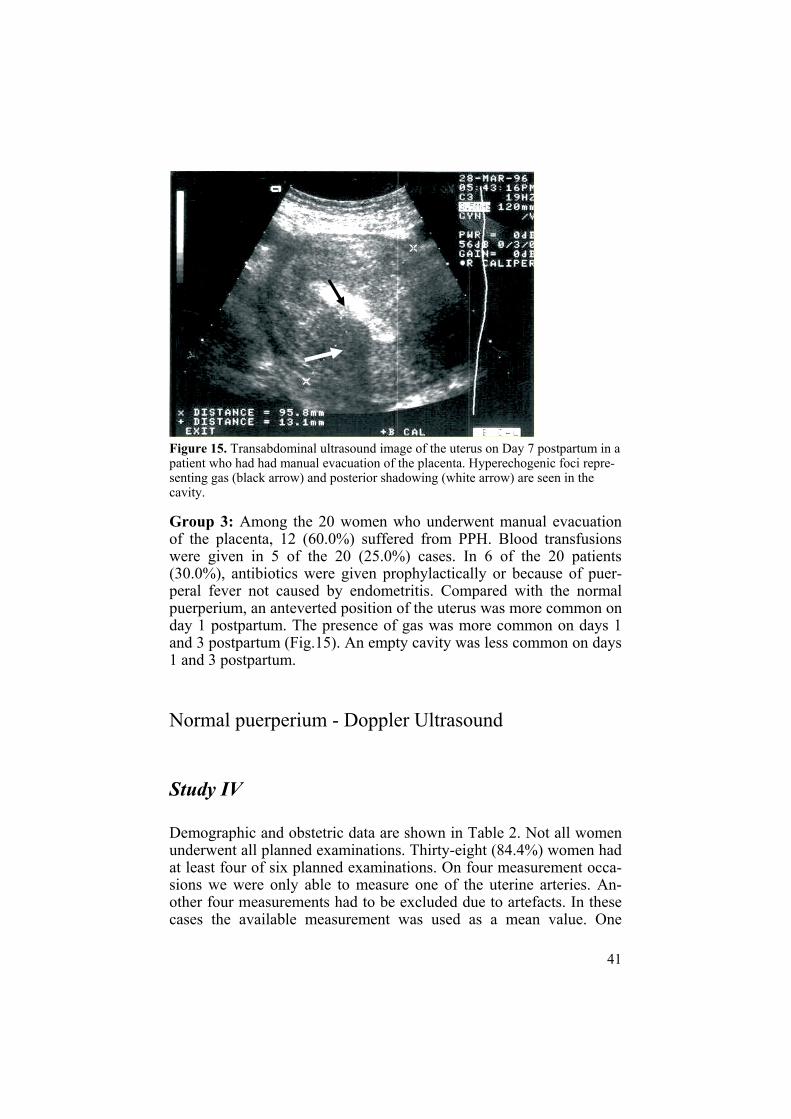
Figure 15. Transabdominal ultrasound image of the uterus on Day 7 postpartum in a patient who had had manual evacuation of the placenta. Hyperechogenic foci repre-senting gas (black arrow) and posterior shadowing (white arrow) are seen in the cavity.
Group 3: Among the 20 women who underwent manual evacuation of the placenta, 12 (60.0%) suffered from PPH. Blood transfusions were given in 5 of the 20 (25.0%) cases. In 6 of the 20 patients (30.0%), antibiotics were given prophylactically or because of puer-peral fever not caused by endometritis. Compared with the normal puerperium, an anteverted position of the uterus was more common on day 1 postpartum. The presence of gas was more common on days 1 and 3 postpartum (Fig.15). An empty cavity was less common on days 1 and 3 postpartum.
Normal puerperium - Doppler Ultrasound
Study IV
Demographic and obstetric data are shown in Table 2. Not all women underwent all planned examinations. Thirty-eight (84.4%) women had at least four of six planned examinations. On four measurement occa-sions we were only able to measure one of the uterine arteries. An-other four measurements had to be excluded due to artefacts. In these cases the available measurement was used as a mean value. One

42
woman had unilateral measurements on two occasions. PI and RI from women with incomplete or unilateral measurements were found to be comparable with the values from women with complete and bilateral measurements. The resistance indices did not change markedly during the first two postpartum weeks compared with the first postpartum day. A significant increase was observed from day 28 (p< 0.0001) and was also found at day 56 postpartum (p< 0.0001). Individual PI and RI mean values are shown on Fig.16 a and b.
Day postpartum
Indi
vidu
al P
I mea
ns
1 7 14 28 563
1.0
1.5
2.0
2.5
3.0
3.5
Day postpartum
Indi
vidu
al P
I mea
ns
1 7 14 28 563
1.0
1.5
2.0
2.5
3.0
3.5
Day postpartum
Indi
vidu
al P
I mea
ns
1 7 14 28 563
1.0
1.5
2.0
2.5
3.0
3.5
Day postpartum
Indi
vidu
al P
I mea
ns
1 7 14 28 563
1.0
1.5
2.0
2.5
3.0
3.5
Day postpartum
Indi
vidu
al P
I mea
ns
1 7 14 28 563
1.0
1.5
2.0
2.5
3.0
3.5
Day postpartum
Indi
vidu
al P
I mea
ns
1 7 14 28 563
1.0
1.5
2.0
2.5
3.0
3.5
Day postpartum
Indi
vidu
al P
I mea
ns
1 7 14 28 563
1.0
1.5
2.0
2.5
3.0
3.5
Day postpartum
Indi
vidu
al P
I mea
ns
1 7 14 28 563
1.0
1.5
2.0
2.5
3.0
3.5
Day postpartum
Indi
vidu
al P
I mea
ns
1 7 14 28 563
1.0
1.5
2.0
2.5
3.0
3.5
Day postpartum
Indi
vidu
al P
I mea
ns
1 7 14 28 563
1.0
1.5
2.0
2.5
3.0
3.5
Day postpartum
Indi
vidu
al P
I mea
ns
1 7 14 28 563
1.0
1.5
2.0
2.5
3.0
3.5
Day postpartum
Indi
vidu
al P
I mea
ns
1 7 14 28 563
1.0
1.5
2.0
2.5
3.0
3.5
Day postpartum
Indi
vidu
al P
I mea
ns
1 7 14 28 563
1.0
1.5
2.0
2.5
3.0
3.5
Day postpartum
Indi
vidu
al P
I mea
ns
1 7 14 28 563
1.0
1.5
2.0
2.5
3.0
3.5
Day postpartum
Indi
vidu
al P
I mea
ns
1 7 14 28 563
1.0
1.5
2.0
2.5
3.0
3.5
Day postpartum
Indi
vidu
al P
I mea
ns
1 7 14 28 563
1.0
1.5
2.0
2.5
3.0
3.5
Day postpartum
Indi
vidu
al P
I mea
ns
1 7 14 28 563
1.0
1.5
2.0
2.5
3.0
3.5
Day postpartum
Indi
vidu
al P
I mea
ns
1 7 14 28 563
1.0
1.5
2.0
2.5
3.0
3.5
Day postpartum
Indi
vidu
al P
I mea
ns
1 7 14 28 563
1.0
1.5
2.0
2.5
3.0
3.5
Day postpartum
Indi
vidu
al P
I mea
ns
1 7 14 28 563
1.0
1.5
2.0
2.5
3.0
3.5
Day postpartum
Indi
vidu
al P
I mea
ns
1 7 14 28 563
1.0
1.5
2.0
2.5
3.0
3.5
Day postpartum
Indi
vidu
al P
I mea
ns
1 7 14 28 563
1.0
1.5
2.0
2.5
3.0
3.5
Day postpartum
Indi
vidu
al P
I mea
ns
1 7 14 28 563
1.0
1.5
2.0
2.5
3.0
3.5
Day postpartum
Indi
vidu
al P
I mea
ns
1 7 14 28 563
1.0
1.5
2.0
2.5
3.0
3.5
Day postpartum
Indi
vidu
al P
I mea
ns
1 7 14 28 563
1.0
1.5
2.0
2.5
3.0
3.5
Day postpartum
Indi
vidu
al P
I mea
ns
1 7 14 28 563
1.0
1.5
2.0
2.5
3.0
3.5
Day postpartum
Indi
vidu
al P
I mea
ns
1 7 14 28 563
1.0
1.5
2.0
2.5
3.0
3.5
Day postpartum
Indi
vidu
al P
I mea
ns
1 7 14 28 563
1.0
1.5
2.0
2.5
3.0
3.5
Day postpartum
Indi
vidu
al P
I mea
ns
1 7 14 28 563
1.0
1.5
2.0
2.5
3.0
3.5
Day postpartum
Indi
vidu
al P
I mea
ns
1 7 14 28 563
1.0
1.5
2.0
2.5
3.0
3.5
Day postpartum
Indi
vidu
al P
I mea
ns
1 7 14 28 563
1.0
1.5
2.0
2.5
3.0
3.5
Day postpartum
Indi
vidu
al P
I mea
ns
1 7 14 28 563
1.0
1.5
2.0
2.5
3.0
3.5
Day postpartum
Indi
vidu
al P
I mea
ns
1 7 14 28 563
1.0
1.5
2.0
2.5
3.0
3.5
Day postpartum
Indi
vidu
al P
I mea
ns
1 7 14 28 563
1.0
1.5
2.0
2.5
3.0
3.5
Day postpartum
Indi
vidu
al P
I mea
ns
1 7 14 28 563
1.0
1.5
2.0
2.5
3.0
3.5
Day postpartum
Indi
vidu
al P
I mea
ns
1 7 14 28 563
1.0
1.5
2.0
2.5
3.0
3.5
Day postpartum
Indi
vidu
al P
I mea
ns
1 7 14 28 563
1.0
1.5
2.0
2.5
3.0
3.5
Day postpartum
Indi
vidu
al P
I mea
ns
1 7 14 28 563
1.0
1.5
2.0
2.5
3.0
3.5
Day postpartum
Indi
vidu
al P
I mea
ns
1 7 14 28 563
1.0
1.5
2.0
2.5
3.0
3.5
Day postpartum
Indi
vidu
al P
I mea
ns
1 7 14 28 563
1.0
1.5
2.0
2.5
3.0
3.5
Day postpartum
Indi
vidu
al P
I mea
ns
1 7 14 28 563
1.0
1.5
2.0
2.5
3.0
3.5
Day postpartum
Indi
vidu
al P
I mea
ns
1 7 14 28 563
1.0
1.5
2.0
2.5
3.0
3.5
Day postpartum
Indi
vidu
al P
I mea
ns
1 7 14 28 563
1.0
1.5
2.0
2.5
3.0
3.5
Day postpartum
Indi
vidu
al P
I mea
ns
1 7 14 28 563
1.0
1.5
2.0
2.5
3.0
3.5
Day postpartum
Indi
vidu
al P
I mea
ns
1 7 14 28 563
1.0
1.5
2.0
2.5
3.0
3.5
Day postpartum
Indi
vidu
al P
I mea
ns
1 7 14 28 563
1.0
1.5
2.0
2.5
3.0
3.5
a)
Day postpartum
Indi
vidu
al R
I mea
ns
1 7 14 28 563
0.5
0.6
0.7
0.8
0.9
1.0
Day postpartum
Indi
vidu
al R
I mea
ns
1 7 14 28 563
0.5
0.6
0.7
0.8
0.9
1.0
Day postpartum
Indi
vidu
al R
I mea
ns
1 7 14 28 563
0.5
0.6
0.7
0.8
0.9
1.0
Day postpartum
Indi
vidu
al R
I mea
ns
1 7 14 28 563
0.5
0.6
0.7
0.8
0.9
1.0
Day postpartum
Indi
vidu
al R
I mea
ns
1 7 14 28 563
0.5
0.6
0.7
0.8
0.9
1.0
Day postpartum
Indi
vidu
al R
I mea
ns
1 7 14 28 563
0.5
0.6
0.7
0.8
0.9
1.0
Day postpartum
Indi
vidu
al R
I mea
ns
1 7 14 28 563
0.5
0.6
0.7
0.8
0.9
1.0
Day postpartum
Indi
vidu
al R
I mea
ns
1 7 14 28 563
0.5
0.6
0.7
0.8
0.9
1.0
Day postpartum
Indi
vidu
al R
I mea
ns
1 7 14 28 563
0.5
0.6
0.7
0.8
0.9
1.0
Day postpartum
Indi
vidu
al R
I mea
ns
1 7 14 28 563
0.5
0.6
0.7
0.8
0.9
1.0
Day postpartum
Indi
vidu
al R
I mea
ns
1 7 14 28 563
0.5
0.6
0.7
0.8
0.9
1.0
Day postpartum
Indi
vidu
al R
I mea
ns
1 7 14 28 563
0.5
0.6
0.7
0.8
0.9
1.0
Day postpartum
Indi
vidu
al R
I mea
ns
1 7 14 28 563
0.5
0.6
0.7
0.8
0.9
1.0
Day postpartum
Indi
vidu
al R
I mea
ns
1 7 14 28 563
0.5
0.6
0.7
0.8
0.9
1.0
Day postpartum
Indi
vidu
al R
I mea
ns
1 7 14 28 563
0.5
0.6
0.7
0.8
0.9
1.0
Day postpartum
Indi
vidu
al R
I mea
ns
1 7 14 28 563
0.5
0.6
0.7
0.8
0.9
1.0
Day postpartum
Indi
vidu
al R
I mea
ns
1 7 14 28 563
0.5
0.6
0.7
0.8
0.9
1.0
Day postpartum
Indi
vidu
al R
I mea
ns
1 7 14 28 563
0.5
0.6
0.7
0.8
0.9
1.0
Day postpartum
Indi
vidu
al R
I mea
ns
1 7 14 28 563
0.5
0.6
0.7
0.8
0.9
1.0
Day postpartum
Indi
vidu
al R
I mea
ns
1 7 14 28 563
0.5
0.6
0.7
0.8
0.9
1.0
Day postpartum
Indi
vidu
al R
I mea
ns
1 7 14 28 563
0.5
0.6
0.7
0.8
0.9
1.0
Day postpartum
Indi
vidu
al R
I mea
ns
1 7 14 28 563
0.5
0.6
0.7
0.8
0.9
1.0
Day postpartum
Indi
vidu
al R
I mea
ns
1 7 14 28 563
0.5
0.6
0.7
0.8
0.9
1.0
Day postpartum
Indi
vidu
al R
I mea
ns
1 7 14 28 563
0.5
0.6
0.7
0.8
0.9
1.0
Day postpartum
Indi
vidu
al R
I mea
ns
1 7 14 28 563
0.5
0.6
0.7
0.8
0.9
1.0
Day postpartum
Indi
vidu
al R
I mea
ns
1 7 14 28 563
0.5
0.6
0.7
0.8
0.9
1.0
Day postpartum
Indi
vidu
al R
I mea
ns
1 7 14 28 563
0.5
0.6
0.7
0.8
0.9
1.0
Day postpartum
Indi
vidu
al R
I mea
ns
1 7 14 28 563
0.5
0.6
0.7
0.8
0.9
1.0
Day postpartum
Indi
vidu
al R
I mea
ns
1 7 14 28 563
0.5
0.6
0.7
0.8
0.9
1.0
Day postpartum
Indi
vidu
al R
I mea
ns
1 7 14 28 563
0.5
0.6
0.7
0.8
0.9
1.0
Day postpartum
Indi
vidu
al R
I mea
ns
1 7 14 28 563
0.5
0.6
0.7
0.8
0.9
1.0
Day postpartum
Indi
vidu
al R
I mea
ns
1 7 14 28 563
0.5
0.6
0.7
0.8
0.9
1.0
Day postpartum
Indi
vidu
al R
I mea
ns
1 7 14 28 563
0.5
0.6
0.7
0.8
0.9
1.0
Day postpartum
Indi
vidu
al R
I mea
ns
1 7 14 28 563
0.5
0.6
0.7
0.8
0.9
1.0
Day postpartum
Indi
vidu
al R
I mea
ns
1 7 14 28 563
0.5
0.6
0.7
0.8
0.9
1.0
Day postpartum
Indi
vidu
al R
I mea
ns
1 7 14 28 563
0.5
0.6
0.7
0.8
0.9
1.0
Day postpartum
Indi
vidu
al R
I mea
ns
1 7 14 28 563
0.5
0.6
0.7
0.8
0.9
1.0
Day postpartum
Indi
vidu
al R
I mea
ns
1 7 14 28 563
0.5
0.6
0.7
0.8
0.9
1.0
Day postpartum
Indi
vidu
al R
I mea
ns
1 7 14 28 563
0.5
0.6
0.7
0.8
0.9
1.0
Day postpartum
Indi
vidu
al R
I mea
ns
1 7 14 28 563
0.5
0.6
0.7
0.8
0.9
1.0
Day postpartum
Indi
vidu
al R
I mea
ns
1 7 14 28 563
0.5
0.6
0.7
0.8
0.9
1.0
Day postpartum
Indi
vidu
al R
I mea
ns
1 7 14 28 563
0.5
0.6
0.7
0.8
0.9
1.0
Day postpartum
Indi
vidu
al R
I mea
ns
1 7 14 28 563
0.5
0.6
0.7
0.8
0.9
1.0
Day postpartum
Indi
vidu
al R
I mea
ns
1 7 14 28 563
0.5
0.6
0.7
0.8
0.9
1.0
Day postpartum
Indi
vidu
al R
I mea
ns
1 7 14 28 563
0.5
0.6
0.7
0.8
0.9
1.0
Day postpartum
Indi
vidu
al R
I mea
ns
1 7 14 28 563
0.5
0.6
0.7
0.8
0.9
1.0
b)Figure 16. Individual PI (a) and RI (b) mean values of the left and right uterine artery throughout the puerperium. Three red lines denoting the 10th, 50th and 90th percentiles are also given.

43
a)
b)Figure 17. Transvaginal ultrasound of normal flow velocity waveforms of the uter-ine artery on postpartum day 28 a) without notches, b) with notches.
At day 1, 13.3% of the women had at least one notch. The correspond-ing figure for day 56 was 90.6% (Fig.17). Two women had bilateral diastolic notches at all examinations (case 22 and 34). Total absence of early diastolic notches throughout the puerperium was observed in only one woman (case 37). In 7 women an observed notch or notches had disappeared at a later examination. All measurements of the uterus and uterine cavity diameters fell within the reference area.

44
Pathological puerperium - Doppler Ultrasound
Study V
Twenty patients with clinical suspicion of RPT, who were to undergo surgical evacuation, were enrolled in the study.
a)
Day postpartum
Indi
vidu
al u
terin
e ar
tery
RI m
eans
1 7 14 28 563
0.3
0.4
0.5
0.6
0.7
0.8
0.9
1.0
Day postpartum
Indi
vidu
al u
terin
e ar
tery
RI m
eans
1 7 14 28 563
0.3
0.4
0.5
0.6
0.7
0.8
0.9
1.0
Day postpartum
Indi
vidu
al u
terin
e ar
tery
RI m
eans
1 7 14 28 563
0.3
0.4
0.5
0.6
0.7
0.8
0.9
1.0
Day postpartum
Indi
vidu
al u
terin
e ar
tery
RI m
eans
1 7 14 28 563
0.3
0.4
0.5
0.6
0.7
0.8
0.9
1.0
Day postpartum
Indi
vidu
al u
terin
e ar
tery
RI m
eans
1 7 14 28 563
0.3
0.4
0.5
0.6
0.7
0.8
0.9
1.0
Day postpartum
Indi
vidu
al u
terin
e ar
tery
RI m
eans
1 7 14 28 563
0.3
0.4
0.5
0.6
0.7
0.8
0.9
1.0
Day postpartum
Indi
vidu
al u
terin
e ar
tery
RI m
eans
1 7 14 28 563
0.3
0.4
0.5
0.6
0.7
0.8
0.9
1.0
Day postpartum
Indi
vidu
al u
terin
e ar
tery
RI m
eans
1 7 14 28 563
0.3
0.4
0.5
0.6
0.7
0.8
0.9
1.0
Day postpartum
Indi
vidu
al u
terin
e ar
tery
RI m
eans
1 7 14 28 563
0.3
0.4
0.5
0.6
0.7
0.8
0.9
1.0
Day postpartum
Indi
vidu
al u
terin
e ar
tery
RI m
eans
1 7 14 28 563
0.3
0.4
0.5
0.6
0.7
0.8
0.9
1.0
Day postpartum
Indi
vidu
al u
terin
e ar
tery
RI m
eans
1 7 14 28 563
0.3
0.4
0.5
0.6
0.7
0.8
0.9
1.0
Day postpartum
Indi
vidu
al u
terin
e ar
tery
RI m
eans
1 7 14 28 563
0.3
0.4
0.5
0.6
0.7
0.8
0.9
1.0
Day postpartum
Indi
vidu
al u
terin
e ar
tery
RI m
eans
1 7 14 28 563
0.3
0.4
0.5
0.6
0.7
0.8
0.9
1.0
Day postpartum
Indi
vidu
al u
terin
e ar
tery
RI m
eans
1 7 14 28 563
0.3
0.4
0.5
0.6
0.7
0.8
0.9
1.0
Day postpartum
Indi
vidu
al u
terin
e ar
tery
RI m
eans
1 7 14 28 563
0.3
0.4
0.5
0.6
0.7
0.8
0.9
1.0
Day postpartum
Indi
vidu
al u
terin
e ar
tery
RI m
eans
1 7 14 28 563
0.3
0.4
0.5
0.6
0.7
0.8
0.9
1.0
Day postpartum
Indi
vidu
al u
terin
e ar
tery
RI m
eans
1 7 14 28 563
0.3
0.4
0.5
0.6
0.7
0.8
0.9
1.0
Day postpartum
Indi
vidu
al u
terin
e ar
tery
RI m
eans
1 7 14 28 563
0.3
0.4
0.5
0.6
0.7
0.8
0.9
1.0
Day postpartum
Indi
vidu
al u
terin
e ar
tery
RI m
eans
1 7 14 28 563
0.3
0.4
0.5
0.6
0.7
0.8
0.9
1.0
Day postpartum
Indi
vidu
al u
terin
e ar
tery
RI m
eans
1 7 14 28 563
0.3
0.4
0.5
0.6
0.7
0.8
0.9
1.0
90th percentilemedian10th percentile
b)Figure 18. Individual PI (a) and RI (b) mean values of both uterine arteries in post-partum women who underwent surgical evacuation due to suspected RPT in the uterine cavity. Reference values from Study IV from uncomplicated puerperium (10th, 50th and 90th percentiles, red lines) are given for comparison. The filled dot denotes the value from patient n.13 without histological confirmation.
Day postpartum
Indi
vidu
al u
terin
e ar
tery
PI m
eans
1 7 14 28 563
0.5
1.0
1.5
2.0
2.5
3.0
3.5
Day postpartum
Indi
vidu
al u
terin
e ar
tery
PI m
eans
1 7 14 28 563
0.5
1.0
1.5
2.0
2.5
3.0
3.5
Day postpartum
Indi
vidu
al u
terin
e ar
tery
PI m
eans
1 7 14 28 563
0.5
1.0
1.5
2.0
2.5
3.0
3.5
Day postpartum
Indi
vidu
al u
terin
e ar
tery
PI m
eans
1 7 14 28 563
0.5
1.0
1.5
2.0
2.5
3.0
3.5
Day postpartum
Indi
vidu
al u
terin
e ar
tery
PI m
eans
1 7 14 28 563
0.5
1.0
1.5
2.0
2.5
3.0
3.5
Day postpartum
Indi
vidu
al u
terin
e ar
tery
PI m
eans
1 7 14 28 563
0.5
1.0
1.5
2.0
2.5
3.0
3.5
Day postpartum
Indi
vidu
al u
terin
e ar
tery
PI m
eans
1 7 14 28 563
0.5
1.0
1.5
2.0
2.5
3.0
3.5
Day postpartum
Indi
vidu
al u
terin
e ar
tery
PI m
eans
1 7 14 28 563
0.5
1.0
1.5
2.0
2.5
3.0
3.5
Day postpartum
Indi
vidu
al u
terin
e ar
tery
PI m
eans
1 7 14 28 563
0.5
1.0
1.5
2.0
2.5
3.0
3.5
Day postpartum
Indi
vidu
al u
terin
e ar
tery
PI m
eans
1 7 14 28 563
0.5
1.0
1.5
2.0
2.5
3.0
3.5
Day postpartum
Indi
vidu
al u
terin
e ar
tery
PI m
eans
1 7 14 28 563
0.5
1.0
1.5
2.0
2.5
3.0
3.5
Day postpartum
Indi
vidu
al u
terin
e ar
tery
PI m
eans
1 7 14 28 563
0.5
1.0
1.5
2.0
2.5
3.0
3.5
Day postpartum
Indi
vidu
al u
terin
e ar
tery
PI m
eans
1 7 14 28 563
0.5
1.0
1.5
2.0
2.5
3.0
3.5
Day postpartum
Indi
vidu
al u
terin
e ar
tery
PI m
eans
1 7 14 28 563
0.5
1.0
1.5
2.0
2.5
3.0
3.5
Day postpartum
Indi
vidu
al u
terin
e ar
tery
PI m
eans
1 7 14 28 563
0.5
1.0
1.5
2.0
2.5
3.0
3.5
Day postpartum
Indi
vidu
al u
terin
e ar
tery
PI m
eans
1 7 14 28 563
0.5
1.0
1.5
2.0
2.5
3.0
3.5
Day postpartum
Indi
vidu
al u
terin
e ar
tery
PI m
eans
1 7 14 28 563
0.5
1.0
1.5
2.0
2.5
3.0
3.5
Day postpartum
Indi
vidu
al u
terin
e ar
tery
PI m
eans
1 7 14 28 563
0.5
1.0
1.5
2.0
2.5
3.0
3.5
Day postpartum
Indi
vidu
al u
terin
e ar
tery
PI m
eans
1 7 14 28 563
0.5
1.0
1.5
2.0
2.5
3.0
3.5
Day postpartum
Indi
vidu
al u
terin
e ar
tery
PI m
eans
1 7 14 28 563
0.5
1.0
1.5
2.0
2.5
3.0
3.590th percentilemedian10th percentile
45
Mean PI and mean RI values were below the 10th percentile for eight and seven women, respectively, compared to reference values, but overlapping was extensive (Fig.18 a and b). No patient had resistance indices above the 90th percentile. Only one woman had a diastolic notch before postpartum day 28. An example of a waveform from day 43 is shown in Fig.19.
Figure 19. Flow velocity waveforms of the uterine artery in postpartum women with histologically confirmed RPT (transvaginal approach); it demonstrates a low resistance flow without early diastolic notches on postpartum day 43.
The AP diameters of the uterus tended to be larger compared to the reference values (Study I) but overlapping was extensive. All but one cavity measurements were above the 90th percentile (Fig. 20).
Day postpartum
Cav
ity a
nter
opos
terio
r dia
met
er m
ax (m
m)
1 7 14 28 563
0
10
20
30
40
50
Day postpartum
Cav
ity a
nter
opos
terio
r dia
met
er m
ax (m
m)
1 7 14 28 563
0
10
20
30
40
50
Day postpartum
Cav
ity a
nter
opos
terio
r dia
met
er m
ax (m
m)
1 7 14 28 563
0
10
20
30
40
50
Day postpartum
Cav
ity a
nter
opos
terio
r dia
met
er m
ax (m
m)
1 7 14 28 563
0
10
20
30
40
50
Day postpartum
Cav
ity a
nter
opos
terio
r dia
met
er m
ax (m
m)
1 7 14 28 563
0
10
20
30
40
50
Day postpartum
Cav
ity a
nter
opos
terio
r dia
met
er m
ax (m
m)
1 7 14 28 563
0
10
20
30
40
50
Day postpartum
Cav
ity a
nter
opos
terio
r dia
met
er m
ax (m
m)
1 7 14 28 563
0
10
20
30
40
50
Day postpartum
Cav
ity a
nter
opos
terio
r dia
met
er m
ax (m
m)
1 7 14 28 563
0
10
20
30
40
50
Day postpartum
Cav
ity a
nter
opos
terio
r dia
met
er m
ax (m
m)
1 7 14 28 563
0
10
20
30
40
50
Day postpartum
Cav
ity a
nter
opos
terio
r dia
met
er m
ax (m
m)
1 7 14 28 563
0
10
20
30
40
50
Day postpartum
Cav
ity a
nter
opos
terio
r dia
met
er m
ax (m
m)
1 7 14 28 563
0
10
20
30
40
50
Day postpartum
Cav
ity a
nter
opos
terio
r dia
met
er m
ax (m
m)
1 7 14 28 563
0
10
20
30
40
50
Day postpartum
Cav
ity a
nter
opos
terio
r dia
met
er m
ax (m
m)
1 7 14 28 563
0
10
20
30
40
50
Day postpartum
Cav
ity a
nter
opos
terio
r dia
met
er m
ax (m
m)
1 7 14 28 563
0
10
20
30
40
50
Day postpartum
Cav
ity a
nter
opos
terio
r dia
met
er m
ax (m
m)
1 7 14 28 563
0
10
20
30
40
50
Day postpartum
Cav
ity a
nter
opos
terio
r dia
met
er m
ax (m
m)
1 7 14 28 563
0
10
20
30
40
50
Day postpartum
Cav
ity a
nter
opos
terio
r dia
met
er m
ax (m
m)
1 7 14 28 563
0
10
20
30
40
50
Day postpartum
Cav
ity a
nter
opos
terio
r dia
met
er m
ax (m
m)
1 7 14 28 563
0
10
20
30
40
50
Day postpartum
Cav
ity a
nter
opos
terio
r dia
met
er m
ax (m
m)
1 7 14 28 563
0
10
20
30
40
50
Day postpartum
Cav
ity a
nter
opos
terio
r dia
met
er m
ax (m
m)
1 7 14 28 563
0
10
20
30
40
5090th percentilemedian10th percentile
Figure 20. Maximum cavity AP diameters in postpartum women with suspected RPT, who underwent surgical evacuation. Reference values (red lines) from uncom-plicated postpartum periods (10th, 50th and 90th percentiles) are given for compari-son. The filled dot shows the value from patient 13 without histological confirma-tion.

46
The most common qualitative US finding was a circumscript, lobu-lated echogenic mass, which was observed in 18 (94.4%) patients (Figs. 21 and 22a). A hyper-vascular area was observed among 12 patients with histologi-cal confirmation (Fig. 22b). In eight cases, six with histological con-firmation, no hyper-vascular area was observed.
Figure 21. Flow chart of the patients from Study V. CD = Colour Doppler, D&C = Dilatation and Curettage.
22D&C
2 excluded Tissue not sent
20
18 echogenic mass12 CD +6 CD -
2 mixed echo pattern2 CD -
1Histology
confirmative
1Histology not confirmative
18Histology
confirmative

47
a)
b)Figure 22. a) Transvaginal ultrasound image of the uterus on day 43 postpartum in a patient with secondary postpartum hemorrhage. An echogenic mass is seen in the cavity (arrow) and histology confirmed RPT. b) Colour Doppler image of the same patient. A hyper-vascular area with “feeding vessels” (short arrow) is seen on one side of the echogenic mass (long arrow)

48
Two patients had a mixed echo pattern (Fig. 23 a and b). Histology from one of them did confirm placental tissue (b). In all 18 cases where an echogenic mass was demonstrated histology revealed pla-cental tissue.
a)
b)
Figure 23. Transabdominal approach. a) A mixed echo pattern in the cavity with dominant fluid component. Histology showed necrotic decidua and blood clots. b) Mixed echo pattern with dominant solid component in a patient who was delivered by cesarean section. Histology confirmed RPT.

49
DISCUSSION
General discussion
The aim of this thesis was to describe uterine changes throughout the puerperium as revealed by gray-scale and Doppler ultrasound after normal delivery and in cases of puerperal complications, particularly RPT. Our findings are discussed in light of known physiological and pathophysiological mechanisms.
Normal puerperium - Gray-scale USStudy I
This prospective, longitudinal study on the normal puerperium dem-onstrates that US appearances of the uterus and uterine cavity change throughout the puerperium in a unique way.
Quantitative measurements
Our results concerning AP diameters of the uterus are partly in agree-ment with previously published findings (Szoke and Kiss, 1976; De-foort et al, 1978; Lee et al, 1981; Lavery and Shaw, 1989; Wachsberg et al, 1996; Sokol et al, 2004). However, Szoke and Defoort examined women only during the first 7 days postpartum, and they used old compound US machines. With regard to the uterine cavity, it is diffi-cult to compare results due to variation in the measured variables. Ro-deck reported continuously diminishing maximum width of the cavity throughout the puerperium. In contrast, Lavery and Shaw found that the AP diameter of the cavity did not change significantly during the
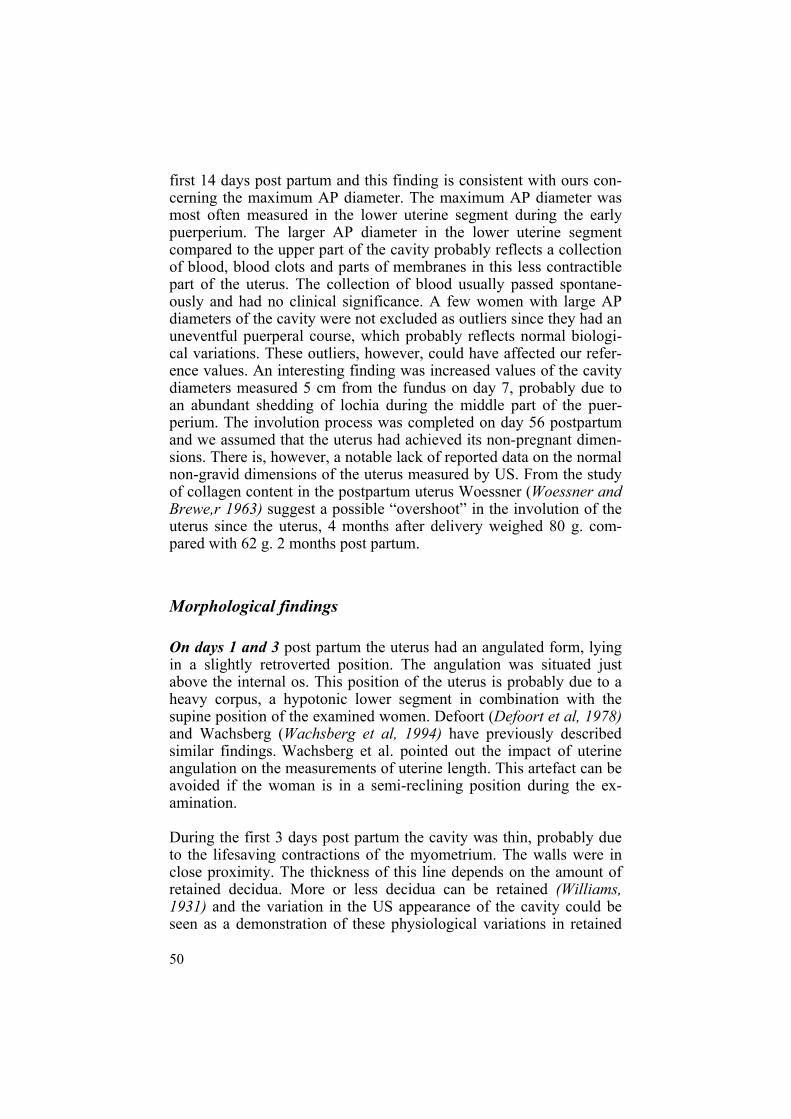
50
first 14 days post partum and this finding is consistent with ours con-cerning the maximum AP diameter. The maximum AP diameter was most often measured in the lower uterine segment during the early puerperium. The larger AP diameter in the lower uterine segment compared to the upper part of the cavity probably reflects a collection of blood, blood clots and parts of membranes in this less contractible part of the uterus. The collection of blood usually passed spontane-ously and had no clinical significance. A few women with large AP diameters of the cavity were not excluded as outliers since they had an uneventful puerperal course, which probably reflects normal biologi-cal variations. These outliers, however, could have affected our refer-ence values. An interesting finding was increased values of the cavity diameters measured 5 cm from the fundus on day 7, probably due to an abundant shedding of lochia during the middle part of the puer-perium. The involution process was completed on day 56 postpartum and we assumed that the uterus had achieved its non-pregnant dimen-sions. There is, however, a notable lack of reported data on the normal non-gravid dimensions of the uterus measured by US. From the study of collagen content in the postpartum uterus Woessner (Woessner and Brewe,r 1963) suggest a possible “overshoot” in the involution of the uterus since the uterus, 4 months after delivery weighed 80 g. com-pared with 62 g. 2 months post partum.
Morphological findings
On days 1 and 3 post partum the uterus had an angulated form, lying in a slightly retroverted position. The angulation was situated just above the internal os. This position of the uterus is probably due to a heavy corpus, a hypotonic lower segment in combination with the supine position of the examined women. Defoort (Defoort et al, 1978)and Wachsberg (Wachsberg et al, 1994) have previously described similar findings. Wachsberg et al. pointed out the impact of uterine angulation on the measurements of uterine length. This artefact can be avoided if the woman is in a semi-reclining position during the ex-amination.
During the first 3 days post partum the cavity was thin, probably due to the lifesaving contractions of the myometrium. The walls were in close proximity. The thickness of this line depends on the amount of retained decidua. More or less decidua can be retained (Williams, 1931) and the variation in the US appearance of the cavity could be seen as a demonstration of these physiological variations in retained
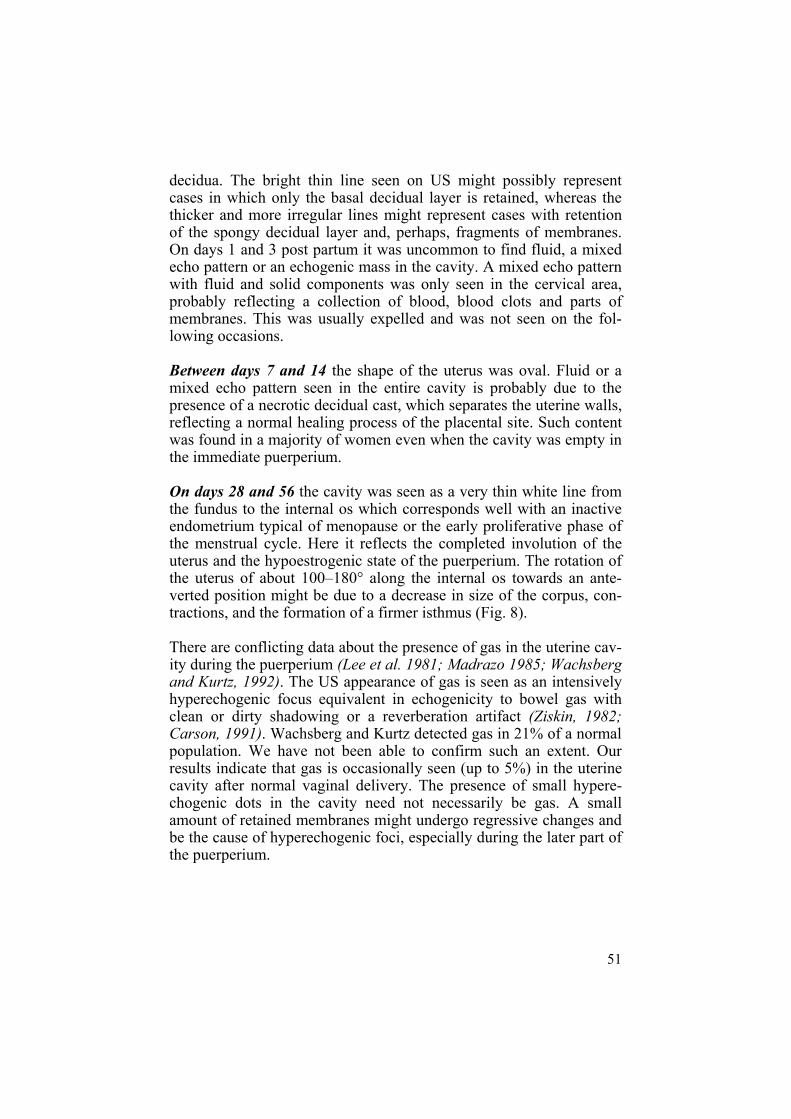
51
decidua. The bright thin line seen on US might possibly represent cases in which only the basal decidual layer is retained, whereas the thicker and more irregular lines might represent cases with retention of the spongy decidual layer and, perhaps, fragments of membranes. On days 1 and 3 post partum it was uncommon to find fluid, a mixed echo pattern or an echogenic mass in the cavity. A mixed echo pattern with fluid and solid components was only seen in the cervical area, probably reflecting a collection of blood, blood clots and parts of membranes. This was usually expelled and was not seen on the fol-lowing occasions.
Between days 7 and 14 the shape of the uterus was oval. Fluid or a mixed echo pattern seen in the entire cavity is probably due to the presence of a necrotic decidual cast, which separates the uterine walls, reflecting a normal healing process of the placental site. Such content was found in a majority of women even when the cavity was empty in the immediate puerperium.
On days 28 and 56 the cavity was seen as a very thin white line from the fundus to the internal os which corresponds well with an inactive endometrium typical of menopause or the early proliferative phase of the menstrual cycle. Here it reflects the completed involution of the uterus and the hypoestrogenic state of the puerperium. The rotation of the uterus of about 100–180° along the internal os towards an ante-verted position might be due to a decrease in size of the corpus, con-tractions, and the formation of a firmer isthmus (Fig. 8).
There are conflicting data about the presence of gas in the uterine cav-ity during the puerperium (Lee et al. 1981; Madrazo 1985; Wachsberg and Kurtz, 1992). The US appearance of gas is seen as an intensively hyperechogenic focus equivalent in echogenicity to bowel gas with clean or dirty shadowing or a reverberation artifact (Ziskin, 1982; Carson, 1991). Wachsberg and Kurtz detected gas in 21% of a normal population. We have not been able to confirm such an extent. Our results indicate that gas is occasionally seen (up to 5%) in the uterine cavity after normal vaginal delivery. The presence of small hypere-chogenic dots in the cavity need not necessarily be gas. A small amount of retained membranes might undergo regressive changes and be the cause of hyperechogenic foci, especially during the later part of the puerperium.
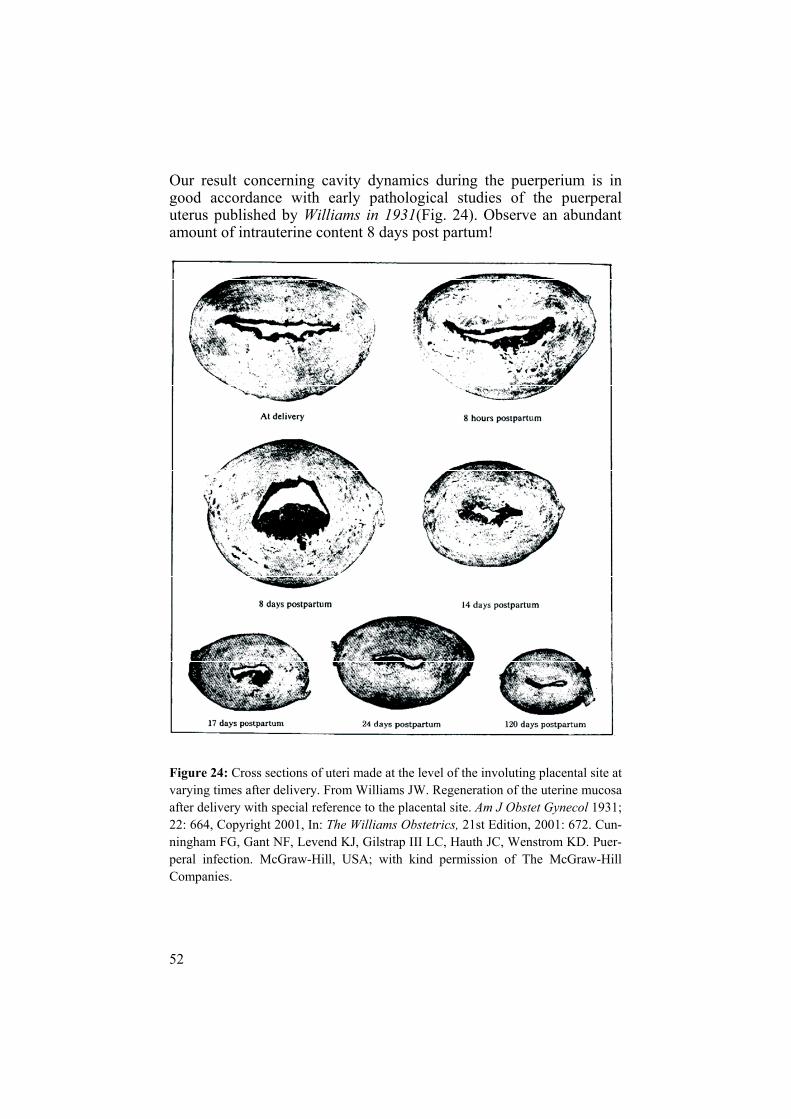
52
Our result concerning cavity dynamics during the puerperium is in good accordance with early pathological studies of the puerperal uterus published by Williams in 1931(Fig. 24). Observe an abundant amount of intrauterine content 8 days post partum!
Figure 24: Cross sections of uteri made at the level of the involuting placental site at varying times after delivery. From Williams JW. Regeneration of the uterine mucosa after delivery with special reference to the placental site. Am J Obstet Gynecol 1931; 22: 664, Copyright 2001, In: The Williams Obstetrics, 21st Edition, 2001: 672. Cun-ningham FG, Gant NF, Levend KJ, Gilstrap III LC, Hauth JC, Wenstrom KD. Puer-peral infection. McGraw-Hill, USA; with kind permission of The McGraw-Hill Companies.

53
We did not observe an echogenic mass among the 87 women from our two studies on the normal puerperium (I, IV). This is in disagreement with a few recently published studies. Edwards and Ellwood, (2000)reported the presence of an echogenic mass in 51% of normal cases on day 7, in 21% on day 14 and in 6% on day 21. He classified the ap-pearance of the uterine cavity contents into two categories: presence of an echogenic mass or not. It remains unclear whether or not a mixed echo pattern was included in the “echogenic mass” group. Sokol et al. (2004) used the same classification and found “echogenic material” in 40% of women 48 hours after a normal delivery. How-ever, 14 of his 16 cases demonstrated echogenic material in the lower uterine segment while only two had such findings in the corpus. It is unclear if “echogenic material” is the same as an “echogenic mass” or if it might be a mixed echo pattern as defined in our study. Thus, the discrepancy between these 2 studies and our findings may be ex-plained by different definitions of intrauterine content since we distin-guished a mixed echo pattern from an echogenic mass; distinctions not done in the studies of Edwards and Ellwood (2000) and Sokol et al (2004).
We were unable to find any correlation between the involution of the uterus and parity, breast-feeding or infant birth weight.
As regards parity, the results of previously published studies are con-tradictory. We recorded somewhat higher AP diameters in parous compared to nulliparous women. The differences were, however, not statistically significant. Our results are in agreement with findings reported by Defoort et al. (1978), Van Rees et al. (1981), Sokol et al.(2004), Lavery and Shaw (1991) and Edwards and Ellwood (2001). In contrast Wachsberg et al. (1994), Szoke and Kiss (1976) and Lee et al. (1981) found a significantly larger uterine size as maternal parity in-creased. Rodeck and Newton (1976) also reported significantly higher cavity width in secundiparae on days 3, 5, and 8.
Breast-feeding did not influence uterine involution, which is in accor-dance with the results of a vast majority of previously published stud-ies (Rodeck and Newton, 1976; Van Rees et al, 1981; Lavery and Shaw, 1989; Wachsberg et al; 1994 Sokol et al, 2004). In contrast Negishi et al. (1999) found a correlation between the size of the uterus and breast-feeding rate. This correlation was significant only at three months after delivery.
Concerning infant birth-weight, Wachsberg et al. (1994) did not find any correlation with involution of the uterus, which is in agreement

54
with our findings. In contrast Rodeck and Newton (1976) and Laveryand Shaw (1989) have reported a significant positive correlation be-tween infant birth weight and uterine dimensions.
We found that women who smoked had slightly higher maximum AP diameters of the uterus (p = 0.0432). However, only five women were smokers. There are no published studies concerning maternal smoking and involution of the uterus. It might be that substances in cigarette smoke have a negative impact on the uterine involution process.
Pathological puerperium - Gray-scale US Study II
Echogenic mass
The most common US finding associated with RPT was an echogenic mass combined with an AP diameter above the 90th percentile. All 14 cases from Study II and 18 cases from study V with histological con-firmation of placental tissue had an echogenic mass in the cavity. The findings from the Study V can be seen as a confirmation of the results from the Study II. Two patients with echogenic mass, however, had inconclusive histology.
US images of RPT have most often been described as an echogenic mass (Lee et al, 1981; Hertzberg and Bowie, 1991; Carlan et al, 1997; Durfee et al, 2005). Lee et al, described RPT as “a discrete solid mass and calcifications with acoustic shadows inside the mass” and in 8 of 9 patients with such findings a confirmation of RPT was obtained. Hertzberg and Bowie had histological confirmation of RPT in 9 of 10 cases with “an echogenic mass” in the cavity. Durfee et al. studied US features of RPT in 163 cases referred for US examination. They concluded that an endometrial mass in the cavity was the most sensitive and specific finding for RPT. These descriptions are in good agreement with our results although the study designs were not well suited for comparisons. Lee included 29 of 56 cases of PPH. The stud-ies of Hertzberg and the Durfee were retrospective and included a het-erogeneous study population including postabortion and postpartum women. Durfee et al. calculated sensitivity (SE), specificity (SP) and positive predictive value (PPV) although many of the patients did not undergo surgical evacuation. Such calculations cannot be considered appropriate.

55
Three studies often cited in the published literature evaluated asymp-tomatic women (De Vries et al, 2000; Carlan et al, 1997; Shen et al, 2003). De Vries examined 64 women who had a spontaneous abortion or gave birth before 28 weeks of pregnancy. A false positive rate (FPR) of 25% was calculated for the US finding of “echogenicity con-tinuous with the uterine wall”. Inclusion of asymptomatic women and early gestational ages, are possible explanations for the high FPR. Carlan described RPT as “highly variable but most often an echogenic mass” and all six patients with an echogenic mass had histological confirmation of placental tissue. He found a SE of 42% and a PPV of 58% and pointed out that US was not reliable to diagnose RPT except in cases of an echogenic mass. Shen et al. (2003) studied 39 asymp-tomatic patients suspected to have an incomplete placenta at delivery. In 21 patients US revealed echogenic, hypoechoic or mixed echo pat-terns. In 15 of these 21 patients, histology confirmed RPT, but in six patients only blood clots or decidua was found. A FPR of 28.6% was calculated for all three types of US findings. In our view it is method-ologically questionable to calculate the diagnostic accuracy of US among asymptomatic women. Moreover, we find it ethically question-able to expose asymptomatic women to a potentially hazardous inva-sive procedure.
Two studies (Neill et al, 2002, Ben-Ami et al, 2005) compared the diagnostic accuracy of clinical assessment with transabdominal US in the management of SPH and concluded that both methods were of limited value. Neill based US diagnosis of RPT on the presence of echogenic foci. They did not report dimensions of the echogenic foci and 45% of the study population had operative deliveries, which could have affected the US image. Ben-Ami et al. (2005) used the US signs “hyperechogenic, hypoechogenic and mixed echogenic patterns meas-uring more than 5mm” to predict RPT and found US to be a poor tool for this purpose. A majority (66.2%) of patients was admitted after early abortion and 2.9% after late abortion, which might have influ-enced the results.
Mixed echo pattern
In study II, only 1 out of 18 (5.6%) patients who underwent a surgical evacuation had a mixed echo pattern. Unfortunately, histological ex-amination was not available in that case. This patient also had an AP uterine cavity diameter within the normal range. Of 61 patients treated conservatively, 43 had a mixed echo pattern but none required a surgi-cal procedure. One of two patients from study V with a mixed echo

56
pattern on US had histologically confirmed RPT, which proves that RPT can not be ruled out by such a finding. As pointed out previously it is not always easy to differentiate an echogenic mass from a mixed echo pattern (Fig. 23 a and b).
Our results are in line with those reported by Lee et al. (1981), Hertz-berg and Bowie (1991) and Carlan et al. (1997) but in contrast to re-sults reported by Achiron et al. (1993) who considered findings of intracavitary mixed echo patterns of fluid and solid components as strongly suspicious of RPT. Carlan et al. (1997) observed “false posi-tive images” in 8 of 103 (7.7%) women and the common finding was a mixed pattern confined to the lower part of the uterus. Lee et al. re-ported negative histology in all five cases showing a mixed echo pat-tern. These reports support the view that a mixed echo pattern is a common finding in women with SPH and in the majority of cases these women will have an uneventful course with conservative treat-ment.
Empty cavity or minor amount of fluid
US appears to be a valuable tool for confirming an empty cavity. Lee (Lee et al, 1981) found an empty cavity in 20 of 27 patients with SPH. RPT could be demonstrated in only one case. Shen (Shen et al, 2003)observed an empty cavity in 18 patients and a minimal quantity of residual trophoblastic tissue was found in just one. These findings are consistent with our study in which we found an empty cavity among 18 of the conservatively treated patients and all had an uneventful clinical course. It could be that a minor amount of RPT might be hid-den in some cases where a mixed echo pattern is found or even in cases with fluid in the cavity or an empty cavity, as indicated in a few studies (Carlan et al, 1997; Shen et al, 2003). Even if RPT may be associated with types of US images other than echogenic masses, all but one of our patients with these types of US findings had an un-eventful course with conservative management.
There are many reasons for discrepancies in the published reports. Factors that might explain the low sensitivity and high false positive rate include a vague definition of the US diagnosis of RPT, study de-sign, mixed study populations including women with bleeding after an abortion, women with postpartum hemorrhage, many asymptomatic women and patients with endometritis. The accuracy of postpartum US for detection of RPT was calculated either from a small proportion of women who underwent curettage, assuming that women who had
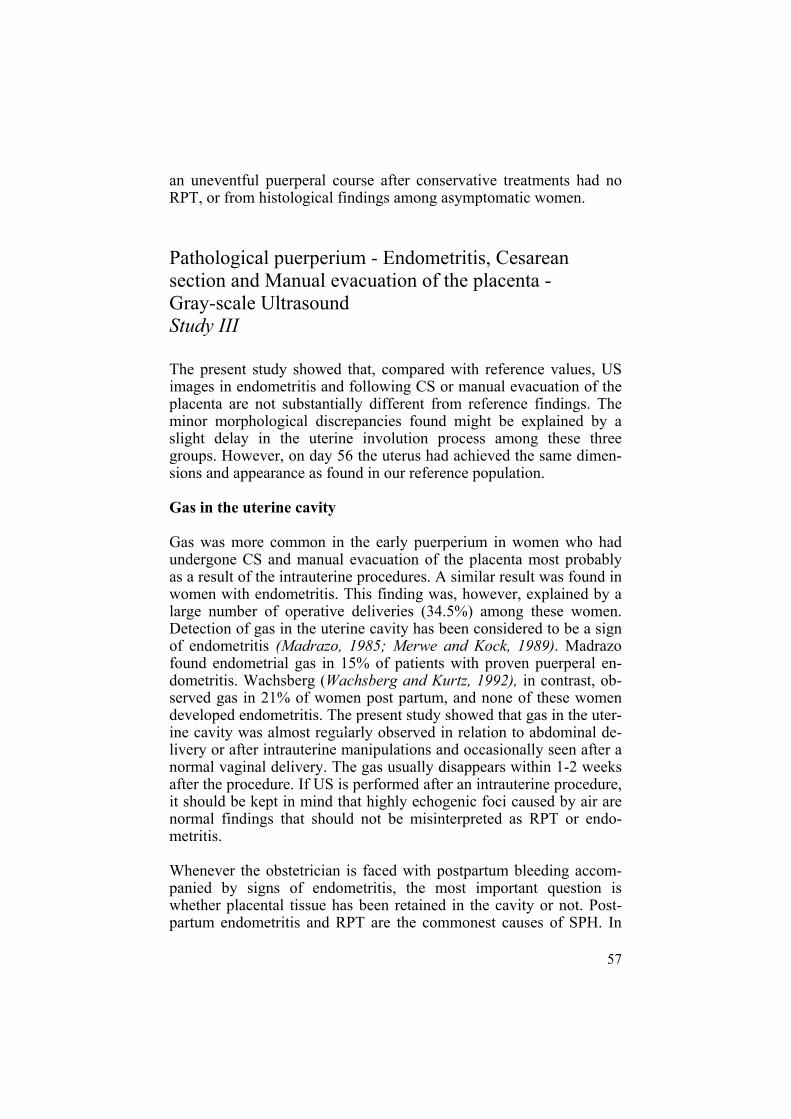
57
an uneventful puerperal course after conservative treatments had no RPT, or from histological findings among asymptomatic women.
Pathological puerperium - Endometritis, Cesarean section and Manual evacuation of the placenta - Gray-scale UltrasoundStudy III
The present study showed that, compared with reference values, US images in endometritis and following CS or manual evacuation of the placenta are not substantially different from reference findings. The minor morphological discrepancies found might be explained by a slight delay in the uterine involution process among these three groups. However, on day 56 the uterus had achieved the same dimen-sions and appearance as found in our reference population.
Gas in the uterine cavity
Gas was more common in the early puerperium in women who had undergone CS and manual evacuation of the placenta most probably as a result of the intrauterine procedures. A similar result was found in women with endometritis. This finding was, however, explained by a large number of operative deliveries (34.5%) among these women. Detection of gas in the uterine cavity has been considered to be a sign of endometritis (Madrazo, 1985; Merwe and Kock, 1989). Madrazo found endometrial gas in 15% of patients with proven puerperal en-dometritis. Wachsberg (Wachsberg and Kurtz, 1992), in contrast, ob-served gas in 21% of women post partum, and none of these women developed endometritis. The present study showed that gas in the uter-ine cavity was almost regularly observed in relation to abdominal de-livery or after intrauterine manipulations and occasionally seen after a normal vaginal delivery. The gas usually disappears within 1-2 weeks after the procedure. If US is performed after an intrauterine procedure, it should be kept in mind that highly echogenic foci caused by air are normal findings that should not be misinterpreted as RPT or endo-metritis.
Whenever the obstetrician is faced with postpartum bleeding accom-panied by signs of endometritis, the most important question is whether placental tissue has been retained in the cavity or not. Post-partum endometritis and RPT are the commonest causes of SPH. In
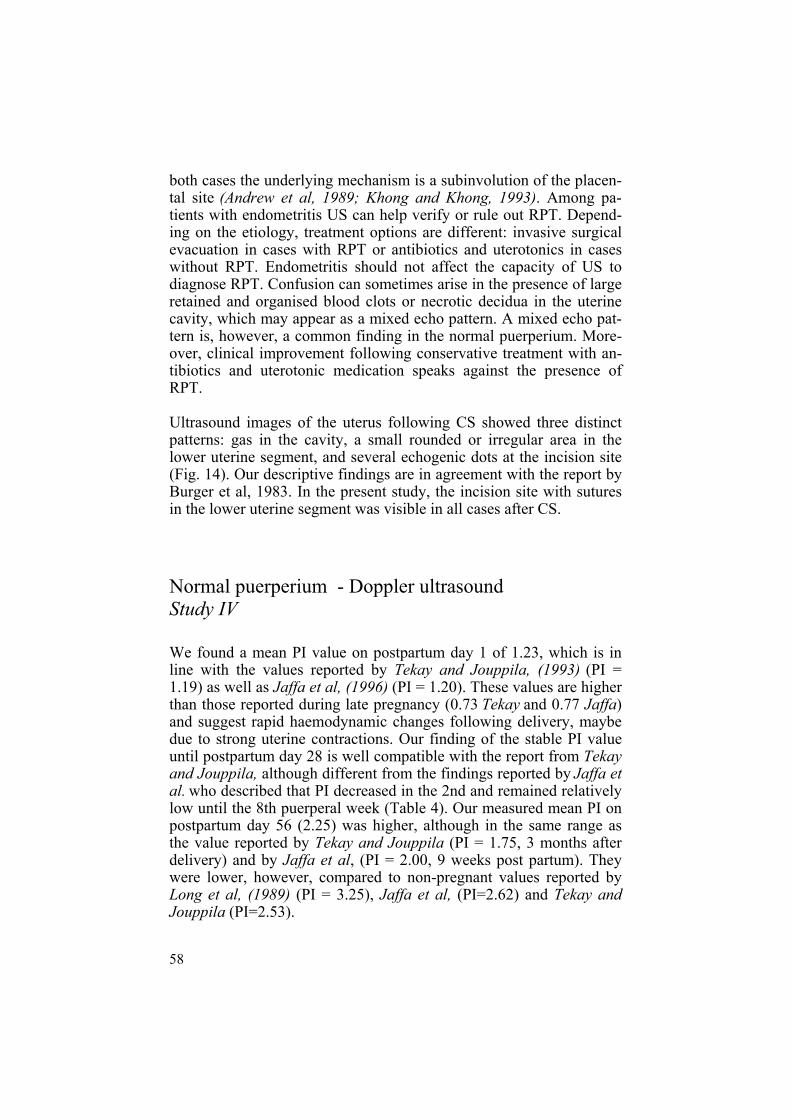
58
both cases the underlying mechanism is a subinvolution of the placen-tal site (Andrew et al, 1989; Khong and Khong, 1993). Among pa-tients with endometritis US can help verify or rule out RPT. Depend-ing on the etiology, treatment options are different: invasive surgical evacuation in cases with RPT or antibiotics and uterotonics in cases without RPT. Endometritis should not affect the capacity of US to diagnose RPT. Confusion can sometimes arise in the presence of large retained and organised blood clots or necrotic decidua in the uterine cavity, which may appear as a mixed echo pattern. A mixed echo pat-tern is, however, a common finding in the normal puerperium. More-over, clinical improvement following conservative treatment with an-tibiotics and uterotonic medication speaks against the presence of RPT.
Ultrasound images of the uterus following CS showed three distinct patterns: gas in the cavity, a small rounded or irregular area in the lower uterine segment, and several echogenic dots at the incision site (Fig. 14). Our descriptive findings are in agreement with the report by Burger et al, 1983. In the present study, the incision site with sutures in the lower uterine segment was visible in all cases after CS.
Normal puerperium - Doppler ultrasoundStudy IV
We found a mean PI value on postpartum day 1 of 1.23, which is in line with the values reported by Tekay and Jouppila, (1993) (PI = 1.19) as well as Jaffa et al, (1996) (PI = 1.20). These values are higher than those reported during late pregnancy (0.73 Tekay and 0.77 Jaffa)and suggest rapid haemodynamic changes following delivery, maybe due to strong uterine contractions. Our finding of the stable PI value until postpartum day 28 is well compatible with the report from Tekayand Jouppila, although different from the findings reported by Jaffa et al. who described that PI decreased in the 2nd and remained relatively low until the 8th puerperal week (Table 4). Our measured mean PI on postpartum day 56 (2.25) was higher, although in the same range as the value reported by Tekay and Jouppila (PI = 1.75, 3 months after delivery) and by Jaffa et al, (PI = 2.00, 9 weeks post partum). They were lower, however, compared to non-pregnant values reported by Long et al, (1989) (PI = 3.25), Jaffa et al, (PI=2.62) and Tekay and Jouppila (PI=2.53).
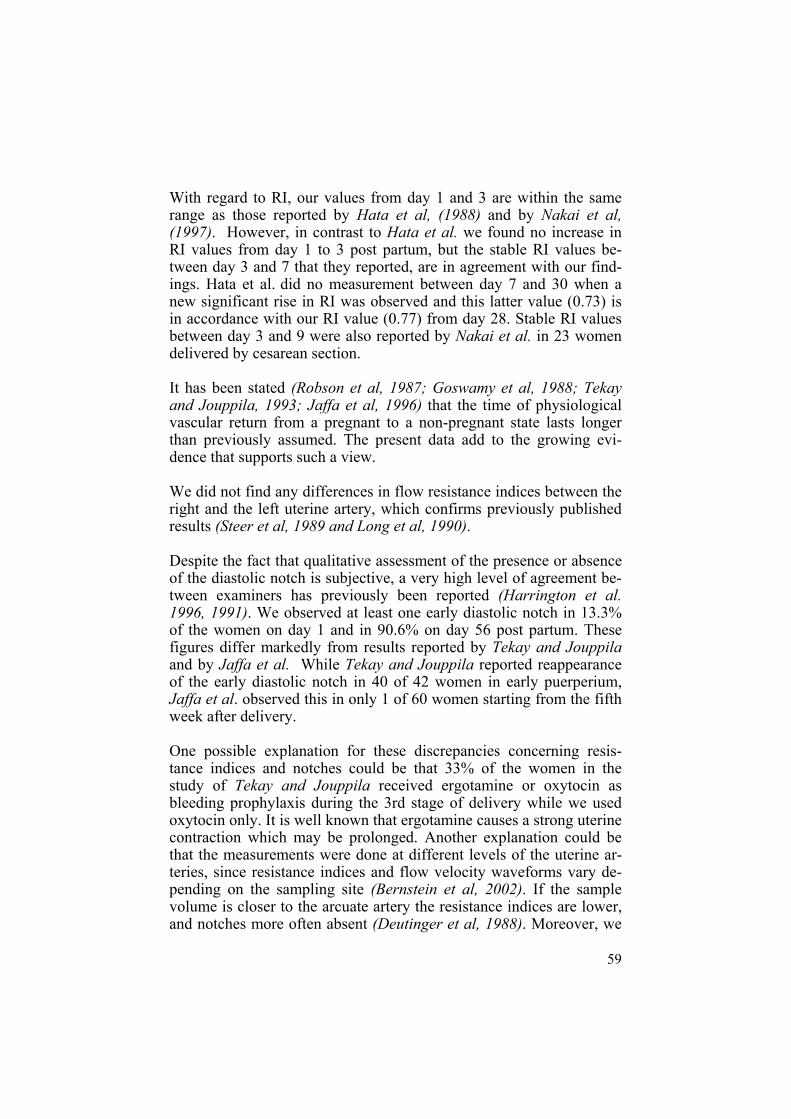
59
With regard to RI, our values from day 1 and 3 are within the same range as those reported by Hata et al, (1988) and by Nakai et al, (1997). However, in contrast to Hata et al. we found no increase in RI values from day 1 to 3 post partum, but the stable RI values be-tween day 3 and 7 that they reported, are in agreement with our find-ings. Hata et al. did no measurement between day 7 and 30 when a new significant rise in RI was observed and this latter value (0.73) is in accordance with our RI value (0.77) from day 28. Stable RI values between day 3 and 9 were also reported by Nakai et al. in 23 women delivered by cesarean section.
It has been stated (Robson et al, 1987; Goswamy et al, 1988; Tekay and Jouppila, 1993; Jaffa et al, 1996) that the time of physiological vascular return from a pregnant to a non-pregnant state lasts longer than previously assumed. The present data add to the growing evi-dence that supports such a view.
We did not find any differences in flow resistance indices between the right and the left uterine artery, which confirms previously published results (Steer et al, 1989 and Long et al, 1990).
Despite the fact that qualitative assessment of the presence or absence of the diastolic notch is subjective, a very high level of agreement be-tween examiners has previously been reported (Harrington et al. 1996, 1991). We observed at least one early diastolic notch in 13.3% of the women on day 1 and in 90.6% on day 56 post partum. These figures differ markedly from results reported by Tekay and Jouppilaand by Jaffa et al. While Tekay and Jouppila reported reappearance of the early diastolic notch in 40 of 42 women in early puerperium, Jaffa et al. observed this in only 1 of 60 women starting from the fifth week after delivery.
One possible explanation for these discrepancies concerning resis-tance indices and notches could be that 33% of the women in the study of Tekay and Jouppila received ergotamine or oxytocin as bleeding prophylaxis during the 3rd stage of delivery while we used oxytocin only. It is well known that ergotamine causes a strong uterine contraction which may be prolonged. Another explanation could be that the measurements were done at different levels of the uterine ar-teries, since resistance indices and flow velocity waveforms vary de-pending on the sampling site (Bernstein et al, 2002). If the sample volume is closer to the arcuate artery the resistance indices are lower, and notches more often absent (Deutinger et al, 1988). Moreover, we
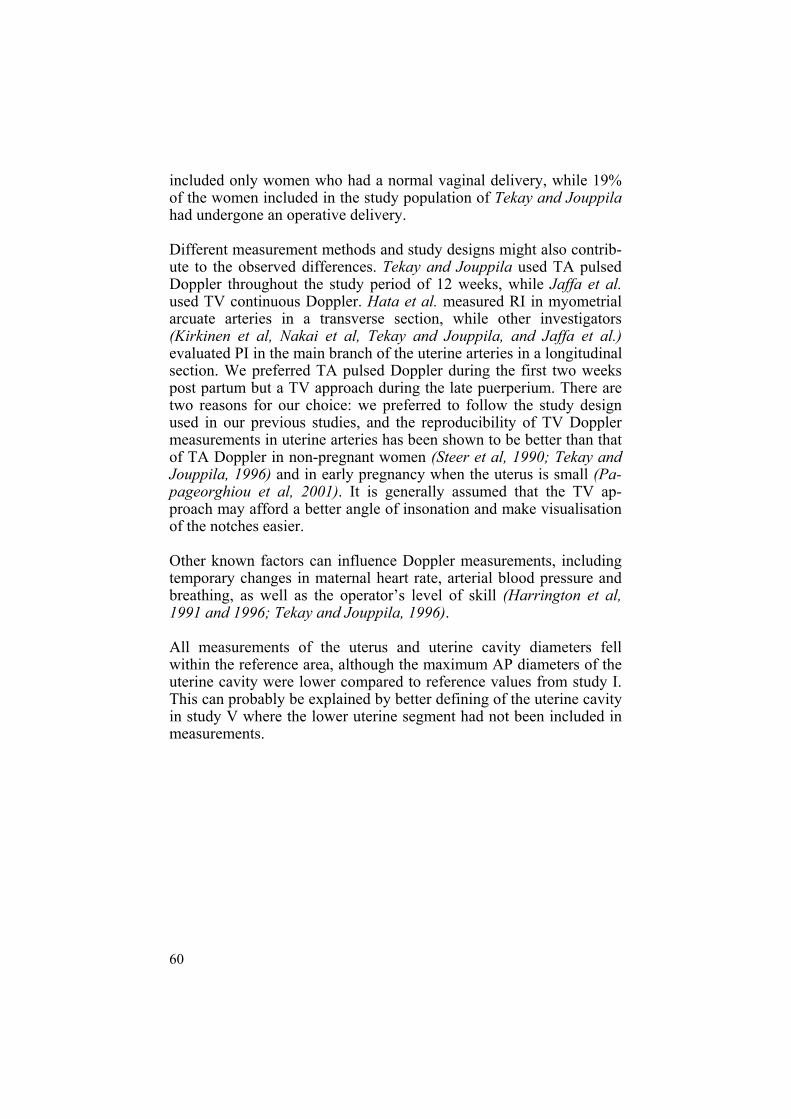
60
included only women who had a normal vaginal delivery, while 19% of the women included in the study population of Tekay and Jouppilahad undergone an operative delivery.
Different measurement methods and study designs might also contrib-ute to the observed differences. Tekay and Jouppila used TA pulsed Doppler throughout the study period of 12 weeks, while Jaffa et al.used TV continuous Doppler. Hata et al. measured RI in myometrial arcuate arteries in a transverse section, while other investigators (Kirkinen et al, Nakai et al, Tekay and Jouppila, and Jaffa et al.)evaluated PI in the main branch of the uterine arteries in a longitudinal section. We preferred TA pulsed Doppler during the first two weeks post partum but a TV approach during the late puerperium. There are two reasons for our choice: we preferred to follow the study design used in our previous studies, and the reproducibility of TV Doppler measurements in uterine arteries has been shown to be better than that of TA Doppler in non-pregnant women (Steer et al, 1990; Tekay and Jouppila, 1996) and in early pregnancy when the uterus is small (Pa-pageorghiou et al, 2001). It is generally assumed that the TV ap-proach may afford a better angle of insonation and make visualisation of the notches easier.
Other known factors can influence Doppler measurements, including temporary changes in maternal heart rate, arterial blood pressure and breathing, as well as the operator’s level of skill (Harrington et al, 1991 and 1996; Tekay and Jouppila, 1996).
All measurements of the uterus and uterine cavity diameters fell within the reference area, although the maximum AP diameters of the uterine cavity were lower compared to reference values from study I. This can probably be explained by better defining of the uterine cavity in study V where the lower uterine segment had not been included in measurements.

61
Table 4. An overview of uterine artery PI and RI means in studies on Doppler Ultrasound during the puerperium.
Mulic-L et al.
Tekay &Jouppila
Jaffa et al.
Hata et al.
Long et al.
Postpartum day
TA &TV TA TV TA TA
PI 1 1.22(0.7) 1.19(0.36) 1.20(0.27)
3 1.22(0.36) 1.15(0.05)
7 1.22(0.26) 1.19(0.36)
14 1.33(0.56) 1.05(0.32)
28 1.81(0.42) 1.12(0.19)
56 2.25(0.62) 1.75*(0.56) 2.00(0.58)
RI 1 0.65(0.07) 0.58(0.04)
3 0.65(0.09) 0.64(0.06)
7 0.66(0.07) 0.66(0.07)
14 0.65(0.11)
28 0.77(0.07)
56 0.84(0.07)
PI Late preg-nancy
0.73(0.15) 0.77(0.14)
RI 0.37(0.09)
PI Proliferative phase of menstruation cycle
2.53(0.98) 2.62.(0.59) 3.25(0.9)
* The PI value is at day 84 post partum. TA: transabdominal, TV: transvaginal

62
Pathological puerperium - Doppler USStudy V
Retained placental tissue in the uterine cavity may cause a delay in the normal physiological involution of the uterine vessels (Andrew et al. 1989, Khong and Khong 1993). We investigated this possible correla-tion.The values of resistance flow indices were below the 10th percentile for 8 of 20 (40.0%) women of which 7 had histological confirmation of RPT and 1 did not. There was, however, considerable overlap (Fig 18 a and b). No patient had resistance indices above the 90th percen-tile. In 12 of 20 (60.0%) patients an early diastolic notch was absent. Early diastolic notches appeared relatively late compared to the find-ings in study IV. Only one woman had a notch before postpartum day 28.
a) b)
Figure 25 a and b. Colour Doppler ultrasound showed the presence of a hyper-vascular area in the myometrium close to the echogenic mass (arrows). Histology confirmed RPT.
In the present study examination by Colour Doppler showed a hyper-vascular area close to the echogenic mass in 12 of 20 (60%) patients, all with histologically confirmed RPT (Fig. 25 a and b). This figure is slightly higher than that reported by Durfee et al. (2005) (55%) and by Zalel et al. (2002) (46%). A hypervascular area was absent in 8 pa-tients (40%) of which six had an echogenic mass and histological con-firmation of RPT. Our findings that the absence of blood flow does not exclude RPT confirm previously reported results (Zalel et al, 2002; Durfee et al, 2005).
63
The presence of a hypervascular area in the myometrium within or close to the echogenic mass has previously been interpreted alterna-tively as a common physiological finding (Van Schoubroeck et al,2004), as a finding associated with the presence of RPT (Kido et al, 2003; Alcazar et al, 1996; Achiron et al, 1993; Durfee et al, 2005) or with arteriovenous (AV) malformations (Kelly et al, 2003; Mungen et al, 1997; Timmerman et al, 2000 and 2003). Pulsed Doppler usually demonstrates a low resistance turbulent flow with high systolic veloc-ity, resembling AV malformations. It has recently been suggested that curettage should not be performed in patients who present with SPH and a colour Doppler image of a hypervascular area within the myo-metrium (Timmerman et al, 2000 and 2003). Van den Bosch (Van den Bosch et al, 2002) examined 385 consecutive postpartum women and reported that a hypervascular area in the uterus was relatively common (8.3%) and disappeared either spontaneously or after removal of pla-cental remnants.Mungen (Mungen, 2003) has recently drawn attention to a tendency to overdiagnose true AV malformations. He pointed out that a majority of hyper-vascular areas in the myometrium probably represented nor-mal “peri-villous flow” in the spiral arteries. The regression period may be prolonged in the presence of RPT. Only in very rare instances do they represent true arteriovenous malformations. In our recent work on angiographic embolization for treatment of major postpartum hemorrhage (Eriksson et al, in press), no true AV malformation was diagnosed among 20 patients but 4 cases had pseudoaneurysm.
Methodological considerations and limitations of the study
The basic design in this thesis is explorative, observational, and de-scriptive, with its inherent limitations. Outcome measures were not predefined and results of significance tests should be interpreted with caution.
In the early puerperium the TA approach is recommended. Despite the fact that the introduction of TV US improved the diagnostic accuracy of US, a large uterus cannot be imaged properly with a TV probe in the early puerperium. Although a high frequency TV probe may better distinguish minor details, a relatively short focal length limits its use

64
during the early puerperium. Another important issue is the discomfort a vaginal examination might cause in early puerperium. Therefore, we preferred to use the TA approach during the first four examinations, on days 1, 3, 7 and 14 postpartum. In contrast, on days 28 and 56 postpartum, the uterus lies in the true pelvis and is markedly decreased in size. On these occasions, the TV approach is preferable.
The use of different examination approaches may attract criticism, particularly concerning studies performed by Doppler ultrasound, since reproducibility of measurements of the uterine artery resistance indices and the presence of notches may differ according to the projec-tion used. Therefore, the reference values presented here are only ap-plicable for measurements performed in the same way.
Defoort (Defoort et al, 1978) concluded that the AP diameter is not an appropriate variable for assessing uterine involution. In our opinion, however, the maximum AP diameter in the longitudinal section seems to be a suitable measurement to estimate the involution process; it is easy to obtain and only marginally subject to distortion.
Our findings in Study I might be affected by measurement errors since we did not exclude outliers and we did not strictly define the uterine cavity. The lower uterine segment was included in the cavity meas-urements. Thus, we sometimes recorded a high AP diameter in early puerperium when the uterine cavity was actually completely empty. However, we compensated for this by measuring the AP diameter in the upper part of the cavity as well. On the other hand, measuring the AP diameter at a distance 5 cm from the uterine fundus has its limita-tions since this site moves towards the cervix during the puerperium. (Fig.5). The best way to estimate cavity diameter is probably to meas-ure the maximum AP diameter above the cervix.
In spite of the longitudinal design of studies I and IV we did not use statistical analysis for repeated measurements. It is our opinion that statistics for repeated measurements should be applied only if the study material is balanced and if the drop-out rate is negligible. The p-values presented here have more descriptive characteristics and should be seen as hypothesis generating findings.
Drop-out from planned examinations is a well-known problem in all longitudinal studies. However this reflects the difficulties newly de-livered mothers have to cope with (postpartum blues, sleeping disor-ders, frequent breast-feeding and exhaustion).

65
One weakness of study II is that we did not perform surgical evacua-tion in all cases suspected to have RPT. Another one is that neither the sonographers nor the physicians responsible for the patient were blinded to clinical and US information, respectively. The evaluation of US as a diagnostic tool to diagnose RPT will thus be weakened be-cause knowledge of the US finding most probably affected the clini-cian’s decision about whether or not to perform a surgical procedure. These two limitations may constitute a source of selection bias. Al-though regrettable from a scientific point of view, it is difficult to cir-cumvent from an ethical point of view.
Strengths of the study
The prospective study design, repeated measurements on each subject, well defined study populations and clearly defined interpretation of US images are advantages compared to many previously published studies on puerperal ultrasound.
The prospective design helps us to draw conclusions about the nature of a three-dimensional structure, which is difficult to do from a single image in a retrospective study.
In our opinion, the regularity of the involutional changes is best re-vealed and understood by means of a longitudinal study design (Study I and IV). An understanding of the variety of normal US appearances of the uterus and uterine cavity throughout the entire puerperal period improves our ability to distinguish puerperal pathology from normal conditions and thus avoid unnecessary invasive procedures. Moreover, the knowledge obtained through US examinations can help us to better understand the physiology of the puerperium.
We included only postpartum women. Retained products of concep-tion after an abortion may be different from RPT after delivery.
One of the advantages of study II III and V is that we compared patho-logical findings with normal references with regard to both quantita-tive and morphological findings.

66
Clinical implications
During the study period colleagues at our department have become more aware of the physiological variability concerning US findings postpartum. Increased knowledge about the US appearances associ-ated with the normal puerperium will probably influence decision making with respect to the treatment of SPH. Obstetricians will probably become more restrictive about puerperal curettage when our results from the normal puerperium become generally known. Thus, unnecessary, potentially hazardous surgical treatments may be avoided.
Our findings that a mixed echo pattern is a common and insignificant finding of the involuting uterus that probably seldom is associated with RPT, suggest conservative management in such cases.
A more restrictive policy concerning puerperal curettage will probably have a beneficial influence on the reproductive health of women by decreasing the risk of Asherman’s syndrome.
With regard to our colour Doppler results (study V) it is important to know that the absence of a hyper-vascular area does not preclude RPT.
In order to meet the two most important ethical requirements “benefi-cium” and “non maleficium”, we made endeavours to better identify women who might benefit from surgical treatment from those for whom such a procedure is unnecessary and potentially hazardous.

67
CONCLUSIONS
In spite of great variations of the normal US appearance of the puerperal uterus some findings are characteristic of early, mid-dle and late puerperium. In the early and late puerperium the cavity is empty. A mixed echo pattern fills the whole cavity in the middle part of the puerperium and is a common and insig-nificant finding of the involuting uterus. (I, IV).
In patients with SPH, an echogenic mass in the uterine cavity combined with an AP diameter above the 90th percentile is as-sociated with retained placental tissue. An empty cavity and fluid in the cavity are consistent with the normal involution process of the puerperal uterus and predict a good clinical out-come (II, V). A mixed echo pattern in the uterine cavity is a common finding in women with SPH and the majority of these women will have an uneventful course with conservative treatment. Its association with RPT is probably weak (II, V).
Ultrasound images in endometritis, following CS or after man-ual evacuation of the placenta are not substantially different from those after an uncomplicated delivery (III).
In the early puerperium, uterine artery PI and RI are higher than those reported in late pregnancy. A significant increase is not seen until postpartum day 28. On day 56 the PI and RI val-ues are still lower compared to values reported for non-pregnant women, suggestive of a slow return of vascular physiology to a non-pregnant state (IV).
Although RPT is associated with lower resistance indices in the uterine arteries, which speaks in favour of a delayed invo-lution of these arteries, this knowledge has limited value as a diagnostic tool for RPT. The absence of a hyper-vascular area in the uterus does not exclude RPT (V).

68
ACKNOWLEDGEMENTS
As always, knowledge is not the matter of one but a collaboration of many. My research project is not an exception. In the spirit of Dalai Lama, numerous people have contributed to this work in different ways and I would particularly like to express my deepest appreciation to the following:
All wonderful mothers participating in our studies without whose patience, enthusiasm and understanding of the importance of research, this work would not have been possible. Ove Axelsson, my main tutor, friend and a prototype of a genuine mixture of the three cornerstones every University Hospital is founded on: an experienced clinician, an outstanding teacher and a veteran re-searcher. Thank you for introducing me to and guiding me patiently through my scientific work, for the rapid checking of my drafts and for having the talent to “amputate” my overloaded papers, making them reasonably understandable. For always being available, either when abroad or when taking part in Vasaloppet, for your amazing sense of humor and for so much more than this space will allow. Oddvar Bakos, my co-author, the most charming senior researcher, for seeing the person behind a strange name from the first moment, for being my doctor role model and for asking me to take part in this “un-attractive” research project.Karin Eurenius, my second tutor, co-author and friend, for cheerful, positive-thinking spirit, for the support and sensible advice for my papers, for enjoyable cooperation in the field of fetal-maternal medi-cine and for warm caring for my physical and mental health, tracking me down so I would not miss a single gym opportunity and last but not least, for the best “bondkakor”, made by your sister, that I’ve eaten in my entire life.The late Ulf Ulmsten, former head of the Department of Obstetrics and Gynecology, for generous embracing and including everyone no matter of their origin, which contributed to creative an inspiring at-mosphere making the Department of Obstetrics and Gynecology a really enjoyable and outstanding working environment.
69
Magnus Lindahl, my dear friend and colleague, for warm-hearted considering me as his equal from the first moment even when I was novice at the Department.Marianne Wåhlin, ultrasound midwife, my friend, for her enduring struggle in recruiting and examining many women after normal deliv-ery, without whose enthusiasm, the finishing of the paper IV would have been considerably delayed.All my former and present colleagues from the Department of Ob-stetrics and Gynecology, Uppsala, with Ulf Hansson, Gunilla Hall-berg and Elisabeth Darj at the top, for striving to provide working conditions enabling research despite the limited resources and re-quirements coming “above” for keeping budget, for taking part in nu-merous pleasant social activities, for creating “a feeling of one” de-spite the 50 strict individualists. I especially want to thank Elisabeth Ljunger, Olle Eriksson, Pia Axemo, Maria Jonsson, Gudlaugh Sver-risdottir and Gölin Wikstrand for showing alertness calling me when information arose about research patients throughout all these years.Misgena Bekuretzion and the staff of the Department of Obstetrics and Gynecology in County Hospital Gävle for co-authorship, friend-ship and valuable collaboration in the first phase of this project.Ingiridur Skirnissdottir, my picturesque roommate, for tolerant shar-ing with me the computer during several years despite a high level research activities we both performed, almost never being sore about this, for making me laugh one day and showing me the grey side of life the next, for taking care of my sight by bringing me to the light, both literally and in a deeper sense of meaning. My colleagues and neighbors Helle, Leif, Sara and Hashem for be-ing my personal building advisors during the exhausting “house-building phase” of my life. Having you in the neighborhood brings about a feeling of safety that only friends can create. Maria Cederholm, Zarko Alfirevic, my former as well as my present colleagues Masoumeh Rezapour, Tord Naessén and Christian Mo-berg, for expressing the readiness to help me when I was going through the hardest times of my life.All midwifes and precious under-nurses at fetal-maternal medicine and delivery department for high professional and enjoyable collabo-ration in daily and research work, for friendship and for inspiring and relaxing atmosphere, either at “fika discussions” or at “pub activities”. Ann-Kristin Hultqvist, Carina Bonsér, Ann-Charlotte Wallén, forexcellent secretarial help and in particular Birgitta Johansson withoutwhose help in collecting data, this work would have been much more incomplete. Inga Andersson, Vera Holmgren, Susanne Löfgren, Barbro Wester-berg,Karin Törnkvist, Stina Pettersson, Karin Wennquist, Marianne

70
Larsson, Britt Blomkvist and Anita Mattsson, these colourful girls, for friendly support and for solving all practical problems “behind the stage” not making great hullabaloo about that during all these years.Marianne Maehle-Schmidt and her colleagues, for their invaluable guiding and supporting me in statistics. Anders Björklund, my dear “external boss”, and his wonderful staff at BB-Stockholm, for creating a “successful marriage” between an excel-lent clinical work and the possibilities for conducting research. A lot of my writing works was completed during many quiet extra-working week-ends, days and nights. Thanks for inviting me on your 5-years jubilee celebration. I really appreciated and enjoyed it as I really felt a part of your team. Maud Marsden and my dear colleague Steven Lucas, for their skilful and rapid revision of my English language. Randi Eriksson, my dearest companion in sharing our common strug-gles to cope with overweight, for her altruism and spreading a warm-hearted caring of all people; Dalaj Lama himself could not do it better. Gene Kindell, my daughter Mia’s boyfriend, for making my 49th
birthday, together with Ulf, Solveig, Jane, Karin E, Isa and Karin R, unforgettable and for true caring of Mia during her student year in London.Memory on my beloved father, for stimulating for the first time my scientific curiosity giving me a heavy Klaic’s lexicon being aware my thirst for knowledge would never been fulfilled, for never-ending be-lieve in me and for teaching me to love all people.My dear mother, for not only placing a “high jump bar” too high, but for providing the opportunity for me to jump over it, sacrificing her own comfort and always putting my needs in her highest priority. My dear “little” brother, for his love, encouragements and caring of my health.My treasure Mia and Nina, for being my joy of living, my inspiration and my pride. Specifically, Mia for helping me in data input in my computer and for teaching me how to keep “red thread” in my papers, without whose swiftness the finishing of the thesis would have been considerably delayed, and Nina for showing tolerance in competition for computer, for making me laugh and pushing me to take time off from the writing when I “forgot to breath”, both of them reminding me of the most important things in life. My beloved husband, for following me since my 18-ens in my aca-demic endeavours, taking care of everything, putting his own career aside, really enjoying in my progress, for love and never-ending sup-port and for never allowing me to have a guilty conscience. Specifi-cally, for making drawings as well for my students works in Zagreb as for my doctoral thesis.

71
And last but most important Hans Bolander, Anders Hedin, Gudmar Lönnerholm, Bo Strömberg and their outstanding working teams,for taking care of my beloved daughter Nina when she was ill, without whose incredible professionalism, competence and skills, I would never been able to continue this work.
The studies were generously supported by continuously grants during all these years from: Ultrasound Foundation at the Department of Ob-stetrics and Gynecology, Uppsala University Hospital.

72
REFERENCES
1. Al-Inany H.Intrauterine adhesions An update. Acta Obstet Gynecol Scand 2001;80:986-993
2. Achiron R, Goldenberg M, Lipitz S, et al. Transvaginal duplex Doppler Ultrasonography in
bleeding patients suspected of having residual trophoblastic tissue. Obstet Gynecol 1993; 81:
507-11
3. Alcazar JL, Lopez-Garcia G, Zornoza A. A role of color velocity imaging and pulsed Doppler sonography to detect retained trophoblastic tissue. Ultrasound Obstet Gynecol 1996; 8 (Suppl 1): 41.
4. Alexander J, Thomas P, Sanhghera J. Treatments for secondary postpartum haemorrhage. The Cochrane Library, Issue 4, 2002; http://www.update-software.com [Accessed].
5. Andrew AC, Bulmer JN, Wells M, Morrison L, Buckley CH. Subinvolution of the uteropla-cental arteries in the human placental bed. Histopathology 1989; 15:395-405
6. Aziz N, Lenzi TA, Jeffrey RB, Lyell DJ. Postpartum Uterine Arteriovenous Fistula. Am Col-
lege of Obstetricians and Gynecologists 2004;103:1076-8
7. Baker ME, Bowie JD, Killam AP. Sonography of post caesarean section bladder-flap haema-toma. Am J Roentgenol.1984; 144:757-759.
8. Baskett TF. A flux of the reds: evolution of active management of the third stage of the labour. Journal of the Royal Society of Medicine 2000;93:489-93
9. Baumann H, Kirkinen P, Mueller R, Schnarwyler B, Huch A, Huch R. Blood flow velocity waveform in large maternal and uterine vessels throughout pregnancy and postpartum: a longi-tudinal study using duplex Sonography. Br J Obstet Gynaecol 1988; 95:1282-91.
10. Beazley JM, Underhill RA. Fallacy of the fundal height. BMJ 1970;4: 404 11. Ben-Ami I, Schneider D, Maymon R, Vaknin Z, Herman A, Halperin R. Sonographic versus
clinical evaluation as predictors of residual trophoblastic tissue. Hum Reprod 2005; 20: 1107–1111.
12. Bernstein IM, Ziegler WF, Leavitt T, Badger GJ. Uterine Artery Hemodynamic Adaptations Through the Menstrual Cycle Into Early Pregnancy. Obstet& Gynecol 2002; 99: 620-624
13. Bland JM, Altman DG. Statistical methods for assessing agreement between two methods of clinical measurement. Lancet 1986; 1:307-310.
14. Brar HS, Platt LD, De Vore GR, et al. Qualitative assessment of maternal uterine and fetal umbilical artery blood flow and resistance in labouring patients by Doppler velocimetry. Am J Obstet Gynecol 1988; 158:952.
15. Brosens I. Robertsson WB. Dixon HG. The physiological response of the vessels of the pla-cental bed to normal pregnancy. J Pathol. Bacteriol.1967;93:569-579
16. Burger NF, Dararas B, Boes EGM. An echogenic evaluation during the early puerperium of the uterine wound after caesarean section. J Ultrasound Med. 1983; 2:18.

73
17. Campbell S, Diaz-Recasen J, Griffin D, Cohen-Overbeek TE et al. New Doppler technique for assessing uteroplacental blood flow. Lancet 1983;1:675-7
18. Carlan SJ, Scott WT, Pollack R, Harris K. Appearance of the uterus by ultrasound immediately after placental delivery with pathologic correlation. J Clin Ultrasound 1997; 25(6):301–308.
19. Carson PL. Clean and dirty shadowing at US: a reappraisal. Radiology 1991; 181: 231–6 20. Defoort P, Benijts G, Thiery M, Martens G. Ultrasound assessment of puerperal uterine
involution. Eur J Obstet Gynaecol 1978; 8: 95–97 21. Deutchman ME, Hartmann KJ. Postpartum pyometra: a case report. J Fam Pract. 1993; 36:
449-452. 22. Deutinger J, Rudelstorfer R, Bernaschek G. Vaginosonographic velocimetry of both main
uterine arteries by visual vessel recognition and pulsed Doppler method during pregnancy. AmJ Obstet Gynecol 1988; 159: 1072-1076
23. Dewhurst C. Secondary postpartum haemorrhage. J Obstet Gynaecol Br Commonwealth 1966; 73: 53–58.
24. Donald I, MacVicar J, Brown TC. Investigation of abdominal masses by pulsed ultrasound. Lancet 1958; 1: 1188
25. Durfee SM, Frates MC, Luong A, Benson CB. The Sonographic and Color Doppler Features of Retained Products of Conception. J Ultrasound Med 2005;24:1181-1186
26. Edwards A, Ellwood DA. Ultrasonographic evaluation of the postpartum uterus. Ultrasound Obstet Gynecol 2000; 16:640–643.
27. Eriksson LG, Mulic-Lutvica A, Jangland L, Rickard Nyman. Massive postpartum hemor-
rhage treated with transcatheter arterial embolization: long-term effects, implication on fertil-
ity and technical considerations. (in press in Acta Radiologica, 2007)
28. Goswamy RK, Steptoe PC. Doppler ultrasound studies of the uterine artery in spontaneous ovarian cycles. Hum Reprod 1988;3:721-6
29. Harrington, KF, Campbell S, Bewley S and Bower S. Doppler velocimetry studies of the uterine artery in the early prediction of pre-eclampsia and intrauterine growth retardation. Eur. J. Obstet. Gynaecol. Reprod. Biol. 1991;42:14-20
30. Harrington, K, Cooper D, Lees C, Hecher K, Campbell S. Doppler ultrasound of the uterine arteries: the importance of bilateral notching in the prediction of preeclampsia, placental abruption or delivery of a small-for-gestational-age baby. Ultrasound Obstet. Gynecol 1996;182-8
31. Hata K, Hata T, Aoki S, Takamiya O, Kitao M. Changes in myometrial arcuate arterial compliance during the reproductive cycle as assessed by real-time two-dimensional and color flow pulsed Doppler ultrasound. J Cardiovasc Ultrasonogr 1988;7:309-314
32. Hertzberg BS, Bowie JD. Ultrasound of the postpartum uterus, prediction of retained placental tissue. J Ultrasound Med 1991; 10: 451-456
33. Hoveyda F, MacKenzie IZ. Secondary postpartum haemorrhage: incidence, morbidity and cur-rent management. BJOG 2001; 108: 927–930.
34. Hytten F. The Clinical Physiology of the Puerperium. London:Farrand Press, 1996 35. Jaffa AJ, Wolman I, Har-Toov J, Amster R, Peyser MR. Changes in uterine artery resistance
to blood flow during puerperium - a longitudinal study. J Matern-Fetal Invest 1996;6:27-30

74
36. Jaffa AJ, Weissman A, Har-Toov J, Shoham Z, Peyser RM. Flow velocity waveforms of the uterine artery in pregnancy: transvaginal versus transabdominal approach. Gynecol Obstet In-vest. 1995;40(2):80-3.
37. Janbu T, Koss KS, Nesheim B-I, Wesche J. Blood velocities in the uterine artery in humans during labour, Acta Physiol Scand 1985; 124:153-61
38. Janbu T, Nesheim B-I. Uterine artery blood velocities during contractions in pregnancy and labour related to intrauterine pressure. Br J Obstet Gynaecol.1987 Dec;94(12):1150-1155
39. Jensen PA and Stromme WB.Amenorrhhea secondary to puerperal curettage (Asherman’s
Syndrom), Am J Obstet Gynecol.1972;113:150-157
40. Jones RF, Warren BL, Thorton WN. Planned postpartum exploration of uterus, cervix and va-
gina. Obstet Gynecol 1996; 27:699-702
41. Kelly SM, Belli AM, Campbell S. Arteriovenous malformation of the uterus associated with
secondary postpartum haemorrhage. Ultrasound Obstet Gynecol 2003; 21:602-605.
42. Khong TY, Khong TK. Delayed postpartum hemorrhage: a morphologic study of causes and their relation to other pregnancy disorders. Obstet Gynecol 1993; 82: 17–22.
43. Kido A, Togashi K, Koyama Y, Ito H, Tatsumi Ket al. Retained products of conception mas-
querading as acquired arteriovenous malformation. J Comput Assist Tomogr 2003; 27: 88-92.
44. King PA, Duthie SJ, Dong ZG, Ma HK. Secondary postpartum haemorrhage. Aust NZ Obstet Gynaecol 1989; 29: 394–398.
45. Kirkinen P, Dudenhausen J, Baumann H, et al. Postpartum blood flow velocity waveforms of the uterine arteries. J Reprod Med 1988; 33:745–8
46. Kousougeras G, Karamanidis D, Chimonis G, Gottas N, Plydorou A, Elmazis Ch, et al. Evaluation during early puerperium of the low transverse incision after caesarean section through vaginal ultrasonography. Clin Exp Obstet Gynecol. 2003;30(4):245-247.
47. Laing FC, Frates MC. Ultrasound evaluation during the first trimester of pregnancy. In Ultra-sonography in Obstetrics and Gynecology, Callen PW, ed. Saunders company:Philadelphia, PA, 2000;127-128.
48. Lavery JP, Howell RS, Shaw L. Ultrasonic demonstration of a phlegmona following caesarean section-case report. J Clin Ultrasound. 1985;13:134-136.
49. Lavery JP, Shaw LA. Sonography of the postpartum uterus. J Ultrasound Med 1989; 8: 481–6 50. Lee CY, Madrazo B, Drukker BH. Ultrasonic evaluation of the postpartum uterus in the
management of postpartum bleeding. Obstet Gynecol 1981; 58: 227–232. 51. Lester WM, Bartholomew RA, Colvin ED, Grimes WH, Fish JS, Galloway WH. The role of
retained placental fragments in immediate and delayed postpartum hemorrhage., Am J Obstet Gynecol. 1956;72(6):1214-26
52. Long MG, Boultbee JE, Hanson ME, Begent RHJ. Doppler time velocity waveform studies of the uterine artery and uterus. Br J Obstet Gynaecol 1989; 96: 588-593
53. Madrazo BL. Postpartum Sonography. In: Sanders RC, James AE, eds. The Principles and Practice of Ultrasonography in Obstetrics and Gynecology, 3rd edn. East Norwalk: Appleton-Century-Crofts,1985: 449–56
54. Malvern J, Campbell S, May P. Ultrasonic scanning of the puerperal uterus following secondary postpartum hemorrhage. J Obstet Gynaecol Br Commonw 1973; 80: 320–324.

75
55. Marchant S. Routine assessment of postpartum uterine involution and vaginal loss and the re-lationship of these observations to morbidity (Unpublished PhD thesis) University of Ports-mouth 1999.
56. Merwe CA, Kock Z. The ultrasonographic demonstration of gas in the endometrial cavity: an aid for the diagnosis of puerperal endometritis. S Afr Med J 1989; 76: 203–5
57. Meyenburg M, Schulze-Hagen K, Schaller G. Involution of the uterus following vaginal or abdominal delivery. Z Geburtshilfe Perinatol. 1983;187(4):200-2.
58. Müngen E, Yergök YZ, Ertekin AA, Ergür AR, Ucmakli E, Aytaclar S. Color Doppler sono-
graphic features of uterine arteriovenous malformations: report of two cases. Ultrasound Ob-
stet Gynecol 1997;10:215-219
59. Müngen E. Vascular abnormalities of the uterus: have we recently over- diagnosed them?
Ultrasound Obstet Gynecol 2003; 21:529-531.
60. Nakai Y, Imanaka M, Nishio J, et al. Uterine blood flow velocity waveforms during early postpartum course following caesarean section. Eur J Obstet Gynecol Reprod Biol 1997; 74(2):121-4.
61. Negishi H, Kishida T, Yamada H, Hirayama E, Mikuni M, Fujimoto S. Changes in uterine size after vaginal delivery and caesarean section determined by vaginal sonography in the puerperium. Arch Gynecol Obstet. 1999;263(1-2):13-16.
62. Neill AMC, Nixon RM, Thornton S. A comparison of clinical assessment with ultrasound in the management of secondary postpartum haemorrhage. Eur J Obstet Gynecol and Reprod Biol 2002; 104:113-115
63. Oppenheimer LW, Sherriff EA, Goodman JDS, Shah D, James CE. The duration of lochia. Br J Obstet Gynaecol 1986;93:754-7
64. Papageorghiou AT, To MS, YU CK, Nicolaides KH. Repeatability of measurement of uterine artery Pulsatility index using Transvaginal color Doppler. Ultrasound Obstet Gynecol. 2001 Nov; 18(5): 456-9
65. Pather S, Ford M, Reid R, Sykes P. Postpartum curettage: an audit of 200 cases. Aust N Z J Obstet Gynaecol.2005 Oct; 45(5):368-71
66. Pelage JP, Soyer P, Repiquet D, Herbreteau D, LeDref O, Houdart E, et al. Secondary
postpartum hemorrhage: treatment with selective arterial embolization. Radiology 1999;
212:385-9
67. Robinson HP. Sonar in the puerperium. Scott Med J 1972; 17:364–366. 68. Robson SC, Hunter S, Moore M, Dunlop W. Haemodynamic changes during the puerperium:
a Doppler and M-mode echocardiographic study. Br J Obstet Gynaecol 1987;94:1028-39. 69. Rodeck CH, Newton JR. Study of the uterine cavity by ultrasound in the early puerperium.
Br J Obstet Gynaecol 1976; 83:795–801 70. Rome RM. Secondary postpartum haemorrhage. Br J Obstet Gynaecol. 1975;/82(4):/289-92. 71. Sadan O, Golan A, Girtler O, Lurie S, Debby A,et al. Role of sonography in the diagnosis of
retained products of conception. J Ultrasound Med 2004; 23(3): 371-374 72. Sakki A, Kirkiinen P. Ultrasonography of the uterus at early puerperium. Eur J Ultrasound
1996; 4: 99–105.

76
73. Schulman H, Fleischer A, Farmakides G, Bracero L, Rochelson B, Grunfeld L. Development of uterine artery compliance in pregnancy as detected by Doppler ultrasound. Am J Obstet Gy-necol 1986; 155: 1031-1036.
74. Shalev J, Royburt M, Fite G, Mashiach R, Schoenfeld A, Bar J, Ben-Rafael Z, Meizner I.. Sonographic evaluation of the puerperal uterus: correlation with manual examination. Gynecol Obstet Invest. 2002;53(1):38-41.
75. Sharman A. Reproductive Physiology of the Post-Partum Period. In Livingston:Edinburgh E. &S. 1966
76. Shen O, Rabinowitz R, Eisenberg VH, Samueloff A. Transabdominal sonography before uter-ine exploration as a predictor of retained placental fragments. J Ultrasound Med 2003; 22(6): 561-564
77. Sokol ER, Casele H, Haney EI. Ultrasound examination of the postpartum uterus: what is normal? J Matern Fetal Neonatal Med 2004; 15: 95–99.
78. Steer CV, Campbell S, Pampiglione JS, Kingsland CR, Mason BA, Collins WP. Transvaginal colour flow imaging of the uterine arteries during the ovarian and menstrual cycles. Human Reprod 1990; 5 (4):391-395
79. Steer CV, Williams J, Zaidi J, Campbell S, Tan SL. Intra-observer, interobserver, interultra-sound transducer and intercycle variation in colour Doppler assessment of uterine artery im-pedance. Hum Reprod. 1995 Feb;10(2):479-81.
80. Stovall TG, Ambrose SE, Ling FW, Anderson GD. Shortterm course antibiotic therapy for the treatment of chorioamnionitis and postpartum endomyometritis. Am J Obstet Gynaecol.1998;159(2):404-407.
81. Szoke B, Kiss D. The use of the ultrasonic echo technique in examining the normal and pathological involution in the puerperium. Int J Gynaecol Obstet 1976; 14: 513–6
82. Tandberg A, Albrechtsen S, Iversen OE. Manual removal of the placenta. Acta Obstet Gynecol Scand 1999; 78:33-36.
83. Tekay A, Jouppila P. A longitudinal Doppler ultrasonographic assessment of the alterations in peripheral vascular resistance of uterine arteries and ultrasonographic findings of the involuting uterus during the puerperium. Am J Obstet Gynecol 1993; 168: 190–8
84. Tekay A, Jouppila P. Intraobserver reproducibility of Transvaginal Doppler measurements in uterine and intraovarian arteries in regularly menstruating women. Ultrasound Obstet Gyne-col 1996;7:129-134
85. Timmerman D, Van Den Bosch T, Peeraer K, Debrouwere E, Van Schoubroeck D, Stockx L,
Spitz B. Vascular malformations in the uterus: ultrasonographic diagnosis and conservative
management. Eur J Obstet Gynecol Reprod Biol 2000; 92:171-178
86. Timmerman D, Wauters J, Van Calenbergh S, Van Schoubroeck D, Maleux G, Van Den
Bosch T, Spitz B. Color Doppler imaging is a valuable tool for the diagnosis and management
of uterine vascular malformations. Ultrasound Obstet Gynecol 2003; 21:570-577
87. Van den Bosch T, Van Schoubroeck D, Lu C, De Brabanter J, Van Huffel S, Timmerman D,
Color Doppler and gray- scale ultrasound evaluation of the postpartum uterus.
Ultrasound Obstet Gynecol 2002;20:586–591.
88. Van Rees D, Bernstine RL, Crawford W. Involution of the postpartum uterus. An ultrasonic study. J Clin Ultrasound 1981; 9: 55

77
89. Van Schoubroeck D, Van den Bosch T, Scharpe K, Lu C, Van Huffel S, Timmerman D. Prospective evaluation of blood flow in the myometrium and uterine arteries in the puer-perium. Ultrasound Obstet Gynecol 2004; 23:378–81.
90. Visness CM, Kennedy KI, Ramos R. The Duration and Character of Postpartum Bleeding Among Breast-Feeding Women. Obstet Gynecol 1997; Feb; Vol.89:159-163
91. de Vries JI, van der Linden RM, van der Linden HC. Predictive value of Sonographic exami-nation to visualize retained placenta directly after birth at 16-28 weeks. J Ultrasound Med 2000; Jasn;19(1):7-12;quiz 13-4
92. Wachsberg RH, Kurtz AB, Levine CD, Solomon P, Wapner RJ. Realtime ultrasonographic analysis of the normal postpartum uterus. J Ultrasound Med 1994; 13: 215–21
93. Wachsberg RH, Kurtz AB. Gas within the endometrial cavity at postpartum US. A normal finding after spontaneous vaginal delivery. Radiology 1992; 183: 431–433
94. Wald DA Postpartum hemorrhage resulting from uterine artery pseudoaneurysm. The Journal
of Emergency Medicine 2003;25:57-60
95. Westendorp IC, Ankum WM, Mol BW, Vonk J. Prevalence of Asherman’s syndrome after secondary removal of placental remnants or a repeat curettage for incomplete abortion. Hum Reprod 1998; 13: 3347–3350.
96. Why Mothers Die - 2000-2002 Confidential Inquiry into Maternal Death report, United King-dom
97. Williams JW. Regeneration of the uterine mucosa after delivery with special reference to the placental site. Am J Obstet Gynecol 1931; 22: 664
98. Woessner, JF.Brewer TH. Formation and breakdown of collagen and elastin in the human
uterus during pregnancy and postpartum involution. Biochemical Journal 1963;89:75-82
99. Wong HS, Cheung YK, Burn K, Hawley J. A case of uterine hematoma as a transient vascular
abnormality on Ultrasonography. Ultrasound Obstet Gynecol 2005; 26:679-686.
100. Yazicioglu F, Gokdogan A, Kelekci S, Aygun M, Savan K. Incomplete healing of the uterine incision after caesarean section. Is it preventable? Eur J Obstet Gynecol Reprod Biol.2006;124(1):32 -6. E-pub 1 July 2005
101. Zalel Y, Gamzu R, Lidor A, Goldenberg M, Achiron R. Color Doppler imaging in the sono-hysterographic diagnosis of residual trophoblastic tissue. J Clin Ultrasound 2002;30:222–5
102. Zelop C, Heffner LJ. The downside of caesarean delivery; short-and long-term complications. Clin Obstet Gynecol.2004;/47:/386-93.
103. Zimon AE, Hwang JK, Principe DL, Bahado-Singh RO. Pseudoaneurysm of the uterine artery
Obstet Gynecol 1999;94:827-30
104. Ziskin MC, Thickman DI, Goldenberg NJ. The comet tail artifact. J Ultrasound Med 1982; 1: 1–17
105. Zygmunt M, Herr F, Munstedt K, Lang U, Liang OD. Angiogenesis and vasculogenesis in pregnancy.Eur J Obstet Gynecol Reprod Biol. 2003 Sep 22;110 Suppl 1:S10-8. Review.

Acta Universitatis UpsaliensisDigital Comprehensive Summaries of Uppsala Dissertationsfrom the Faculty of Medicine 254
Editor: The Dean of the Faculty of Medicine
A doctoral dissertation from the Faculty of Medicine, UppsalaUniversity, is usually a summary of a number of papers. A fewcopies of the complete dissertation are kept at major Swedishresearch libraries, while the summary alone is distributedinternationally through the series Digital ComprehensiveSummaries of Uppsala Dissertations from the Faculty ofMedicine. (Prior to January, 2005, the series was publishedunder the title “Comprehensive Summaries of UppsalaDissertations from the Faculty of Medicine”.)
Distribution: publications.uu.seurn:nbn:se:uu:diva-7830
ACTAUNIVERSITATISUPSALIENSISUPPSALA2007