postal regulatory commission analysis of the postal report 2017... · postal regulatory commission...
TRANSCRIPT
POSTAL REGULATORY COMMISSION
Analysis of the Postal Service’s FY 2016 Annual Performance Report and
FY 2017 Performance Plan
April 27, 2017
Postal Regulatory CommissionSubmitted 4/27/2017 3:42:07 PMFiling ID: 99910Accepted 4/27/2017
- i -
TABLE OF CONTENTS Page
EXECUTIVE SUMMARY ....................................................................................................................................... 1
CHAPTER 1: INTRODUCTION........................................................................................................................... 2
A. Background ................................................................................................................................. 2
B. The FY 2017 Plan and FY 2016 Report ............................................................................ 5
CHAPTER 2: COMPLIANCE WITH LEGAL REQUIREMENTS ................................................................. 7
A. Legal Requirements ................................................................................................................. 7
B. Comments .................................................................................................................................... 8
C. Commission Analysis .............................................................................................................. 9
1. FY 2017 Plan ............................................................................................................. 10
2. FY 2016 Report ........................................................................................................ 14
3. FY 2017 Performance Indicator Changes ...................................................... 20
CHAPTER 3: ANALYSIS OF POSTAL SERVICE PERFORMANCE ....................................................... 23
A. Deliver High-Quality Service ............................................................................................. 25
1. Background ............................................................................................................... 25
2. Comments .................................................................................................................. 28
3. Commission Analysis ............................................................................................. 29
B. Provide Excellent Customer Experiences .................................................................... 33
1. Background ............................................................................................................... 33
2. Comments .................................................................................................................. 38
3. Commission Analysis ............................................................................................. 38
C. Ensure a Safe Workplace and Engaged Workforce .................................................. 50
1. Background ............................................................................................................... 50
2. Comments .................................................................................................................. 54
3. Commission Analysis ............................................................................................. 55
D. Sustain Controllable Income ............................................................................................. 67
1. Background ............................................................................................................... 67
2. Comments .................................................................................................................. 69
3. Commission Analysis ............................................................................................. 69
CHAPTER 4: STRATEGIC INITIATIVES ...................................................................................................... 76
A. Background .............................................................................................................................. 76
B. Comments ................................................................................................................................. 80
C. Commission Analysis ........................................................................................................... 80
Appendix—Commission Findings and Recommendations

Analysis of FY 2016 Performance Report Executive Summary and FY 2017 Performance Plan
- 1 -
EXECUTIVE SUMMARY Each year the Postal Service must submit to the Commission its most recent annual performance plan and annual performance report. 39 U.S.C. § 3652(g). On December 29, 2016, the Postal Service filed its fiscal year (FY) 2017 annual performance plan (FY 2017 Plan) and FY 2016 annual performance report (FY 2016 Report) in Docket No. ACR2016. The FY 2017 Plan reviews the Postal Service’s plans for FY 2017. The FY 2016 Report discusses the Postal Service’s progress during FY 2016 toward its four performance goals:
Deliver High-Quality Service
Provide Excellent Customer Experiences
Ensure a Safe Workplace and Engaged Workforce
Sustain Controllable Income In this Analysis, as required by 39 U.S.C. § 3653(d), the Commission evaluates whether the Postal Service met these performance goals. This Analysis contains four chapters. In Chapter 1, the Commission provides background information about the FY 2017 Plan and FY 2016 Report. In Chapter 2, the Commission evaluates whether the FY 2017 Plan and FY 2016 Report comply with 39 U.S.C. §§ 2803 and 2804. In Chapter 3, the Commission evaluates whether the Postal Service met each performance goal in FY 2016. See id. § 3653(d). In Chapter 4, the Commission examines strategic initiatives and cross-portfolio performance indicators, which measure the performance of strategic initiatives. In Chapter 2, the Commission finds that the FY 2017 Plan and FY 2016 Report comply with all but one of the requirements of 39 U.S.C. §§ 2803 and 2804, respectively. However, the Commission notes that the FY 2017 Plan and FY 2016 Report as submitted lacked sufficient information for the Commission to determine compliance, and that the issuance of Chairman Information Requests (CHIRs) was necessary to obtain the required information. The Commission directs the Postal Service to include all information necessary to show compliance with 39 U.S.C. §§ 2803 and 2804 in future annual performance plans and performance reports. The Commission also provides further guidance on how the Postal Service can fully comply with 39 U.S.C. § 2803(a). In Chapter 3, the Commission finds that the Postal Service partially met each performance goal in FY 2016. The Commission provides recommendations for each performance goal to help the Postal Service meet the goal and better assess its performance in future years. In Chapter 4, the Commission makes recommendations about the Postal Service’s strategic initiatives and cross-portfolio performance indicators.
Analysis of FY 2016 Performance Report Introduction and FY 2017 Performance Plan
- 2 -
CHAPTER 1: INTRODUCTION A. Background
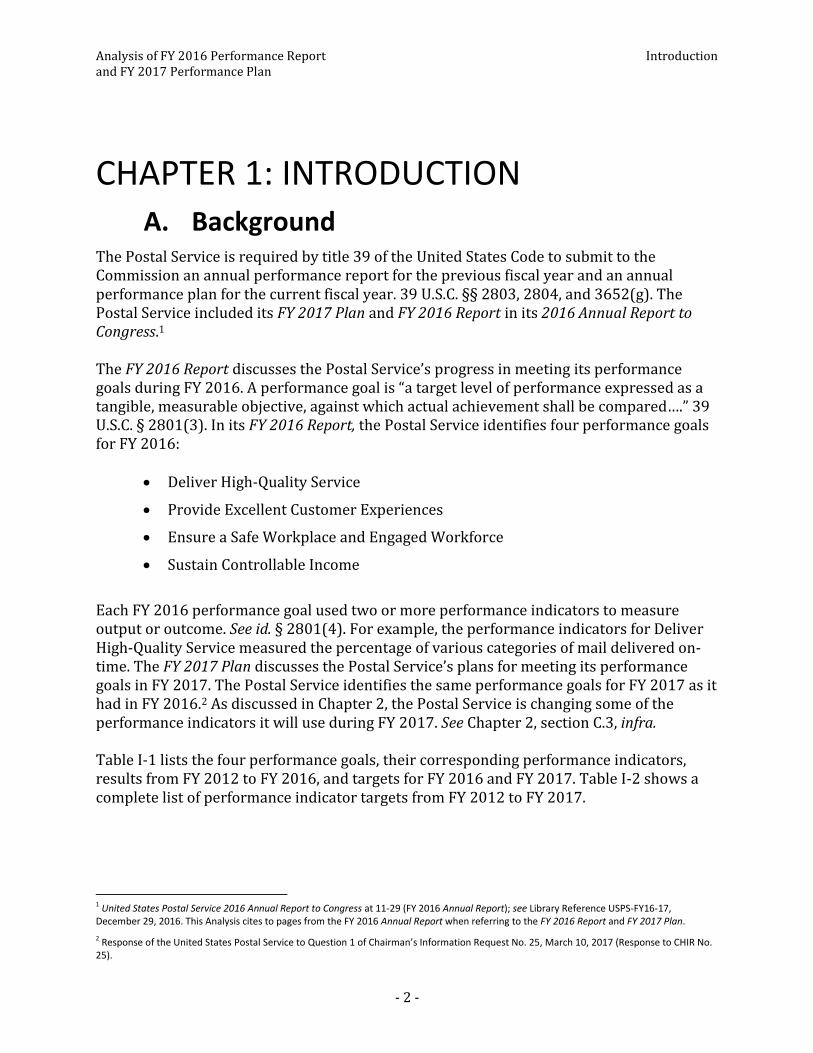
The Postal Service is required by title 39 of the United States Code to submit to the Commission an annual performance report for the previous fiscal year and an annual performance plan for the current fiscal year. 39 U.S.C. §§ 2803, 2804, and 3652(g). The Postal Service included its FY 2017 Plan and FY 2016 Report in its 2016 Annual Report to Congress.1 The FY 2016 Report discusses the Postal Service’s progress in meeting its performance goals during FY 2016. A performance goal is “a target level of performance expressed as a tangible, measurable objective, against which actual achievement shall be compared….” 39 U.S.C. § 2801(3). In its FY 2016 Report, the Postal Service identifies four performance goals for FY 2016:
Deliver High-Quality Service
Provide Excellent Customer Experiences
Ensure a Safe Workplace and Engaged Workforce
Sustain Controllable Income
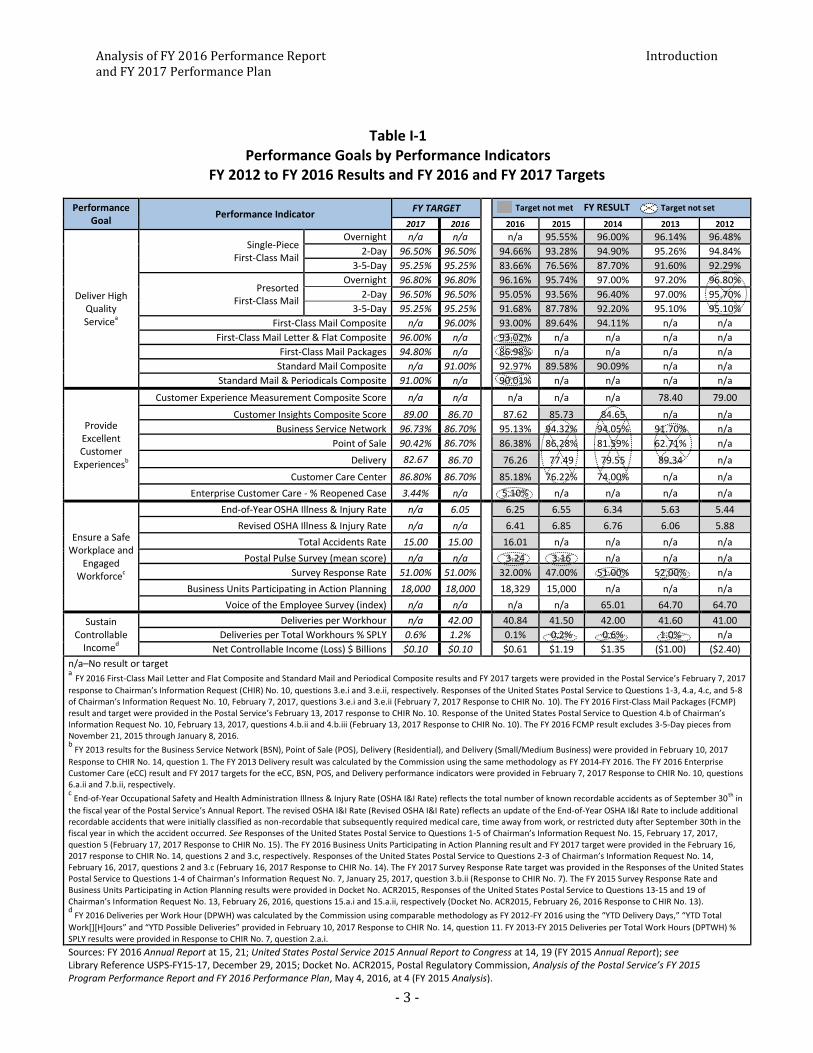
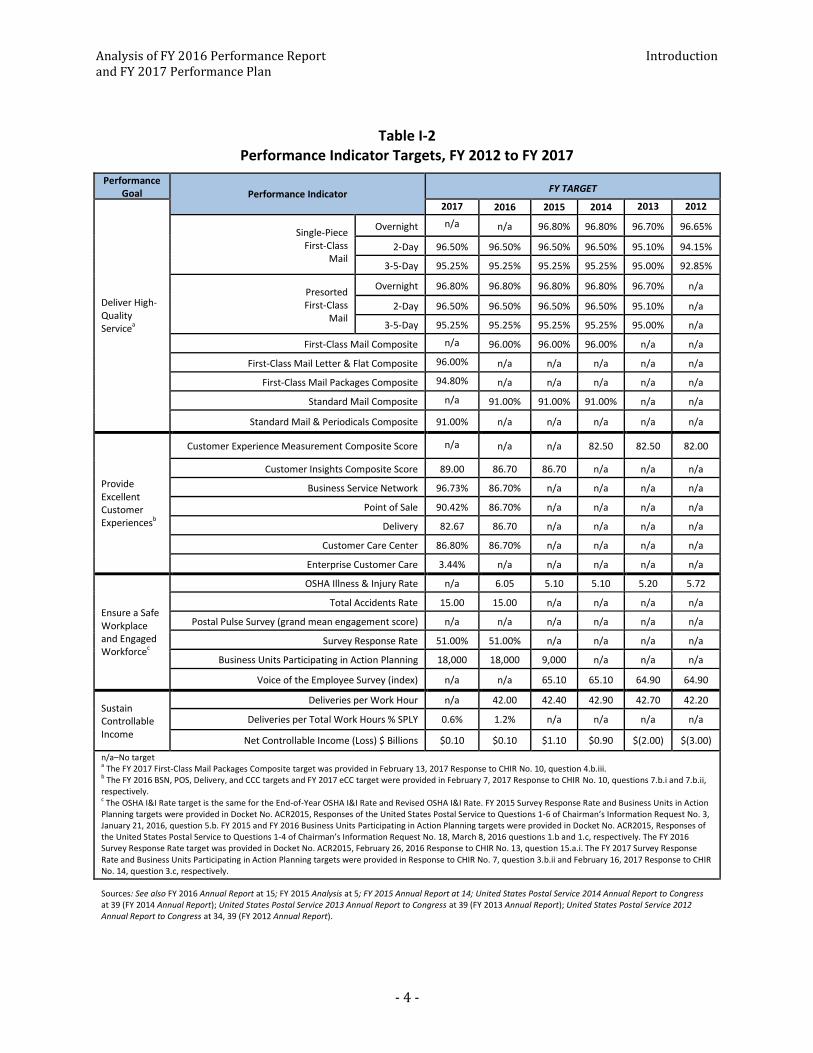
Each FY 2016 performance goal used two or more performance indicators to measure output or outcome. See id. § 2801(4). For example, the performance indicators for Deliver High-Quality Service measured the percentage of various categories of mail delivered on-time. The FY 2017 Plan discusses the Postal Service’s plans for meeting its performance goals in FY 2017. The Postal Service identifies the same performance goals for FY 2017 as it had in FY 2016.2 As discussed in Chapter 2, the Postal Service is changing some of the performance indicators it will use during FY 2017. See Chapter 2, section C.3, infra. Table I-1 lists the four performance goals, their corresponding performance indicators, results from FY 2012 to FY 2016, and targets for FY 2016 and FY 2017. Table I-2 shows a complete list of performance indicator targets from FY 2012 to FY 2017.
1 United States Postal Service 2016 Annual Report to Congress at 11-29 (FY 2016 Annual Report); see Library Reference USPS-FY16-17, December 29, 2016. This Analysis cites to pages from the FY 2016 Annual Report when referring to the FY 2016 Report and FY 2017 Plan.
2 Response of the United States Postal Service to Question 1 of Chairman’s Information Request No. 25, March 10, 2017 (Response to CHIR No. 25).
Analysis of FY 2016 Performance Report Introduction and FY 2017 Performance Plan
- 3 -
Table I-1 Performance Goals by Performance Indicators
FY 2012 to FY 2016 Results and FY 2016 and FY 2017 Targets
Performance Goal
Performance Indicator FY TARGET Target not met FY RESULT Target not set
2017 2016 2016 2015 2014 2013 2012
Deliver High Quality Servicea
Single-Piece First-Class Mail
Overnight n/a n/a n/a 95.55% 96.00% 96.14% 96.48%
2-Day 96.50% 96.50% 94.66% 93.28% 94.90% 95.26% 94.84%
3-5-Day 95.25% 95.25% 83.66% 76.56% 87.70% 91.60% 92.29%
Presorted First-Class Mail
Overnight 96.80% 96.80% 96.16% 95.74% 97.00% 97.20% 96.80%
2-Day 96.50% 96.50% 95.05% 93.56% 96.40% 97.00% 95.70%
3-5-Day 95.25% 95.25% 91.68% 87.78% 92.20% 95.10% 95.10%
First-Class Mail Composite n/a 96.00% 93.00% 89.64% 94.11% n/a n/a
First-Class Mail Letter & Flat Composite 96.00% n/a 93.02% n/a n/a n/a n/a
First-Class Mail Packages 94.80% n/a 86.98% n/a n/a n/a n/a
Standard Mail Composite n/a 91.00% 92.97% 89.58% 90.09% n/a n/a
Standard Mail & Periodicals Composite 91.00% n/a 90.01% n/a n/a n/a n/a
Provide Excellent Customer
Experiencesb
Customer Experience Measurement Composite Score n/a n/a n/a n/a n/a 78.40 79.00
Customer Insights Composite Score 89.00 86.70 87.62 85.73 84.65 n/a n/a
Business Service Network 96.73% 86.70% 95.13% 94.32% 94.05% 91.70% n/a
Point of Sale 90.42% 86.70% 86.38% 86.28% 81.59% 62.71% n/a
Delivery 82.67 86.70 76.26 77.49 79.55 89.34 n/a
Customer Care Center 86.80% 86.70% 85.18% 76.22% 74.00% n/a n/a
Enterprise Customer Care - % Reopened Case 3.44% n/a 5.10% n/a n/a n/a n/a
Ensure a Safe Workplace and
Engaged Workforcec
End-of-Year OSHA Illness & Injury Rate n/a 6.05 6.25 6.55 6.34 5.63 5.44
Revised OSHA Illness & Injury Rate n/a n/a 6.41 6.85 6.76 6.06 5.88
Total Accidents Rate 15.00 15.00 16.01 n/a n/a n/a n/a
Postal Pulse Survey (mean score) n/a n/a 3.24 3.16 n/a n/a n/a
Survey Response Rate 51.00% 51.00% 32.00% 47.00% 51.00% 52.00% n/a
Business Units Participating in Action Planning 18,000 18,000 18,329 15,000 n/a n/a n/a
Voice of the Employee Survey (index) n/a n/a n/a n/a 65.01 64.70 64.70
Sustain Controllable
Incomed
Deliveries per Workhour n/a 42.00 40.84 41.50 42.00 41.60 41.00
Deliveries per Total Workhours % SPLY 0.6% 1.2% 0.1% 0.2% 0.6% 1.0% n/a
Net Controllable Income (Loss) $ Billions $0.10 $0.10 $0.61 $1.19 $1.35 ($1.00) ($2.40)
n/a–No result or target a FY 2016 First-Class Mail Letter and Flat Composite and Standard Mail and Periodical Composite results and FY 2017 targets were provided in the Postal Service’s February 7, 2017
response to Chairman’s Information Request (CHIR) No. 10, questions 3.e.i and 3.e.ii, respectively. Responses of the United States Postal Service to Questions 1-3, 4.a, 4.c, and 5-8 of Chairman’s Information Request No. 10, February 7, 2017, questions 3.e.i and 3.e.ii (February 7, 2017 Response to CHIR No. 10). The FY 2016 First-Class Mail Packages (FCMP) result and target were provided in the Postal Service’s February 13, 2017 response to CHIR No. 10. Response of the United States Postal Service to Question 4.b of Chairman’s Information Request No. 10, February 13, 2017, questions 4.b.ii and 4.b.iii (February 13, 2017 Response to CHIR No. 10). The FY 2016 FCMP result excludes 3-5-Day pieces from November 21, 2015 through January 8, 2016. b FY 2013 results for the Business Service Network (BSN), Point of Sale (POS), Delivery (Residential), and Delivery (Small/Medium Business) were provided in February 10, 2017
Response to CHIR No. 14, question 1. The FY 2013 Delivery result was calculated by the Commission using the same methodology as FY 2014-FY 2016. The FY 2016 Enterprise Customer Care (eCC) result and FY 2017 targets for the eCC, BSN, POS, and Delivery performance indicators were provided in February 7, 2017 Response to CHIR No. 10, questions 6.a.ii and 7.b.ii, respectively. c End-of-Year Occupational Safety and Health Administration Illness & Injury Rate (OSHA I&I Rate) reflects the total number of known recordable accidents as of September 30th in
the fiscal year of the Postal Service’s Annual Report. The revised OSHA I&I Rate (Revised OSHA I&I Rate) reflects an update of the End-of-Year OSHA I&I Rate to include additional recordable accidents that were initially classified as non-recordable that subsequently required medical care, time away from work, or restricted duty after September 30th in the fiscal year in which the accident occurred. See Responses of the United States Postal Service to Questions 1-5 of Chairman’s Information Request No. 15, February 17, 2017, question 5 (February 17, 2017 Response to CHIR No. 15). The FY 2016 Business Units Participating in Action Planning result and FY 2017 target were provided in the February 16, 2017 response to CHIR No. 14, questions 2 and 3.c, respectively. Responses of the United States Postal Service to Questions 2-3 of Chairman’s Information Request No. 14, February 16, 2017, questions 2 and 3.c (February 16, 2017 Response to CHIR No. 14). The FY 2017 Survey Response Rate target was provided in the Responses of the United States Postal Service to Questions 1-4 of Chairman’s Information Request No. 7, January 25, 2017, question 3.b.ii (Response to CHIR No. 7). The FY 2015 Survey Response Rate and Business Units Participating in Action Planning results were provided in Docket No. ACR2015, Responses of the United States Postal Service to Questions 13-15 and 19 of Chairman’s Information Request No. 13, February 26, 2016, questions 15.a.i and 15.a.ii, respectively (Docket No. ACR2015, February 26, 2016 Response to CHIR No. 13). d FY 2016 Deliveries per Work Hour (DPWH) was calculated by the Commission using comparable methodology as FY 2012-FY 2016 using the “YTD Delivery Days,” “YTD Total
Work[][H]ours” and “YTD Possible Deliveries” provided in February 10, 2017 Response to CHIR No. 14, question 11. FY 2013-FY 2015 Deliveries per Total Work Hours (DPTWH) % SPLY results were provided in Response to CHIR No. 7, question 2.a.i.
Sources: FY 2016 Annual Report at 15, 21; United States Postal Service 2015 Annual Report to Congress at 14, 19 (FY 2015 Annual Report); see Library Reference USPS-FY15-17, December 29, 2015; Docket No. ACR2015, Postal Regulatory Commission, Analysis of the Postal Service’s FY 2015 Program Performance Report and FY 2016 Performance Plan, May 4, 2016, at 4 (FY 2015 Analysis).
Analysis of FY 2016 Performance Report Introduction and FY 2017 Performance Plan
- 4 -
Table I-2 Performance Indicator Targets, FY 2012 to FY 2017
Performance Goal Performance Indicator
FY TARGET
Deliver High-Quality Servicea
2017 2016 2015 2014 2013 2012
Single-Piece First-Class
Overnight n/a n/a 96.80% 96.80% 96.70% 96.65%
2-Day 96.50% 96.50% 96.50% 96.50% 95.10% 94.15%
3-5-Day 95.25% 95.25% 95.25% 95.25% 95.00% 92.85%
Presorted First-Class
Overnight 96.80% 96.80% 96.80% 96.80% 96.70% n/a
2-Day 96.50% 96.50% 96.50% 96.50% 95.10% n/a
3-5-Day 95.25% 95.25% 95.25% 95.25% 95.00% n/a
First-Class Mail Composite n/a 96.00% 96.00% 96.00% n/a n/a
First-Class Mail Letter & Flat Composite 96.00% n/a n/a n/a n/a n/a
First-Class Mail Packages Composite 94.80% n/a n/a n/a n/a n/a
Standard Mail Composite n/a 91.00% 91.00% 91.00% n/a n/a
Standard Mail & Periodicals Composite 91.00% n/a n/a n/a n/a n/a
Provide Excellent Customer Experiencesb
Customer Experience Measurement Composite Score n/a n/a n/a 82.50 82.50 82.00
Customer Insights Composite Score 89.00 86.70 86.70 n/a n/a n/a
Business Service Network 96.73% 86.70% n/a n/a n/a n/a
Point of Sale 90.42% 86.70% n/a n/a n/a n/a
Delivery 82.67 86.70 n/a n/a n/a n/a
Customer Care Center 86.80% 86.70% n/a n/a n/a n/a
Enterprise Customer Care 3.44% n/a n/a n/a n/a n/a
Ensure a Safe Workplace and Engaged Workforcec
OSHA Illness & Injury Rate n/a 6.05 5.10 5.10 5.20 5.72
Total Accidents Rate 15.00 15.00 n/a n/a n/a n/a
Postal Pulse Survey (grand mean engagement score) n/a n/a n/a n/a n/a n/a
Survey Response Rate 51.00% 51.00% n/a n/a n/a n/a
Business Units Participating in Action Planning 18,000 18,000 9,000 n/a n/a n/a
Voice of the Employee Survey (index) n/a n/a 65.10 65.10 64.90 64.90
Sustain Controllable Income
Deliveries per Work Hour n/a 42.00 42.40 42.90 42.70 42.20
Deliveries per Total Work Hours % SPLY 0.6% 1.2% n/a n/a n/a n/a
Net Controllable Income (Loss) $ Billions $0.10 $0.10 $1.10 $0.90 $(2.00) $(3.00)
n/a–No target a The FY 2017 First-Class Mail Packages Composite target was provided in February 13, 2017 Response to CHIR No. 10, question 4.b.iii. b The FY 2016 BSN, POS, Delivery, and CCC targets and FY 2017 eCC target were provided in February 7, 2017 Response to CHIR No. 10, questions 7.b.i and 7.b.ii, respectively. c The OSHA I&I Rate target is the same for the End-of-Year OSHA I&I Rate and Revised OSHA I&I Rate. FY 2015 Survey Response Rate and Business Units in Action Planning targets were provided in Docket No. ACR2015, Responses of the United States Postal Service to Questions 1-6 of Chairman’s Information Request No. 3, January 21, 2016, question 5.b. FY 2015 and FY 2016 Business Units Participating in Action Planning targets were provided in Docket No. ACR2015, Responses of the United States Postal Service to Questions 1-4 of Chairman’s Information Request No. 18, March 8, 2016 questions 1.b and 1.c, respectively. The FY 2016 Survey Response Rate target was provided in Docket No. ACR2015, February 26, 2016 Response to CHIR No. 13, question 15.a.i. The FY 2017 Survey Response Rate and Business Units Participating in Action Planning targets were provided in Response to CHIR No. 7, question 3.b.ii and February 16, 2017 Response to CHIR No. 14, question 3.c, respectively.
Sources: See also FY 2016 Annual Report at 15; FY 2015 Analysis at 5; FY 2015 Annual Report at 14; United States Postal Service 2014 Annual Report to Congress at 39 (FY 2014 Annual Report); United States Postal Service 2013 Annual Report to Congress at 39 (FY 2013 Annual Report); United States Postal Service 2012 Annual Report to Congress at 34, 39 (FY 2012 Annual Report).
Analysis of FY 2016 Performance Report Introduction and FY 2017 Performance Plan
- 5 -
Each year, the Commission must evaluate whether the Postal Service met the performance goals established in the annual performance plan and annual performance report. 39 U.S.C. § 3653(d). It considers the Postal Service to have met a performance goal if the results of each performance indicator for that goal meet or exceed the targets established in the applicable performance plan. The Commission may also provide recommendations to the Postal Service related to protecting or promoting public policy objectives in title 39. Id.
B. The FY 2017 Plan and FY 2016 Report In past years, the Commission analyzed annual performance plans and annual performance reports as part of the Annual Compliance Determination (ACD). In Docket No. ACR2013, the Commission determined that its obligations under 39 U.S.C. § 3653(d) are distinguishable from its ACD obligations under 39 U.S.C. § 3653(b). Since then, the Commission has issued separate reports analyzing the Postal Service’s annual performance plans and annual performance reports.3 By issuing separate reports, the Commission provides a more in-depth analysis of the Postal Service’s progress toward meeting its performance goals and plans to improve performance in future years. The Commission continues its current practice by issuing its analysis of the FY 2017 Plan and FY 2016 Report separately from the FY 2016 ACD.4 In conducting this year’s review, the Commission designated a Public Representative and invited comments on whether the Postal Service met its performance goals and satisfied applicable statutory and regulatory requirements.5 It also sought input on public policy recommendations, observations on strategic initiatives, and other relevant matters. Order No. 3718 at 2-3.
3 See Docket No. ACR2013, Postal Regulatory Commission, Review of Postal Service FY 2013 Performance Report and FY 2014 Performance Plan, July 7, 2014 (FY 2013 Review); Docket No. ACR2014, Postal Regulatory Commission, Analysis of the Postal Service’s FY 2014 Program Performance Report and FY 2015 Performance Plan, July 7, 2015 (FY 2014 Analysis); FY 2015 Analysis.
4 See Annual Compliance Determination, March 28, 2017 (FY 2016 ACD).
5 Notice and Order Regarding the Postal Service FY 2016 Annual Performance Report and FY 2017 Annual Performance Plan, January 3, 2017 (Order No. 3718).
Analysis of FY 2016 Performance Report Introduction and FY 2017 Performance Plan
- 6 -
Several CHIRs were issued seeking clarification of the FY 2017 Plan and FY 2016 Report.6 The Postal Service filed responses to all information requests.7 The Public Representative submitted comments8 to which the Postal Service provided reply comments.9 The Commission analyzes the FY 2016 Report and FY 2017 Plan in the following chapters:
Chapter 2 analyzes the FY 2016 Report and FY 2017 Plan for compliance with legal requirements.
Chapter 3 evaluates whether the Postal Service met its four performance goals in FY 2016.
Chapter 4 discusses the Postal Service’s strategic initiatives.
The Commission also provides an appendix listing Commission findings and recommendations contained in this Analysis.
6 Chairman’s Information Request No. 7, January 17, 2017 (CHIR No. 7); Chairman’s Information Request No. 10, January 27, 2017 (CHIR No. 10); Chairman’s Information Request No. 14, February 3, 2017 (CHIR No. 14); Chairman’s Information Request No. 15, February 10, 2017 (CHIR No. 15); Chairman’s Information Request No. 19, February 17, 2017 (CHIR No. 19); Chairman’s Information Request No. 22, February 24, 2017 (CHIR No. 22); Chairman’s Information Request No. 25, March 3, 2017 (CHIR No. 25); Chairman’s Information Request No. 27, March 9, 2017 (CHIR No. 27).
7 Response to CHIR No. 7; February 7, 2017 Response to CHIR No. 10; February 10, 2017 Response to CHIR No. 14; February 13, 2017 Response to CHIR No. 10; Responses of the United States Postal Service to Questions 4-7 and 10 of Chairman’s Information Request No. 14, February 15, 2017 (February 15, 2017 Response to CHIR No. 14); February 16, 2017 Response to CHIR No. 14; February 17, 2017 Response to CHIR No. 15; Responses of the United States Postal Service to Questions 8-9 of Chairman’s Information Request No. 14, February 24, 2017 (February 24, 2017 Response to CHIR No. 14); Responses of the United States Postal Service to Questions 2 and 6 of Chairman’s Information Request No. 19, February 27, 2017 (February 27, 2017 Response to CHIR No. 19); Responses of the United States Postal Service to Questions 7-11 of Chairman’s Information Request No. 19, March 1, 2017 (March 1, 2017 Response to CHIR No. 19); Response of the United States Postal Service to Question 6 of Chairman’s Information Request No. 15, March 7, 2017 (March 7, 2017 Response to CHIR No. 15); Response to CHIR No. 25; Response of the United States Postal Service to Question 1 of Chairman’s Information Request No. 22, March 13, 2017 (Response to CHIR No. 22); Responses of the United States Postal Service to Questions 1-5 and 7 of Chairman’s Information Request No. 27, March 15, 2017 (March 15, 2017 Response to CHIR No. 27); Response of the United States Postal Service to Question 6 of Chairman’s Information Request No. 27, March 16, 2017 (March 16, 2017 Response to CHIR No. 27); Responses of the United States Postal Service to Questions 1 and 3-5 of Chairman’s Information Request No. 19, March 17, 2017 (March 17, 2017 Response to CHIR No. 19). Several CHIR responses were accompanied by motions requesting late acceptance. These motions were granted in the FY 2016 ACD. FY 2016 ACD at 9 n.15.
8 Public Representative Initial Comments on the FY 2016 Performance Report and FY 2017 Performance Plan, February 8, 2017 (PR Comments); see Public Representative Notice of Errata, February 16, 2017.
9 United States Postal Service Reply Comments Regarding FY 2016 Performance Report and FY 2017 Performance Plan, February 22, 2017 (Postal Service Reply Comments).
Analysis of FY 2016 Performance Report Compliance with Legal Requirements and FY 2017 Performance Plan
- 7 -
CHAPTER 2: COMPLIANCE WITH LEGAL REQUIREMENTS
A. Legal Requirements The FY 2017 Plan and FY 2016 Report must meet the requirements of 39 U.S.C. §§ 2803 and 2804.10 Section 2803 establishes requirements for the Postal Service’s annual performance plans. The Postal Service must cover “each program activity set forth in the Postal Service budget….”11 and must:
Establish objective, quantifiable, and measurable performance goals that define a program activity’s performance level
Briefly describe the operational processes, skills and technology, and the human, capital, information, or other resources needed to meet the performance goals
Establish performance indicators to measure or assess each program activity’s relevant outputs, service levels, and outcomes
Provide a basis for comparing actual program results with established performance goals
Describe the means to be used to verify and validate measured values
39 U.S.C. § 2803(a). The Postal Service may use an alternative form if it determines that it is not feasible to express the performance goals for a particular program activity in an objective, quantifiable, and measurable form.12
10 Chapter 28 of title 39, which includes sections 2803 and 2804, was added by the Government Performance and Results Act (GPRA) of 1993, Pub. L. 103-62, 107 Stat. 285 (1993). Sections 2803 and 2804 were not affected by the GPRA Modernization Act of 2010, which does not apply to the Postal Service. See Pub. L. 111-352, 124 Stat. 3866 (2011).
11 A “program activity” is “a specific activity related to the mission of the Postal Service[.]” 39 U.S.C. § 2801(5). The Postal Service’s mission is to “[p]rovide reliable, efficient, trusted and affordable universal delivery service that binds the nation together, as it has for more than 240 years.” FY 2016 Annual Report at 12. The Commission discusses program activities on pages 13-14, infra.
12 Id. § 2803(b). The alternative form must include separate descriptive statements of a minimally effective program and a successful program. Id. § 2803(b)(1). The alternative form must also “state why it is infeasible or impractical to express a performance goal in any form for the program activity.” Id. § 2803(b)(2).
Analysis of FY 2016 Performance Report Compliance with Legal Requirements and FY 2017 Performance Plan
- 8 -
Section 2804 sets forth several requirements for the Postal Service’s annual performance reports. First, it requires the Postal Service to prepare annual performance reports that review whether it has met the performance goals previously established by the performance plan for that fiscal year. Id. § 2804(d)(1). Second, the Postal Service must “set forth the performance indicators established in the Postal Service performance plan, along with the actual program performance achieved compared with the performance goals expressed in the plan for that fiscal year.” Id. § 2804(b)(1). Third, the Postal Service must include “actual results for the three preceding fiscal years.” Id. § 2804(c). Fourth, the Postal Service must evaluate the performance plan for the current fiscal year (in this case, the FY 2017 Plan) relative to the performance achieved toward those goals in the year covered by the performance report (in this case, the FY 2016 Report). Id. § 2804(d)(2). If the Postal Service does not meet a performance goal, it must explain why the goal was not met and its plans and schedules for achieving the performance goal.13 The Postal Service must also include summary findings of program evaluations completed during the fiscal year covered by the report. Id. § 2804(d)(4).
B. Comments The Public Representative asserts that the FY 2017 Plan and FY 2016 Report comply with 39 U.S.C. §§ 2803 and 2804. PR Comments at 8. However, she notes that the Postal Service does not set an “objective, quantifiable, and measurable” target for the Postal Pulse survey grand mean engagement score as required by section 2803(a)(2). Id. at 9. She suggests that section 2803(b) excuses the lack of target, but asserts that the Postal Service should be able to set reasonable goals once it has a few years of data. Id. The Public Representative also comments that the FY 2016 Report fails to include all information required by section 2804(d)(2). Id. Section 2804(d)(2) requires the FY 2016 Report to evaluate the FY 2017 Plan relative to the performance achieved toward the performance goals during FY 2016. See 39 U.S.C. § 2804(d)(2). However, the Public Representative notes that the Postal Service provides the omitted information in CHIR responses. PR Comments at 9. In its reply comments, the Postal Service acknowledges the Public Representative’s comments regarding the Postal Pulse survey grand mean engagement score. Postal Service Reply Comments at 10. However, it notes that it has instead set FY 2017 targets for employee survey response rate and geographic distribution. Id.
13 Id. § 2804(d)(3)(A) and (B). If the performance goal is impractical or infeasible, the Postal Service must explain why and recommend further action. Id. § 2804(d)(3)(C).
Analysis of FY 2016 Performance Report Compliance with Legal Requirements and FY 2017 Performance Plan
- 9 -
C. Commission Analysis At the beginning of the FY 2017 Plan and FY 2016 Report, the Postal Service lists several of the requirements of 39 U.S.C. §§ 2803 and 2804 and represents that the FY 2017 Plan and FY 2016 Report include the listed information. FY 2016 Annual Report at 14. The Commission appreciates the Postal Service’s efforts to highlight the requirements of 39 U.S.C. §§ 2803 and 2804. Although the Postal Service describes the requirements of sections 2803 and 2804, it does not explain how each of the performance goals meets these requirements. The FY 2016 Report and FY 2017 Plan alone lacked sufficient information for the Commission to determine whether they complied with sections 2803 and 2804. In order to increase transparency and ensure the required information is included, the Commission recommends that the Postal Service link the specific information provided in future annual performance plans and annual performance reports to the specific requirements of 39 U.S.C. §§ 2803 and 2804. The Commission previously stated that the Postal Service should provide the information necessary to meet the requirements of sections 2803 and 2804 in the annual performance plan and annual performance report. See FY 2015 Analysis at 16. In past years, the Commission has permitted the Postal Service to include some statutorily required information in CHIR responses. However, the Postal Service’s continued reliance on CHIR responses to comply with statutory requirements has the overall effect of reducing the transparency and usefulness of its annual performance plans and annual performance reports and strays from the intent of sections 2803 and 2804. The large amount of required information provided at different times in response to various CHIRs also makes it difficult for interested persons to find important information that should be readily available in each annual performance plan and annual performance report. The Commission is concerned that the need to issue extensive CHIRs to gather required information has become the norm. As a result, the Commission finds that the FY 2017 annual performance report (FY 2017 Report) and FY 2018 annual performance plan (FY 2018 Plan) must contain all information necessary to show compliance with 39 U.S.C. §§ 2803 and 2804. Although some CHIRs may be necessary to clarify elements of the FY 2017 Report and FY 2018 Plan, the Commission in the future intends only to review information submitted within the annual performance reports and annual performance plans to determine statutory compliance. Below the Commission analyzes the FY 2017 Plan and FY 2016 Report for compliance with sections 2803 and 2804. The Commission finds that the FY 2017 Plan complies with all but one requirement of 39 U.S.C. § 2803, and the FY 2016 Report complies with 39 U.S.C. § 2804.
Analysis of FY 2016 Performance Report Compliance with Legal Requirements and FY 2017 Performance Plan
- 10 -
1. FY 2017 Plan The Commission finds that the FY 2017 Plan complies with all but one requirement of 39 U.S.C. § 2803. First, the FY 2017 Plan must “establish performance goals to define the level of performance to be achieved by a program activity.”14 This provision requires the FY 2017 Plan to set forth the performance goals and establish targets for each performance indicator used to evaluate performance during FY 2017. The FY 2017 Plan sets forth the four performance goals and establishes FY 2017 targets for most of the performance indicators that will be used to measure FY 2017 performance. See FY 2016 Annual Report at 15. The FY 2017 Plan does not set FY 2017 targets for the following performance indicators:
First-Class Mail Packages Composite (Deliver High-Quality Service goal)
Business Service Network (BSN), Point of Sale (POS), Delivery, Customer Care Center (CCC), and Enterprise Customer Care (eCC)15 (Provide Excellent Customer Experiences goal)
Postal Pulse survey (Ensure a Safe Workplace and Engaged Workforce goal)
The Postal Service does, however, provide FY 2017 targets for each of these performance indicators in CHIR responses.16 For this reason, the Commission finds that the Postal Service has complied with 39 U.S.C. § 2803(a)(1). As the Commission previously discussed, future annual performance plans must contain all information necessary to show compliance with 39 U.S.C. § 2803. To comply with 39 U.S.C. § 2803(a)(1), the FY 2018 Plan must set targets for each performance indicator used to evaluate performance during FY 2018. Second, the FY 2017 Plan must “express [performance] goals in an objective, quantifiable, and measurable form unless an alternative form is used under [section 2803](b)[.]” See 39 U.S.C. § 2803(a)(2). Section 2803(a)(2) requires the FY 2017 Plan to express performance goals as quantitative targets that can be compared with objectively measured results for each performance indicator unless an alternative form is used under section 2803(b). FY 2015 Analysis at 12. The FY 2017 Plan sets quantitative FY 2017 targets for each
14 See 39 U.S.C. § 2803(a)(1). The Commission discusses program activities on pages 13-14, infra.
15 The Postal Service clarifies that the name of the performance indicator is “Enterprise Customer Care” rather than “Electronic Customer Care” as listed in the FY 2016 Annual Report. February 7, 2017 Response to CHIR No. 10, question 6.
16 See id. question 7.b.ii; February 13, 2017 Response to CHIR No. 10, question 4.b.iii; February 16, 2017 Response to CHIR No. 14, question 3.c.
Analysis of FY 2016 Performance Report Compliance with Legal Requirements and FY 2017 Performance Plan
- 11 -
performance indicator except for the performance indicators related to the Postal Pulse survey. The same issue occurred last year when the Postal Service did not set a measurable FY 2016 target for the Postal Pulse survey grand mean engagement score in the FY 2016 Plan. See id. However, in a CHIR response, the Postal Service provided FY 2016 targets for the Postal Pulse survey response rate and number of participating business units. See id. The Commission found that these targets expressed the Ensure a Safe Workplace and Engaged Workforce performance goal “in an objective, quantifiable, and measurable form” and that the information provided in the CHIR response was sufficient to meet the requirements of 39 U.S.C. § 2803(a)(2). Id. It noted that in future years, the Postal Service should include the required information in annual performance plans. Id. This year, as the Public Representative notes, the Postal Service again failed to set a measurable FY 2017 target for the Postal Pulse survey grand mean engagement score. Although the FY 2017 Plan discusses the Postal Pulse survey grand mean engagement score, it is not included as a performance indicator in the table summarizing FY 2016 results and FY 2017 targets for each performance goal. See FY 2016 Annual Report at 15. When asked to provide the FY 2017 target, the Postal Service responds that “[a] specific numeric target for the [Postal Pulse survey] score has not been set.” Response to CHIR No. 7, question 3.b.i. Based on this response, the Postal Service was asked to express the FY 2017 target for the Postal Pulse survey grand mean engagement score using “an alternative form” under 39 U.S.C. § 2803(b) if it determined that it is not feasible to express the Postal Pulse survey grand mean engagement score “in an objective, quantifiable, and measurable form.” See CHIR No. 14, question 3. In its response, the Postal Service asserts that setting a measurable FY 2017 target for the Postal Pulse survey grand mean engagement score is feasible but not desirable. February 16, 2017 Response to CHIR No. 14, question 3.a. However, it notes that it set related objective, quantifiable, and measurable FY 2017 targets for the Postal Pulse survey response rate (50 percent) and number of organizational units entering into executable action plans in the Gallup system (18,000). Id. questions 3.a and 3.c. The Commission finds that the FY 2017 targets provided for the Postal Pulse survey response rate and number of organizational units entering into executable action plans in the Gallup system express the Ensure a Safe Workplace and Engaged Workforce goal “in an objective, quantifiable, and measurable form.” Consequently, the Commission finds that the Postal Service has complied with 39 U.S.C. § 2803(a)(2). Failing to include a measurable FY 2017 target for the Postal Pulse survey performance indicator is another example of the FY 2017 Plan lacking sufficient information for the
Analysis of FY 2016 Performance Report Compliance with Legal Requirements and FY 2017 Performance Plan
- 12 -
Commission to evaluate compliance with 39 U.S.C. § 2803. The Commission obtained the necessary information only after two CHIR questions and responses. This process hinders transparency, reduces the usefulness of the Postal Service’s annual performance plans, and makes it difficult for interested persons to find required information. The Commission reiterates the importance of including all required information in annual performance plans and annual performance reports. To comply with 39 U.S.C. § 2803(a)(2) next year, the FY 2018 Plan must include measurable FY 2018 targets for each performance indicator, including at least one of the performance indicators related to the Postal Pulse survey. FY 2018 targets must be included in the FY 2018 Plan rather than in CHIR responses. Third, the FY 2017 Plan must “briefly describe the operational processes, skills and technology, and the human, capital, information, or other resources required to meet the performance goals[.]” See 39 U.S.C. § 2803(a)(3). The FY 2017 Plan meets this requirement by explaining what resources are necessary to meet each performance goal. For example, to meet the Deliver High-Quality Service goal in FY 2017, the Postal Service states it will continue to use principles of continuous improvement and data analytics and deploy Network Operations Control Centers in each area. FY 2016 Annual Report at 17. Fourth, the FY 2017 Plan must “establish performance indicators to be used in measuring or assessing the relevant outputs, service levels, and outcomes of each program activity.”17 The FY 2017 Plan meets this requirement because each performance goal has at least two performance indicators that evaluate outputs, service levels, and outcomes. For example, the Sustain Controllable Income performance goal uses two performance indicators to measure productivity improvement efforts and financial results. FY 2016 Annual Report at 22-24. Fifth, the FY 2017 Plan must “provide a basis for comparing actual program results with the established performance goals[.]” See 39 U.S.C. § 2803(a)(5). The FY 2017 Plan meets this requirement by setting forth performance indicators that will provide a basis for comparing FY 2017 results with the targets established in the FY 2017 Plan. Sixth, the FY 2017 Plan must “describe the means to be used to verify and validate measured values.” See id. § 2803(a)(6). Section 2803(a)(6) requires the Postal Service to explain how it verifies and validates targets and results for each performance indicator using objective measurement systems. The FY 2017 Plan meets this requirement by, for example, explaining that Single-Piece First-Class Mail performance is objectively measured using the External First-Class Mail sampling system. See FY 2016 Annual Report at 16. The Postal Service explains that it validates data for the Occupational Safety and Health
17 See 39 U.S.C. § 2803(a)(4). The Commission discusses program activities on pages 13-14, infra.

Analysis of FY 2016 Performance Report Compliance with Legal Requirements and FY 2017 Performance Plan
- 13 -
Administration Illness and Injury Rate (OSHA I&I Rate) using the Enterprise Data Warehouse. February 15, 2017 Response to CHIR No. 14, question 7.c. The FY 2017 Plan must also “cover[] each program activity set forth in the Postal Service budget….” See 39 U.S.C. § 2803(a). The Commission previously found that to comply with 39 U.S.C. § 2803(a), the Postal Service must identify all program activities in its budget and explain how the annual performance plan covers each one. See FY 2014 Analysis at 10-11; FY 2015 Analysis at 14. The Commission also found that “Postal Service budget” in section 2803(a) means the Postal Service’s operating budget that is part of the Integrated Financial Plan. Id. The FY 2017 Plan does not explain how it covers each program activity in the FY 2017 Integrated Financial Plan. The Postal Service has previously indicated that the budget it uses for its section 2803(a) assessment is its congressional budget submission.18 However, the FY 2017 Plan also does not explain how it covers each program activity in the FY 2017 congressional budget submission. Two CHIRs were issued related to 39 U.S.C. § 2803(a). CHIR No. 10, question 1 asked the Postal Service to provide a crosswalk between the program activities listed in the FY 2017 Integrated Financial Plan and the Postal Service’s FY 2017 congressional budget submission.19 With this crosswalk, the Commission intended to analyze whether there is sufficient overlap between the program activities in the FY 2017 IFP and the FY 2017 Congressional Budget. In its response, the Postal Service focuses on differences in projected mail volume, revenue, and expenses in the FY 2017 Congressional Budget and the FY 2017 IFP, but does not address individual program activities from either budget. February 7, 2017 Response to CHIR No. 10, question 1. The FY 2017 Congressional Budget lists the following Postal Service program activities: postal field operations, transportation, building occupancy, supplies and services, research and development, administrative and area operations, interest, servicewide expenses, capital investments, and change in resources on order and inventory. FY 2017 Congressional Budget at II-14. CHIR No. 22 asked the Postal Service to explain how the FY 2017 Plan covers each of these program activities. CHIR No. 22. In its response, the Postal Service describes each program activity and related FY 2017 expenses. Response to CHIR
18 Docket No. ACR2015, Responses of the United States Postal Service to Questions 1 and 2 of Chairman’s Information Request No. 5, February 3, 2016, question 1.
19 CHIR No. 10, question 1; see United States Postal Service, Fiscal Year 2017 Integrated Financial Plan, December 2, 2016 (FY 2017 IFP); United States Postal Service FY 2017 Budget: Congressional Submission, Workpapers, and Summary Tables SE-1, 2 and 6, February 25, 2016 (FY 2017 Congressional Budget).
Analysis of FY 2016 Performance Report Compliance with Legal Requirements and FY 2017 Performance Plan
- 14 -
No. 22, question 1. However, it does not connect any of these program activities to the FY 2017 Plan. Id. The FY 2017 Plan does not comply with 39 U.S.C. § 2803(a). In the FY 2015 Analysis, the Commission stated that the FY 2017 Plan “must identify all program activities in the FY 2017 IFP and explain how the FY 2017 Plan covers each one.” FY 2015 Analysis at 14 (italics omitted). The FY 2017 Plan does not include this information nor do the responses to CHIR Nos. 10 and 22 provide the information necessary to make this determination. Although the Commission has repeatedly stated that “budget” in 39 U.S.C. § 2803(a) refers to the Postal Service’s operating budget in the Integrated Financial Plan, the Commission would also accept an analysis that shows how the annual performance plan covers each program activity in the applicable year’s congressional budget submission and a crosswalk of the relationship between the program activities in the applicable Integrated Financial Plan and the applicable congressional budget submission. To connect the program activities to the annual performance plan, the Postal Service should describe how each program activity relates to one or more performance goals or performance indicators. The Commission finds that the Postal Service has not complied with 39 U.S.C. § 2803(a). To comply with 39 U.S.C. § 2803(a) next year, the FY 2018 Plan must either: (1) identify all program activities in the FY 2018 Integrated Financial Plan and explain how the FY 2018 Plan covers each one or (2) identify all program activities in the applicable congressional budget submission, explain how the FY 2018 Plan covers each one, and provide a crosswalk of the relationship between the program activities in the FY 2018 Integrated Financial Plan and congressional budget submission. The FY 2018 Plan must also relate each program activity to one or more performance goals or performance indicators. As previously discussed, the Postal Service must include this explanation in the FY 2018 Plan rather than in CHIR responses.
2. FY 2016 Report The Commission finds that the FY 2016 Report complies with 39 U.S.C. § 2804. First, the FY 2016 Report reviews the Postal Service’s success in achieving its performance goals by stating whether the Postal Service met targets for each performance goal in FY 2016. See 39 U.S.C. § 2804(d)(1). Second, the FY 2016 Report provides summary findings of program evaluations completed during FY 2016. See id. § 2804(d)(4). “Program evaluations” are “assessment[s], through objective measurement and systematic analysis, of the manner and extent to which Postal Service programs achieve intended objectives.” Id. § 2801(6). For example, in the FY 2016 Report, the Postal Service states it exceeded the Customer Insights (CI) Composite Score by almost 1 percentage point by training retail employees to ask customers for feedback and by using Quick Response codes and interactive voice response systems. FY 2016 Annual Report at 18.
Analysis of FY 2016 Performance Report Compliance with Legal Requirements and FY 2017 Performance Plan
- 15 -
Third, if a performance goal has not been met, annual performance reports must explain why the Postal Service did not meet the goal and describe the plans and schedules for achieving the goal. 39 U.S.C. § 2804(d)(3). The FY 2016 Report does not provide this information for the Deliver High-Quality Service and Ensure a Safe Workplace and Engaged Workforce performance goals. The Postal Service failed to meet FY 2016 targets for all but one performance indicator that measured progress toward the Deliver High-Quality Service goal. See FY 2016 Annual Report at 15. However, the FY 2016 Report neither explains why the Postal Service missed FY 2016 targets nor describes what the Postal Service’s plans and schedules are for meeting FY 2017 targets. Similarly, for the Ensure a Safe Workplace and Engaged Workforce performance goal, the FY 2016 Report does not explain why the Postal Service missed the FY 2016 target for the OSHA I&I Rate. See id. at 20. The Postal Service provided the explanations, plans, and schedules required by section 2804(d)(3) in CHIR responses.20 For this reason, the Commission finds that the Postal Service has complied with 39 U.S.C. § 2804(d)(3). However, as previously discussed, the Postal Service’s continued reliance on CHIR responses to comply with statutory requirements hinders transparency, reduces the usefulness of annual performance reports, and makes it difficult for interested persons to find required information. In particular, section 2804(d)(3) is an important requirement for annual performance reports because it promotes accountability when the Postal Service does not meet the goal. To comply with 39 U.S.C. § 2804(d)(3) next year, if the Postal Service did not meet a performance goal, the FY 2017 Report must explain why the goal was not met and the Postal Service’s plans and schedules for achieving the goal in future years. The Postal Service must provide the explanations, plans, and schedules required by 39 U.S.C. § 2804(d)(3) in the FY 2017 Report rather than in CHIR responses. Fourth, annual performance reports must “evaluate the performance plan for the current fiscal year relative to the performance achieved towards the performance goals in the fiscal year covered by the report[.]” 39 U.S.C. § 2804(d)(2). This provision requires the FY 2016 Report to evaluate the FY 2017 Plan relative to the performance achieved toward the performance goals during FY 2016. In other words, the Postal Service must compare FY 2017 targets with FY 2016 results for each performance indicator the Postal Service will use during FY 2017. The Public Representative comments that the Postal Service failed to include the information required by section 2804(d)(2) in the FY 2016 Report. PR Comments at 9. However, she notes that the Postal Service provided the omitted information in CHIR
20 Table III-1 lists each performance goal, whether the goal was met in FY 2016, reasons provided by the Postal Service for not meeting the goal, and the Postal Service’s plans and schedules for meeting the goal in future years. See Chapter 3, infra.

Analysis of FY 2016 Performance Report Compliance with Legal Requirements and FY 2017 Performance Plan
- 16 -
responses. Id. As previously discussed, the FY 2017 Plan does not set FY 2017 targets for First-Class Mail Package Composite, the CI subcomponent performance indicators, and the performance indicators related to the Postal Pulse survey. See Chapter 2, section C.1, supra. However, the Postal Service provides these targets in CHIR responses. See page 6 n.7, supra. Consequently, the Commission finds the Postal Service complied with 39 U.S.C. § 2804(d)(2) by comparing FY 2017 targets with FY 2016 results. To ensure compliance next year, the Postal Service should include all FY 2018 targets in the FY 2017 Report and FY 2018 Plan. The FY 2016 Report must meet two other requirements in 39 U.S.C. § 2804. First, it must “set forth the performance indicators established in the Postal Service performance plan, along with the actual program performance achieved compared with the performance goals expressed in the plan for that fiscal year.” 39 U.S.C. § 2804(b)(1). Second, the FY 2016 Report must “include actual results for the three preceding fiscal years.” Id. § 2804(c). Each statutory requirement is discussed below.
a. FY 2016 Target and Result Comparability
Section 2804(b)(1) requires annual performance reports to “set forth the performance indicators established in the Postal Service performance plan, along with the actual program performance achieved compared with the performance goals expressed in the plan for that fiscal year.” Id. § 2804(b)(1). This provision requires results expressed in annual performance reports to be comparable with targets set in the annual performance plan for that fiscal year. Thus, the FY 2016 Report must set forth the performance indicators in the FY 2016 annual performance plan (FY 2016 Plan) and compare FY 2016 results with FY 2016 targets set for each performance indicator in the FY 2016 Plan. For each performance indicator measuring progress toward the Deliver High-Quality Service goal, the FY 2016 Report sets forth the targets in the FY 2016 Plan and compares them with FY 2016 results. See FY 2016 Annual Report at 15. For this reason, the Commission finds that the FY 2016 Report complies with 39 U.S.C. § 2804(b)(1) for the Deliver High-Quality Service goal. Last year, the Postal Service stated that the subcomponent performance indicators for the Provide Excellent Customer Experiences goal (BSN, POS, Delivery, and CCC) would have the same FY 2016 target as the CI Composite performance indicator (86.70).21 However, the FY 2016 Report lists FY 2016 targets as “N/A” for the subcomponent performance indicators. See FY 2016 Annual Report at 15. In a CHIR response, the Postal Service confirms that the FY 2016 target for each subcomponent performance indicator was 86.70. February 7, 2017 Response to CHIR No. 10, question 7.b.i. Consequently, the Commission 21 See Docket No. ACR2015, United States Postal Service Reply Comments Regarding FY 2015 Performance Report and FY 2016 Performance Plan, March 8, 2016, at 8.
Analysis of FY 2016 Performance Report Compliance with Legal Requirements and FY 2017 Performance Plan
- 17 -
finds that the FY 2016 Report complies with 39 U.S.C. § 2804(b)(1) for the Provide Excellent Customer Experiences goal. To ensure compliance next year, the FY 2017 Report must list FY 2017 targets for each performance indicator, including the subcomponent performance indicators for the Provide Excellent Customer Experiences goal. In its FY 2015 Analysis, the Commission found that the FY 2015 Report did not comply with section 2804(b)(1) for the Ensure a Safe Workplace and Engaged Workforce performance goal because the FY 2015 target and result for the Postal Pulse survey grand mean engagement score performance indicator were not comparable. FY 2015 Analysis at 16. The FY 2016 Plan did not set a FY 2016 target for the Postal Pulse survey grand mean engagement score, but the Postal Service provided FY 2016 targets for the Postal Pulse survey response rate and number of business units participating in action planning in CHIR responses.22 The Commission stated that “[t]o comply with 39 U.S.C. § 2804(b)(1) in FY 2016, the FY 2016 Report must express FY 2016 results that are comparable with the targets expressed in [a CHIR response].” FY 2015 Analysis at 16. This and another CHIR response provided FY 2016 targets for the Postal Pulse survey response rate and number of business units participating in action planning.23 The FY 2016 Report does not set forth FY 2016 targets for these performance indicators. However, the FY 2016 Report provides FY 2016 results for these performance indicators and the Postal Pulse survey grand mean engagement score. FY 2016 Annual Report at 21. For this reason, the Commission finds that the FY 2016 Report complies with 39 U.S.C. § 2804(b)(1) for the Ensure a Safe Workplace and Engaged Workforce performance goal. The Postal Service provides FY 2017 targets for the Postal Pulse survey response rate and number of organizational units entering into executable action plans in the Gallup system. February 16, 2017 Response to CHIR No. 14, questions 3.a and 3.c. To ensure compliance next year, the FY 2017 Report must compare FY 2017 results with FY 2017 targets set for each performance indicator, including the performance indicators related to the Postal Pulse survey. For the Sustain Controllable Income goal, the FY 2016 Plan set a FY 2016 target for the DPWH performance indicator. FY 2015 Annual Report at 14. However, in FY 2016 the Postal Service replaced DPWH with DPTWH as a performance indicator for the Sustain Controllable Income goal. FY 2016 Annual Report at 15 nn.11-12, 22. The FY 2016 Report omits both the FY 2016 target and FY 2016 result for the old DPWH performance indicator.
22 Docket No. ACR2015, Responses of the United States Postal Service to Questions 1-6 of Chairman’s Information Request No. 3, January 21, 2016, question 5.b (Docket No. ACR2015 Response to CHIR No. 3); Docket No. ACR2015, Responses of the United States Postal Service to Questions 1-4 of Chairman’s Information Request No. 18, March 8, 2016, question 1.c (Docket No. ACR2015 Response to CHIR No. 18).
23 Docket No. ACR2015 Response to CHIR No. 3, question 5.b; Docket No. ACR2015 Response to CHIR No. 18, question 1.c.
Analysis of FY 2016 Performance Report Compliance with Legal Requirements and FY 2017 Performance Plan
- 18 -
However, the FY 2016 Report does provide both the FY 2016 target and FY 2016 result for the new DPTWH performance indicator. See id. at 15. This mid-year change in performance indicators affects compliance with 39 U.S.C. § 2804(b)(1) because the DPWH target in the FY 2016 Plan differs from the FY 2016 DPTWH result provided in the FY 2016 Report. Although the FY 2016 Report does not provide the FY 2016 result for the old DPWH performance indicator, the Postal Service provided this information in a CHIR response. February 10, 2017 Response to CHIR No. 14, question 11. For this reason, the Commission finds that the FY 2016 Report complies with 39 U.S.C. § 2804(b)(1) for the Sustain Controllable Income performance goal. However, to comply with 39 U.S.C. § 2804(b)(1) next year, the FY 2017 Report must express results for each performance indicator that are comparable to the targets the Postal Service set for FY 2017. Inconsistencies between targets presented in annual performance plans and annual performance reports have been an ongoing issue. See FY 2015 Analysis at 21. The Commission reiterates its recommendation that the Postal Service not change performance indicators or targets once they are set in the annual performance plan. If circumstances necessitate a revision, the Postal Service should explain these circumstances in the applicable annual performance report. In other cases, such as changes that affect the Postal Service’s ability to meet a target, the Postal Service should explain why a performance goal was not met in the applicable performance report rather than revising the performance indicator or target to account for these changes.
b. Comparable 3-Year Results
Section 2804(c) requires the FY 2016 Report to “include actual results for the three preceding fiscal years.” The Commission previously found that “actual results” under section 2804(c) must also be comparable across the three preceding fiscal years. FY 2014 Analysis at 12; see FY 2015 Analysis at 17. Thus, for the FY 2016 Report to comply with 39 U.S.C. § 2804(c), the Postal Service must provide comparable results for each performance indicator for, at minimum, FYs 2013, 2014, 2015, and 2016. See FY 2015 Analysis at 17, 45. When the Postal Service changed methodologies in past years, the Commission explained that the Postal Service could provide three years of comparable results by either (1) providing all results using the old methodology, if available, or (2) providing results using the new methodology and explaining how to compare results under the old and new methodologies. Id. at 17; FY 2014 Analysis at 12-13. The Commission also recommended that the Postal Service describe any methodology changes in its Annual Report to Congress and analyze the impact of methodology changes on results. Id. The Postal Service provided comparable results for FYs 2013, 2014, 2015, and 2016 for each Deliver High-Quality Service and Sustain Controllable Income performance indicator used in FY 2016. For this reason, the Commission finds that the FY 2016 Report complies with

Analysis of FY 2016 Performance Report Compliance with Legal Requirements and FY 2017 Performance Plan
- 19 -
39 U.S.C. § 2804(c) for the Deliver High-Quality Service and Sustain Controllable Income performance goals. The Postal Service recently changed the methodology for calculating results for two performance goals. First, in FY 2014 the Postal Service changed the methodology for measuring the Provide Excellent Customer Experiences goal from the Customer Experience Measurement (CEM) system to the CI measurement system. FY 2015 Analysis at 33. The FY 2016 Report provides FY 2015 and FY 2016 results for the current performance indicators under the CI measurement system: CI Composite Score, BSN, POS, Delivery, and CCC. See FY 2016 Annual Report at 15. However, the FY 2016 Report lists “N/A” or “Baseline” for FY 2013 and FY 2014 results. Id. CHIR No. 14 asked the Postal Service to provide comparable FY 2013 and FY 2014 results for the Provide Excellent Customer Experiences performance indicators. CHIR No. 14, question 1. If comparable results could not be provided, the Postal Service was asked to explain how to compare results between the old methodology (CEM) and new methodology (CI). Id. The Postal Service responds that it cannot provide useful comparable FY 2013 and FY 2014 results for the CI Composite Score performance indicator because of changes in the weighting methodology used to calculate the result for each fiscal year. February 10, 2017 Response to CHIR No. 14, question 1. However, it states that comparable results can be provided when analyzing individual unweighted metrics at the subcomponent level. Id. The Postal Service provides comparable FY 2013 and FY 2014 results for the BSN and POS performance indicators.24 For the Delivery performance indicator, the Postal Service provides FY 2013 results for the delivery surveys used under the old CEM measurement system. Id. The Postal Service provides FY 2014 results for the new CI delivery surveys, but notes that results are only based on August and September of FY 2014. Id. Although the Postal Service does not provide comparable results for the CI Composite Score, it does provide comparable results for FYs 2013, 2014, 2015, and 2016 for the BSN and POS performance indicators. For this reason, the Commission finds that the Postal Service has provided “actual results for the three preceding fiscal years” and thus complies with 39 U.S.C. § 2804(c) for the Provide Excellent Customer Experiences performance goal. Second, the Postal Service recently changed the methodology for calculating results for the performance indicators under the Ensure a Safe Workplace and Engaged Workforce performance goal. In FY 2015, the Postal Service changed the performance indicator for measuring employee engagement from the Voice of the Employee (VOE) survey to the Postal Pulse survey. FY 2015 Analysis at 47. CHIR No. 7 asked the Postal Service to provide
24 Id. The Postal Service only provides FY 2014 results for the CCC performance indicator because the Postal Service did not administer the CCC survey until FY 2014. Id.
Analysis of FY 2016 Performance Report Compliance with Legal Requirements and FY 2017 Performance Plan
- 20 -
comparable results across FYs 2013, 2014, 2015, and 2016, or to compare results between the old (VOE) and new (Postal Pulse) methodologies. CHIR No. 7, question 3.a.i. The Postal Service responds that the Postal Pulse survey grand mean engagement score is not directly comparable to the VOE survey score. Response to CHIR No. 7, question 3.a.i. However, the Postal Service does provide comparable results across these fiscal years for the employee survey response rate, which was also used to measure employee engagement during FY 2016. Id. question 3.a.ii. For this reason, the Commission finds that the FY 2016 Report complies with 39 U.S.C. § 2804(c) for the Ensure a Safe Workplace and Engaged Workforce performance goal. To comply with 39 U.S.C. § 2804(c) in future years, annual performance reports must contain the required information rather than it being provided in responses to CHIRs.
3. FY 2017 Performance Indicator Changes The Postal Service is making a number of changes to the FY 2017 performance indicators for each performance goal. For the Deliver High-Quality Service goal, the Postal Service is introducing a new performance indicator, First-Class Mail Packages Composite, to measure service performance of commercial 2-Day and 3-5-Day packages. FY 2016 Annual Report at 17. It is also replacing the First-Class Mail Composite and Standard Mail Composite performance indicators with First-Class Mail Letter & Flat Composite and Standard Mail & Periodicals Composite, respectively. See id. at 15 nn.3-4. For the Provide Excellent Customer Experiences goal, the Postal Service is changing the methodologies for calculating results of the CI Composite Score and Delivery performance indicators. Id. at 15 n.7, 19. It is also adding eCC as a new performance indicator. February 7, 2017 Response to CHIR No. 10, question 6. For the Ensure a Safe Workplace and Engaged Workforce goal, the Postal Service is replacing the OSHA I&I Rate with the Total Accidents Rate as the performance indicator for measuring employee safety. FY 2016 Annual Report at 15 n.9. For the Sustain Controllable Income goal, the Postal Service is replacing DPWH with DPTWH % SPLY as the performance indicator for measuring productivity improvement efforts. Id. at 15 n.12. Continually changing performance indicators is problematic, decreases transparency, and raises two legal issues. First, the changes impede the Commission’s ability to fulfill its responsibility under 39 U.S.C. § 3653(d) to evaluate annually whether the Postal Service has met its performance goals. This evaluation requires the Commission to compare targets and results for each performance indicator. Continually changing performance indicators makes it difficult to evaluate progress year-to-year and over time.
Analysis of FY 2016 Performance Report Compliance with Legal Requirements and FY 2017 Performance Plan
- 21 -
Second, the FY 2017 performance indicator changes will affect compliance with 39 U.S.C. § 2804(c). As previously discussed, this provision requires annual performance reports to provide comparable results for the three preceding fiscal years. For each new or revised performance indicator, the Postal Service was asked to confirm that it would either provide comparable results or explain how to compare results between the old and new methodologies.25 For the Provide Excellent Customer Experiences performance indicators, the Postal Service confirms that the FY 2017 Report will include comparable BSN, POS, Delivery, and CCC results for FYs 2014, 2015, 2016, and 2017. February 7, 2017 Response to CHIR No. 10, question 6.b.i. It states it will provide FY 2017 Delivery performance indicator results using the old and new methodologies. See id. To comply with 39 U.S.C. § 2804(c) next year, the FY 2017 Report should include the CI Composite Score, BSN, POS, Delivery, and CCC performance indicator results for FYs 2014, 2015, 2016, and 2017. To ensure comparability across these fiscal years, the FY 2017 Report should include FY 2017 Delivery results calculated using both the old and new methodologies. Because the eCC is a new performance indicator, the FY 2017 Report does not need to include eCC results from past fiscal years. The Postal Service asserts that it will not provide comparable results for the CI Composite Score because of the FY 2017 changes to the scoring methodology, weighting, and National Performance Assessment (NPA) scale. Id. However, it is unclear why it is not feasible to provide comparable CI Composite Score results considering the Postal Service already calculates results for each subcomponent performance indicator. To ensure comparability, the Commission recommends that the FY 2017 Report include the FY 2017 CI Composite Score results calculated using both the old and new methodologies. If the FY 2017 Report does not include comparable CI Composite Score results, the Postal Service should explain why it is not feasible to do so. For the Ensure a Safe Workplace and Engaged Workforce goal, the Postal Service responds that it appreciates the Commission’s interest in having the ability to compare results between the old OSHA I&I Rate and new Total Accidents Rate performance indicators. Response to CHIR No. 7 question 2.b.ii. It states, however, that considering its financial situation, management determined that limited resources should only support the new Total Accidents Rate methodology. Id. It acknowledges that this approach impacts the ability to compare results from prior years. Id. The Commission previously explained that results must be provided on a comparable basis to enable meaningful evaluation of performance across fiscal years. FY 2015 Analysis at 18;
25 See CHIR No. 7, question 2.b; CHIR No. 10, questions 3.f and 6.b. The Postal Service confirms that DPWH and DPTWH results are comparable. Response to CHIR No. 7, question 2.a.i.

Analysis of FY 2016 Performance Report Compliance with Legal Requirements and FY 2017 Performance Plan
- 22 -
FY 2014 Analysis at 12. Lacking comparable results makes it difficult to evaluate the Postal Service’s progress over time. The Commission appreciates that the Postal Service has limited resources. However, the Postal Service does not have to expend significant resources to comply with section 2804(c). In Chapter 3, the Commission describes how the Postal Service can calculate the FY 2017 OSHA I&I Rate using information the Postal Service is already required by OSHA to report and retain. See Chapter 3, section C.3.a.2, infra. The Postal Service should consider similar approaches when comparing results of the new or revised performance indicators for FY 2017. For the FY 2017 Report to comply with 39 U.S.C. § 2804(c), the Postal Service must provide comparable results for each performance indicator for, at a minimum, FYs 2014, 2015, 2016, and 2017. If comparable results cannot be provided, the FY 2017 Report must explain how to compare results between the old and new methodologies. The Postal Service must provide this information in the FY 2017 Report rather than in CHIR responses.
Analysis of FY 2016 Performance Report Analysis of Postal Service Performance and FY 2017 Performance Plan
- 23 -
CHAPTER 3: ANALYSIS OF POSTAL SERVICE PERFORMANCE The Postal Service’s four performance goals in FY 2016 were:
Deliver High-Quality Service
Provide Excellent Customer Experiences
Ensure a Safe Workplace and Engaged Workforce
Sustain Controllable Income
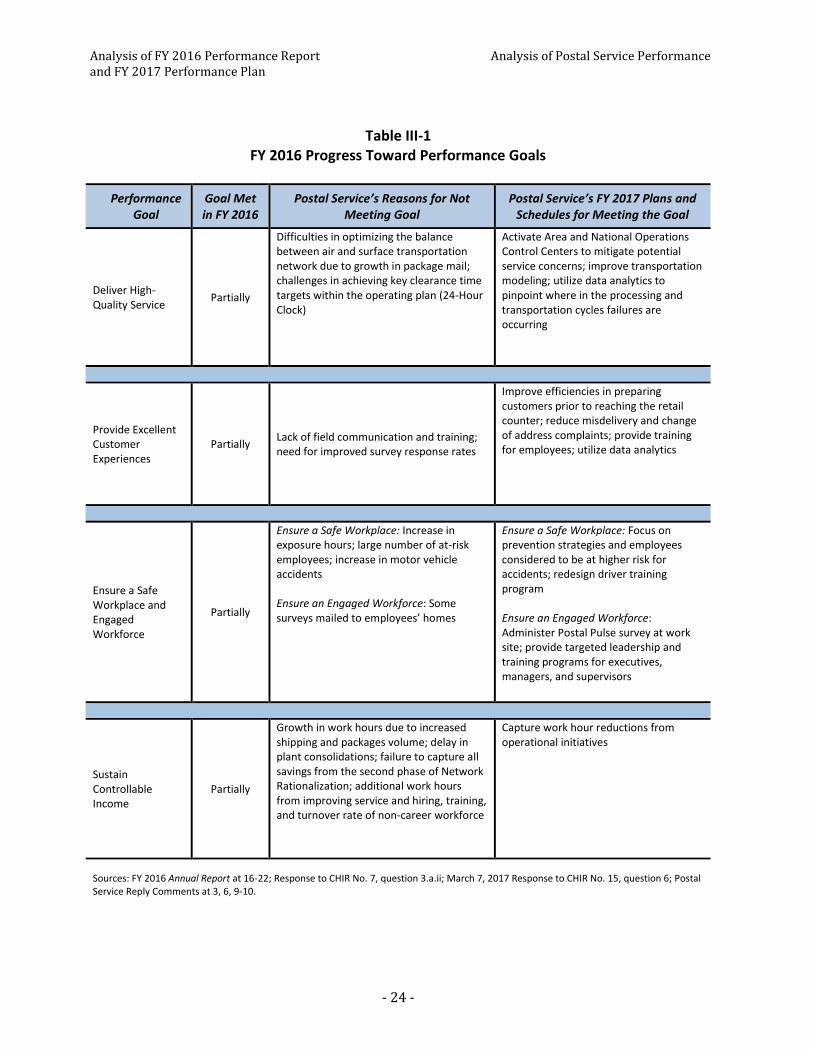
In this chapter, the Commission evaluates whether the Postal Service met each performance goal in FY 2016 as required by 39 U.S.C. § 3653(d). The Commission considers the Postal Service to have met a performance goal if results for each performance indicator meet or exceed targets established in the applicable annual performance plan. FY 2015 Analysis at 6. The Commission finds that the Postal Service partially met each performance goal in FY 2016. Table III-1 lists each performance goal, whether the goal was met in FY 2016, reasons provided by the Postal Service for not meeting the goal, and the Postal Service’s plans for achieving the performance goal in future years. See 39 U.S.C. § 2804(d)(3).
Analysis of FY 2016 Performance Report Analysis of Postal Service Performance and FY 2017 Performance Plan
- 24 -
Table III-1 FY 2016 Progress Toward Performance Goals
Performance Goal
Goal Met in FY 2016
Postal Service’s Reasons for Not Meeting Goal
Postal Service’s FY 2017 Plans and Schedules for Meeting the Goal
Deliver High-Quality Service
Partially
Difficulties in optimizing the balance between air and surface transportation network due to growth in package mail; challenges in achieving key clearance time targets within the operating plan (24-Hour Clock)
Activate Area and National Operations Control Centers to mitigate potential service concerns; improve transportation modeling; utilize data analytics to pinpoint where in the processing and transportation cycles failures are occurring
Provide Excellent Customer Experiences
Partially Lack of field communication and training; need for improved survey response rates
Improve efficiencies in preparing customers prior to reaching the retail counter; reduce misdelivery and change of address complaints; provide training for employees; utilize data analytics
Ensure a Safe Workplace and Engaged Workforce
Partially
Ensure a Safe Workplace: Increase in exposure hours; large number of at-risk employees; increase in motor vehicle accidents Ensure an Engaged Workforce: Some surveys mailed to employees’ homes
Ensure a Safe Workplace: Focus on prevention strategies and employees considered to be at higher risk for accidents; redesign driver training program Ensure an Engaged Workforce: Administer Postal Pulse survey at work site; provide targeted leadership and training programs for executives, managers, and supervisors
Sustain Controllable Income
Partially
Growth in work hours due to increased shipping and packages volume; delay in plant consolidations; failure to capture all savings from the second phase of Network Rationalization; additional work hours from improving service and hiring, training, and turnover rate of non-career workforce
Capture work hour reductions from operational initiatives
Sources: FY 2016 Annual Report at 16-22; Response to CHIR No. 7, question 3.a.ii; March 7, 2017 Response to CHIR No. 15, question 6; Postal Service Reply Comments at 3, 6, 9-10.

Analysis of FY 2016 Performance Report Analysis of Postal Service Performance and FY 2017 Performance Plan
- 25 -
In the sections below, the Commission discusses each performance goal and provides recommendations to help the Postal Service meet the goal and better assess its performance in future years.
A. Deliver High-Quality Service
1. Background Performance indicators. For most Market Dominant products, the Postal Service sets a service standard for the number of days it takes to deliver a mailpiece on-time. Service performance results are expressed as the percentage of mail meeting the applicable service standard. The Postal Service uses the percentage of selected and combined mail products delivered on-time to assess whether its performance meets the Deliver High-Quality Service performance goal.26 Seven performance indicators measured progress toward this goal in FY 2016:27
● Single-Piece First-Class Mail
o 2-Day
o 3-5-Day
● Presorted First-Class Mail
o Overnight
o 2-Day
o 3-5-Day
● First-Class Mail Composite
● Standard Mail Composite
The Single-Piece First-Class Mail (2-Day and 3-5-Day) performance indicators measure service performance using a combination of the following First-Class Mail products: Single-Piece Letters/Postcards, Flats, and Parcels. FY 2016 Annual Report at 16. In the past, the Postal Service also measured progress toward the Deliver High-Quality Service
26 The Postal Service also reports service performance on all Market Dominant products in the Annual Compliance Report (ACR). 39 U.S.C. § 3652(a)(2)(B)(i). Service performance measurement reporting in the ACR is independent of service performance measurement reporting in annual performance plans and annual performance reports under 39 U.S.C. §§ 2803 and 2804. The reporting of these service performance measurements in the FY 2016 Annual Report does not meet the same class- or group-specific granular reporting criteria as those service performance measurements required in the Commission’s rules. See 39 C.F.R. §§ 3055.20 through 3055.24. Single-Piece First-Class Mail and Presorted First-Class Mail Overnight, 2-Day, and 3-5-Day performance indicators in the FY 2016 Annual Report combine service performance results for different products. By contrast, the ACR requires the Postal Service to disaggregate service performance results by mail subject to the Overnight, 2-Day, and 3-5-Day service standards by First-Class Mail product. See, e.g., 39 C.F.R. § 3055.20(a).
27 The Postal Service also set FY 2016 targets for two non-public performance indicators: one for a combined Priority Mail Express and Priority Mail and another for Parcel Select. FY 2015 Analysis at 22. The Postal Service met one of these targets in FY 2016. March 15, 2015 Response to CHIR No. 27, question 7; Library Reference USPS-FY16-NP42, March 15, 2017.
Analysis of FY 2016 Performance Report Analysis of Postal Service Performance and FY 2017 Performance Plan
- 26 -
goal using the Single-Piece First-Class Mail (Overnight) performance indicator. However, this performance indicator was removed in FY 2016 due to service standard changes made during FY 2015.28 The Presorted First-Class Mail performance indicators (Overnight, 2-Day, and 3-5-Day) measure service performance for combined overall Presorted mail performance from mail acceptance to delivery. FY 2016 Annual Report at 16. The First-Class Mail Composite performance indicator combines the service performance results for Single-Piece First-Class Mail and Presorted First-Class Mail for an aggregate of Overnight, 2-Day, and 3-5-Day service. Id. The First-Class Mail Composite performance indicator measures service performance for the following First-Class Mail products: Single-Piece Letters/Postcards, Presorted Letters/Postcards, Flats, and Parcels. February 7, 2017 Response to CHIR No. 10, question 3.a. The Standard Mail Composite performance indicator measures service performance for a subset of selected Standard Mail products: High Density and Saturation Letters, High Density and Saturation Flats/Parcels, Carrier Route, Letters, and Flats. February 17, 2017 Response to CHIR No. 15, question 1.b. However, the performance indicator includes only Standard Mail Letters and Standard Mail Flats entered at a destination entry sectional center facility (SCF Entry) or network distribution center (NDC Entry). February 7, 2017 Response to CHIR No. 10, question 3.c. Comparison of FY 2016 targets and results. In FY 2016, the Standard Mail Composite result (92.97) exceeded the target (91.00).29 However, the Postal Service failed to meet FY 2016 targets set for any of the six performance indicators that measure First-Class Mail service performance. In a CHIR response, the Postal Service identifies two main reasons for not meeting FY 2016 targets for the First-Class Mail performance indicators. First, there was a failure of individual plants to meet 24-Hour Clock target clearance times, which influenced its ability to achieve subsequent 24-Hour Clock targets. February 7, 2017 Response to CHIR No. 10, question 2.a. The 24-Hour Clock target clearance times require processing plants to
28 FY 2016 Annual Report at 15 n.1. In FY 2013 and FY 2014, much of the Single-Piece First-Class Mail (Overnight) service standard volumes had already shifted to either the 2-Day or 3-5-Day service standard as a result of service standard changes associated with the Mail Processing Network Rationalization initiative. See Docket No. N2012-1, Advisory Opinion on Mail Processing Network Rationalization Service Changes, September 28, 2012.
29 FY 2016 Annual Report at 15; see page 3, Table I-1, supra. The Postal Service states that the primary reason why the FY 2016 Standard Mail Composite performance indicator (92.97) is higher than most of the Standard Mail service performance scores shown in its Annual Report on Service Performance for Market Dominant Products is because “[t]he letters and flats entered at destination SCF and NDC were delivered within the service standard at a higher [on-time] rate than origin entered end-to-end Standard Mail.” See February 17, 2017 Response to CHIR No. 15, question 1.c; see Library Reference USPS-FY16-29, December 29, 2016, file “FY16-29 Service Performance Report.pdf.”
Analysis of FY 2016 Performance Report Analysis of Postal Service Performance and FY 2017 Performance Plan
- 27 -
complete the specific processing actions by certain times during the day.30 The Postal Service asserts that failing to meet 24-Hour Clock target clearance times impacted the Postal Service’s ability to meet FY 2016 targets for the Deliver High-Quality Service performance indicators. See February 7, 2017 Response to CHIR No. 10, question 2.a. Second, the Postal Service explains that it failed to meet FY 2016 targets due to inefficient mail processing utilization or “sub-target utilization of mail processing equipment in some plants[,]” which affected the Postal Service’s ability to meet key 24-Hour Clock target clearance times. Id. The Postal Service states that achieving targets for hourly efficiency (mailpieces processed per hour) and daily volume targets (mailpieces processed per day) present opportunities for improvement. Id. FY 2017 performance indicator changes. The Postal Service is making three changes to the Deliver High-Quality Service performance indicators for FY 2017. First, it will replace the First-Class Mail Composite performance indicator with the First-Class Mail Letter & Flat (FCLF) Composite performance indicator, which will measure service performance for First-Class Mail Letters/Postcards and Flats across all service standards. FY 2016 Annual Report at 15 n.3. Similar to First-Class Mail Composite, the FCLF Composite performance indicator will measure service performance for the following products: Single-Piece First-Class Mail Letters/Postcards, Presorted First-Class Mail Letters/Postcards, and First-Class Mail Flats. February 7, 2017 Response to CHIR No. 10, question 3.b. Unlike First-Class Mail Composite, the FCLF Composite performance indicator will not include First-Class Mail Parcels. Id. Second, the Postal Service will replace the Standard Mail Composite performance indicator with the Standard Mail & Periodicals Composite performance indicator, which will measure performance for Standard Mail Letters, Standard Mail Flats, and Periodicals flats. FY 2016 Annual Report at 15 n.4. Similar to the Standard Mail Composite performance indicator, the Standard Mail & Periodicals Composite performance indicator will measure service performance for the following Standard Mail products: High Density and Saturation Letters, High Density and Saturation Flats/Parcels, Carrier Route, Letters, and Flats. February 7, 2017 Response to CHIR No. 10, question 3.d. Unlike Standard Mail Composite, the Standard Mail & Periodicals Composite performance indicator will also include Every Door Direct Mail-Retail, In-County Periodicals, and Outside County Periodicals. Id. Also, the Standard Mail & Periodicals Composite performance indicator will measure all letter and flat-shaped mailpieces for Standard Mail and Periodicals across all entry location types and all service standards. Id.
30 The Commission discusses 24-Hour Clock metrics and national performance goals used in FY 2016 in its FY 2016 ACD. See FY 2016 ACD at section V.A.3.
Analysis of FY 2016 Performance Report Analysis of Postal Service Performance and FY 2017 Performance Plan
- 28 -
Third, the Postal Service will introduce a new performance indicator, the First-Class Mail Packages (FCMP) Composite.31 The FCMP Composite performance indicator will measure service performance of domestic Market Dominant First-Class Retail and Commercial Parcels. See February 13, 2017 Response to CHIR No. 10, question 4.b.i. FY 2017 Plan. In the FY 2017 Plan, FY 2017 targets for the Single-Piece First-Class Mail and Presorted First-Class Mail performance indicators are the same as FY 2016 targets. See FY 2016 Annual Report at 15. The FY 2017 Plan also sets FY 2017 targets for the new FCLF Composite and Standard Mail & Periodicals Composite performance indicators. Id. Although the FY 2017 Plan does not include a FY 2017 target for the FCMP Composite performance indicator, the Postal Service describes this performance indicator and provides the FY 2017 target (94.80) in a CHIR response. See February 13, 2017 Response to CHIR No. 10, question 4.b.iii.
2. Comments The Public Representative comments that after two years of deteriorating service, the Postal Service’s performance improved for every performance indicator. PR Comments at 4. She notes that improvements were significant, especially for the Single-Piece First-Class Mail and Presorted First-Class Mail 3-5-Day performance indicators. Id. However, the Public Representative observes that despite these improvements, the Postal Service did not meet any FY 2016 targets for the Single-Piece First-Class Mail and Presorted First-Class Mail performance indicators. Id. at 5. She notes that the most significant shortfalls are for the 3-5-Day performance indicators for Single-Piece First-Class Mail and Presorted First-Class Mail. Id. The Public Representative states that the FY 2016 Report fails to explain why the Postal Service did not meet FY 2016 targets and explain how it will meet the Deliver High-Quality Service performance goal in FY 2017. Id. at 6. She asserts that the Postal Service sets unrealistic service performance targets in the FY 2017 Plan. Id. She notes that despite the improvement in FY 2016, service performance results would have to increase substantially to meet FY 2017 targets. Id. In its reply comments, the Postal Service acknowledges opportunities to improve service performance for both the Single-Piece First-Class Mail and Presorted First-Class Mail (3-5-Day) performance indicators. Postal Service Reply Comments at 3. It explains that the operating window change from FY 2015 continues to impact its ability to meet service performance targets. Id. It notes that specific factors influencing 3-5-Day service performance include challenges in achieving 24-Hour Clock targets, as well as difficulties in optimizing the balance between air and surface transportation. Id.
31 FY 2016 Annual Report at 17; February 7, 2017 Response to CHIR No. 10, question 4.a.
Analysis of FY 2016 Performance Report Analysis of Postal Service Performance and FY 2017 Performance Plan
- 29 -
The Postal Service describes the strategies it has implemented to mitigate adverse effects on service performance resulting from the operating window change, as well as plans to improve service performance during FY 2017. Id. at 4-5. It disputes the Public Representative’s contention that the service performance targets are not realistic and asserts that the targets allow the Postal Service to strive for continuous improvement. Id. at 6. The Postal Service notes that service performance improved during the last two quarters of FY 2016, which it contends shows that the initiatives it employed produced positive results. Id. at 8.
3. Commission Analysis In FY 2016, the Postal Service met one of the seven targets set for the Deliver High-Quality Service performance indicators. Consequently, the Commission finds that the Postal Service partially met the Deliver High-Quality Service performance goal in FY 2016.
In this section, the Commission first makes observations on the Postal Service's FY 2016 service performance. Second, the Commission evaluates the new Deliver High-Quality Service performance indicators the Postal Service is introducing for FY 2017. Third, the Commission makes recommendations for meeting FY 2017 targets.
a. Observations on FY 2016 Service Performance
As shown in Table III-2, in FY 2016, all service performance results improved over FY 2015. In fact, this was the first time since the Postal Service introduced its strategic initiatives to “close the gap between revenue and cost” in FY 201232 that all service performance indicator results improved over the previous fiscal year. Although the Postal Service did not meet most FY 2016 targets for the Deliver High-Quality Service performance indicators, results of the Single-Piece First-Class Mail (3-5-Day) and Presorted First-Class Mail (3-5-Day) performance indicators showed a relatively large year-over-year improvement. As a result, the FY 2016 First-Class Mail Composite performance indicator result also showed a large year-over-year improvement from FY 2015.
32 The Postal Service developed its strategic initiatives “to close the gap between revenue and cost over the next five years” in FY 2012. See Docket No. ACR2012, Library Reference USPS-FY12-17, December 28, 2012, at 38-39.
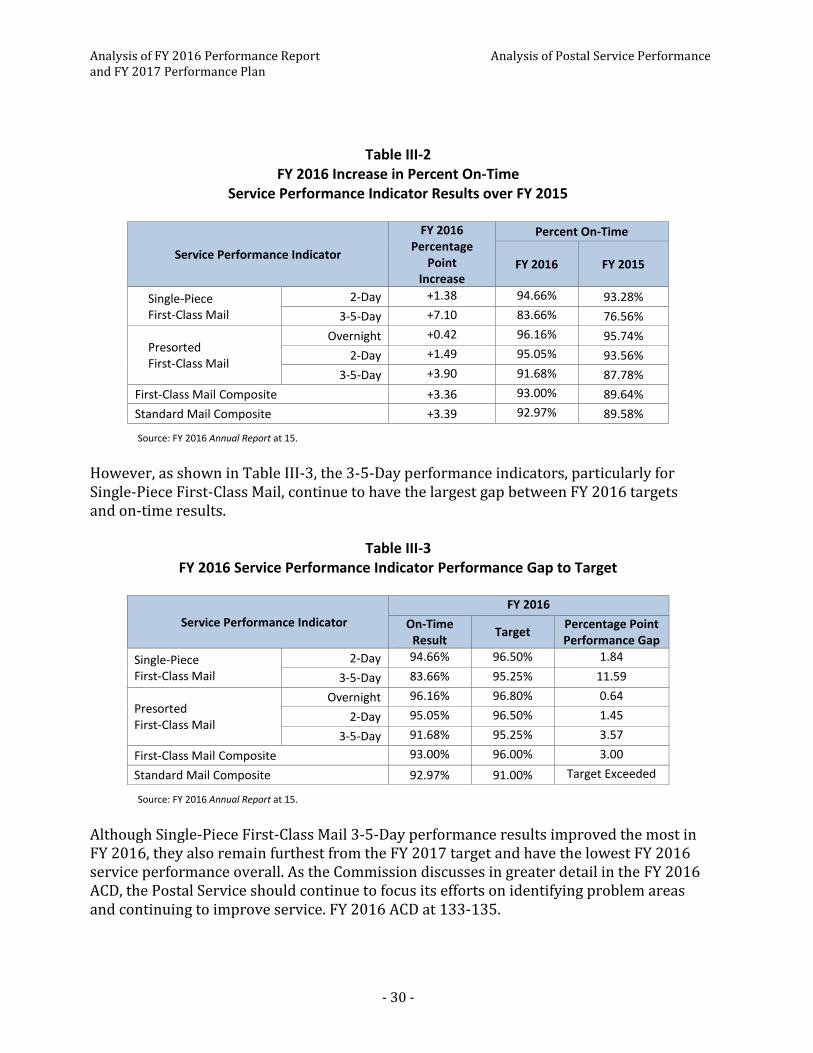
Analysis of FY 2016 Performance Report Analysis of Postal Service Performance and FY 2017 Performance Plan
- 30 -
Table III-2
FY 2016 Increase in Percent On-Time Service Performance Indicator Results over FY 2015
Service Performance Indicator
FY 2016 Percentage
Point Increase
Percent On-Time
FY 2016 FY 2015
Single-Piece First-Class Mail
2-Day +1.38 94.66% 93.28%
3-5-Day +7.10 83.66% 76.56%
Presorted First-Class Mail
Overnight +0.42 96.16% 95.74%
2-Day +1.49 95.05% 93.56%
3-5-Day +3.90 91.68% 87.78%
First-Class Mail Composite +3.36 93.00% 89.64%
Standard Mail Composite +3.39 92.97% 89.58%
Source: FY 2016 Annual Report at 15.
However, as shown in Table III-3, the 3-5-Day performance indicators, particularly for Single-Piece First-Class Mail, continue to have the largest gap between FY 2016 targets and on-time results.
Table III-3 FY 2016 Service Performance Indicator Performance Gap to Target
Service Performance Indicator
FY 2016
On-Time Result
Target Percentage Point
Performance Gap
Single-Piece First-Class Mail
2-Day 94.66% 96.50% 1.84
3-5-Day 83.66% 95.25% 11.59
Presorted First-Class Mail
Overnight 96.16% 96.80% 0.64
2-Day 95.05% 96.50% 1.45
3-5-Day 91.68% 95.25% 3.57
First-Class Mail Composite 93.00% 96.00% 3.00
Standard Mail Composite 92.97% 91.00% Target Exceeded
Source: FY 2016 Annual Report at 15.
Although Single-Piece First-Class Mail 3-5-Day performance results improved the most in FY 2016, they also remain furthest from the FY 2017 target and have the lowest FY 2016 service performance overall. As the Commission discusses in greater detail in the FY 2016 ACD, the Postal Service should continue to focus its efforts on identifying problem areas and continuing to improve service. FY 2016 ACD at 133-135.
Analysis of FY 2016 Performance Report Analysis of Postal Service Performance and FY 2017 Performance Plan
- 31 -
b. FY 2017 Performance Indicator Changes
As previously discussed, the Postal Service will introduce a new performance indicator, FCMP Composite, in FY 2017 to measure service performance of First-Class Mail Parcels. In a CHIR response, the Postal Service provides the formula it plans to use to calculate results for this performance indicator: FCMP Score Formula**: ((National Performance Assessment (NPA) Candidate On-Time Mailpieces / NPA Candidate Total Mailpieces) * 100) **Note: NPA measurement excludes the Adjusted Service Period for 3-5-Day service standard mailpieces.
February 13, 2017 Response to CHIR No. 10, question 4.b.i. The formula indicates that the FY 2017 FCMP Composite result will be based on “NPA Candidate” mailpieces and adjusted by excluding First-Class Mail Parcels received during a certain service period for pieces with a 3-5-Day service standard.33 It is unclear which mailpieces are “NPA Candidates” and why the Postal Service excludes some mailpieces from the formula. The Commission recommends that the Postal Service provide this information in the FY 2017 Report. The Postal Service states that the new Standard Mail & Periodicals Composite performance indicator will measure all letter- and flat-shaped mailpieces of Standard Mail and Periodicals regardless of the entry location type beginning in FY 2017. February 7, 2017 Response to CHIR No. 10, question 3.d. In FY 2016, the total number of Standard Mail mailpieces was 80.9 billion, which far exceeded the total number of Periodicals mailpieces (5.6 billion).34 Given the large difference in volumes between Standard Mail and Periodicals, the Standard Mail & Periodicals Composite FY 2017 result will likely be driven by Standard Mail. As a result, this composite performance indicator will not likely reflect Periodicals service performance, and there will be little insight into Periodicals performance as a result of this change in performance indicator. In addition, it is also not clear for both the FY 2016 Standard Mail Composite performance indicator and the FY 2017 Standard Mail & Periodicals Composite performance indicator whether the performance indicators have reflected or will reflect the majority of some or all Standard Mail Flats on-time performance. By combining Standard Mail Letters and Flats in its composite measures, the “measured” volumes potentially reflect Standard Mail Letters performance rather than Standard Mail Flats performance. In FY 2016, approximately 56 billion of the nearly 81 billion Standard Mail mailpieces were letter-shaped mailpieces. Id. cells L31 and L34.
33 The FY 2016 adjustment excluded the 3-5-Day First-Class Mail Parcels entered from November 21, 2015 through January 8, 2016. See id. question 4.b.ii.
34 See Library Reference USPS-FY16-42, December 29, 2016, Excel file “Fy2016_RPWsummaryreport_public.xls,” cells L42 and L48.

Analysis of FY 2016 Performance Report Analysis of Postal Service Performance and FY 2017 Performance Plan
- 32 -
In the FY 2017 Report, the Commission recommends that the Postal Service provide a more detailed discussion related to the Standard Mail and Periodicals mailpieces that will be used to measure the Standard Mail & Periodicals Composite performance indicator. The Postal Service should also report on whether the combined mail classes, shapes, and products for the Standard Mail & Periodicals Composite performance indicator primarily reflect the performance of Standard Mail Letters rather than Standard Mail Flats or Periodicals flats. Similarly for the new FCLF Composite performance indicator, approximately 40 billion out of the total 62 billion First-Class Mail mailpieces are Presorted Letters/Postcards. Id. cells L20 and L28. Thus, it is not clear whether FY 2017 results of the FCLF Composite performance indicator will be more reflective of Presorted Letters/Postcards than Single-Piece Letters/Postcards or Flats. In the FY 2017 Report, the Commission recommends that the Postal Service discuss how combining different First-Class Mail products with potentially different service performance results affected the FY 2017 result of the FCLF Composite performance indicator. The Commission also recommends that the Postal Service consider including its supporting workpapers for the service performance indicators not included elsewhere in its ACR filings.
c. Recommendations for Meeting FY 2017 Targets
As shown in Table III-3, supra, the Postal Service missed FY 2016 targets set for six of the seven Deliver High-Quality Service performance indicators.35 The Public Representative comments that service performance results for some performance indicators would have to increase substantially to meet FY 2017 targets. PR Comments at 6. The Commission agrees that results for the Single-Piece First-Class Mail 3-5-Day performance indicator in particular must improve substantially in order for the Postal Service to meet the FY 2017 target. The improvement needed for all service performance indicators to meet the respective FY 2017 targets ranges from 0.64 to 11.69 percentage points. The Postal Service states that Single-Piece First-Class Mail (3-5-Day) “continued to provide opportunities for improvement” as it “balanced the air and surface transportation network due to the growth in package mail.” FY 2016 Annual Report at 16. Growth in package mail is expected to also continue in FY 2017 with Shipping and Packages volume expected to grow nearly 8 percent over FY 2016 volume.36 The Postal Service explains that it did not meet FY 2016 targets for the Deliver High-Quality Service performance indicators due to ineffective utilization of mail processing 35 In FY 2017, the Postal Service retained the same service performance indicator targets it has used since FY 2014 for the First-Class Mail performance indicators specific to a service standard category. See page 30, Table III-3, supra. For the new FY 2017 composite measures, the FY 2017 targets are: Standard Mail & Periodicals Composite (91.00); FCLF Composite (96.00); FCMP Composite (94.80). FY 2016 Annual Report at 15; February 13, 2017 Response to CHIR No. 10, question 4.b.iii.
36 The FY 2017 IFP projects 5.5 billion mailpieces in FY 2017 and reports FY 2016 actual volume as 5.1 billion mailpieces. FY 2017 IFP at 5.
Analysis of FY 2016 Performance Report Analysis of Postal Service Performance and FY 2017 Performance Plan
- 33 -
equipment in some plants that affected the ability to achieve key 24-Hour Clock targets. February 7, 2017 Response to CHIR No. 10, question 2.a. However, the Postal Service does not explain what type of mail processing equipment was ineffectively utilized or why. As a result, it is unclear how its plans for improvement by meeting hourly efficiency and daily volume targets will impact FY 2017 service performance.
B. Provide Excellent Customer Experiences
1. Background
a. FY 2016 Performance Indicators
One of the Postal Service’s performance goals is to Provide Excellent Customer Experiences. FY 2016 Annual Report at 17. Since FY 2014, the Postal Service has evaluated customer experience using the CI measurement system.37 According to the Postal Service, the CI measurement system “provides a comprehensive view of the customer experience across the most frequently used customer contact channels.” FY 2016 Annual Report at 17. The CI measurement system is based on surveys of Residential, Small/Medium Business, and Large Business customers.38 These customer surveys are provided in the ACR.39 In FY 2016, the Postal Service evaluated customer experience using five surveys. FY 2016 Annual Report at 18. Table III-4 lists those surveys and the customer experiences they measure.
37 In its FY 2014 Analysis, the Commission described the change from the former Customer Experience Measurement system to the current CI measurement system in detail. FY 2014 Analysis at 22-24.
38 Residential customers live in households in the United States. Small/Medium Business customers have fewer than 250 employees. Large Business customers have more than 250 employees. Library Reference USPS-FY16-38, December 29, 2016, file “USPS-FY16-38 Preface.pdf,” at 1.
39 The Postal Service must include a copy of each customer survey, a description of the customer type targeted by the survey, the number of surveys initiated and received, and in the case of multiple choice questions, the number of responses received for each question, disaggregated by each of the possible responses. 39 C.F.R. § 3055.92. The Postal Service provided this information in Library Reference USPS-FY16-38.
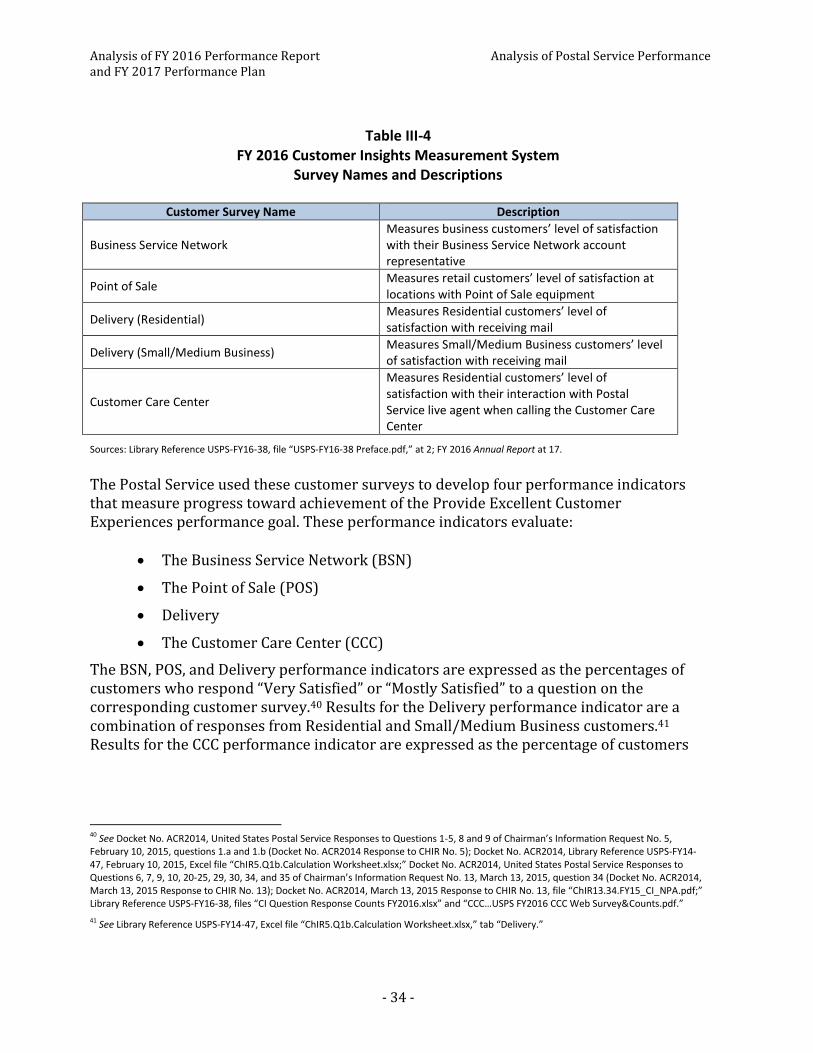
Analysis of FY 2016 Performance Report Analysis of Postal Service Performance and FY 2017 Performance Plan
- 34 -
Table III-4 FY 2016 Customer Insights Measurement System
Survey Names and Descriptions
Customer Survey Name Description
Business Service Network Measures business customers’ level of satisfaction with their Business Service Network account representative
Point of Sale Measures retail customers’ level of satisfaction at locations with Point of Sale equipment
Delivery (Residential) Measures Residential customers’ level of satisfaction with receiving mail
Delivery (Small/Medium Business) Measures Small/Medium Business customers’ level of satisfaction with receiving mail
Customer Care Center
Measures Residential customers’ level of satisfaction with their interaction with Postal Service live agent when calling the Customer Care Center
Sources: Library Reference USPS-FY16-38, file “USPS-FY16-38 Preface.pdf,” at 2; FY 2016 Annual Report at 17.
The Postal Service used these customer surveys to develop four performance indicators that measure progress toward achievement of the Provide Excellent Customer Experiences performance goal. These performance indicators evaluate:
The Business Service Network (BSN)
The Point of Sale (POS)
Delivery
The Customer Care Center (CCC)
The BSN, POS, and Delivery performance indicators are expressed as the percentages of customers who respond “Very Satisfied” or “Mostly Satisfied” to a question on the corresponding customer survey.40 Results for the Delivery performance indicator are a combination of responses from Residential and Small/Medium Business customers.41 Results for the CCC performance indicator are expressed as the percentage of customers
40 See Docket No. ACR2014, United States Postal Service Responses to Questions 1-5, 8 and 9 of Chairman’s Information Request No. 5, February 10, 2015, questions 1.a and 1.b (Docket No. ACR2014 Response to CHIR No. 5); Docket No. ACR2014, Library Reference USPS-FY14-47, February 10, 2015, Excel file “ChIR5.Q1b.Calculation Worksheet.xlsx;” Docket No. ACR2014, United States Postal Service Responses to Questions 6, 7, 9, 10, 20-25, 29, 30, 34, and 35 of Chairman’s Information Request No. 13, March 13, 2015, question 34 (Docket No. ACR2014, March 13, 2015 Response to CHIR No. 13); Docket No. ACR2014, March 13, 2015 Response to CHIR No. 13, file “ChIR13.34.FY15_CI_NPA.pdf;” Library Reference USPS-FY16-38, files “CI Question Response Counts FY2016.xlsx” and “CCC…USPS FY2016 CCC Web Survey&Counts.pdf.”
41 See Library Reference USPS-FY14-47, Excel file “ChIR5.Q1b.Calculation Worksheet.xlsx,” tab “Delivery.”
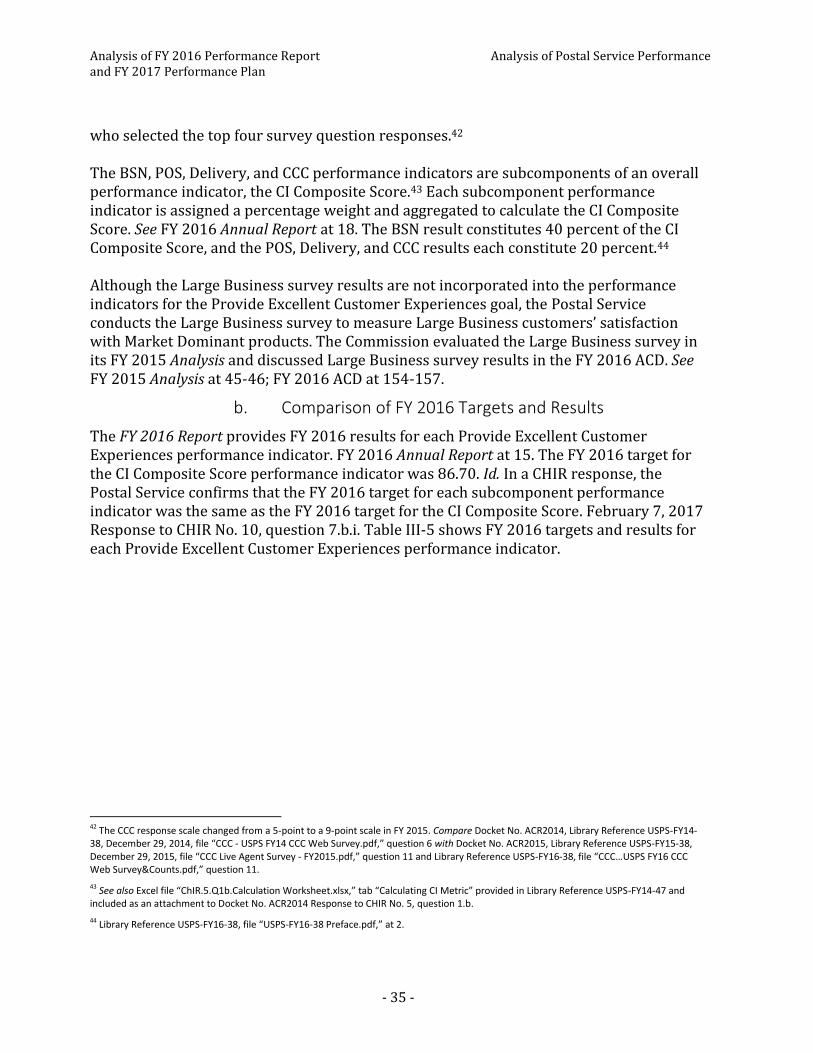
Analysis of FY 2016 Performance Report Analysis of Postal Service Performance and FY 2017 Performance Plan
- 35 -
who selected the top four survey question responses.42 The BSN, POS, Delivery, and CCC performance indicators are subcomponents of an overall performance indicator, the CI Composite Score.43 Each subcomponent performance indicator is assigned a percentage weight and aggregated to calculate the CI Composite Score. See FY 2016 Annual Report at 18. The BSN result constitutes 40 percent of the CI Composite Score, and the POS, Delivery, and CCC results each constitute 20 percent.44 Although the Large Business survey results are not incorporated into the performance indicators for the Provide Excellent Customer Experiences goal, the Postal Service conducts the Large Business survey to measure Large Business customers’ satisfaction with Market Dominant products. The Commission evaluated the Large Business survey in its FY 2015 Analysis and discussed Large Business survey results in the FY 2016 ACD. See FY 2015 Analysis at 45-46; FY 2016 ACD at 154-157.
b. Comparison of FY 2016 Targets and Results
The FY 2016 Report provides FY 2016 results for each Provide Excellent Customer Experiences performance indicator. FY 2016 Annual Report at 15. The FY 2016 target for the CI Composite Score performance indicator was 86.70. Id. In a CHIR response, the Postal Service confirms that the FY 2016 target for each subcomponent performance indicator was the same as the FY 2016 target for the CI Composite Score. February 7, 2017 Response to CHIR No. 10, question 7.b.i. Table III-5 shows FY 2016 targets and results for each Provide Excellent Customer Experiences performance indicator.
42 The CCC response scale changed from a 5-point to a 9-point scale in FY 2015. Compare Docket No. ACR2014, Library Reference USPS-FY14-38, December 29, 2014, file “CCC - USPS FY14 CCC Web Survey.pdf,” question 6 with Docket No. ACR2015, Library Reference USPS-FY15-38, December 29, 2015, file “CCC Live Agent Survey - FY2015.pdf,” question 11 and Library Reference USPS-FY16-38, file “CCC…USPS FY16 CCC Web Survey&Counts.pdf,” question 11.
43 See also Excel file “ChIR.5.Q1b.Calculation Worksheet.xlsx,” tab “Calculating CI Metric” provided in Library Reference USPS-FY14-47 and included as an attachment to Docket No. ACR2014 Response to CHIR No. 5, question 1.b.
44 Library Reference USPS-FY16-38, file “USPS-FY16-38 Preface.pdf,” at 2.

Analysis of FY 2016 Performance Report Analysis of Postal Service Performance and FY 2017 Performance Plan
- 36 -
Table III-5 Provide Excellent Customer Experiences Performance Indicators
FY 2016 Targets and Results45
Performance Indicator FY 2016 Target FY 2016 Result
. Target Not Met
Customer Insights Composite Score
86.70a 87.62
a
Business Service Network 86.70% 95.13%
Point of Sale 86.70% 86.38%
Delivery (Residential and Small/Medium Business)
86.70a 76.26
a
Customer Care Center 86.70% 85.18% a Because CI Composite Score and Delivery results are calculated by weighting and aggregating various survey results, they are not presented as percentages.
Sources: FY 2016 Annual Report at 15; February 7, 2017 Response to CHIR No. 10, question 7.b.i. In FY 2016, the CI Composite Score and the BSN performance indicator results both exceeded the FY 2016 target. However, the Postal Service did not meet FY 2016 targets for the POS, Delivery, and CCC performance indicators. The POS and CCC results are slightly short of the target, while the Delivery result is about 10 points below the target.46
c. Proposed Changes to the FY 2017 Performance Indicators
The Postal Service is making three changes to the Provide Excellent Customer Experiences performance indicators for FY 2017. First, the Postal Service is introducing Enterprise Customer Care (eCC) as a new subcomponent performance indicator.47 The Postal Service explained that when a CCC agent is unable to resolve a customer issue, an eCC case is created and routed to the appropriate contact person for resolution. Docket No. ACR2014, March 13, 2015 Response to CHIR No. 13, question 25.a. Results for the eCC performance indicator are expressed as the percentage of reopened cases the Postal Service could not initially resolve. February 7, 2017 Response to CHIR No. 10, question 6.a.i. 45 The BSN, POS, and Delivery survey results are the percentage of respondents who chose the top two survey responses (Very Satisfied, Mostly Satisfied) to the respective survey “overall satisfaction” question. The BSN survey question asks, “When thinking about your specific interaction with [(BSN representative name)]…How satisfied are you with the OVERALL service provided during this interaction?” The POS survey question asks, “Thinking about this visit to the Post Office, overall, how satisfied were you?” The Delivery survey questions ask, “Just thinking about your overall experience with the mail or packages you recently RECEIVED, how satisfied are you with USPS performance?” The CCC survey question asks, “Now think only about the agent who handled your recent call. On a scale from 1 to 9, how would you rate the agent’s overall quality of service?” The CCC responses of 6 and higher are used to calculate the overall satisfaction percentage. See Library Reference USPS-FY16-38, files “BSN - USPS FY16 BSN Web Survey.docx,” “POS…USPS FY16 POS Survey.docx,” “Delivery - USPS FY16 Residential Delivery SURVEY.docx,” “Delivery -USPS FY16 Small Business Delivery SURVEY.docx,” “CCC…USPS FY16 CCC Web Survey&Counts.pdf,” and “CI Question Response Counts FY2016.xlsx.”
46 In a CHIR response, the Postal Service explains why it failed to meet FY 2016 targets for the POS, Delivery, and CCC performance indicators and its plans and schedules for meeting FY 2017 targets. March 7, 2017 Response to CHIR No. 15, question 6.
47 FY 2016 Annual Report at 15 n.7. The Postal Service clarifies that the name of the performance indicator is “Enterprise Customer Care” rather than “Electronic Customer Care” as listed in the FY 2016 Annual Report. February 7, 2017 Response to CHIR No. 10, question 6.
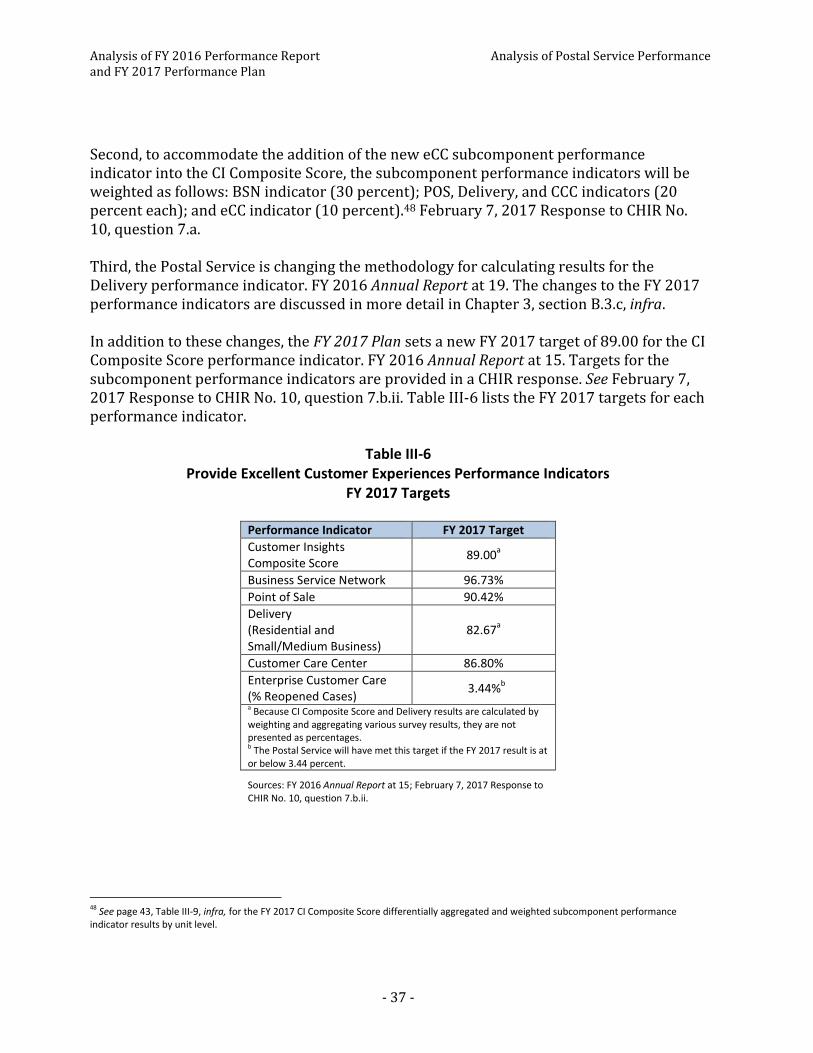
Analysis of FY 2016 Performance Report Analysis of Postal Service Performance and FY 2017 Performance Plan
- 37 -
Second, to accommodate the addition of the new eCC subcomponent performance indicator into the CI Composite Score, the subcomponent performance indicators will be weighted as follows: BSN indicator (30 percent); POS, Delivery, and CCC indicators (20 percent each); and eCC indicator (10 percent).48 February 7, 2017 Response to CHIR No. 10, question 7.a. Third, the Postal Service is changing the methodology for calculating results for the Delivery performance indicator. FY 2016 Annual Report at 19. The changes to the FY 2017 performance indicators are discussed in more detail in Chapter 3, section B.3.c, infra. In addition to these changes, the FY 2017 Plan sets a new FY 2017 target of 89.00 for the CI Composite Score performance indicator. FY 2016 Annual Report at 15. Targets for the subcomponent performance indicators are provided in a CHIR response. See February 7, 2017 Response to CHIR No. 10, question 7.b.ii. Table III-6 lists the FY 2017 targets for each performance indicator.
Table III-6 Provide Excellent Customer Experiences Performance Indicators
FY 2017 Targets
Performance Indicator FY 2017 Target
Customer Insights Composite Score
89.00a
Business Service Network 96.73%
Point of Sale 90.42%
Delivery (Residential and Small/Medium Business)
82.67a
Customer Care Center 86.80%
Enterprise Customer Care (% Reopened Cases)
3.44%b
a Because CI Composite Score and Delivery results are calculated by weighting and aggregating various survey results, they are not presented as percentages. b The Postal Service will have met this target if the FY 2017 result is at or below 3.44 percent.
Sources: FY 2016 Annual Report at 15; February 7, 2017 Response to CHIR No. 10, question 7.b.ii.
48 See page 43, Table III-9, infra, for the FY 2017 CI Composite Score differentially aggregated and weighted subcomponent performance indicator results by unit level.

Analysis of FY 2016 Performance Report Analysis of Postal Service Performance and FY 2017 Performance Plan
- 38 -
2. Comments The Public Representative points out that FY 2016 results for the CI Composite Score exceeded the FY 2016 target, but only because the BSN performance indicator exceeded its FY 2016 target. PR Comments at 7. She notes that the results for all of the other performance indicators (the POS, Delivery, and CCC indicators) fell below their FY 2016 targets. Id. Notwithstanding the failure of these three performance indicators to meet their targets, the Public Representative concludes that the Postal Service met the Provide Excellent Customer Experiences performance goal in FY 2016. Id. To recognize the diversity of Postal Service customers and to track whether all customer needs are met, the Public Representative recommends adding demographic questions to the POS and CCC surveys to track customer satisfaction for different demographic groups. Id. at 17. She suggests that the Postal Service set target customer satisfaction scores for different demographic groups and targets for the differentials between customer groups. Id. at 18. In its reply comments, the Postal Service acknowledges the Public Representative’s comment that the BSN performance indicator result helped the Postal Service exceed the FY 2016 target for the CI Composite Score. Postal Service Reply Comments at 9. The Postal Service states that it intends to continue its efforts in providing excellent customer experiences through the BSN, but notes that it will also work to improve results for the other subcomponent performance indicators. Id.
3. Commission Analysis In this section, the Commission evaluates the FY 2016 customer experience performance results and provides recommendations for improving the evaluation of performance results. The Commission also discusses the proposed FY 2017 methodology changes to the performance indicators and analyzes survey response rates.
a. FY 2016 Performance Results
Table III-7 shows results for all available Provide Excellent Customer Experiences performance indicators from FY 2013 to FY 2016. Between FY 2014 and FY 2016, the results for each performance indicator improved, except for Delivery. By contrast, Delivery results declined between FY 2013 and FY 2016. Despite this decline in Delivery performance and the POS, Delivery, and CCC results not meeting their targets, the Postal Service met the CI Composite Score target (86.70) in FY 2016.
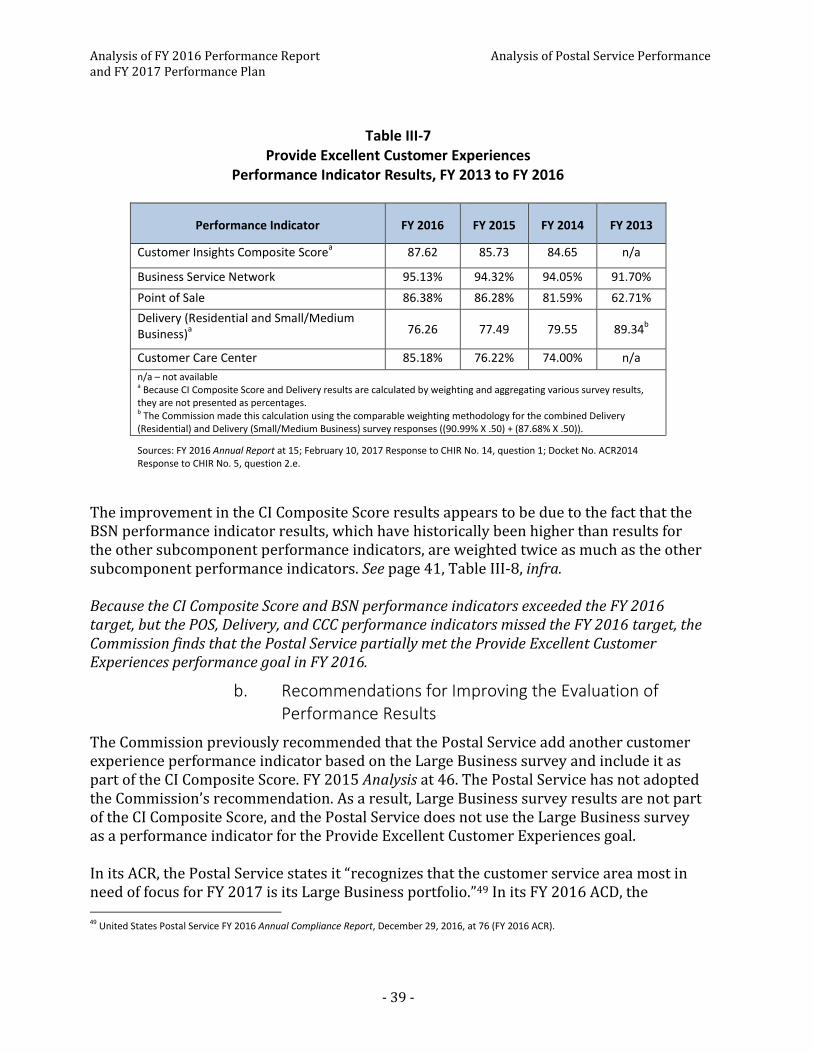
Analysis of FY 2016 Performance Report Analysis of Postal Service Performance and FY 2017 Performance Plan
- 39 -
Table III-7 Provide Excellent Customer Experiences
Performance Indicator Results, FY 2013 to FY 2016
Performance Indicator FY 2016 FY 2015 FY 2014 FY 2013
Customer Insights Composite Scorea 87.62 85.73 84.65 n/a
Business Service Network 95.13% 94.32% 94.05% 91.70%
Point of Sale 86.38% 86.28% 81.59% 62.71%
Delivery (Residential and Small/Medium Business)
a 76.26 77.49 79.55 89.34
b
Customer Care Center 85.18% 76.22% 74.00% n/a
n/a – not available a Because CI Composite Score and Delivery results are calculated by weighting and aggregating various survey results, they are not presented as percentages. b The Commission made this calculation using the comparable weighting methodology for the combined Delivery (Residential) and Delivery (Small/Medium Business) survey responses ((90.99% X .50) + (87.68% X .50)).
Sources: FY 2016 Annual Report at 15; February 10, 2017 Response to CHIR No. 14, question 1; Docket No. ACR2014 Response to CHIR No. 5, question 2.e.
The improvement in the CI Composite Score results appears to be due to the fact that the BSN performance indicator results, which have historically been higher than results for the other subcomponent performance indicators, are weighted twice as much as the other subcomponent performance indicators. See page 41, Table III-8, infra. Because the CI Composite Score and BSN performance indicators exceeded the FY 2016 target, but the POS, Delivery, and CCC performance indicators missed the FY 2016 target, the Commission finds that the Postal Service partially met the Provide Excellent Customer Experiences performance goal in FY 2016.
b. Recommendations for Improving the Evaluation of Performance Results
The Commission previously recommended that the Postal Service add another customer experience performance indicator based on the Large Business survey and include it as part of the CI Composite Score. FY 2015 Analysis at 46. The Postal Service has not adopted the Commission’s recommendation. As a result, Large Business survey results are not part of the CI Composite Score, and the Postal Service does not use the Large Business survey as a performance indicator for the Provide Excellent Customer Experiences goal. In its ACR, the Postal Service states it “recognizes that the customer service area most in need of focus for FY 2017 is its Large Business portfolio.”49 In its FY 2016 ACD, the 49 United States Postal Service FY 2016 Annual Compliance Report, December 29, 2016, at 76 (FY 2016 ACR).
Analysis of FY 2016 Performance Report Analysis of Postal Service Performance and FY 2017 Performance Plan
- 40 -
Commission notes that Large Business customer satisfaction with Single-Piece International Mail and Library Mail declined significantly between FY 2015 and FY 2016. FY 2016 ACD at 156. The Commission also observes that Large Business customers’ satisfaction with local post office staff declined from 79.3 percent in FY 2013 to 73.2 percent in FY 2016.50 The Postal Service acknowledges that it must take steps to increase customer satisfaction for large businesses. FY 2016 ACR at 76. A separate performance indicator for large businesses would help the Postal Service track the effectiveness of its initiatives aimed to accomplish this improvement.51 The Commission reiterates its recommendation that the Postal Service establish a performance indicator based on the Large Business survey. The FY 2016 Report lists results for each performance indicator at the national level. See FY 2016 Annual Report at 15. Additional insights are provided by performance results that the Postal Service calculates at the area and district levels.52 Table III-8 shows how the Postal Service currently calculates CI Composite Score results at the national, area, and district levels by aggregating and weighting results for each subcomponent performance indicator. Because the Postal Service calculates CI Composite Score results differently at the national, area, and district levels, only 1 out of 67 districts and 3 out of 7 postal areas met the CI Composite Score target in FY 2015.53
50 Compare FY 2013 Review at 21 with the results in Library Reference USPS-FY16-38, Excel file “CI Question Response Counts FY2016.xlsx,” tab “LargeBusiness,” cells B889:B895. In FY 2016, 934 out of 1,276 Large Business customers, or 73.2 percent, responded that they were “Very Satisfied” or “Mostly Satisfied” with their experience contacting their local post office. See Library Reference USPS-FY16-38, Excel file “CI Question Response Counts FY2016.xlsx,” tab “LargeBusiness,” cells B889:B895.
51 The Postal Service previously stated that the BSN survey “encompasses [its] [L]arge [B]usiness customers.” Docket No. ACR2014 Response to CHIR No. 5, question 4. In its FY 2015 Analysis, the Commission explained why the Large Business survey better reflects Large Business customer experiences compared to the BSN survey. FY 2015 Analysis at 45-46.
52 Districts map to groups of 3-Digit ZIP Codes and to postal areas. There are 67 districts and 7 postal areas. See the 3-Digit ZIP Codes map to district by postal area provided in Docket No. ACR2015, Responses of the United States Postal Service to Questions 1-15 of Chairman’s Information Request No. 14, February 23, 2016, question 1 (Docket No. ACR2015 Response to CHIR No. 14); Docket No. ACR2015 Response to CHIR No. 14, Excel file “ChIR14.Q.1.3Digit.District.xlsx.”
53 The Postal Service previously provided FY 2015 unit-level results using the methodology depicted in Table III-8. See Docket No. ACR2015, Responses of the United States Postal Service to Questions 1-12, 16-18 of Chairman’s Information Request No. 13, February 18, 2016, question 4, Table 1.1 and Table 1.2 (Docket No. ACR2015, February 18, 2016 Response to CHIR No. 13). FY 2015 CI Composite Score results at the national, area, and district levels are listed in Docket No. ACR2015, February 18, 2016 Response to CHIR No. 13, question 4, Table 1.1 and Table 1.2, column “NPA.”
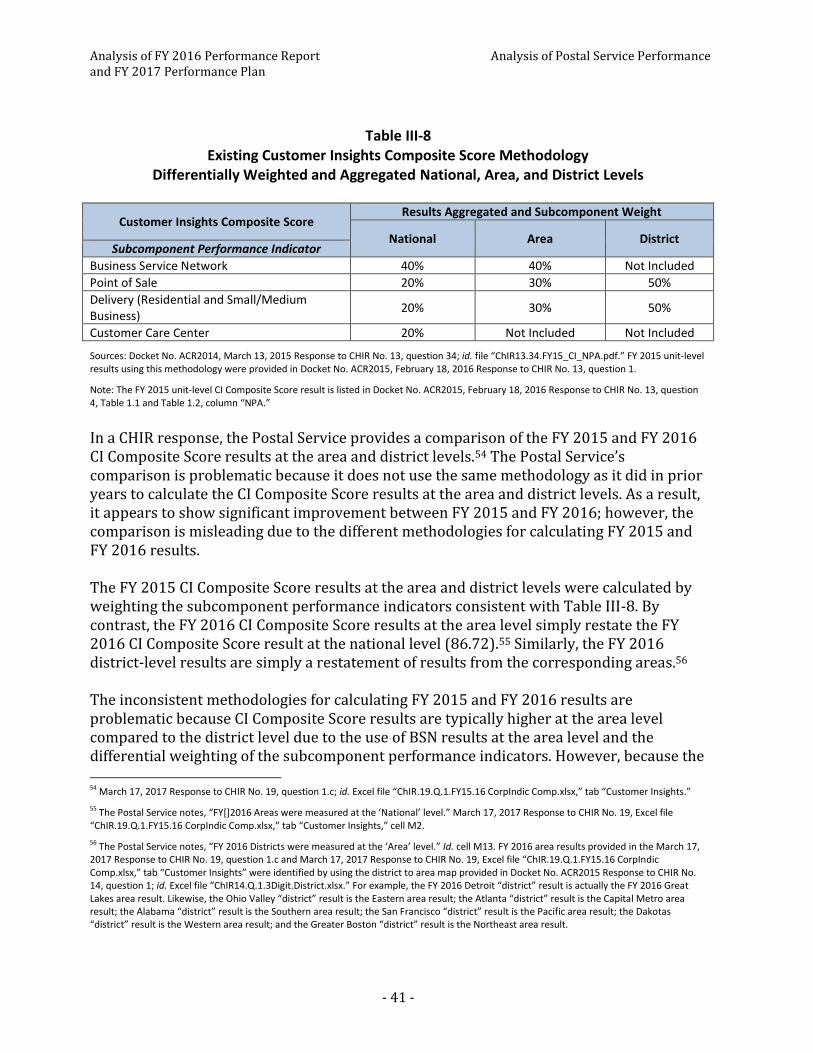
Analysis of FY 2016 Performance Report Analysis of Postal Service Performance and FY 2017 Performance Plan
- 41 -
Table III-8 Existing Customer Insights Composite Score Methodology
Differentially Weighted and Aggregated National, Area, and District Levels
Customer Insights Composite Score Results Aggregated and Subcomponent Weight
National Area District Subcomponent Performance Indicator
Business Service Network 40% 40% Not Included
Point of Sale 20% 30% 50%
Delivery (Residential and Small/Medium Business)
20% 30% 50%
Customer Care Center 20% Not Included
Not Included
Sources: Docket No. ACR2014, March 13, 2015 Response to CHIR No. 13, question 34; id. file “ChIR13.34.FY15_CI_NPA.pdf.” FY 2015 unit-level results using this methodology were provided in Docket No. ACR2015, February 18, 2016 Response to CHIR No. 13, question 1.
Note: The FY 2015 unit-level CI Composite Score result is listed in Docket No. ACR2015, February 18, 2016 Response to CHIR No. 13, question 4, Table 1.1 and Table 1.2, column “NPA.”
In a CHIR response, the Postal Service provides a comparison of the FY 2015 and FY 2016 CI Composite Score results at the area and district levels.54 The Postal Service’s comparison is problematic because it does not use the same methodology as it did in prior years to calculate the CI Composite Score results at the area and district levels. As a result, it appears to show significant improvement between FY 2015 and FY 2016; however, the comparison is misleading due to the different methodologies for calculating FY 2015 and FY 2016 results. The FY 2015 CI Composite Score results at the area and district levels were calculated by weighting the subcomponent performance indicators consistent with Table III-8. By contrast, the FY 2016 CI Composite Score results at the area level simply restate the FY 2016 CI Composite Score result at the national level (86.72).55 Similarly, the FY 2016 district-level results are simply a restatement of results from the corresponding areas.56 The inconsistent methodologies for calculating FY 2015 and FY 2016 results are problematic because CI Composite Score results are typically higher at the area level compared to the district level due to the use of BSN results at the area level and the differential weighting of the subcomponent performance indicators. However, because the
54 March 17, 2017 Response to CHIR No. 19, question 1.c; id. Excel file “ChIR.19.Q.1.FY15.16 CorpIndic Comp.xlsx,” tab “Customer Insights.”
55 The Postal Service notes, “FY[]2016 Areas were measured at the ‘National’ level.” March 17, 2017 Response to CHIR No. 19, Excel file “ChIR.19.Q.1.FY15.16 CorpIndic Comp.xlsx,” tab “Customer Insights,” cell M2.
56 The Postal Service notes, “FY 2016 Districts were measured at the ‘Area’ level.” Id. cell M13. FY 2016 area results provided in the March 17, 2017 Response to CHIR No. 19, question 1.c and March 17, 2017 Response to CHIR No. 19, Excel file “ChIR.19.Q.1.FY15.16 CorpIndic Comp.xlsx,” tab “Customer Insights” were identified by using the district to area map provided in Docket No. ACR2015 Response to CHIR No. 14, question 1; id. Excel file “ChIR14.Q.1.3Digit.District.xlsx.” For example, the FY 2016 Detroit “district” result is actually the FY 2016 Great Lakes area result. Likewise, the Ohio Valley “district” result is the Eastern area result; the Atlanta “district” result is the Capital Metro area result; the Alabama “district” result is the Southern area result; the San Francisco “district” result is the Pacific area result; the Dakotas “district” result is the Western area result; and the Greater Boston “district” result is the Northeast area result.
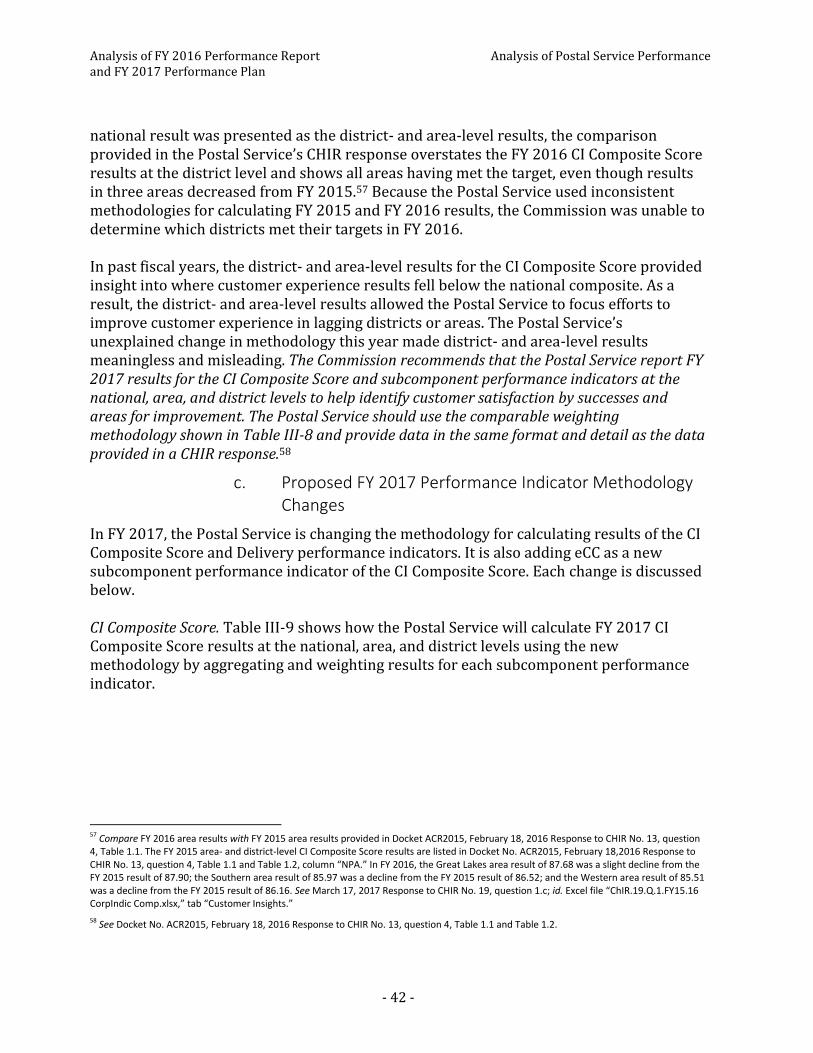
Analysis of FY 2016 Performance Report Analysis of Postal Service Performance and FY 2017 Performance Plan
- 42 -
national result was presented as the district- and area-level results, the comparison provided in the Postal Service’s CHIR response overstates the FY 2016 CI Composite Score results at the district level and shows all areas having met the target, even though results in three areas decreased from FY 2015.57 Because the Postal Service used inconsistent methodologies for calculating FY 2015 and FY 2016 results, the Commission was unable to determine which districts met their targets in FY 2016. In past fiscal years, the district- and area-level results for the CI Composite Score provided insight into where customer experience results fell below the national composite. As a result, the district- and area-level results allowed the Postal Service to focus efforts to improve customer experience in lagging districts or areas. The Postal Service’s unexplained change in methodology this year made district- and area-level results meaningless and misleading. The Commission recommends that the Postal Service report FY 2017 results for the CI Composite Score and subcomponent performance indicators at the national, area, and district levels to help identify customer satisfaction by successes and areas for improvement. The Postal Service should use the comparable weighting methodology shown in Table III-8 and provide data in the same format and detail as the data provided in a CHIR response.58
c. Proposed FY 2017 Performance Indicator Methodology Changes
In FY 2017, the Postal Service is changing the methodology for calculating results of the CI Composite Score and Delivery performance indicators. It is also adding eCC as a new subcomponent performance indicator of the CI Composite Score. Each change is discussed below. CI Composite Score. Table III-9 shows how the Postal Service will calculate FY 2017 CI Composite Score results at the national, area, and district levels using the new methodology by aggregating and weighting results for each subcomponent performance indicator.
57 Compare FY 2016 area results with FY 2015 area results provided in Docket ACR2015, February 18, 2016 Response to CHIR No. 13, question 4, Table 1.1. The FY 2015 area- and district-level CI Composite Score results are listed in Docket No. ACR2015, February 18,2016 Response to CHIR No. 13, question 4, Table 1.1 and Table 1.2, column “NPA.” In FY 2016, the Great Lakes area result of 87.68 was a slight decline from the FY 2015 result of 87.90; the Southern area result of 85.97 was a decline from the FY 2015 result of 86.52; and the Western area result of 85.51 was a decline from the FY 2015 result of 86.16. See March 17, 2017 Response to CHIR No. 19, question 1.c; id. Excel file “ChIR.19.Q.1.FY15.16 CorpIndic Comp.xlsx,” tab “Customer Insights.”
58 See Docket No. ACR2015, February 18, 2016 Response to CHIR No. 13, question 4, Table 1.1 and Table 1.2.
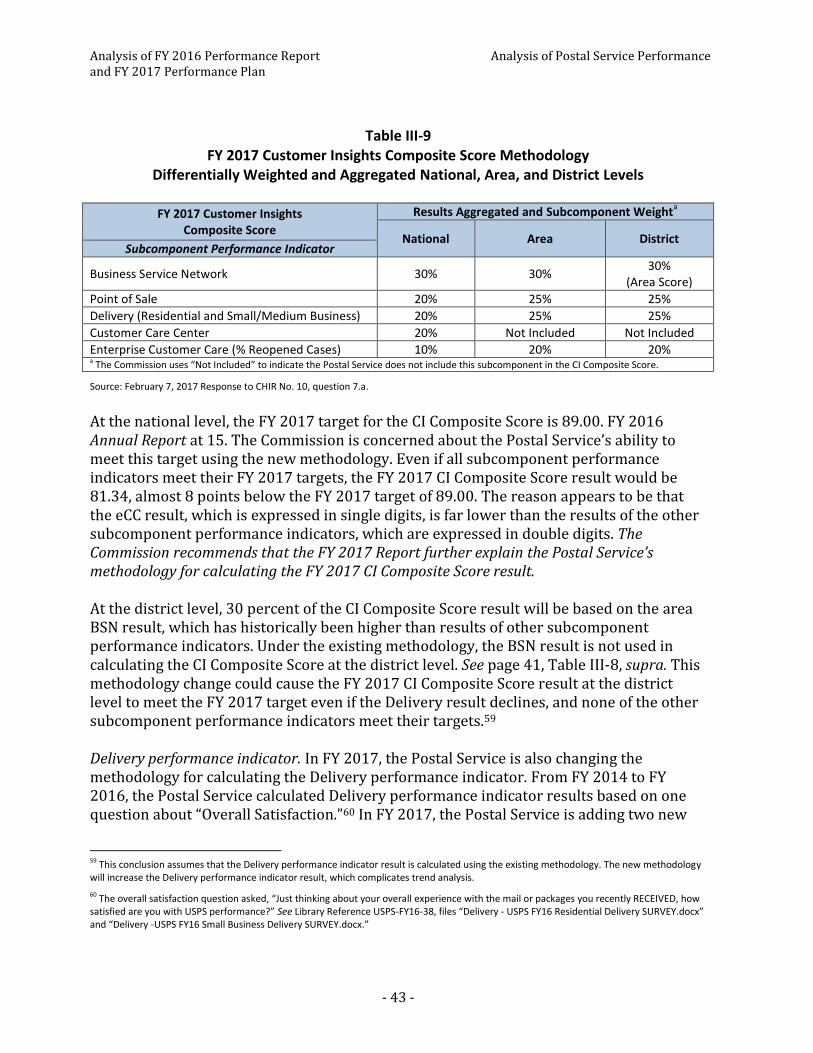
Analysis of FY 2016 Performance Report Analysis of Postal Service Performance and FY 2017 Performance Plan
- 43 -
Table III-9 FY 2017 Customer Insights Composite Score Methodology
Differentially Weighted and Aggregated National, Area, and District Levels
FY 2017 Customer Insights Composite Score
Results Aggregated and Subcomponent Weighta
National Area District Subcomponent Performance Indicator
Business Service Network 30% 30% 30%
(Area Score)
Point of Sale 20% 25% 25%
Delivery (Residential and Small/Medium Business) 20% 25% 25%
Customer Care Center 20% Not Included Not Included
Enterprise Customer Care (% Reopened Cases) 10% 20% 20% a The Commission uses “Not Included” to indicate the Postal Service does not include this subcomponent in the CI Composite Score.
Source: February 7, 2017 Response to CHIR No. 10, question 7.a.
At the national level, the FY 2017 target for the CI Composite Score is 89.00. FY 2016 Annual Report at 15. The Commission is concerned about the Postal Service’s ability to meet this target using the new methodology. Even if all subcomponent performance indicators meet their FY 2017 targets, the FY 2017 CI Composite Score result would be 81.34, almost 8 points below the FY 2017 target of 89.00. The reason appears to be that the eCC result, which is expressed in single digits, is far lower than the results of the other subcomponent performance indicators, which are expressed in double digits. The Commission recommends that the FY 2017 Report further explain the Postal Service’s methodology for calculating the FY 2017 CI Composite Score result. At the district level, 30 percent of the CI Composite Score result will be based on the area BSN result, which has historically been higher than results of other subcomponent performance indicators. Under the existing methodology, the BSN result is not used in calculating the CI Composite Score at the district level. See page 41, Table III-8, supra. This methodology change could cause the FY 2017 CI Composite Score result at the district level to meet the FY 2017 target even if the Delivery result declines, and none of the other subcomponent performance indicators meet their targets.59 Delivery performance indicator. In FY 2017, the Postal Service is also changing the methodology for calculating the Delivery performance indicator. From FY 2014 to FY 2016, the Postal Service calculated Delivery performance indicator results based on one question about “Overall Satisfaction.”60 In FY 2017, the Postal Service is adding two new
59 This conclusion assumes that the Delivery performance indicator result is calculated using the existing methodology. The new methodology will increase the Delivery performance indicator result, which complicates trend analysis.
60 The overall satisfaction question asked, “Just thinking about your overall experience with the mail or packages you recently RECEIVED, how satisfied are you with USPS performance?” See Library Reference USPS-FY16-38, files “Delivery - USPS FY16 Residential Delivery SURVEY.docx” and “Delivery -USPS FY16 Small Business Delivery SURVEY.docx.”
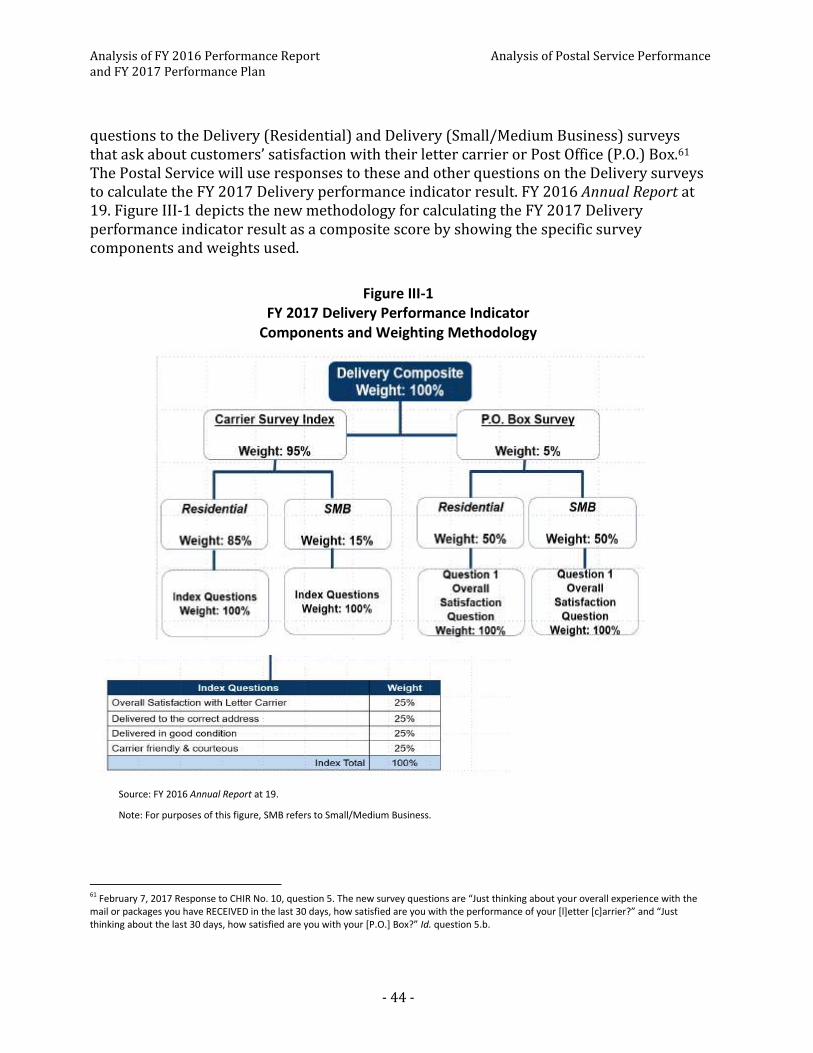
Analysis of FY 2016 Performance Report Analysis of Postal Service Performance and FY 2017 Performance Plan
- 44 -
questions to the Delivery (Residential) and Delivery (Small/Medium Business) surveys that ask about customers’ satisfaction with their letter carrier or Post Office (P.O.) Box.61 The Postal Service will use responses to these and other questions on the Delivery surveys to calculate the FY 2017 Delivery performance indicator result. FY 2016 Annual Report at 19. Figure III-1 depicts the new methodology for calculating the FY 2017 Delivery performance indicator result as a composite score by showing the specific survey components and weights used.
Figure III-1
FY 2017 Delivery Performance Indicator Components and Weighting Methodology
Source: FY 2016 Annual Report at 19.
Note: For purposes of this figure, SMB refers to Small/Medium Business.
61 February 7, 2017 Response to CHIR No. 10, question 5. The new survey questions are “Just thinking about your overall experience with the mail or packages you have RECEIVED in the last 30 days, how satisfied are you with the performance of your [l]etter [c]arrier?” and “Just thinking about the last 30 days, how satisfied are you with your [P.O.] Box?” Id. question 5.b.
Analysis of FY 2016 Performance Report Analysis of Postal Service Performance and FY 2017 Performance Plan
- 45 -
Figure III-1 shows that the FY 2017 Delivery performance indicator result is a composite score comprising a weighted carrier survey score and a weighted P.O. Box survey score. The Postal Service will calculate the weighted carrier survey score using four questions from the Delivery surveys as index questions.62 These index questions will ask customers to rate their level of agreement with statements regarding their delivery experience (whether mail was delivered to the correct address and in good condition and their carrier was friendly and courteous), as well as their overall level of satisfaction with their letter carrier. Id. The P.O. Box survey score will be based on the weighted responses to one question on the Delivery surveys asking customers about their overall satisfaction with their P.O. Box. Id. Table III-10 shows how the FY 2016 Delivery performance indicator result would have been calculated using the new methodology displayed in Figure III-1. Under the new methodology, the FY 2016 result would have been 84.77, more than 8 points higher than the FY 2016 result calculated using the existing methodology (76.26). There appear to be at least two reasons for this difference. First, there are generally more favorable responses to index questions on the Delivery (Residential) survey than there are to index questions on the Delivery (Small/Medium Business) survey. Second, the new methodology weights the higher Delivery (Residential) survey results more heavily than the Delivery (Small/Medium Business) survey results. As a consequence, the FY 2017 Delivery performance indicator result (calculated using the new methodology) will likely meet or exceed the FY 2017 target.
62 Id. The index questions are the same on both the Delivery (Residential) and Delivery (Small/Medium Business) surveys.
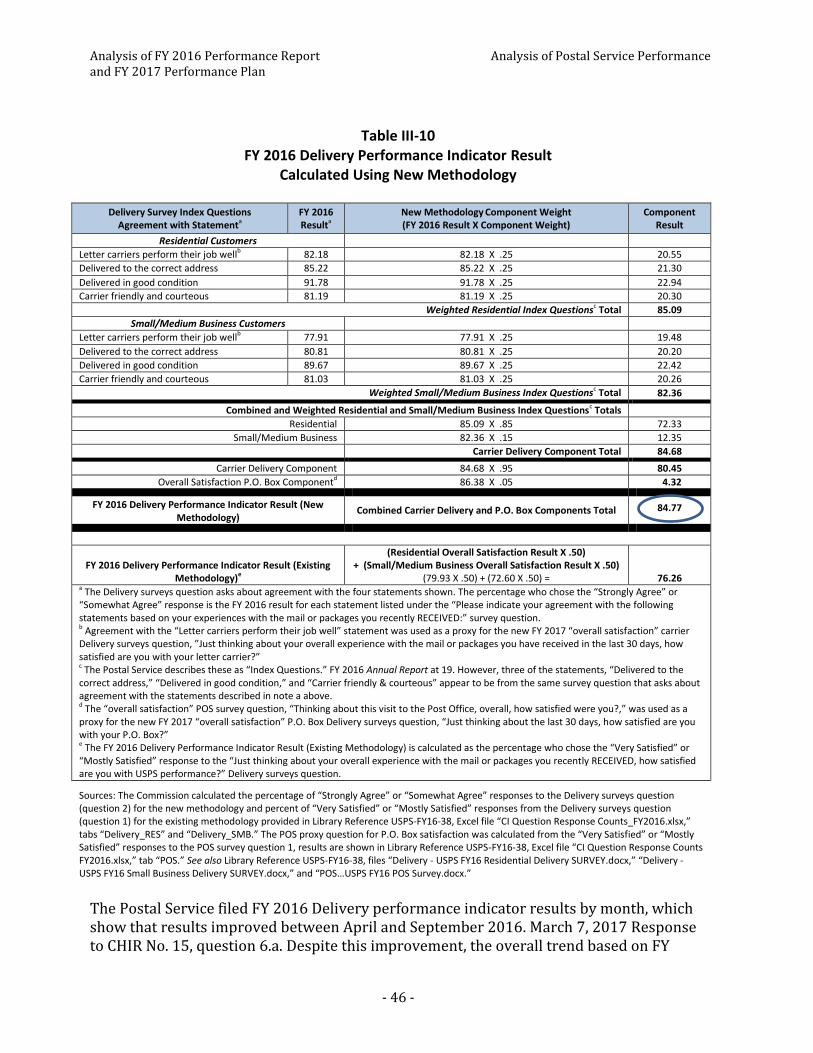
Analysis of FY 2016 Performance Report Analysis of Postal Service Performance and FY 2017 Performance Plan
- 46 -
Table III-10 FY 2016 Delivery Performance Indicator Result
Calculated Using New Methodology
Delivery Survey Index Questions Agreement with Statementa
FY 2016 Resulta
New Methodology Component Weight (FY 2016 Result X Component Weight)
Component Result
Residential Customers
Letter carriers perform their job wellb 82.18 82.18 X .25 20.55
Delivered to the correct address 85.22 85.22 X .25 21.30
Delivered in good condition 91.78 91.78 X .25 22.94
Carrier friendly and courteous 81.19 81.19 X .25 20.30
Weighted Residential Index Questionsc Total 85.09
Small/Medium Business Customers
Letter carriers perform their job wellb 77.91 77.91 X .25 19.48
Delivered to the correct address 80.81 80.81 X .25 20.20
Delivered in good condition 89.67 89.67 X .25 22.42
Carrier friendly and courteous 81.03 81.03 X .25 20.26
Weighted Small/Medium Business Index Questionsc Total 82.36
Combined and Weighted Residential and Small/Medium Business Index Questionsc Totals
Residential 85.09 X .85 72.33
Small/Medium Business 82.36 X .15 12.35
Carrier Delivery Component Total 84.68
Carrier Delivery Component 84.68 X .95 80.45
Overall Satisfaction P.O. Box Componentd 86.38 X .05 4.32
FY 2016 Delivery Performance Indicator Result (New Methodology)
Combined Carrier Delivery and P.O. Box Components Total 84.77
FY 2016 Delivery Performance Indicator Result (Existing Methodology)e
(Residential Overall Satisfaction Result X .50) + (Small/Medium Business Overall Satisfaction Result X .50)
(79.93 X .50) + (72.60 X .50) = 76.26 a The Delivery surveys question asks about agreement with the four statements shown. The percentage who chose the “Strongly Agree” or “Somewhat Agree” response is the FY 2016 result for each statement listed under the “Please indicate your agreement with the following statements based on your experiences with the mail or packages you recently RECEIVED:” survey question. b Agreement with the “Letter carriers perform their job well” statement was used as a proxy for the new FY 2017 “overall satisfaction” carrier Delivery surveys question, ”Just thinking about your overall experience with the mail or packages you have received in the last 30 days, how satisfied are you with your letter carrier?” c The Postal Service describes these as “Index Questions.” FY 2016 Annual Report at 19. However, three of the statements, “Delivered to the correct address,” “Delivered in good condition,” and “Carrier friendly & courteous” appear to be from the same survey question that asks about agreement with the statements described in note a above. d The “overall satisfaction” POS survey question, “Thinking about this visit to the Post Office, overall, how satisfied were you?,” was used as a proxy for the new FY 2017 “overall satisfaction” P.O. Box Delivery surveys question, “Just thinking about the last 30 days, how satisfied are you with your P.O. Box?” e The FY 2016 Delivery Performance Indicator Result (Existing Methodology) is calculated as the percentage who chose the “Very Satisfied” or “Mostly Satisfied” response to the “Just thinking about your overall experience with the mail or packages you recently RECEIVED, how satisfied are you with USPS performance?” Delivery surveys question.
Sources: The Commission calculated the percentage of “Strongly Agree” or “Somewhat Agree” responses to the Delivery surveys question (question 2) for the new methodology and percent of “Very Satisfied” or “Mostly Satisfied” responses from the Delivery surveys question (question 1) for the existing methodology provided in Library Reference USPS-FY16-38, Excel file “CI Question Response Counts_FY2016.xlsx,” tabs “Delivery_RES” and “Delivery_SMB.” The POS proxy question for P.O. Box satisfaction was calculated from the “Very Satisfied” or “Mostly Satisfied” responses to the POS survey question 1, results are shown in Library Reference USPS-FY16-38, Excel file “CI Question Response Counts FY2016.xlsx,” tab “POS.” See also Library Reference USPS-FY16-38, files “Delivery - USPS FY16 Residential Delivery SURVEY.docx,” “Delivery -USPS FY16 Small Business Delivery SURVEY.docx,” and “POS…USPS FY16 POS Survey.docx.”
The Postal Service filed FY 2016 Delivery performance indicator results by month, which show that results improved between April and September 2016. March 7, 2017 Response to CHIR No. 15, question 6.a. Despite this improvement, the overall trend based on FY
Analysis of FY 2016 Performance Report Analysis of Postal Service Performance and FY 2017 Performance Plan
- 47 -
2016 results suggests that without substantial improvement, the FY 2017 Delivery result would likely miss the FY 2017 target if the Postal Service did not change the methodology for calculating the Delivery performance indicator. As discussed in Chapter 2, to ensure comparability across prior fiscal years, the Commission recommends that the FY 2017 Report include FY 2017 Delivery results calculated using both the existing and new methodologies. See Chapter 2, section C.3, supra. To better analyze why Delivery performance indicator results declined at the national level, the Commission recommends that the Postal Service provide FY 2016 and FY 2017 Delivery performance indicator results disaggregated by area and district using both the existing and new methodologies. This information is important for the Commission to assess the Postal Service’s initiatives to improve Delivery performance indicator results. The Commission recommends that the Postal Service compare Delivery performance indicator results for FYs 2014, 2015, 2016, and 2017 using the existing methodology (based on the “Overall Satisfaction” question) to evaluate customer satisfaction with mail delivery during this time period. If the FY 2017 Delivery performance indicator result using the existing methodology shows little change over FY 2016, the Commission recommends that the Postal Service evaluate and report responses to another survey question: “In the future, what should the USPS do to improve your satisfaction with how we DELIVER your mail or packages?” The open-ended, detailed responses to this question are likely to be more informative than the new FY 2017 “Overall Satisfaction” question for which respondents can only choose one response between “Very Satisfied” and “Very Dissatisfied.” New eCC performance indicator. The Commission identifies several issues with the new eCC performance indicator. First, it measures different things compared to the other CI subcomponent performance indicators. The existing indicators measure customer satisfaction directly based on responses to customer surveys. The eCC subcomponent performance indicator does not necessarily measure customer satisfaction. Instead, it measures the percentage of reopened cases that the Postal Service could not initially resolve. Second, the significance of eCC results is unclear. For example, a lower eCC result could be interpreted to suggest that customer experience improved because the need for reopening cases declined. By contrast, a higher eCC performance indicator could give the Postal Service credit for taking additional steps to address a customer’s concerns without producing a result that satisfies the customer. Moreover, it is unclear how a successful outcome of a reopened case will be tallied. Third, as shown in Table III-9, supra, the Postal Service will use the eCC result to calculate the FY 2017 CI Composite Score result. Although a higher eCC result could indicate a decline in customer experience, it would, numerically, improve the CI Composite Score result and thereby suggest the opposite: namely, that the customer experience improved.
Analysis of FY 2016 Performance Report Analysis of Postal Service Performance and FY 2017 Performance Plan
- 48 -
The Commission recommends that the Postal Service clarify its eCC methodology and explain how the eCC performance indicator reflects changes in customer experience. The Postal Service should also explain how including the eCC result in the FY 2017 CI Composite Score more accurately captures overall customer experience.
d. Survey Response Rates and Estimating Customer Satisfaction
To improve the POS performance indicator result in FY 2017, the Postal Service states it will “[i]ncreas[e] the response rate to include a wider range of national perception across the retail network[.]” March 7, 2017 Response to CHIR No. 15, question 6.a. As part of this effort, the Postal Service reviewed POS survey response rates and identified ZIP Codes with minimal response rates. March 15, 2017 Response to CHIR No. 27, question 2.d. The Postal Service states that personnel followed up with sites in those ZIP Codes “to ensure that clerks were circling the receipt and inviting customers to go online and take the POS Survey.” Id. As a result, the Postal Service experienced a decline in the number of sites with zero POS survey responses. Id. The Commission recommends that the Postal Service adopt a similar approach for improving Delivery survey response rates. Although the Postal Service initiated a similar number of Delivery surveys in FY 2013 and FY 2016, the response rate declined significantly during this time period.63 In FY 2013, the Postal Service received more than 300,000 completed Delivery (Residential) surveys and almost 300,000 completed Delivery (Small/Medium Business) surveys.64 By contrast, in FY 2016, the Postal Service received only 35,675 completed Delivery (Residential) surveys and 35,484 completed Delivery (Small/Medium Business) surveys. FY 2016 Annual Report at 18. Delivery survey response rates declined significantly because the Postal Service changed the way it administers the survey. The Postal Service stated that in FY 2014, “[t]he survey methodology changed from a paper-based survey return system to a technology-based survey return system.” Docket No. ACR2014, March 13, 2015 Response to CHIR No. 13, question 29.a. It asserted further that “[h]istorically, a paper-based survey return system has received a greater response rate.” Id. The Postal Service states that for the Delivery survey, it has “conducted pilots using alternate media methods to identify opportunities to increase the number of responses beyond the minimum amount required.” March 15, 2017 Response to CHIR No. 27, question 2.a. The Commission recommends that the Postal Service report the results of these pilot tests and its assessment of whether alternative media methods will increase the Delivery survey response rates.
63 In FY 2013, the Postal Service initiated 2,215,626 Delivery (Residential) surveys and 4,074,717 Delivery (Small/Medium Business) surveys. See Docket No. ACR2013, Library Reference USPS-FY13-38, December 27, 2013, file “USPS-FY13-38.Preface.pdf,” table under section I.C. In FY 2016, the Postal Service initiated 2,149,867 Delivery (Residential) surveys and 3,598,945 Delivery (Small/Medium Business) surveys. See Library Reference USPS-FY16-38, file “USPS-FY16-38.Preface.pdf,” table under section I.C.
64 See Library Reference USPS-FY13-38, file “USPS-FY13-38.Preface.pdf,” table under section I.C.
Analysis of FY 2016 Performance Report Analysis of Postal Service Performance and FY 2017 Performance Plan
- 49 -
Obtaining sufficient Delivery survey responses enables the Postal Service to estimate with a certain degree of confidence how close the true population proportion is likely to be to the sample proportion of “Very Satisfied” or “Mostly Satisfied” customers under the existing methodology. The Postal Service states that for the Delivery (Residential) and Delivery (Small/Medium Business) customer surveys, “Residential [customers] and Small/Medium businesses are sampled sufficiently to ensure, at the [d]istrict level, a minimum precision level of +/- 5 percentage points, at the 90 percent level of confidence per postal quarter.”65 In a CHIR response, the Postal Service clarifies that this confidence level applies to Delivery (Residential) and Delivery (Small/Medium Business) surveys as a whole. March 15, 2017 Response to CHIR No. 27, questions 1.a and 1.b. The Postal Service states that its annual goal is to attain a statistically valid number of responses by receiving a minimum of 270 completed Delivery surveys in each district by the end of the fiscal year. Id. This minimum number is the aggregate number of completed Delivery (Residential) and Delivery (Small/Medium Business) surveys combined. Id. question 1.c.i. At the district level, the Postal Service states that it has set an internal goal of receiving a minimum of 270 completed Delivery surveys per district during each quarter. Id. questions 1.a and 1.b. Despite the much smaller number of Delivery surveys responses received in FY 2016, the Postal Service asserts that “[t]he Delivery survey is maintaining the level of responses required to meet the level of statistical validity at the annual level….” March 15, 2017 Response to CHIR No. 27, question 2.a. However, it is unclear whether the Postal Service received enough survey responses to meet its internal district-level quarterly goal in FY 2016. See id. questions 1.a and 1.b. Given that the districts use the Delivery survey results as part of the CI Composite Score, the Postal Service should ensure that it has the necessary number of district-level Delivery survey responses to accurately reflect actual customer satisfaction with the stated degree of confidence. The Commission recommends that the Postal Service take steps to meet its internal goal to ensure the Delivery survey results are statistically valid and accurate reflections of customer experience at the district level. In FY 2017, the Postal Service plans to improve customer satisfaction with mail delivery by doing an in-depth root cause analysis of misdelivery and change-of-address complaints. March 7, 2017 Response to CHIR No. 15, question 6.b. The Commission recommends that the Postal Service monitor delivery-related complaints in areas or districts with infrequent or a small number of Delivery survey responses. The Commission also suggests that the FY 2017 Report describe whether its root cause analysis of misdelivery and change-of-address complaints improved the FY 2017 Delivery result.
65 FY 2016 ACR at 72; March 15, 2017 Response to CHIR No. 27, question 1.a.
Analysis of FY 2016 Performance Report Analysis of Postal Service Performance and FY 2017 Performance Plan
- 50 -
C. Ensure a Safe Workplace and Engaged Workforce
1. Background The Postal Service relies on several performance indicators to evaluate progress toward its performance goal to Ensure a Safe Workplace and Engaged Workforce. The OSHA Illness and Injury (I&I) Rate is used to measure progress toward ensuring a safe workplace. To measure the effects of the Postal Service’s efforts to improve employee engagement, the Postal Service uses three performance indicators related to the Postal Pulse survey. OSHA I&I Rate. OSHA requires employers, including the Postal Service, to record information about work-related illnesses, injuries, and deaths. This information is used to calculate the OSHA I&I Rate, a formula recommended by OSHA to track workplace illness and injuries. The OSHA I&I Rate formula is:
Total number of recordable illnesses and injuries66 X 200,000 hours
_________________________________________________________________________________________________________________________________
Number of hours worked by all employees67
February 24, 2017 Response to CHIR No. 14, question 8. The OSHA I&I Rate is the performance indicator the Postal Service used in FY 2016 to measure progress toward achieving its goal of ensuring a safe workplace. The FY 2016 Plan set a target of 6.05 for actual performance for this indicator. See FY 2015 Annual Report at 14. The FY 2016 result for actual performance was 6.25, which failed to meet the target. FY 2016 Annual Report at 15. In FY 2017, the Postal Service will replace the OSHA I&I Rate with the Total Accidents Rate, a new performance indicator that will measure the total number of all accidents per exposure hour. FY 2016 Annual Report at 15 n.9, 20. The OSHA I&I Rate is subsumed within the Total Accidents Rate because the Total Accidents Rate includes both recordable accidents, as required by OSHA, as well as less severe, non-recordable accidents. The two
66 FY 2016 Annual Report at 15 n.8. “Recordable” illnesses and injuries are accidents that result in medical treatment (beyond first aid), days away from work, restrictions or transfer to another job, death, or loss of consciousness. February 17, 2017 Response to CHIR No. 15, question 5.a. Not all injuries are “recordable” for purposes of OSHA—the agency has promulgated specific regulations governing which injuries meet this criteria. See generally 29 C.F.R. part 1904 et seq.
67 See 29 C.F.R. § 1960.2(j) (For purposes of OSHA, “[t]he term incidence rates means the number of injuries and illnesses, or lost workdays, per 100 full-time workers. Rates are calculated as N X 200,000 ÷ EH[,] [where] N = number of injuries and illnesses, or number of lost workdays[;] EH = total hours worked by all employees during a month[,] a quarter, or fiscal year[;] and 200,000 [represents the] base for 100 full-time equivalent workers (working 40 hours per week, 50 weeks per year).”).

Analysis of FY 2016 Performance Report Analysis of Postal Service Performance and FY 2017 Performance Plan
- 51 -
performance indicators both use the same formula shown above for calculating the work-related I&I Rate. The FY 2017 Plan sets a FY 2017 Total Accidents Rate target of 15.0. FY 2016 Annual Report at 15. In the FY 2017 Plan, the Postal Service states it will improve workplace safety by focusing more on prevention strategies and taking a more proactive approach toward employee safety. Id. at 20. According to the Postal Service, its focus will be on the total number of accidents, regardless of severity, and it plans to reduce both recordable and non-recordable accidents. Id.; Response to CHIR No. 7, question 1.b. Postal Pulse survey. The Postal Service measures employee engagement through the Postal Pulse survey.68 The Postal Service administered the Postal Pulse survey to 600,000 career and non-career employees during the second quarter of FY 2016. FY 2016 Annual Report at 21. Figure III-2 contains a copy of the Postal Pulse survey.
68 FY 2016 Annual Report at 21. The Postal Pulse survey is also referred to as the “Gallup Q12” survey. See “Gallup Q12 and Employee Engagement FAQs: Frequently Asked Questions About Employee Engagement and the Engagement Survey” (available at: https://liteblue.usps.gov/emp-engagement/pdf/Employee-Engagement-FAQs.pdf).
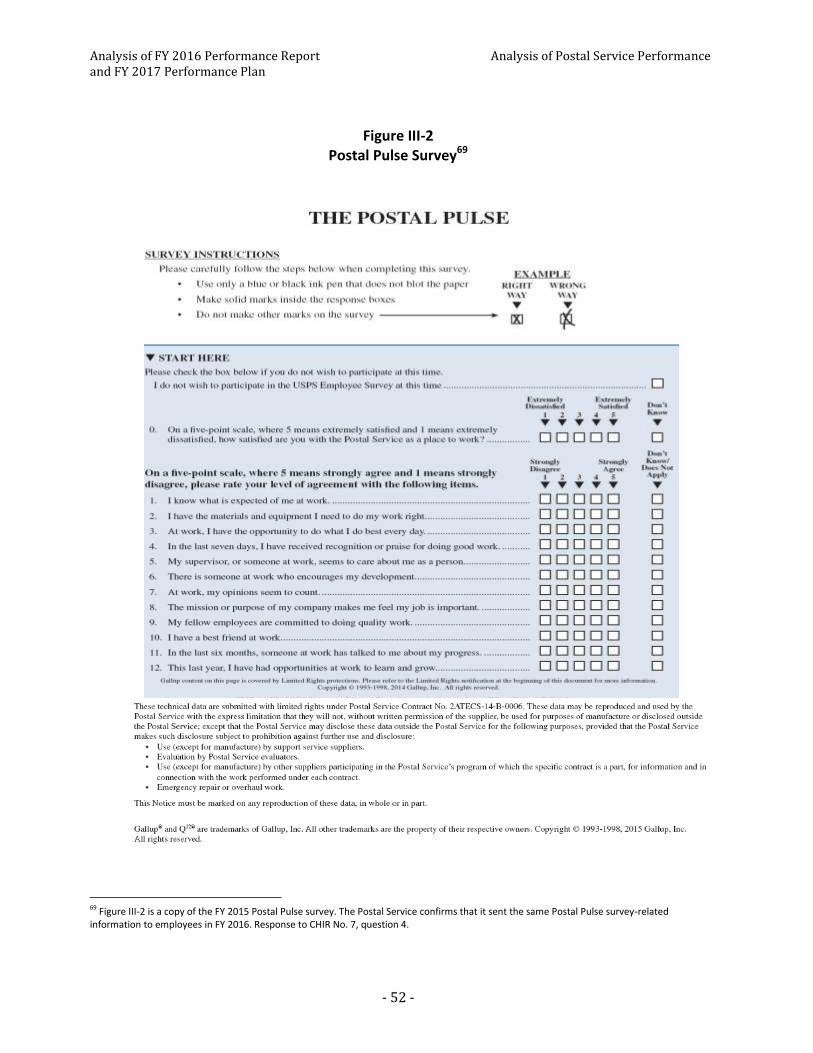
Analysis of FY 2016 Performance Report Analysis of Postal Service Performance and FY 2017 Performance Plan
- 52 -
Figure III-2 Postal Pulse Survey69
69 Figure III-2 is a copy of the FY 2015 Postal Pulse survey. The Postal Service confirms that it sent the same Postal Pulse survey-related information to employees in FY 2016. Response to CHIR No. 7, question 4.
Analysis of FY 2016 Performance Report Analysis of Postal Service Performance and FY 2017 Performance Plan
- 53 -
As shown in Figure III-2, the Postal Pulse survey asks participants to rate their level of agreement with 13 statements concerning the workplace on a scale of 1 to 5, with higher numbers reflecting either a greater level of employee satisfaction or stronger agreement with a survey statement. In FY 2016, the Postal Service used three performance indicators related to the Postal Pulse survey to measure progress toward improving employee engagement: the grand mean engagement score, the survey response rate, and the number of business units participating in action planning. Grand mean engagement score. The mean score is the average score for each question on the Postal Pulse survey. The grand mean engagement score is the average of the mean scores for questions 1 through 12. The Postal Service states that it will use the Postal Pulse survey grand mean engagement score to measure employee engagement during FY 2017. Response to CHIR No. 7, question 3.b. However, the Postal Service does not set a specific numeric target for the Postal Pulse survey grand mean engagement score. Id. question 3.b.i.; Docket No. ACR2015 Response to CHIR No. 3, question 5.b. To improve employee engagement in FY 2017, the Postal Service states it will continue to provide targeted training to executives, managers, and supervisors and will work with other groups within the Postal Service to increase awareness of the importance of employee engagement. FY 2016 Annual Report at 21. It notes that it will create action plans and goals for improved employee engagement and align efforts of supervisors, managers, and executives to meet these objectives. Id. at 22. Survey response rate. The survey response rate identifies the percentage of employees who complete and return the Postal Pulse survey.70 The Postal Service set the FY 2016 target for the Postal Pulse survey response rate at 51 percent. Docket No. ACR2015 Response to CHIR No. 3, question 5.b. In FY 2016, the survey response rate was 32 percent, and as a result, the Postal Service failed to meet its target for the survey response rate. See FY 2016 Annual Report at 21. The FY 2017 target for the Postal Pulse survey response rate is 51 percent. Response to CHIR No. 7, question 3.b.ii. In a CHIR response, the Postal Service explains that the survey response rate decreased in FY 2016 due to a “modality change” in that surveys were mailed to some employees at their homes, something which had not been done in 17 years. Id. question 3.a.ii. The Postal Service asserts that since returning to an onsite, on-the-clock implementation of the Postal Pulse survey, the survey response rate for FY 2017, Quarter 1 increased to 49 percent, which the Postal Service states compares favorably to response rates for FYs 2013, 2014, and 2015. Id.
70 FY 2016 Annual Report at 21; see Docket No. ACR2015, Responses of the United States Postal Service to Questions 1-6 of Chairman’s Information Request No. 17, March 3, 2016, question 6 (Docket No. ACR2015, March 3, 2016 Response to CHIR No. 17).

Analysis of FY 2016 Performance Report Analysis of Postal Service Performance and FY 2017 Performance Plan
- 54 -
Number of business units participating in action planning. The number of business units participating in action planning refers to the number of business units entering into improvement plans responsive to prior employee engagement evaluations. See FY 2016 Annual Report at 21. The Postal Service set the FY 2016 target for the number of business units participating in action planning at 18,000. Docket No. ACR2015 Response to CHIR No. 18, question 1.c. In FY 2016, more than 18,000 business units participated in action planning. See FY 2016 Annual Report at 21. Thus, the Postal Service exceeded its target for the number of business units participating in action planning. The FY 2017 target for the number of organizational units entering into action plans is 18,000. February 16, 2017 Response to CHIR No. 14, question 3.c.
2. Comments OSHA I&I Rate. The Public Representative comments that the FY 2016 OSHA I&I Rate not only failed to meet the FY 2016 OSHA I&I target, but also constituted an increase over the FY 2015 OSHA I&I Rate. PR Comments at 7. The Public Representative also notes that frequent changes to the metrics used to evaluate workplace safety impede the Postal Service’s ability to analyze trends. Id. The Postal Service disputes the Public Representative’s assertion that the FY 2016 OSHA I&I Rate constituted an increase over the FY 2015 rate. Postal Service Reply Comments at 9. The Postal Service maintains that the FY 2016 OSHA I&I Rate was 6 percent lower than the FY 2015 rate. Id. The Postal Service attributes its failure to achieve its FY 2016 OSHA I&I Rate target to an increase in exposure hours compared to FY 2015. Id. Postal Pulse survey. The Public Representative encourages the Postal Service to set targets for the Postal Pulse survey grand mean engagement score performance indicator. PR Comments at 7. According to the Public Representative, “[a]fter having some time series data, [the Postal Service] should be able to set reasonable targets to measure the effectiveness of the Postal Service’s actions….” Id. In addition, the Public Representative commends the Postal Service for its initiatives aimed at improving employee diversity. Id. at 12. She suggests that the Postal Service use the Postal Pulse survey to determine whether there are differences in employee engagement among different ethnic and gender groups. Id. at 15. The Public Representative recommends that the Postal Service utilize metrics, including demographic information, which the Public Representatives suggests could be obtained from the Postal Pulse survey, in order to more accurately analyze the effectiveness of such initiatives. Id. at 12-16. The Postal Service responds that “while it has set goals for a minimum response rate and number of organization units entering executable action plans, it does not believe score targets are desirable.” Postal Service Reply Comments at 9-10. It asserts that it appreciates the Public Representative’s comments regarding the Postal Service’s commitment to diversity and the “ripple effects” that commitment has on other employers around the
Analysis of FY 2016 Performance Report Analysis of Postal Service Performance and FY 2017 Performance Plan
- 55 -
country. Id. at 11. It states that it will take the Public Representative’s recommendations with regard to obtaining demographic information into consideration. Id.
3. Commission Analysis The Postal Service uses four performance indicators to evaluate its achievement of the Ensure a Safe Workplace and Engaged Workforce performance goal. These performance indicators are the OSHA I&I Rate and three performance indicators related to the Postal Pulse survey. The Postal Service did not meet the FY 2016 OSHA I&I Rate target. With regard to the three performance indicators related to the Postal Pulse survey, the Postal Service failed to set a FY 2016 target for the grand mean engagement score and did not meet the FY 2016 target for the survey response rate. However, the Postal Service exceeded the FY 2016 target for the number of business units participating in action planning. Consequently, the Commission finds that the Postal Service partially met the Ensure a Safe Workplace and Engaged Workforce performance goal in FY 2016. In this section, the Commission examines the OSHA I&I Rate and the Postal Pulse survey performance indicators to evaluate FY 2016 performance and recommends actions for improving measurement and performance in future years.
a. OSHA Illness & Injury Rate
The Postal Service asserts that the OSHA I&I Rate is a “dual metric” that included FY 2016 targets for both actual performance (6.05) and rate of improvement (3-percent reduction from FY 2015). February 15, 2017 Response to CHIR No. 14, question 6. It notes that the FY 2016 OSHA I&I Rate of 6.25 reflected a 6-percent improvement over FY 2015 and exceeded the FY 2016 target for rate of improvement (3 percent). Id. The Postal Service maintains that despite failing to achieve its FY 2016 target for actual performance, “[t]he combination of an improved [OSHA I&I] rate and a reduction of recordable accidents allowed the Postal Service to finish the year at the target.” Id. The Commission previously stated that it considers the Postal Service to have met a performance goal if results of each performance indicator for that goal meet or exceed targets established in the applicable performance plan. FY 2015 Analysis at 6. The FY 2016 Plan set a FY 2016 OSHA I&I Rate target for actual performance but did not set FY 2016 targets for rate of improvement or reduction in recordable accidents. The Commission cannot evaluate the Postal Service’s performance based on performance indicators that are not included in the applicable performance plan. In the sections below, the Commission compares the OSHA I&I Rate and new Total Accidents Rate performance indicators. It also discusses comparability, newer employees, and motor vehicle accidents.
Analysis of FY 2016 Performance Report Analysis of Postal Service Performance and FY 2017 Performance Plan
- 56 -
(1) OSHA I&I Rate versus Total Accidents Rate
In FY 2017, the Postal Service states that it will replace the OSHA I&I Rate with the Total Accidents Rate performance indicator. FY 2016 Annual Report at 15 n.9. The Postal Service reported OSHA I&I Rate results effective as of the end of each fiscal year in its annual performance report. February 17, 2017 Response to CHIR No. 15, questions 5.b-5.d. A recurring issue with the OSHA I&I Rate has been that subsequent annual performance reports sometimes revise results from past fiscal years to reflect new claims or changes in the status of existing claims. These revisions lead to inconsistencies in reported OSHA I&I Rate results among annual performance reports.71 The new Total Accidents Rate performance indicator will calculate the total number of all accidents per exposure hour compared to the previous year. FY 2016 Annual Report at 15 n.9, 20. The Total Accidents Rate will include both recordable accidents, which are currently tracked under the OSHA I&I Rate, and non-recordable accidents. Response to CHIR No. 7, question 1.b. The Total Accidents Rate result will be calculated by taking the total number of recordable and non-recordable accidents multiplied by 200,000 and then divided by the number of exposure hours. February 24, 2017 Response to CHIR No. 14, question 9. The Total Accidents Rate will include accidents that result in only property damage, as well as all motor vehicle accidents.72 The Postal Service asserts that the Total Accidents Rate will be a more stable metric than the OSHA I&I Rate. February 15, 2017 Response to CHIR No. 14, question 7.b. It acknowledges that similar to the OSHA I&I Rate, the end-of-year numbers for the Total Accidents Rate may fluctuate due to accidents being added after the final data are compiled at the end of the fiscal year. Id. However, it contends that Total Accidents Rate results will not fluctuate as much as OSHA I&I Rate results. Id. The Postal Service explains that the Total Accidents Rate will measure every accident regardless of recordability. Id. Thus, new cases involving accidents that occurred in a prior fiscal year may be added to that fiscal year’s end-of-year numbers, but the status of an individual case already counted as an accident will not change. Id. Although the Commission supports the Postal Service’s exploration of improved performance indicators, the Total Accidents Rate may not be a better performance indicator than the OSHA I&I Rate for measuring workplace safety improvements for several reasons. First, based on the information provided by the Postal Service, it is unclear whether the Total Accidents Rate will be more stable than the OSHA I&I Rate.
71 Compare FY 2015 Annual Report at 14 with FY 2016 Annual Report at 16; see FY 2015 Analysis at 46.
72 March 15, 2017 Response to CHIR No. 27, questions 4.a and 4.b. Specifically, the Total Accidents Rate includes: accidents that resulted in damage of $500 or more to Postal Service property regardless of whether an injury was involved; motor vehicle accidents that result in death, injury, or only property damage, regardless of cost, who was injured (if anyone), or what property was damaged; and injury, illness, or death of a Postal Service employee on Postal Service premises or on the job. Id. The Total Accidents Rate excludes other accidents which do not involve Postal Service employees; damage of $500 or more to customer property without injury, unless such damage involves a motor vehicle accident; and fire damage of $100 or more without injury, unless such damage involves a motor vehicle accident. Id.
Analysis of FY 2016 Performance Report Analysis of Postal Service Performance and FY 2017 Performance Plan
- 57 -
Second, because it includes both injuries which are less severe and accidents that only result in property damage, it does not appear that the Total Accidents Rate will be as effective as the OSHA I&I Rate for tracking and reducing serious injuries, illnesses, and deaths. Third, unlike the Total Accidents Rate, the OSHA I&I Rate is a widely accepted, standard workplace safety measure used nationally and globally for comparison both across and within firms and industries.73 Fourth, replacing the OSHA I&I Rate with the Total Accidents Rate may impact the Postal Service’s ability to provide comparable results for past fiscal years. See Chapter 3, section C.3.a.2, infra. For these reasons, the Commission recommends that the Postal Service retain the OSHA I&I Rate performance indicator. The Commission recognizes that revisions to the OSHA I&I Rate are necessary to ensure accuracy. It recommends that future annual performance reports include OSHA I&I Rate results both as of the end of the fiscal year and revised to reflect new claims or changes in the status of existing claims.74 The Commission previously recommended that the Postal Service consider adding another workplace safety performance indicator for which results are complete and not revised after the end of the fiscal year.75 The Commission reiterates that recommendation because using a performance indicator that is based on complete data at the end of the fiscal year and does not change substantially would allow the Postal Service to better assess and report its safety and training programs and analyze whether changes to existing programs are needed.
(2) Comparable 3-Year Results
As discussed in Chapter 2, replacing the OSHA I&I Rate with the Total Accidents Rate may affect the Postal Service’s ability to comply with 39 U.S.C. § 2804(c), which requires the Postal Service to provide comparable “actual results for the three preceding fiscal years.” 39 U.S.C. § 2804(c); see Chapter 2, section C.3, supra. In a CHIR response, the Postal Service states that due to its financial situation, the FY 2017 Report will neither provide comparable Total Accidents Rate results for FYs 2014, 2015, and 2016, nor explain how to compare results between the OSHA I&I Rate and the Total Accidents Rate. Response to CHIR No. 7, questions 2.b.i and 2.b.ii. The Postal Service acknowledges that not providing comparable results affects the ability to compare safety-related results from prior years. Id. question 2.b.ii. The Commission recognizes that the results of the OSHA I&I Rate and Total Accidents Rate cannot be directly compared. However, the FY 2017 Report can comply with 39 U.S.C. § 2804(c) by providing FY 2017 results for both the OSHA I&I Rate and Total Accidents
73 See United States Department of Labor, Bureau of Labor Statistics, How to Compute a Firm’s Incidence Rate for Safety Management (available at: https://www.bls.gov/iif/osheval.htm).
74 See page 3, Table I-1, supra.
75 For example, the Commission had noted that because very severe injuries must be reported to OSHA within 24 hours, the recordability status would be known and the total number would conceivably be complete or nearly complete at the end of the fiscal year. See FY 2015 Analysis at 50.
Analysis of FY 2016 Performance Report Analysis of Postal Service Performance and FY 2017 Performance Plan
- 58 -
Rate performance indicators. The Commission appreciates the Postal Service’s financial situation and limited resources. However, it appears that the Postal Service can calculate the FY 2017 OSHA I&I Rate result without expending significant resources. The Postal Service states that OSHA requires it to maintain current and updated records for recordable accidents for a period of five years. February 17, 2017 Response to CHIR No. 15, question 5.a. This is consistent with the Postal Service’s Employee and Labor Relations Manual, which describes the process for reporting accidents to comply with OSHA requirements.76 For each recordable accident reported, employees are required to complete certain forms that the Postal Service must retain for five years after the end of the calendar year. ELM 41 § 821.144. Thus, it appears that the Postal Service can calculate the FY 2017 OSHA I&I Rate result using information the Postal Service is already required by OSHA to report and retain. For the FY 2017 Report to comply with 39 U.S.C. § 2804(c), the Postal Service must provide comparable results for, at a minimum, FYs 2014, 2015, 2016, and 2017. The Commission recommends that the Postal Service include FY 2017 results for both the OSHA I&I Rate and Total Accidents Rate. If the Postal Service decides to use solely the Total Accidents Rate performance indicator in FY 2017, it must ensure that the FY 2017 Report complies with 39 U.S.C. § 2804(c). If the FY 2017 Report does not include the FY 2017 OSHA I&I Rate result, the Commission recommends that the FY 2017 Report explain why it is not feasible to calculate the FY 2017 OSHA I&I Rate result using accident-related information the Postal Service is required by OSHA to report and retain.
(3) Newer Employees
The Postal Service explains that the reason it failed to meet the FY 2016 OSHA I&I Rate target for actual performance was due to a higher-than-expected number of accidents per exposure hour involving newer employees. February 15, 2017 Response to CHIR No. 14, question 6.b. Specifically, the Postal Service notes that the OSHA I&I Rate calculation takes into account both the total number of recordable accidents and the total number of exposure hours. Id. It states that during FY 2016, it experienced an overall reduction in total recordable accidents, but an increase in both exposure hours and accidents involving newer employees, who have a higher accident rate per exposure hour than more experienced employees. Id. The number of newer employees (those with fewer than two years of on-the-job experience) increased between FY 2015 and FY 2016. Id. question 4. The increase in newer employees appears to have contributed to the increase in the number of accidents.
76 United States Postal Service, ELM 41 - Employee and Labor Relations Manual (September 2016) § 821.123 (available at: http://about.usps.com/manuals/elm/html/elmc8_010.htm) (ELM 41).
Analysis of FY 2016 Performance Report Analysis of Postal Service Performance and FY 2017 Performance Plan
- 59 -
For example, the Postal Service notes that Sunday delivery is performed by City Carrier Assistants and Rural Carrier Assistants, who are generally the Postal Service’s newer employees. March 1, 2017 Response to CHIR No. 19, question 11.c. The Postal Service reports that the number of accidents occurring on Sundays increased from 3,405 in FY 2015 to 4,308 in FY 2016. Id. question 11.b. The Postal Service states that in FY 2017, it will place additional emphasis on employees considered to be at higher risk for accidents. FY 2016 Annual Report at 20. The Postal Service explains that it has developed roadmaps to focus on preventing motor vehicle accidents through improved driver training and increased supervisory observations. Response to CHIR No. 7, question 1.b. It states that it will redesign the Safe Driver Training Program in FY 2017 to reinstate the testing portion of the program in order to increase both the number of classroom hours and on-the-road experience. March 1, 2017 Response to CHIR No. 19, question 8. It notes that the program will also include virtual reality portions to help new drivers learn skills before using them on the road with other drivers. Id. question 8.b. The Commission finds that these initiatives address areas of needed improvement and recommends that the Postal Service report the results of these initiatives in the FY 2017 Report.
(4) Motor Vehicle Accidents
The number of motor vehicle accidents increased from 26,936 in FY 2015 to 28,937 in FY 2016.77 The Postal Service asserts that the greatest increase in motor vehicle accidents involving recordable (more severe) injuries was due to third parties striking Postal Service vehicles, either while parked or while delivering mail. March 1, 2017 Response to CHIR No. 19, question 7.c. There also was a sharp increase in stationary vehicles being struck from behind or being struck by another vehicle attempting to pass. Id. The Postal Service states that to reduce these types of motor vehicle accidents in FY 2016, it installed mirror stations in which carriers can adjust their vehicle mirrors before leaving for their route so that carriers can become more aware of their surroundings and better see other drivers approaching. Id. The Postal Service notes that many facilities have a “hot spot” board that warns carriers about road hazards, blind spots, and other situations that might increase the risk of motor vehicle accidents. Id. The Commission finds that adjustable mirror stations installed by the Postal Service could increase driver visibility and prevent motor vehicle accidents. However, because the number of motor vehicle accidents increased between FY 2015 and FY 2016, it is unclear how adjusting vehicle mirrors affected the number of motor vehicle accidents in FY 2016. Also, in FY 2015 the Postal Service identified a relatively large number of accidents caused by distracted driving. See FY 2015 Analysis at 51. It is unclear what steps, if any, the Postal Service has taken to prevent these types of accidents.
77 March 1, 2017 Response to CHIR No. 19, questions 7.a and 7.b; see March 15, 2017 Response to CHIR No. 27, question 3.c.
Analysis of FY 2016 Performance Report Analysis of Postal Service Performance and FY 2017 Performance Plan
- 60 -
A separate motor vehicle accident performance indicator could help better monitor and measure the outcome of the Postal Service’s plans to reduce the number of motor vehicle accidents. Because the motor vehicle accidents are subsumed in the Total Accidents Rate, and not completely captured in the OSHA I&I Rate, the Commission recommends adding a new performance indicator that tracks the number of motor vehicle accidents or the motor vehicle accident rate.
b. Postal Pulse Survey
(1) Performance Indicators
In FY 2016, the Postal Service used three performance indicators related to the Postal Pulse survey to measure progress toward improving employee engagement: the grand mean engagement score, the survey response rate, and the number of business units participating in action planning. Grand mean engagement score. This performance indicator is the average of the mean scores for questions 1 through 12 on the Postal Pulse survey. Table III-11 depicts results for the FY 2016 and FY 2015 grand mean engagement scores, as well as the mean scores for each question.
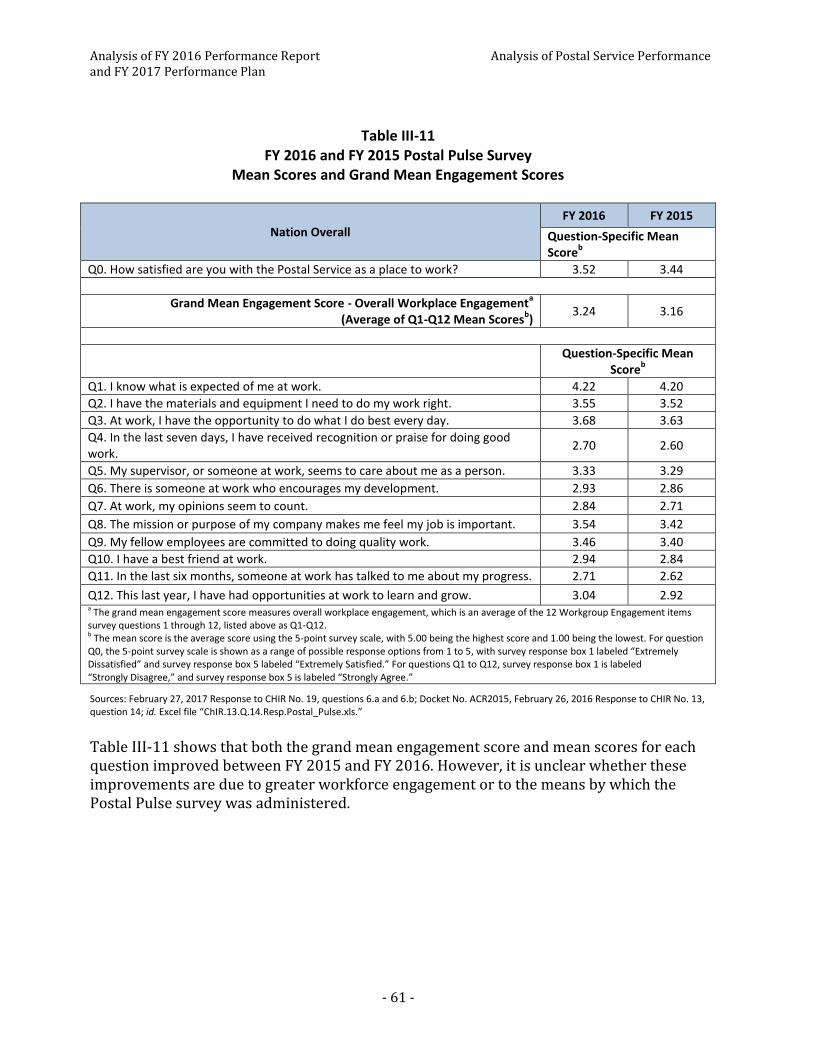
Analysis of FY 2016 Performance Report Analysis of Postal Service Performance and FY 2017 Performance Plan
- 61 -
Table III-11 FY 2016 and FY 2015 Postal Pulse Survey
Mean Scores and Grand Mean Engagement Scores
Nation Overall FY 2016 FY 2015
Question-Specific Mean Score
b
Q0. How satisfied are you with the Postal Service as a place to work? 3.52 3.44
Grand Mean Engagement Score - Overall Workplace Engagementa
(Average of Q1-Q12 Mean Scoresb)
3.24 3.16
Question-Specific Mean
Scoreb
Q1. I know what is expected of me at work. 4.22 4.20
Q2. I have the materials and equipment I need to do my work right. 3.55 3.52
Q3. At work, I have the opportunity to do what I do best every day. 3.68 3.63
Q4. In the last seven days, I have received recognition or praise for doing good work.
2.70 2.60
Q5. My supervisor, or someone at work, seems to care about me as a person. 3.33 3.29
Q6. There is someone at work who encourages my development. 2.93 2.86
Q7. At work, my opinions seem to count. 2.84 2.71
Q8. The mission or purpose of my company makes me feel my job is important. 3.54 3.42
Q9. My fellow employees are committed to doing quality work. 3.46 3.40
Q10. I have a best friend at work. 2.94 2.84
Q11. In the last six months, someone at work has talked to me about my progress. 2.71 2.62
Q12. This last year, I have had opportunities at work to learn and grow. 3.04 2.92 a The grand mean engagement score measures overall workplace engagement, which is an average of the 12 Workgroup Engagement items survey questions 1 through 12, listed above as Q1-Q12. b The mean score is the average score using the 5-point survey scale, with 5.00 being the highest score and 1.00 being the lowest. For question Q0, the 5-point survey scale is shown as a range of possible response options from 1 to 5, with survey response box 1 labeled “Extremely Dissatisfied” and survey response box 5 labeled “Extremely Satisfied.” For questions Q1 to Q12, survey response box 1 is labeled “Strongly Disagree,” and survey response box 5 is labeled “Strongly Agree.”
Sources: February 27, 2017 Response to CHIR No. 19, questions 6.a and 6.b; Docket No. ACR2015, February 26, 2016 Response to CHIR No. 13, question 14; id. Excel file “ChIR.13.Q.14.Resp.Postal_Pulse.xls.”
Table III-11 shows that both the grand mean engagement score and mean scores for each question improved between FY 2015 and FY 2016. However, it is unclear whether these improvements are due to greater workforce engagement or to the means by which the Postal Pulse survey was administered.
Analysis of FY 2016 Performance Report Analysis of Postal Service Performance and FY 2017 Performance Plan
- 62 -
In FY 2016, the Postal Service changed its method for administering the Postal Pulse survey: bargaining employees received paper surveys at their home address, while non-bargaining employees continued to receive their surveys via email.78 The Postal Service acknowledges that this change caused the survey response rate to decline in FY 2016. Response to CHIR No. 7, question 3.a.ii. It appears that this change reduced response rates for bargaining employees specifically because they received the Postal Pulse survey by mail. See n.78, supra. Consequently, it is unclear if the grand mean engagement score and mean scores improved because more employees are engaged, or because FY 2016 survey results disproportionately reflect employee engagement of non-bargaining employees, who were not affected by the change in survey administration. The Commission recommends that the FY 2017 Report discuss these types of measurement issues and changes and provide information concerning how the interpretation of results may be impacted by such issues and changes in future annual performance reports. The Postal Service did not set measurable targets for the grand mean engagement score for either FY 2016 or FY 2017. Response to CHIR No. 7, question 3.b.i. The Postal Service asserts that it “do[es] not consider a target on the score to be desirable.” February 16, 2017 Response to CHIR No. 14, question 3.a. Instead, the Postal Service states it will focus on “accelerat[ing]...employee engagement training[] and increasing action planning effectiveness[] for postal managers.” Response to CHIR No. 7, question 3.b.i. It states that it believes that “more fully trained managers will create an improved work environment, leading to steady continuous improvement in the area of employee engagement.” Id. The Commission recommends that the Postal Service set measurable targets for the Postal Pulse survey grand mean engagement score. Setting measureable targets is important to evaluate whether the Postal Service’s related initiatives have been successful and whether changes to the initiatives are needed to further improve results. Survey response rate. This performance indicator identifies the percentage of employees who complete and return the Postal Pulse survey. The Postal Service reports that the Postal Pulse survey response rate result was 47 percent in FY 2015 and 32 percent in FY 2016.79 In a CHIR response, the Postal Service states that the number of employees answering at least one question on the Postal Pulse survey was 270,093 in FY 2015 and 178,753 in FY 2016. February 27, 2017 Response to CHIR No. 19, question 6.c. The Commission calculated the survey response rate results using these numbers and the total number of surveys administered in FY 2015 (595,000) and FY 2016 (600,000).80 These 78 See United States Postal Service, Postal Pulse, Survey deadline extended, (March 8, 2016) (available at: https://link.usps.com/2016/03/08/postal-pulse-2/). The Postal Service defines a bargaining unit employee as “[a] career or non[-]career employee who is represented by a labor organization (union) that negotiates with [the Postal Service] for wages, hours, and other terms and conditions of employment. Bargaining unit employees include city carriers, clerks, information technology employees (Information Technology/Accounting Service Center), machinists (tool-and-die), mail handlers, maintenance employees, motor vehicle operators, nurses, postal police officers, and rural carriers. Transitional employees are non[-]career bargaining unit employees.” See Publication 32, Postal Terms (available at: http://about.usps.com/publications/pub32/pub32_terms.htm).
79 FY 2015 Annual Report at 19; FY 2016 Annual Report at 21.
80 See FY 2015 Annual Report at 19; FY 2016 Annual Report at 21.

Analysis of FY 2016 Performance Report Analysis of Postal Service Performance and FY 2017 Performance Plan
- 63 -
calculations resulted in response rates 2 to 3 percentage points lower than those reported by the Postal Service. The Commission recommends that the FY 2017 Report explain the methodology for calculating the Postal Pulse survey response rate results. The Postal Service states that it will continue to use the Postal Pulse survey response rate as one of its FY 2017 performance indicators for employee engagement. Response to CHIR No. 7, question 3.b. The Commission notes that the Postal Pulse survey includes an opt-out box for employees who do not wish to participate in the Postal Pulse survey. See page 52, Figure III-2, supra. The Postal Service previously explained that survey response rate includes employees who checked the opt-out response box. Docket No. ACR2015, March 3, 2016 Response to CHIR No. 17, question 6. This limits the usefulness of the survey response rate as a measure of employee engagement. For example, if the FY 2017 response rate increases, it will not be clear if the increase is due to increased employee engagement, or an increase in the number of employees checking the opt-out response box. For this reason, the Commission finds that the Postal Pulse survey grand mean engagement score is better than the survey response rate as a performance indicator for measuring employee engagement. The Commission recommends that the Postal Service distinguish between employees who complete the survey and those who opt-out when calculating results for the survey response rate performance indicator. Number of business units participating in action planning. This performance indicator measures the number of business units entering into improvement plans responsive to prior engagement evaluations.81 The FY 2016 Report omits performance indicators related to the Postal Pulse survey in the table comparing targets and results for each performance goal. See FY 2016 Annual Report at 15. This omission hinders transparency because it is unclear which performance indicators the Postal Service used in FY 2016 to measure progress toward improving employee engagement. This omission is particularly problematic for the performance indicator measuring the number of business units participating in action planning. When reporting the FY 2016 result for this performance indicator, the Postal Service states that it “[d]eveloped more than 18,000 ‘State of the Team’ conversations and action plans to achieve engagement goals.” Id. at 21. It appears that “‘State of the Team’ conversations and action plans to achieve engagement goals” refers to the number of business units participating in action planning, but it is unclear because the terminology is not consistent.82
81 See FY 2016 Annual Report at 21; February 16, 2017 Response to CHIR No. 14, question 2.
82 In a CHIR response, the Postal Service states that in FY 2016, 18,329 units participated in action planning. February 16, 2017 Response to CHIR No. 14, question 2.
Analysis of FY 2016 Performance Report Analysis of Postal Service Performance and FY 2017 Performance Plan
- 64 -
This issue, and others like it,83 would have been less likely to occur if the FY 2016 Report had included performance indicators related to the Postal Pulse survey in the table comparing targets and results for each performance goal. The Commission recommends that the FY 2017 Report include a similar table comparing targets and results for each performance indicator, including those related to the Postal Pulse survey.
(2) Legal Compliance
As discussed in Chapter 2, the three performance indicators related to the Postal Pulse survey raised issues that could have affected compliance with 39 U.S.C. §§ 2803 and 2804. First, the FY 2017 Plan does not set forth FY 2017 targets for the performance indicators related to the Postal Pulse survey. Because the Postal Service provides these targets in a CHIR response, the Commission finds that the Postal Service has complied with 39 U.S.C. § 2803(a)(1). To comply with 39 U.S.C. § 2803(a)(1) next year, the FY 2018 Plan must set targets for each performance indicator used to evaluate performance during FY 2018, including the performance indicators related to the Postal Pulse survey. See Chapter 2, section C.1, supra. Second, the FY 2017 Plan does not set a measurable FY 2017 target for the Postal Pulse survey grand mean engagement score as required by 39 U.S.C. § 2803(a)(2). Because the Postal Service set related objective, quantifiable, and measurable FY 2017 targets for the two other performance indicators related to the Postal Pulse survey, the Commission finds that the Postal Service has complied with 39 U.S.C. § 2803(a)(2). To comply with 39 U.S.C. § 2803(a)(2) next year, the FY 2018 Plan must include at least one measurable FY 2018 target for the performance indicators related to the Postal Pulse survey. See Chapter 2, section C.1, supra. Third, the FY 2016 Report does not set forth FY 2016 targets for the Postal Pulse survey response rate and number of participating business units. Because the Postal Service provides the targets in a CHIR response, the Commission finds that the FY 2016 Report complies with 39 U.S.C. § 2804(b)(1). To comply with 39 U.S.C. § 2804(b)(1) next year, the FY 2017 Report must include all FY 2017 targets for the Postal Pulse survey performance indicators and compare them with FY 2017 results. See Chapter 2, section C.2.a, supra. Fourth, the FY 2016 Report must include comparable results for FYs 2013, 2014, 2015, and 2016.84 In FY 2015, the Postal Service changed the performance indicator for measuring employee engagement from the Voice of the Employee (VOE) survey to the Postal Pulse
83 The Postal Service has also reported inconsistent targets and results for the Postal Pulse survey response rate. The Postal Service provided different FY 2016 targets for the survey response rate in Docket No. ACR2015 (51 percent) and Docket No. ACR2016 (35 percent). Compare Docket No. ACR2015 Response to CHIR No. 3, question 5.b with Response to CHIR No. 7, question 3.a.ii. Similarly, the FY 2016 survey response rate result was different in the FY 2016 Report (32 percent) compared to a CHIR response (30 percent). Compare FY 2016 Annual Report at 21 with Response to CHIR No. 7, question 3.a.ii.
84 See 39 U.S.C. § 2804(c); FY 2014 Analysis at 12. The Commission previously found that “actual results” must also be comparable across all three preceding fiscal years to ensure meaningful evaluation of performance across these years. FY 2014 Analysis at 12; see FY 2015 Analysis at 17.
Analysis of FY 2016 Performance Report Analysis of Postal Service Performance and FY 2017 Performance Plan
- 65 -
survey. FY 2015 Analysis at 47. The Postal Service provides VOE survey score results for FYs 2013 and 2014, but lists “N/A” for FYs 2015 and 2016. FY 2016 Annual Report at 15. However, the Postal Service provides comparable results across FYs 2013, 2014, 2015, and 2016 for the survey response rate, which was also used as a performance indicator for measuring employee engagement during FY 2016. Response to CHIR No. 7, question 3.a.ii. For this reason, the Commission finds that the FY 2016 Report complies with 39 U.S.C. § 2804(c). To comply with 39 U.S.C. § 2804(c) in FY 2017, the FY 2017 Report must include comparable results for FYs 2014, 2015, 2016, and 2017 for at least one performance indicator related to the Postal Pulse survey. See Chapter 2, sections C.2.b and C.3, supra. The Postal Service asserts that the questions contained in the VOE and Postal Pulse surveys are too different to be comparable. Response to CHIR No. 7, question 3.a.i. However, in the FY 2015 Analysis, the Commission provided examples of how to compare results between the two surveys. FY 2015 Analysis at 55. It noted that Item 0 (Overall Satisfaction) on the Postal Pulse survey is similar to Item 32 on the VOE survey, which asks respondents to rate their level of agreement with the statement, “I would recommend the Postal Service as a place to work to family and friends.” Id. In FY 2010, 52 percent of respondents provided a favorable response (strongly agree or agree) to Item 32 on the VOE survey.85 The Commission recommends that the Postal Service consider comparing the results between questions from the Postal Pulse and VOE surveys to provide comparable satisfaction or employee engagement results for FY 2014.86
(3) Diversity
The Public Representative suggests that the Postal Service use the Postal Pulse survey to determine whether there are differences in employee engagement among different ethnic and gender groups. PR Comments at 15. She recommends adding demographic questions to the survey and disaggregating employee engagement scores by gender and ethnicity. Id. The Commission observes that the VOE survey contained several demographic questions that potentially could have been used to disaggregate employee engagement results by demographic category if the data were complete.87 These questions do not appear on the Postal Pulse survey.
The Public Representative’s suggestion to disaggregate employee engagement scores by gender and ethnicity raises the question as to whether the Postal Pulse survey can be used to measure specific results by employee categories, employee groups, or employee types. The Postal Service has discussed providing survey results by unit (office, district, area, and
85 Docket No. ACR2010, Responses of the United States Postal Service to Questions 1-22, 24-26 of Chairman’s Information Request No. 4, February 28, 2011, question 21.b.
86 Both the VOE and Postal Pulse surveys rate the elements on a scale of 1 (“Strongly Disagree”) to 5 (“Strongly Agree”). The VOE survey reported results as a percentage of favorable ratings (the percentage of respondents who rated 4s and 5s). See Docket No. ACR2015 Response to CHIR No. 3, question 5. The Postal Pulse survey could also report results in the same manner.
87 See Docket No. ACR2010, Library Reference USPS-FY10-44, February 28, 2011, file “ChIR.4.Q.21.VOE.Survey.pdf,” at 2.
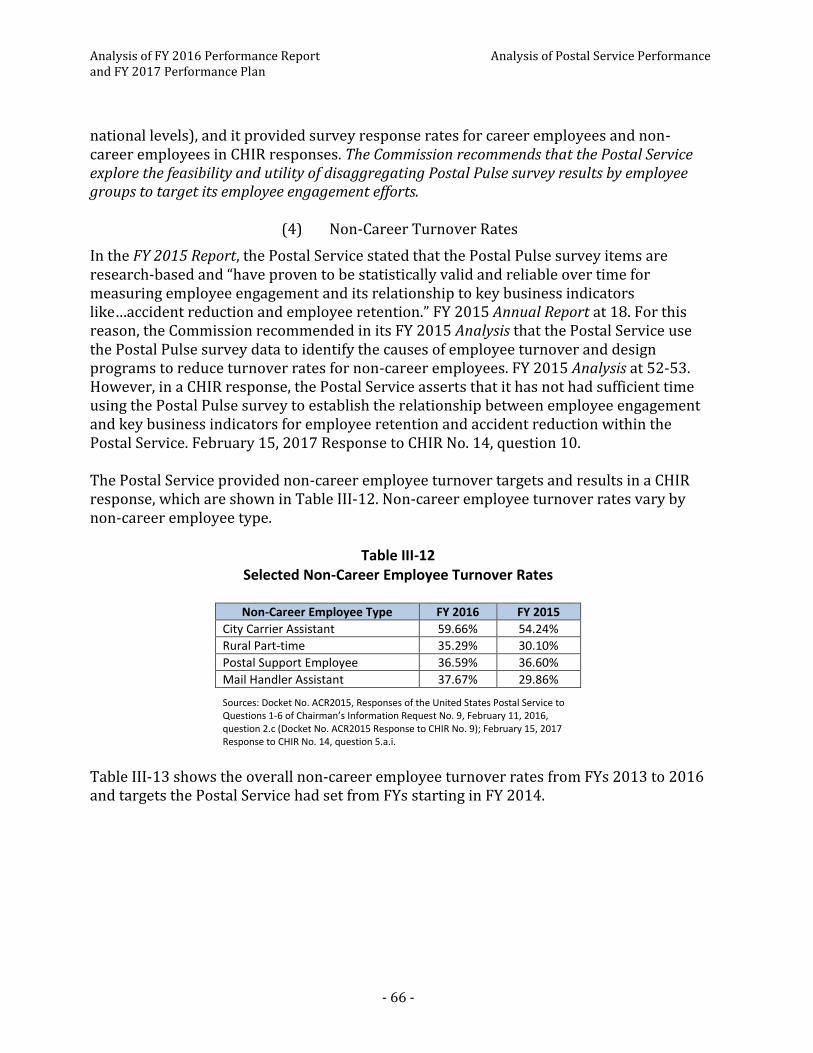
Analysis of FY 2016 Performance Report Analysis of Postal Service Performance and FY 2017 Performance Plan
- 66 -
national levels), and it provided survey response rates for career employees and non-career employees in CHIR responses. The Commission recommends that the Postal Service explore the feasibility and utility of disaggregating Postal Pulse survey results by employee groups to target its employee engagement efforts.
(4) Non-Career Turnover Rates
In the FY 2015 Report, the Postal Service stated that the Postal Pulse survey items are research-based and “have proven to be statistically valid and reliable over time for measuring employee engagement and its relationship to key business indicators like…accident reduction and employee retention.” FY 2015 Annual Report at 18. For this reason, the Commission recommended in its FY 2015 Analysis that the Postal Service use the Postal Pulse survey data to identify the causes of employee turnover and design programs to reduce turnover rates for non-career employees. FY 2015 Analysis at 52-53. However, in a CHIR response, the Postal Service asserts that it has not had sufficient time using the Postal Pulse survey to establish the relationship between employee engagement and key business indicators for employee retention and accident reduction within the Postal Service. February 15, 2017 Response to CHIR No. 14, question 10. The Postal Service provided non-career employee turnover targets and results in a CHIR response, which are shown in Table III-12. Non-career employee turnover rates vary by non-career employee type.
Table III-12 Selected Non-Career Employee Turnover Rates
Non-Career Employee Type FY 2016 FY 2015
City Carrier Assistant 59.66% 54.24%
Rural Part-time 35.29% 30.10%
Postal Support Employee 36.59% 36.60%
Mail Handler Assistant 37.67% 29.86%
Sources: Docket No. ACR2015, Responses of the United States Postal Service to Questions 1-6 of Chairman’s Information Request No. 9, February 11, 2016, question 2.c (Docket No. ACR2015 Response to CHIR No. 9); February 15, 2017 Response to CHIR No. 14, question 5.a.i.
Table III-13 shows the overall non-career employee turnover rates from FYs 2013 to 2016 and targets the Postal Service had set from FYs starting in FY 2014.

Analysis of FY 2016 Performance Report Analysis of Postal Service Performance and FY 2017 Performance Plan
- 67 -
Table III-13 Overall Non-Career Employee Turnover Rates and Targets
Overall Non-Career Employee FY 2017 FY 2016 FY 2015 FY 2014 FY 2013
Actual Turnover Rate TBD 42.82% 38.69% 45.00% 14.00%
Target 34.08% 34.80% 20.00% 14.00% n/a TBD-To be determined; n/a-No target
Sources: General Accounting Office, United States Postal Service, Status of Workforce Reductions and Related Planning Efforts, GAO-15-43 (November 13, 2014) at 29- FY 2013 Actual Turnover Rate and FY 2014 Target; Docket No. ACR2014, United States Postal Service Response to Question 6 of Chairman’s Information Request No. 14, March 26, 2015; Docket No. ACR2015 Response to CHIR No. 9, questions 2.a and 2.d; February 15, 2017 Response to CHIR No. 14, questions 5.a.i and 5.b.
The Postal Service previously stated that non-career employee turnover was an area for improvement. See February 15, 2017 Response to CHIR No. 14, question 5.b. Given the relatively large increase between FY 2015 and FY 2016, the Commission recommends that the Postal Service continue to target this issue and include the non-career employee turnover rates by employee type as well as the overall non-career turnover rate in its FY 2017 Report and FY 2018 Plan.
D. Sustain Controllable Income
1. Background In FY 2016, the Postal Service used two performance indicators to measure progress toward its Sustain Controllable Income goal: Deliveries per Total Work Hours (DPTWH) (as a percent improvement over the same period last year) (DPTWH % SPLY) and Controllable Income (Loss). DPTWH % SPLY. From FY 2011 to FY 2015, the Postal Service measured productivity improvements using the Deliveries per Work Hour (DPWH) performance indicator, which evaluated the Postal Service’s productivity improvement efforts by comparing the total number of deliveries of all types with the total number of work hours used in all employee categories.88 In FY 2016, the Postal Service replaced DPWH with DPTWH % SPLY, which measures the percent change in deliveries per total work hours from the current year over the prior year. March 17, 2017 Response to CHIR No. 19, question 5. The FY 2016 target for DPTWH % SPLY was an increase of 1.2 percent over the FY 2015 result.89 The FY 2016 actual result was an increase of 0.1 percent, and therefore was 1.1 percentage points lower than the FY 2016 target. FY 2016 Annual Report at 22. The Postal Service explains that it did not meet the FY 2016 DPTWH % SPLY target “due to a growth
88 See Docket No. ACR2011, Annual Compliance Determination, March 28, 2012, at 46; FY 2015 Analysis at 4, 57.
89 FY 2016 Annual Report at 15, 22. As discussed below, the FY 2016 Plan set a FY 2016 target for DPWH. The Postal Service did not mention the new DPTWH % SPLY performance indicator until the FY 2016 Report. See Chapter 3, section D.3.a, infra.
Analysis of FY 2016 Performance Report Analysis of Postal Service Performance and FY 2017 Performance Plan
- 68 -
in work hours.” Id. It states that several factors contributed to the overrun of its work hour plan:
Delaying plant consolidations Not capturing all work hour savings from the second phase of Network
Rationalization Accruing additional work hours to improve service Accruing additional work hours due to hiring, training, and turnover rates for non-
career workforce
Id. The FY 2017 target for DPTWH % SPLY is 0.6 percent, which is lower than the FY 2016 target of 1.2 percent. See FY 2016 Annual Report at 15. The Postal Service states it will meet the FY 2017 target by “capturing work[]hour reductions from operational initiatives.” Id. at 22. Controllable Income (Loss). The results of this performance indicator are calculated as the Postal Service’s total revenue minus controllable expenses. Controllable expenses exclude the following expenses:
Postal Service Retiree Health Benefit Fund pre-funding expense Amortization of the Postal Service’s unfunded liability for its portion of the Federal
Employees Retirement System Non-cash expenses related to changes in liability due to fluctuations in workers’
compensation expenses caused by actuarial revaluation and discount rate changes
Id. The Postal Service explains that because these expenses are not under management’s control, analyzing operating results without these expenses provides better insight into Postal Service operations. Id. at 23. In FY 2016, Controllable Income (Loss) was $0.61 billion, which was $0.51 billion better than the FY 2016 target of $0.10 billion. Id. at 15. The Postal Service explains that overall revenue increased in FY 2016 primarily due to an increase in Shipping and Packages revenue, but was partially offset by the expiration of the temporary exigent surcharge on Market Dominant products on April 10, 2016.90 The Controllable Income (Loss) target for FY 2017 is $0.10 billion. FY 2016 Annual Report at 15. The Postal Service states that it expects controllable income to decrease in FY 2017 due to the expiration of the exigent surcharge, the ongoing decline in First-Class Mail volume, and contractual wage increases and higher benefits costs. Id. at 24.
90 Id. at 23; see Docket No. R2013-11, Order No. 3186, Order on Removal of the Exigent Surcharge and Related Changes to the Mail Classification Schedule, March 29, 2016.
Analysis of FY 2016 Performance Report Analysis of Postal Service Performance and FY 2017 Performance Plan
- 69 -
2. Comments DPTWH % SPLY. The Public Representative finds that the Postal Service partially met the Sustain Controllable Income goal in FY 2016. PR Comments at 8. She observes that the Postal Service fell significantly short of its FY 2016 target for DPTWH % SPLY, but she asserts that the Postal Service provides a sufficient explanation for the shortfall. Id. The Public Representative comments that the FY 2016 Report does not provide comparable results for DPTWH % SPLY for FYs 2013, 2014, and 2015. Id. However, she notes that the Postal Service provided this information in a CHIR response. Id. Based on this response, the Public Representative finds the FY 2017 target for DPTWH % SPLY to be reasonable. Id. In its reply comments, the Postal Service reiterates that the shortfall in DPTWH % SPLY was due to a variety of factors that increased work hours. Postal Service Reply Comments at 10. It adds that work hours also increased due to the continued shift in the type of mail the Postal Service delivers. Id. Specifically, it notes that First-Class Mail volume decreased while Shipping and Packages volume increased. Id. The Postal Service asserts that the shift toward increased Shipping and Packages volume “resulted in increased work hours, affecting the DPTWH [% SPLY] calculation, but also increased the Postal Service’s revenue.” Id. For this reason, the Postal Service asserts that it met the Sustain Controllable Income goal in FY 2016. Id. Controllable Income (Loss). For the Controllable Income (Loss) performance indicator, the Public Representative observes that the FY 2016 result of $610 million exceeded the FY 2016 target of $100 million. PR Comments at 8. In its reply comments, the Postal Service agrees with the Public Representative that the FY 2016 Controllable Income (Loss) target was met. Postal Service Reply Comments at 10.
3. Commission Analysis In FY 2016, the Postal Service exceeded the Controllable Income (Loss) target, but missed the DPTWH % SPLY target. Consequently, the Commission finds that the Postal Service partially met the Sustain Controllable Income performance goal in FY 2016. Below the Commission analyzes the DPTWH % SPLY and Controllable Income (Loss) performance indicators in more detail.
a. DPTWH % SPLY
The FY 2016 Plan set a FY 2016 target for DPWH, but the FY 2016 Report omits both the FY 2016 target and FY 2016 result for this performance indicator. See FY 2016 Annual Report at 15. As discussed in Chapter 2, because the Postal Service provides the FY 2016
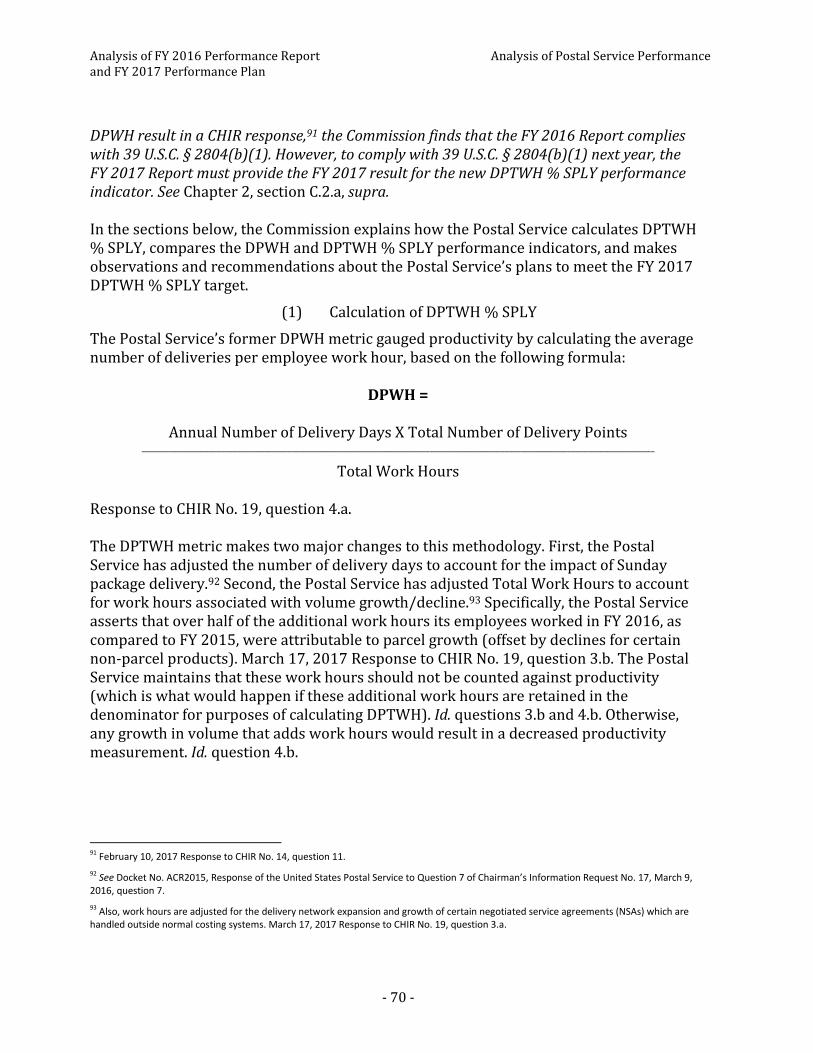
Analysis of FY 2016 Performance Report Analysis of Postal Service Performance and FY 2017 Performance Plan
- 70 -
DPWH result in a CHIR response,91 the Commission finds that the FY 2016 Report complies with 39 U.S.C. § 2804(b)(1). However, to comply with 39 U.S.C. § 2804(b)(1) next year, the FY 2017 Report must provide the FY 2017 result for the new DPTWH % SPLY performance indicator. See Chapter 2, section C.2.a, supra. In the sections below, the Commission explains how the Postal Service calculates DPTWH % SPLY, compares the DPWH and DPTWH % SPLY performance indicators, and makes observations and recommendations about the Postal Service’s plans to meet the FY 2017 DPTWH % SPLY target.
(1) Calculation of DPTWH % SPLY
The Postal Service’s former DPWH metric gauged productivity by calculating the average number of deliveries per employee work hour, based on the following formula:
DPWH =
Annual Number of Delivery Days X Total Number of Delivery Points
__________________________________________________________________________________________________________________________________
Total Work Hours Response to CHIR No. 19, question 4.a. The DPTWH metric makes two major changes to this methodology. First, the Postal Service has adjusted the number of delivery days to account for the impact of Sunday package delivery.92 Second, the Postal Service has adjusted Total Work Hours to account for work hours associated with volume growth/decline.93 Specifically, the Postal Service asserts that over half of the additional work hours its employees worked in FY 2016, as compared to FY 2015, were attributable to parcel growth (offset by declines for certain non-parcel products). March 17, 2017 Response to CHIR No. 19, question 3.b. The Postal Service maintains that these work hours should not be counted against productivity (which is what would happen if these additional work hours are retained in the denominator for purposes of calculating DPTWH). Id. questions 3.b and 4.b. Otherwise, any growth in volume that adds work hours would result in a decreased productivity measurement. Id. question 4.b.
91 February 10, 2017 Response to CHIR No. 14, question 11.
92 See Docket No. ACR2015, Response of the United States Postal Service to Question 7 of Chairman’s Information Request No. 17, March 9, 2016, question 7.
93 Also, work hours are adjusted for the delivery network expansion and growth of certain negotiated service agreements (NSAs) which are handled outside normal costing systems. March 17, 2017 Response to CHIR No. 19, question 3.a.
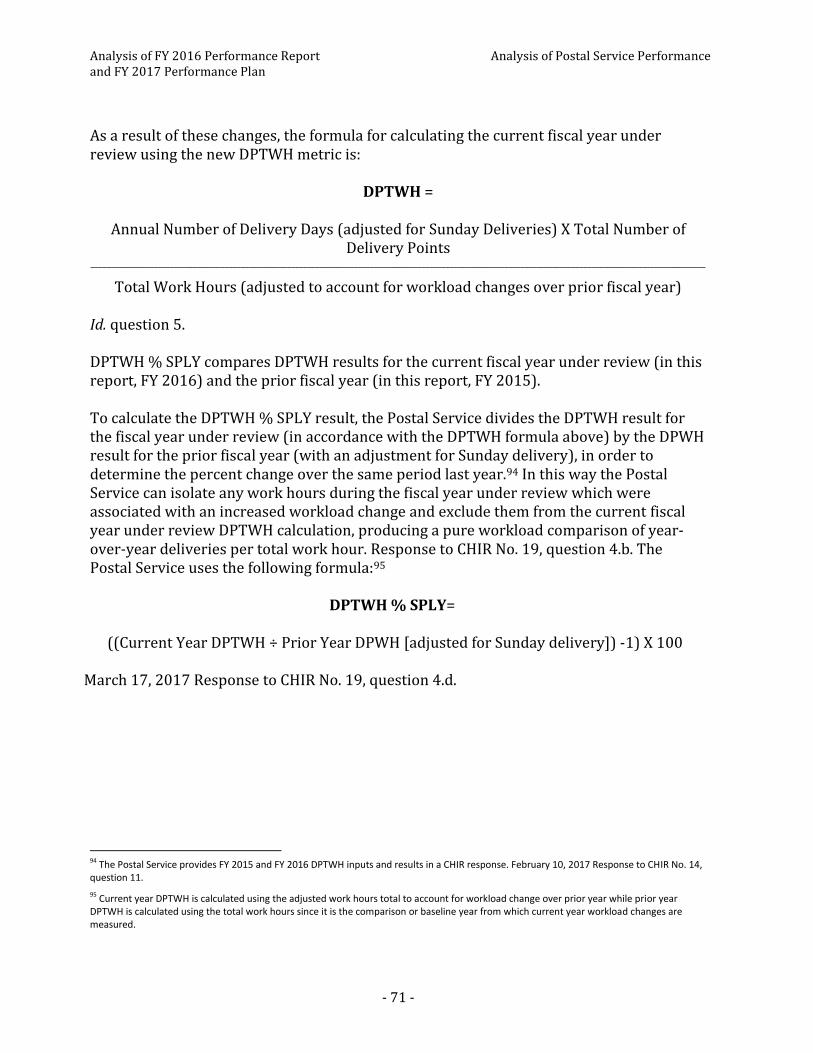
Analysis of FY 2016 Performance Report Analysis of Postal Service Performance and FY 2017 Performance Plan
- 71 -
As a result of these changes, the formula for calculating the current fiscal year under review using the new DPTWH metric is:
DPTWH =
Annual Number of Delivery Days (adjusted for Sunday Deliveries) X Total Number of Delivery Points
____________________________________________________________________________________________________________________________________________________________
Total Work Hours (adjusted to account for workload changes over prior fiscal year) Id. question 5. DPTWH % SPLY compares DPTWH results for the current fiscal year under review (in this report, FY 2016) and the prior fiscal year (in this report, FY 2015). To calculate the DPTWH % SPLY result, the Postal Service divides the DPTWH result for the fiscal year under review (in accordance with the DPTWH formula above) by the DPWH result for the prior fiscal year (with an adjustment for Sunday delivery), in order to determine the percent change over the same period last year.94 In this way the Postal Service can isolate any work hours during the fiscal year under review which were associated with an increased workload change and exclude them from the current fiscal year under review DPTWH calculation, producing a pure workload comparison of year-over-year deliveries per total work hour. Response to CHIR No. 19, question 4.b. The Postal Service uses the following formula:95
DPTWH % SPLY=
((Current Year DPTWH ÷ Prior Year DPWH [adjusted for Sunday delivery]) -1) X 100 March 17, 2017 Response to CHIR No. 19, question 4.d.
94 The Postal Service provides FY 2015 and FY 2016 DPTWH inputs and results in a CHIR response. February 10, 2017 Response to CHIR No. 14, question 11.
95 Current year DPTWH is calculated using the adjusted work hours total to account for workload change over prior year while prior year DPTWH is calculated using the total work hours since it is the comparison or baseline year from which current year workload changes are measured.
Analysis of FY 2016 Performance Report Analysis of Postal Service Performance and FY 2017 Performance Plan
- 72 -
(2) Comparison of DPWH and DPTWH % SPLY
The new DPTWH % SPLY performance indicator modifies the DPWH methodology in two respects. First, the Postal Service calculates the incremental workload impact for the year under review compared to the prior year.96 This change is due to changes in the Postal Service’s workload content as packages increase and letters and flats decrease. The Postal Service states that work hours have recently increased in part due to the growth of its labor-intensive Shipping and Packages business.97 It explains that the DPTWH % SPLY calculation accounts for additional work hour increases due to increased workload by removing them from the current fiscal year DPTWH denominator in order to compare current and prior year results strictly on a productivity basis. See FY 2016 Annual Report at 22. Based on the supporting workpapers provided in a CHIR response, the new DPTWH % SPLY performance indicator adjusted for the workload increase in FY 2016 by subtracting 18 million work hours from the FY 2016 total year-to-date work hours. February 10, 2017 Response to CHIR No. 14, question 11. The Postal Service states that of the approximately 30 million work hour increase in FY 2016 over FY 2015, 18 million were “directly due to...additional weighted volume impact or network growth, and should not be counted against productivity (and are therefore removed from the [current year DPTWH] denominator).” March 17, 2017 Response to CHIR No. 19, question 3.b. Second, the DPTWH % SPLY calculation increases the total number of delivery days by an incremental amount. The adjustment to delivery days accounts for the smaller subset of addresses that receive delivery on Sunday.98 The adjusted delivery days total has only a small impact on the DPTWH % SPLY result. By contrast, subtracting 18 million work hours from the current fiscal year total to adjust for the workload or work hours increase over the prior fiscal year has a larger impact on DPTWH, which improves the DPTWH % SPLY result. The Commission appreciates the explanations provided by the Postal Service to explain methodological changes in response to the Commission’s recommendations from FY 2015. See FY 2015 Analysis at 60-63. In future years, the Commission recommends that the Postal Service provide such explanations in its annual performance reports.
96 FY 2016 Annual Report at 22. The Postal Service calculates the work hours due to increased or decreased volume in each mail category by multiplying the incremental volume (year-over-year) by the appropriate unit cost per piece, and converting the aggregate cost amount to work hours, which are excluded from the current fiscal year DPTWH calculation. The Postal Service also excludes from its current fiscal year DPTWH calculation work hours resulting from the impact of specific NSAs and the delivery network expansion. March 17, 2017 Response to CHIR No. 19, question 3.b.
97 FY 2016 Annual Report at 22; United States Postal Service, Annual Report on Form 10-K, November 15, 2016, at 21 (Postal Service FY 2016 Form 10-K).
98 The Postal Service determines the number of stops each Sunday and keeps a cumulative total of stops year-to-date. It then takes that number and divides by the number of delivery points for the full year to get a fraction of a delivery days represented by all the Sundays in that time frame. See March 17, 2017 Response to CHIR No. 19, question 4.c.i.
Analysis of FY 2016 Performance Report Analysis of Postal Service Performance and FY 2017 Performance Plan
- 73 -
The adjustment for Sunday deliveries is an improvement over the former DPWH performance indicator. The Postal Service states that it “determines the number of stops each Sunday…and keeps a cumulative total of stops per year to date.” Id. It is unclear whether the Postal Service will use full year or partial year data when calculating the DPTWH % SPLY result. The Commission notes that calculating DPTWH % SPLY using Sunday delivery data from the entire fiscal year may improve the FY 2017 result. The Commission identifies an issue with the new DPTWH % SPLY performance indicator. The Postal Service states that the “intent of the...metric is to measure how many hours are being used to service the Postal Service’s delivery point network.” March 17, 2017 Response to CHIR No. 19, question 4.b. However, a portion of the workload increase in FY 2016 is described as being due to delivery network expansion. Id. question 3.b. These work hours are eliminated from the current year DPTWH calculation. Id. question 4.b. Although this workload adjustment (by eliminating work hours) purports to control for year-to-year changes, eliminating work hour increases due to delivery network expansion appears contrary to the stated purpose of the DPTWH % SPLY performance indicator: “to measure how many hours are being used to service the Postal Service’s delivery point network.” See id. Nonetheless, the Commission finds that accounting for differences in year-over-year workload is an improvement. The Commission recommends that the Postal Service provide more information about the meaning and derivation of the workload from the delivery network expansion in its FY 2017 Report. The Commission also notes that the resource inputs used to estimate workload are not as refined or as comprehensive as those used for the Total Factor Productivity (TFP) index. Despite the Postal Service’s attempt to make a workload adjustment that is comparable between fiscal years, eliminating work hours appears to make the actual result less comprehensive. Further, it is not clear that the workload adjustment is accurate or complete. A preferable alternative would be for the Postal Service to return to using the TFP index as the performance indicator for measuring productivity improvements under the Sustain Controllable Income performance goal, as the Postal Service did in the past.99 In FY 2010, the Postal Service replaced the TFP index with the DPWH performance indicator. Id. In the FY 2010 ACD, the Commission recommended against replacing the TFP index with DPWH as a measure of productivity. Id. at 54. Because the new DPTWH % SPLY performance indicator uses the adjusted DPWH rate to calculate the percent improvement over the same period last year, the same limitations noted by the Commission in the FY 2010 ACD for the DPWH also apply to the new DPTWH % SPLY performance indicator. The Commission reiterates its prior recommendation that the Postal Service use the TFP index as a performance indicator for measuring productivity improvements rather than the less robust DPTWH % SPLY derived from the adjusted DPWH.
99 See Docket No. ACR2010, Annual Compliance Determination, March 29, 2011, at 39 (FY 2010 ACD).
Analysis of FY 2016 Performance Report Analysis of Postal Service Performance and FY 2017 Performance Plan
- 74 -
(3) Plans to Meet FY 2017 Target
The Postal Service states it will achieve the FY 2017 DPTWH % SPLY percent target by “capturing work hour reductions from operational initiatives.” FY 2016 Annual Report at 22. In a CHIR response, the Postal Service identifies both processing and delivery operations initiatives that will help it meet the FY 2017 target. February 7, 2017 Response to CHIR No. 10, question 2.c. The Postal Service states that completion dates for some of these initiatives are mid-year and end-of-year in FY 2017. Id. The Commission is concerned that none of these initiatives appear to specifically address the factors that caused the Postal Service to miss the FY 2016 target.100 Also, given the later completion dates of some of these initiatives, it is unclear whether these initiatives will reduce work hours sufficiently during FY 2017 to allow the Postal Service to meet the FY 2017 target. Historically, the Postal Service’s reduced work hour performance targets have neither been met nor accurately forecast.101
b. Controllable Income
Between FY 2015 and FY 2016, total expenses increased 4.2 percent or $3.1 billion due to higher operating expenses and the impact of lower discount rates on the workers’ compensation liability.102 Total compensation for employees increased by $0.7 billion compared to FY 2015.103 According to the Postal Service, this increase was primarily caused by contractual salary increases and additional work hours necessitated by the growing demand for shipping services. Postal Service FY 2016 Form 10-K at 20. Between FY 2015 and FY 2016, total work hours increased by nearly 30 million, or 2.6 percent. This was despite the fact that the Postal Service’s FY 2016 operating plan had forecast a reduction of 7 million work hours as a result of Phase II of Network Rationalization, in addition to the expected continued decreases in mail volume. FY 2016 IFP at 4. Work hour increases between FY 2014 and FY 2016 were primarily due to increases in delivery and customer service operations work hours. FY 2016 Financial Analysis at 15. Work hours for postmasters, on the other hand, decreased by approximately 20 million during this time period.104
100 These factors include delaying plant consolidations, not capturing all work hour savings from the second phase of Network Rationalization, accruing additional work hours to improve service, and accruing additional work hours from hiring, training, and turnover rates for non-career workforce. FY 2016 Annual Report at 22.
101 See page 78, Table IV-2, infra; FY 2015 Analysis at 71.
102 Financial Analysis of United States Postal Service Financial Results and 10-K Statement Fiscal Year 2016, March 31, 2017, at 10 (FY 2016 Financial Analysis).
103 FY 2016 Financial Analysis at 12. Total compensation for employees comprises salaries, overtime and leave pay, and performance or arbitration awards. Id.
104 Responses of the United States Postal Service to Questions 1-2, 4-9, 11-13, 15-19, 23, 28, and 31-33 of Chairman’s Information Request No. 3, January 13, 2017, question 1 (January 13, 2017 Response to CHIR No. 3); January 13, 2017 Response to CHIR No. 3, Excel file “ChIR.3.Q.1.LDC.Workhours.xlsx,” tab "Work hours."
Analysis of FY 2016 Performance Report Analysis of Postal Service Performance and FY 2017 Performance Plan
- 75 -
The Postal Service states that as work hours increase, the opportunities for accidents also increase. See March 1, 2017 Response to CHIR No. 19, question 11.b. The increase in work hours may have also contributed to the increased liability for motor vehicle accident tort claims, which rose from $48 million in FY 2015 to $88 million in FY 2016.105 Efforts to prevent motor vehicle accidents will help reduce expenses as well as promote safety for employees and the public.106 The Commission encourages the Postal Service to accelerate its efforts to reduce motor vehicle accidents so that associated damages, losses, and expenses can be reduced.
105 Compare National Trial Balance, September, FY 2015, November 13, 2015, Excel file “National_Trial_Balance_-_Redacted_September_2015_(FY_2015).xls” with National Trial Balance, September FY 2016, November 15, 2016, Excel file “National Trial Balance - Redacted, September, 2016 (FY 2016).xls.”
106 Continued increases in motor vehicle accidents and related tort claims will have a deleterious effect on controllable income. For example, the National Institute of Occupational Safety and Health found that in 2013, work-related motor vehicle accidents cost employers about $65,000 per non-fatal injury and $671,000 per death. See National Institute of Occupational Safety and Health Center for Motor Vehicle Safety, Progress Report 2016, at 2 (available at: https://www.cdc.gov/niosh/motorvehicle/pdfs/progressreport.pdf).
Analysis of FY 2016 Performance Report Strategic Initiatives and FY 2017 Performance Plan
- 76 -
CHAPTER 4: STRATEGIC INITIATIVES A. Background
In FY 2017, the Postal Service issued its Five-Year Strategic Plan for FYs 2017 to 2021.107 The Postal Service explains that its vision for these fiscal years is to help people connect, businesses grow, and communities thrive in the digital economy. FY 2016 Annual Report at 14. To realize this vision, the Postal Service established four strategic goals:
Deliver A World-Class Customer Experience
Equip, Empower, and Engage Employees
Innovate Faster to Deliver Value
Invest in Our Future Platforms
Id.; Strategic Plan at 7. In a CHIR response, the Postal Service explains that these strategic goals differ from the four performance goals established in annual performance plans and annual performance reports. Response to CHIR No. 25, question 1. The Postal Service explains that it will execute the strategic goals through a portfolio of strategic initiatives called “Ready Now Future Ready.” Id. The Postal Service states that the strategic initiatives are designed to improve and sustain the Postal Service’s performance against the targets set for each performance goal. Id. In FY 2016, the Postal Service focused on implementing a portfolio of 15 strategic initiatives to meet its performance goals.108 It provided FY 2017 strategic initiatives in a CHIR response. Id. question 2.b. Table IV-1 compares FY 2016 and FY 2017 strategic initiatives and links each one to the performance goal it supports. The “Change From Prior Year” column identifies the changes between FY 2016 and FY 2017, which are:
New — Strategic initiative was newly created to address an emerging business need
Refined — Strategic initiative was refined to reflect the current business situation and achieve greater alignment with organizational goals
107 See Future Ready: United States Postal Service Five-Year Strategic Plan, Fiscal Years 2017 to 2021 (available at: http://about.usps.com/strategic-planning/five-year-strategic-plan-2017-2021.pdf) (Strategic Plan).
108 FY 2016 Annual Report at 70-71. The Postal Service refers to performance goals as “corporate goals” and strategic initiatives as the Delivering Results, Innovation, Value and Efficiency (DRIVE) portfolio of initiatives. Id. at 69-71. The Postal Service confirms that strategic initiatives and the DRIVE portfolio of initiatives are the same. February 17, 2017 Response to CHIR No. 15, question 2.a.

Analysis of FY 2016 Performance Report Strategic Initiatives and FY 2017 Performance Plan
- 77 -
Closed — Strategic initiative was closed as a result of a completed activity or change in business need
As shown in Table IV-1, the Postal Service closed 3 strategic initiatives, added 3 new ones, and refined 12 strategic initiatives.
Table IV-1 Comparison of FY 2016 and FY 2017 Strategic Initiatives
Performance Goal
FY 2016 Strategic Initiatives
Change From Prior
Year
FY 2017 Strategic Initiatives
Deliver High-Quality Service
Optimize Network Platform Refined Optimize Network Platform
Optimize Delivery Platform Refined Optimize Delivery Platform
Optimize Retail Platform Refined Optimize Retail and Customer Service Platform
Build a World-Class Package Platform Refined Build a World-Class Package Platform
Leverage Technology and Data to Drive Business Value
Refined Renamed
a and Moved to Sustain Controllable
Income Performance Goal
Optimize Customer and Revenue Visibility Closed
Obtain PRC Approval for Alternative Pricing Model
Closed
Refined Build a Bench of Effective Leadersb
New Effectively Leverage Complement
Provide Excellent Customer
Experiences
Build a World-Class Customer Care Process Refined Build a World-Class Customer Experience
Create a World-Class Social Media Platform Refined Create a World-Class Social Media Platform
Refined Implement Informed Deliveryc
New Build a World-Class International Platform
Ensure a Safe Workplace
and Engaged Workforce
Engage and Empower Employees Refined Build a Culture of Engagement
Contract Negotiations Closed
Corporate Succession Planning Refined Renamed
b and moved to the Deliver High-
Quality Service Goal
Improve Safety Programs Refined Deliver a Safe Workplace
Sustain Controllable
Income
Accelerate Innovation to Maximize Revenue and Profit
Refined Accelerate Innovation to Maximize Customer Value
Informed Delivery Refined Renamed
c and moved to the Provide Excellent
Customer Experiences Goal
Refined Accelerate Innovation to Maximize Business Value
a
New Develop an Innovation Framework a The Leverage Technology and Data to Drive Business Value initiative under the Deliver High-Quality Service goal in FY 2016 was refined and renamed the Accelerate Innovation to Maximize Business Value initiative in FY 2017 and moved to the Sustain Controllable Income goal. b The Corporate Succession Planning initiative under the Ensure a Safe and Engaged Workforce goal in FY 2016 was refined and renamed the Build a Bench of Effective Leaders initiative in FY 2017 and moved to the Deliver High-Quality Service goal. c The Informed Delivery initiative under the Sustain Controllable Income goal in FY 2016 was refined and renamed the Implement Informed Delivery initiative in FY 2017 and moved to the Provide Excellent Customer Experiences goal.
Source: February 17, 2017 Response to CHIR No. 15, question 2.b.
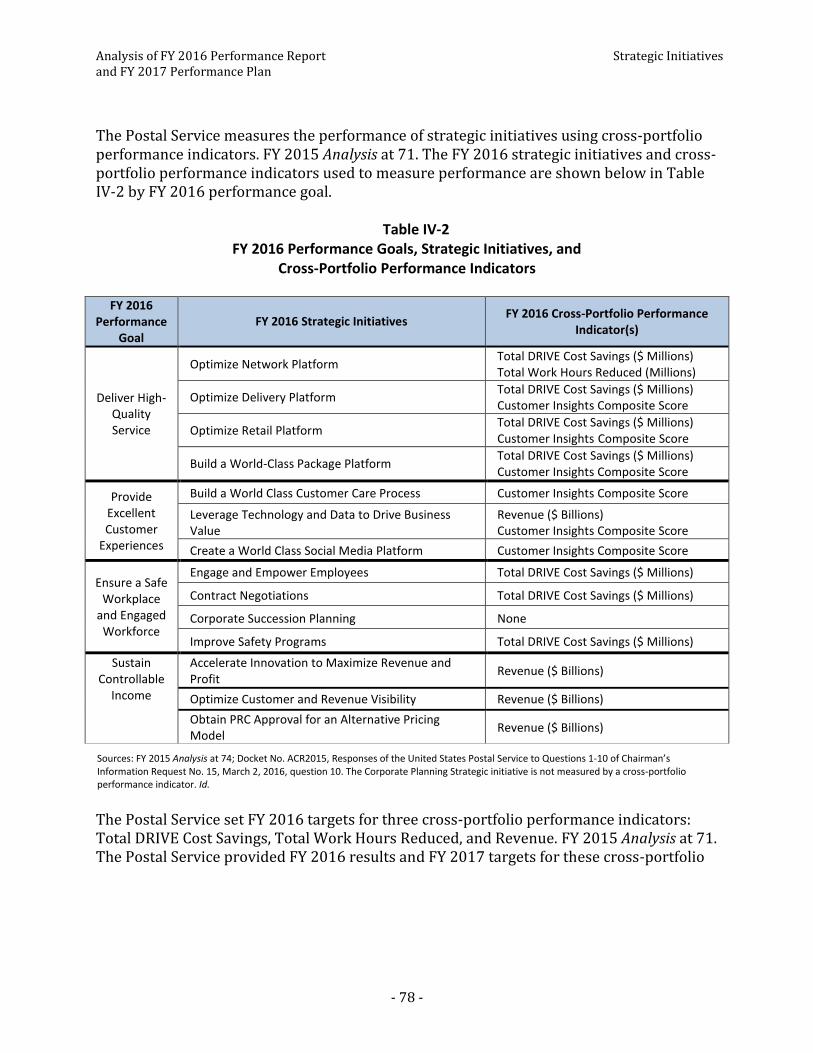
Analysis of FY 2016 Performance Report Strategic Initiatives and FY 2017 Performance Plan
- 78 -
The Postal Service measures the performance of strategic initiatives using cross-portfolio performance indicators. FY 2015 Analysis at 71. The FY 2016 strategic initiatives and cross-portfolio performance indicators used to measure performance are shown below in Table IV-2 by FY 2016 performance goal.
Table IV-2 FY 2016 Performance Goals, Strategic Initiatives, and
Cross-Portfolio Performance Indicators
FY 2016 Performance
Goal
FY 2016 Strategic Initiatives FY 2016 Cross-Portfolio Performance
Indicator(s)
Deliver High-Quality Service
Optimize Network Platform Total DRIVE Cost Savings ($ Millions) Total Work Hours Reduced (Millions)
Optimize Delivery Platform Total DRIVE Cost Savings ($ Millions) Customer Insights Composite Score
Optimize Retail Platform Total DRIVE Cost Savings ($ Millions) Customer Insights Composite Score
Build a World-Class Package Platform Total DRIVE Cost Savings ($ Millions) Customer Insights Composite Score
Provide Excellent Customer
Experiences
Build a World Class Customer Care Process Customer Insights Composite Score
Leverage Technology and Data to Drive Business Value
Revenue ($ Billions) Customer Insights Composite Score
Create a World Class Social Media Platform Customer Insights Composite Score
Ensure a Safe Workplace
and Engaged Workforce
Engage and Empower Employees Total DRIVE Cost Savings ($ Millions)
Contract Negotiations Total DRIVE Cost Savings ($ Millions)
Corporate Succession Planning None
Improve Safety Programs Total DRIVE Cost Savings ($ Millions)
Sustain Controllable
Income
Accelerate Innovation to Maximize Revenue and Profit
Revenue ($ Billions)
Optimize Customer and Revenue Visibility Revenue ($ Billions)
Obtain PRC Approval for an Alternative Pricing Model
Revenue ($ Billions)
Sources: FY 2015 Analysis at 74; Docket No. ACR2015, Responses of the United States Postal Service to Questions 1-10 of Chairman’s Information Request No. 15, March 2, 2016, question 10. The Corporate Planning Strategic initiative is not measured by a cross-portfolio performance indicator. Id.
The Postal Service set FY 2016 targets for three cross-portfolio performance indicators: Total DRIVE Cost Savings, Total Work Hours Reduced, and Revenue. FY 2015 Analysis at 71. The Postal Service provided FY 2016 results and FY 2017 targets for these cross-portfolio

Analysis of FY 2016 Performance Report Strategic Initiatives and FY 2017 Performance Plan
- 79 -
performance indicators in a CHIR response, which are shown in Table IV-3 below along with available performance results for FY 2012 through FY 2016.109
Table IV-3 Current Cross-Portfolio Performance Indicator Results
Cross-Portfolio Performance Indicator
FY TARGET
FY RESULT Target Not Met
2017 2016
2016 2015 2014 2013 2012
Total DRIVE Cost Savings ($ Millions)
a $690 $955 $158 $157 $837 $872 $346
Total Work Hours Reduced (Millions) 6.00 13.00 3.10 0.93 6.70 9.81 1.94
Revenue ($ Billions) $70.7 $69.4 $71.6b
Indicator Introduced in FY 2016
Shaded result denotes target not met in fiscal year under review. a DRIVE is a structured management process for improving business strategy development and progress toward performance goals. FY 2016 Annual Report at 69. DRIVE incorporates measurement, analysis, and evaluation of a portfolio of strategic initiatives. Id. b The Postal Service included other revenue and interest and investment income in its revenue total. See Postal Service FY 2016 Form 10-K at 39.
Sources: February 17, 2017 Response to CHIR No. 15; question 4.a; Docket No. ACR2015 Response to CHIR No. 9, question 6.a; Docket No. ACR2014 Response to CHIR No. 5, question 9; Docket No. ACR2014, March 11 Response to CHIR No. 13, questions 1 and 3, Docket No. ACR2014, March 30 Response to CHIR No. 13, question 28.c; Docket No. ACR2014, Responses of the United States Postal Service to Questions 1-3, 5 of Chairman’s Information Request No. 17, May 15, 2015, question 3 (corrected FY 2014 Total Work Hours Reduced from 7.7 to 6.7 million) (Docket No. ACR2014, May 15, 2015 Response to CHIR No. 17); Docket No. ACR2013, Responses of the United States Postal Service to Questions 1, 5-6, 8-11 of Chairman’s Information Request No. 15, March 21, 2014, question 5; Docket No. ACR2013, Responses of the United States Postal Service to Questions 1-9 of Chairman’s Information Request No. 10, March 4, 2014, question 6; FY 2012 Annual Report at 39.
The Postal Service confirms that there were no changes to the FY 2016 cross-portfolio performance indicators or targets from those identified in the FY 2015 Analysis. The Postal Service provides FY 2016 results in response to a CHIR. February 17, 2017 Response to CHIR No. 15, question 4.b. Table IV-4 shows how the Postal Service aligns the strategic goals with the FY 2017 strategic initiatives and cross-portfolio performance indicators. Only 5 of its 15 FY 2017 strategic initiatives and 3 of its 4 strategic goals are measured using cross-portfolio performance indicators. Four strategic initiatives are linked to the same cross-portfolio indicator: Total DRIVE Cost Savings ($ Millions). The Postal Service does not align the Deliver a World-Class Customer Experience strategic goal with any FY 2017 cross-portfolio performance indicators.
109 Other cross-portfolio performance indicators results and targets discontinued prior to FY 2015 and used during the Postal Service’s FY 2012-FY 2016 Strategic Plan period were presented in the FY 2015 Analysis. See FY 2015 Analysis at 73.
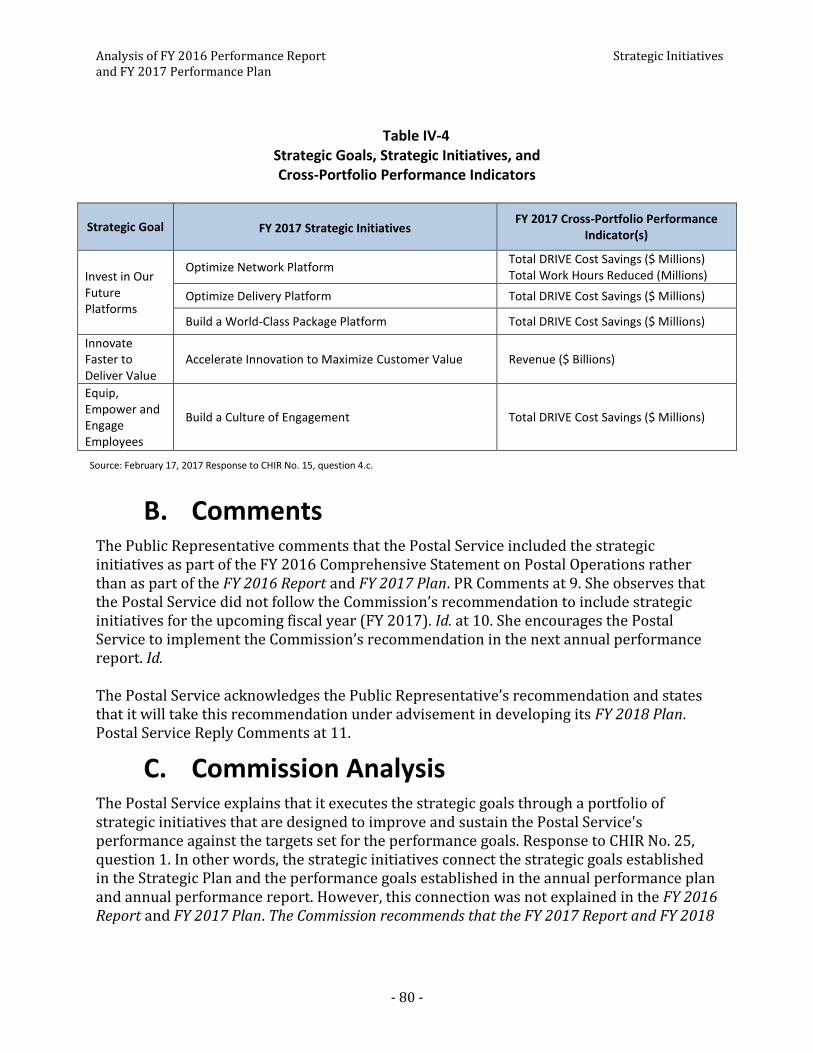
Analysis of FY 2016 Performance Report Strategic Initiatives and FY 2017 Performance Plan
- 80 -
Table IV-4 Strategic Goals, Strategic Initiatives, and Cross-Portfolio Performance Indicators
Strategic Goal
FY 2017 Strategic Initiatives FY 2017 Cross-Portfolio Performance
Indicator(s)
Invest in Our Future Platforms
Optimize Network Platform Total DRIVE Cost Savings ($ Millions) Total Work Hours Reduced (Millions)
Optimize Delivery Platform Total DRIVE Cost Savings ($ Millions)
Build a World-Class Package Platform Total DRIVE Cost Savings ($ Millions)
Innovate Faster to Deliver Value
Accelerate Innovation to Maximize Customer Value Revenue ($ Billions)
Equip, Empower and Engage Employees
Build a Culture of Engagement Total DRIVE Cost Savings ($ Millions)
Source: February 17, 2017 Response to CHIR No. 15, question 4.c.
B. Comments The Public Representative comments that the Postal Service included the strategic initiatives as part of the FY 2016 Comprehensive Statement on Postal Operations rather than as part of the FY 2016 Report and FY 2017 Plan. PR Comments at 9. She observes that the Postal Service did not follow the Commission’s recommendation to include strategic initiatives for the upcoming fiscal year (FY 2017). Id. at 10. She encourages the Postal Service to implement the Commission’s recommendation in the next annual performance report. Id. The Postal Service acknowledges the Public Representative’s recommendation and states that it will take this recommendation under advisement in developing its FY 2018 Plan. Postal Service Reply Comments at 11.
C. Commission Analysis The Postal Service explains that it executes the strategic goals through a portfolio of strategic initiatives that are designed to improve and sustain the Postal Service's performance against the targets set for the performance goals. Response to CHIR No. 25, question 1. In other words, the strategic initiatives connect the strategic goals established in the Strategic Plan and the performance goals established in the annual performance plan and annual performance report. However, this connection was not explained in the FY 2016 Report and FY 2017 Plan. The Commission recommends that the FY 2017 Report and FY 2018
Analysis of FY 2016 Performance Report Strategic Initiatives and FY 2017 Performance Plan
- 81 -
Plan clearly explain how the strategic initiatives relate to the Postal Service’s performance goals and performance indicators. Because strategic initiatives are designed to help the Postal Service meet its performance goals, the FY 2016 strategic initiatives should have been included in the FY 2016 Report and FY 2017 Plan instead of the FY 2016 Comprehensive Statement on Postal Operations. However, these documents are all contained in the Postal Service’s FY 2016 Annual Report to Congress. See page 2 n.1, supra. The Commission recommends that the Postal Service discuss FY 2017 strategic initiatives in the FY 2017 Report and FY 2018 Plan. The Commission also suggests that the Postal Service include strategic initiatives for both the current and upcoming fiscal years in its Annual Report to Congress.110 The Commission previously recommended that the Postal Service replace cross-portfolio performance indicators with performance measures that link to only one strategic initiative. FY 2014 Analysis at 59. In the FY 2015 Report, the Postal Service did not follow this recommendation and increased the number of strategic initiatives measured by the same cross-portfolio performance indicators. FY 2015 Analysis at 76. Applying one performance measure to several strategic initiatives prevents the Postal Service from evaluating the individual performance of each strategic initiative. In addition, because the Total DRIVE Cost Savings ($ Millions) and Total Work Hours Reduced (Millions) cross-portfolio performance indicators results have not met their targets for the past five fiscal years, the strategic initiatives linked to these cross-portfolio performance indicators appear to have failed or partially failed to meet their objectives. The Commission reiterates its recommendation that each strategic initiative have a unique performance measure that only measures performance for that strategic initiative. This would allow the Postal Service to determine whether strategic initiatives are effective in helping the Postal Service meet performance goals and to make targeted changes when results indicate a strategic initiative is not generating the expected benefits. In a CHIR response, the Postal Service reports that the FY 2016 result for the Total Work Hours Reduced cross-portfolio performance indicator was a reduction of 3.1 million work hours. February 17, 2017 Response to CHIR No. 15, question 4.a. However, the Postal Service FY 2016 Form 10-K states that as of the end of FY 2016, total work hours increased by approximately 30 million. Postal Service FY 2016 Form 10-K at 20. The Postal Service previously stated that cross-portfolio performance indicator results vary from the work hours reported in the Integrated Financial Plan. Docket No. ACR2014, May 15, 2015 Response to CHIR No. 17, question 3. The Commission recommends that the Postal Service explain in more detail how it derives the results for the Total Work Hours Reduced cross-
110 The Postal Service’s FY 2017 Plan would have been more transparent and better understood if it had also provided some of the same detail for the FY 2017 strategic initiatives in its Annual Report as it did in its Strategic Plan.

Analysis of FY 2016 Performance Report Strategic Initiatives and FY 2017 Performance Plan
- 82 -
portfolio performance indicator in future annual performance plans and annual performance reports.
Analysis of FY 2016 Performance Report Appendix and FY 2017 Performance Plan Page 1 of 9
Appendix: Commission Findings and Recommendations Chapter 2 - Compliance with 39 U.S.C. §§ 2803 and 2804:
In order to increase transparency and ensure the required information is included, the
Commission recommends that the Postal Service link the specific information provided
in future annual performance plans and annual performance reports to the specific
requirements of 39 U.S.C. §§ 2803 and 2804. Chapter 2 at 9.
The Commission is concerned that the need to issue extensive CHIRs to gather required
information has become the norm. As a result, the Commission finds that the FY 2017
annual performance report (FY 2017 Report) and FY 2018 annual performance plan
(FY 2018 Plan) must contain all information necessary to show compliance with 39
U.S.C. §§ 2803 and 2804. Although some CHIRs may be necessary to clarify elements of
the FY 2017 Report and FY 2018 Plan, the Commission in the future intends only to
review information submitted within the annual performance reports and annual
performance plans to determine statutory compliance. Id.
The Commission finds that the FY 2017 Plan complies with all but one requirement of
39 U.S.C. § 2803. Id. at 10.
o The Commission finds that the Postal Service has complied with 39 U.S.C.
§ 2803(a)(1). As the Commission previously discussed, future annual performance
plans must contain all information necessary to show compliance with 39 U.S.C.
§ 2803. To comply with 39 U.S.C. § 2803(a)(1), the FY 2018 Plan must set targets
for each performance indicator used to evaluate performance during FY 2018. Id.
at 10, 64.
o The Commission finds that the FY 2017 targets provided for the Postal Pulse survey
response rate and number of organizational units entering into executable action
plans in the Gallup system express the Ensure a Safe Workplace and Engaged
Workforce goal “in an objective, quantifiable, and measurable form.” Consequently,
the Commission finds that the Postal Service has complied with 39 U.S.C. §
2803(a)(2). Id. at 11, 64.
o The Commission reiterates the importance of including all required information in
annual performance plans and annual performance reports. To comply with 39
Analysis of FY 2016 Performance Report Appendix and FY 2017 Performance Plan Page 2 of 9
U.S.C. § 2803(a)(2) next year, the FY 2018 Plan must include measurable FY 2018
targets for each performance indicator, including at least one of the performance
indicators related to the Postal Pulse survey. FY 2018 targets must be included in
the FY 2018 Plan rather than in CHIR responses. Id. at 12, 65.
o The Commission finds that the Postal Service has not complied with 39 U.S.C.
§ 2803(a). To comply with 39 U.S.C. § 2803(a) next year, the FY 2018 Plan must
either: (1) identify all program activities in the FY 2018 Integrated Financial Plan
and explain how the FY 2018 Plan covers each one or (2) identify all program
activities in the applicable congressional budget submission, explain how the FY
2018 Plan covers each one, and provide a crosswalk of the relationship between
the program activities in the FY 2018 Integrated Financial Plan and congressional
budget submission. The FY 2018 Plan must also relate each program activity to one
or more performance goals or performance indicators. As previously discussed, the
Postal Service must include this explanation in the FY 2018 Plan rather than in
CHIR responses. Id. at 14.
The Commission finds that the FY 2016 Report complies with 39 U.S.C. § 2804. Id.
o The Commission finds that the Postal Service has complied with 39 U.S.C. §
2804(d)(3). Id. at 15. To comply with 39 U.S.C. § 2804(d)(3) next year, if the Postal
Service did not meet a performance goal, the FY 2017 Report must explain why the
goal was not met and the Postal Service’s plans and schedules for achieving the
goal in future years. The Postal Service must provide the explanations, plans, and
schedules required by 39 U.S.C. § 2804(d)(3) in the FY 2017 Report rather than in
CHIR responses. Id.
o The Commission finds the Postal Service complied with 39 U.S.C. § 2804(d)(2) by
comparing FY 2017 targets with FY 2016 results. To ensure compliance next year,
the Postal Service should include all FY 2018 targets in the FY 2017 Report and FY
2018 Plan. Id. at 16.
o The Commission finds that the FY 2016 Report complies with 39 U.S.C. § 2804(b)(1)
for each performance goal. Id. at 16-18. To ensure compliance next year, the FY
2017 Report must list FY 2017 targets for each performance indicator and
compare FY 2017 results with FY 2017 targets set for each performance indicator.
Id. at 17, 64. The FY 2017 Report must express results for each performance
indicator that are comparable to the targets the Postal Service set for FY 2017. Id.
at 18.
Analysis of FY 2016 Performance Report Appendix and FY 2017 Performance Plan Page 3 of 9
o The Commission reiterates its recommendation that the Postal Service not change
performance indicators or targets once they are set in the annual performance
plan. Id.
The Commission finds that the FY 2016 Report complies with 39 U.S.C. § 2804(c) for
each performance goal. Id. at 18-20, 65. To comply with 39 U.S.C. § 2804(c) in future
years, annual performance reports must contain the required information rather than
it being provided in responses to CHIRs. Id. at 20.
o For the FY 2017 Report to comply with 39 U.S.C. § 2804(c), the Postal Service must
provide comparable results for each performance indicator for, at a minimum, FYs
2014, 2015, 2016, and 2017. Id. at 22, 65. If comparable results cannot be
provided, the FY 2017 Report must explain how to compare results between the old
and new methodologies. The Postal Service must provide this information in the FY
2017 Report rather than in CHIR responses. Id. at 22.
o To comply with 39 U.S.C. § 2804(c) next year, the FY 2017 Report should include
the CI Composite Score, BSN, POS, Delivery, and CCC performance indicator results
for FYs 2014, 2015, 2016, and 2017. To ensure comparability across these fiscal
years, the FY 2017 Report should include FY 2017 Delivery results calculated using
both the old and new methodologies. Because the eCC is a new performance
indicator, the FY 2017 Report does not need to include eCC results from past fiscal
years. Id. at 21.
o To ensure comparability, the Commission recommends that the FY 2017 Report
include the FY 2017 CI Composite Score results calculated using both the old and
new methodologies. If the FY 2017 Report does not include comparable CI
Composite Score results, the Postal Service should explain why it is not feasible to
do so. Id.
o The Postal Service should consider similar approaches when comparing results of
the new or revised performance indicators for FY 2017. Id. at 22.
Chapter 3 - Evaluation of Performance Goals:
The Commission finds that the Postal Service partially met each performance goal in
FY 2016. Chapter 3 at 23.
Analysis of FY 2016 Performance Report Appendix and FY 2017 Performance Plan Page 4 of 9
Deliver High-Quality Service:
The Commission finds that the Postal Service partially met the Deliver High-Quality
Service performance goal in FY 2016. Id. at 29.
The Commission recommends that the Postal Service provide further information
about the FCMP Composite formula in the FY 2017 Report. Id. at 31.
In the FY 2017 Report, the Commission recommends that the Postal Service provide a
more detailed discussion related to the Standard Mail and Periodicals mailpieces that
will be used to measure the Standard Mail & Periodicals Composite performance
indicator. The Postal Service should also report on whether the combined mail classes,
shapes, and products for the Standard Mail & Periodicals Composite performance
indicator primarily reflect the performance of Standard Mail Letters rather than
Standard Mail Flats or Periodicals flats. Id. at 32.
In the FY 2017 Report, the Commission recommends that the Postal Service discuss
how combining different First-Class Mail products with potentially different service
performance results affected the FY 2017 result of the FCLF Composite performance
indicator. The Commission also recommends that the Postal Service consider including
its supporting workpapers for the service performance indicators not included
elsewhere in its ACR filings. Id.
Provide Excellent Customer Experiences:
Because the CI Composite Score and BSN performance indicators exceeded the FY
2016 target, but the POS, Delivery, and CCC performance indicators missed the FY
2016 target, the Commission finds that the Postal Service partially met the Provide
Excellent Customer Experiences performance goal in FY 2016. Id. at 39.
The Commission reiterates its recommendation that the Postal Service establish a
performance indicator based on the Large Business survey. Id. at 40.
The Commission recommends that the Postal Service report FY 2017 results for the CI
Composite Score and subcomponent performance indicators at the national, area, and
district levels to help identify customer satisfaction successes and areas for
improvement. The Postal Service should use the comparable weighting methodology
shown in Table III-8 and provide data in the same format and detail as the data
provided in a CHIR response. Chapter 3 at 42; see Docket No. ACR2015, February 18,
2016 Response to CHIR No. 13, question 4, Table 1.1 and Table 1.2.
Analysis of FY 2016 Performance Report Appendix and FY 2017 Performance Plan Page 5 of 9
The Commission recommends that the FY 2017 Report further explain the Postal
Service’s methodology for calculating the FY 2017 CI Composite Score result. Chapter
3 at 43.
As discussed in Chapter 2, to ensure comparability across prior fiscal years, the
Commission recommends that the FY 2017 Report include FY 2017 Delivery results
calculated using both the existing and new methodologies. See Chapter 2, section C.3,
supra. To better analyze why Delivery performance indicator results declined at the
national level, the Commission recommends that the Postal Service provide FY 2016
and FY 2017 Delivery performance indicator results disaggregated by area and
district using both the existing and new methodologies. Chapter 3 at 47.
The Commission recommends that the Postal Service compare Delivery performance
indicator results for FYs 2014, 2015, 2016, and 2017 using the existing methodology
(based on the “Overall Satisfaction” question) to evaluate customer satisfaction with
mail delivery during this time period. If the FY 2017 Delivery performance indicator
result using the existing methodology shows little change over FY 2016, the
Commission recommends that the Postal Service evaluate and report responses to
another survey question: “In the future, what should the USPS do to improve your
satisfaction with how we DELIVER your mail or packages?” Id.
The Commission recommends that the Postal Service clarify its eCC methodology and
explain how the eCC performance indicator reflects changes in customer experience.
The Postal Service should also explain how including the eCC result in the FY 2017 CI
Composite Score more accurately captures overall customer experience. Id. at 48.
The Commission recommends that the Postal Service adopt an approach similar to the
POS survey for improving Delivery survey response rates. Id.
The Commission recommends that the Postal Service report the results of these pilot
tests and its assessment of whether alternative media methods will increase Delivery
survey response rates. Id.
The Commission recommends that the Postal Service take steps to meet its internal
goal to ensure the Delivery survey results are statistically valid and accurate
reflections of customer experience at the district level. Id. at 49.
The Commission recommends that the Postal Service monitor delivery-related
complaints in areas or districts with infrequent or a small number of Delivery survey
responses. The Commission also suggests that the FY 2017 Report describe whether its

Analysis of FY 2016 Performance Report Appendix and FY 2017 Performance Plan Page 6 of 9
root cause analysis of misdelivery and change-of-address complaints improved the FY
2017 Delivery result. Id.
Ensure a Safe Workplace and Engaged Workforce:
The Commission finds that the Postal Service partially met the Ensure a Safe
Workplace and Engaged Workforce performance goal in FY 2016. Id. at 55. The
Commission cannot evaluate the Postal Service’s performance based on performance
indicators that are not included in the applicable performance plan. Id.
OSHA I&I Rate
o For these reasons, the Commission recommends that the Postal Service retain the
OSHA I&I Rate performance indicator. The Commission recognizes that revisions to
the OSHA I&I Rate are necessary to ensure accuracy. It recommends that future
annual performance reports include OSHA I&I Rate results both as of the end of the
fiscal year and revised to reflect new claims or changes in the status of existing
claims. Id. at 57.
o The Commission previously recommended that the Postal Service consider adding
another workplace safety performance indicator for which results are complete
and not revised after the end of the fiscal year. The Commission reiterates that
recommendation because using a performance indicator that is based on complete
data at the end of the fiscal year and does not change substantially would allow the
Postal Service to better assess and report its safety and training programs and
analyze whether changes to existing programs are needed. Id.
o For the FY 2017 Report to comply with 39 U.S.C. § 2804(c), the Postal Service must
provide comparable results for, at a minimum, FYs 2014, 2015, 2016, and 2017.
The Commission recommends that the Postal Service include FY 2017 results for
both the OSHA I&I Rate and Total Accidents Rate. If the Postal Service decides to
use solely the Total Accidents Rate performance indicator in FY 2017, it must
ensure that the FY 2017 Report complies with 39 U.S.C. § 2804(c). Id. at 58.
o If the FY 2017 Report does not include the FY 2017 OSHA I&I Rate result, the
Commission recommends that the FY 2017 Report explain why it is not feasible to
calculate the FY 2017 OSHA I&I Rate result using accident-related information the
Postal Service is required by OSHA to report and retain. Id.
o The Commission finds that initiatives for preventing motor vehicle accidents
address areas of needed improvement and recommends that the Postal Service
Analysis of FY 2016 Performance Report Appendix and FY 2017 Performance Plan Page 7 of 9
report the results of these initiatives in the FY 2017 Report. Id. at 59. The
Commission finds that adjusting vehicle mirrors could increase driver visibility and
prevent motor vehicle accidents. Id.
o Because the motor vehicle accidents are subsumed in the Total Accidents Rate, and
not completely captured in the OSHA I&I Rate, the Commission recommends
adding a new performance indicator that tracks the number of motor vehicle
accidents or the motor vehicle accident rate. Id. at 60.
Postal Pulse Survey
o The Commission recommends that the Postal Service discuss survey administration
measurement issues and changes and provide information concerning how the
interpretation of results may be impacted by such issues and changes in future
annual performance reports. Id. at 62.
o The Commission recommends that the Postal Service set measurable targets for the
Postal Pulse survey grand mean engagement score. Setting measureable targets is
important to evaluate whether the Postal Service’s related initiatives have been
successful and whether changes to the initiatives are needed to further improve
results. Id.
o The Commission recommends that the FY 2017 Report explain the methodology for
calculating the Postal Pulse survey response rate results. Id. at 63.
o The Commission finds that the Postal Pulse survey grand mean engagement score
is better than the survey response rate as a performance indicator for measuring
employee engagement. The Commission recommends that the Postal Service
distinguish between employees who complete the survey and those who opt-out
when calculating results for the survey response rate performance indicator. Id.
o The Commission recommends that the FY 2017 Report include a similar table
comparing targets and results for each performance indicator, including those
related to the Postal Pulse survey. Id. at 64.
o The Commission recommends that the Postal Service consider comparing the
results between questions from the Postal Pulse and VOE surveys to provide
comparable satisfaction or employee engagement results for FY 2014. Id. at 65.
Analysis of FY 2016 Performance Report Appendix and FY 2017 Performance Plan Page 8 of 9
o The Commission recommends that the Postal Service explore the feasibility and
utility of disaggregating Postal Pulse survey results by employee groups to target
its employee engagement efforts. Id. at 66.
o Given the relatively large increase between FY 2015 and FY 2016, the Commission
recommends that the Postal Service continue to target this issue and include non-
career employee turnover rates by employee type as well as the overall non-career
turnover rate in its FY 2017 Report and FY 2018 Plan. Id. at 67.
Sustain Controllable Income:
The Commission finds that the Postal Service partially met the Sustain Controllable
Income performance goal in FY 2016. Id. at 69.
As discussed in Chapter 2, because the Postal Service provides the FY 2016 DPWH
result in a CHIR response, the Commission finds that the FY 2016 Report complies with
39 U.S.C. § 2804(b)(1). However, to comply with 39 U.S.C. § 2804(b)(1) next year, the
FY 2017 Report must provide the FY 2017 result for the new DPTWH % SPLY
performance indicator. Id. at 69-70; see Chapter 2, section C.2.a, supra.
The Commission appreciates the explanations provided by the Postal Service to explain
methodological changes in response to the Commission’s recommendations from
FY 2015. See FY 2015 Analysis at 60-63. In future years, the Commission recommends
that the Postal Service provide such explanations in its annual performance reports.
Chapter 3at 72.
The Commission notes that calculating DPTWH % SPLY using Sunday delivery data
from the entire fiscal year may improve the FY 2017 result. Id. at 73.
Nonetheless, the Commission finds that accounting for differences in year-over-year
workload is an improvement. The Commission recommends that the Postal Service
provide more information about the meaning and derivation of the workload from the
delivery network expansion in its FY 2017 Report. Id.
Because the new DPTWH % SPLY performance indicator uses the adjusted DPWH rate
to calculate the percent improvement over the same period last year, the same
limitations noted by the Commission in the FY 2010 ACD for the DPWH also apply to
the new DPTWH % SPLY performance indicator. The Commission reiterates its prior
recommendation that the Postal Service use the TFP index as a performance indicator
for measuring productivity improvements rather than the less robust DPTWH % SPLY
derived from the adjusted DPWH. Id.
Analysis of FY 2016 Performance Report Appendix and FY 2017 Performance Plan Page 9 of 9
The Commission notes that calculating DPTWH % SPLY using Sunday delivery data
from the entire fiscal year may improve the FY 2017 result. Id. at 73.
The Commission encourages the Postal Service to accelerate its efforts to reduce motor
vehicle accidents so that associated damages, losses, and expenses can be reduced. Id.
at 75.
Chapter 4 - Strategic Initiatives:
The Commission recommends that the FY 2017 Report and FY 2018 Plan clearly
explain how the strategic initiatives relate to the Postal Service’s performance goals
and performance indicators. Chapter 4 at 80-81.
The Commission recommends that the Postal Service discuss FY 2017 strategic
initiatives in the FY 2017 Report and FY 2018 Plan. The Commission also suggests that
the Postal Service include strategic initiatives for both the current and upcoming fiscal
years in its Annual Report to Congress. Id. at 81.
The Commission reiterates its recommendation that each strategic initiative have a
unique performance measure that only measures performance for that strategic
initiative. This would allow the Postal Service to determine whether strategic
initiatives are effective in helping the Postal Service meet performance goals and to
make targeted changes when results indicate a strategic initiative is not generating
the expected benefits. Id.
The Commission recommends that the Postal Service explain in more detail how it
derives the results for the Total Work Hours Reduced cross-portfolio performance
indicator in future annual performance plans and annual performance reports. Id. at
81-82.