post-processing techniques for active fire...
TRANSCRIPT

Post-processing Techniques for
Active Fire Products
Vladimir Ermakov, Scanex R&D Center
Georgy Potapov, Scanex R&D Center

Part I: Fire Monitoring
Project Overview
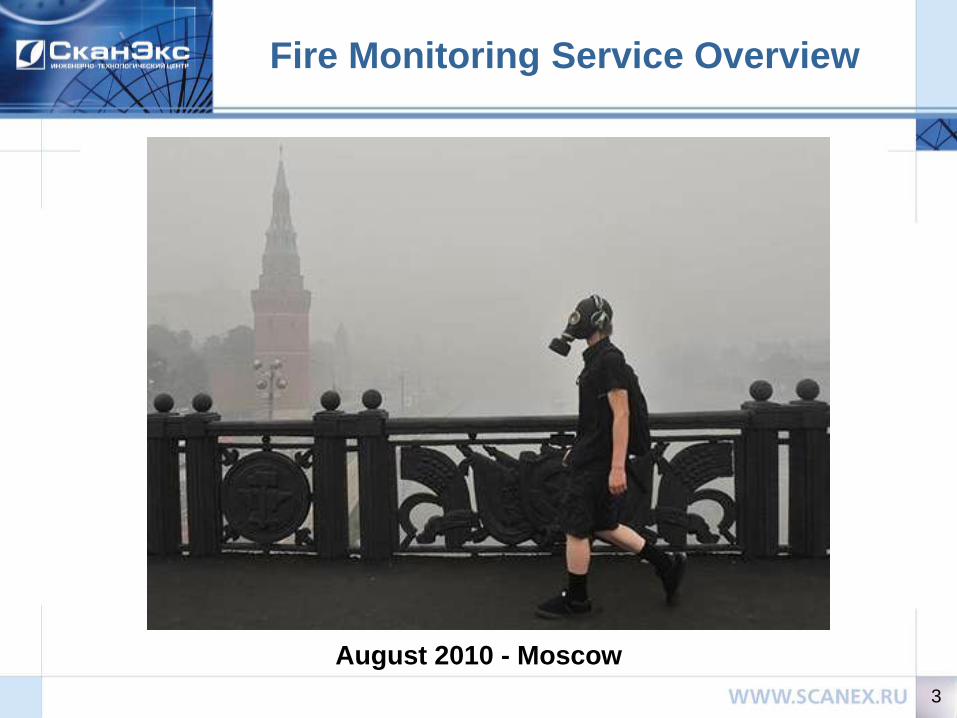
Fire Monitoring Service Overview
3
August 2010 - Moscow

Relative Hotspot Count - Summer 2010
0
0,1
0,2
0,3
0,4
0,5
0,6
0,7
2002 2003 2004 2005 2006 2007 2008 2009 2010
* This is a graph of relative hotspot count in Nizhniy Novgorod region.
4

2010 Fires Sparked Unprecedented
Volunteer Activity.

fires.kosmosnimki.ru
Scanex Fire Monitoring Service

fires.kosmosnimki.ru
Overlayed SPOT Images

fires.kosmosnimki.ru
Overlayed MODIS Image

Integration with Information Systems and Websites
• RESTfull API (JSON / XML) ---- Web / GIS Client
• Java Script API ---- Sites
Part II: Statistical
Explorations

Hotspots per Year by Region
0
1000
2000
3000
4000
5000
6000
7000
8000
2002 2003 2004 2005 2006 2007 2008 2009 2010
Vladimir Smolensk
Yaroslavl' Chuvash
Mordovia Tula
Lipetsk Ryazan'
Nizhegorod Kaluga
Moskva Bryansk
Penza Ivanovo
Kursk Tambov
Tver' Orel
Kostroma
11
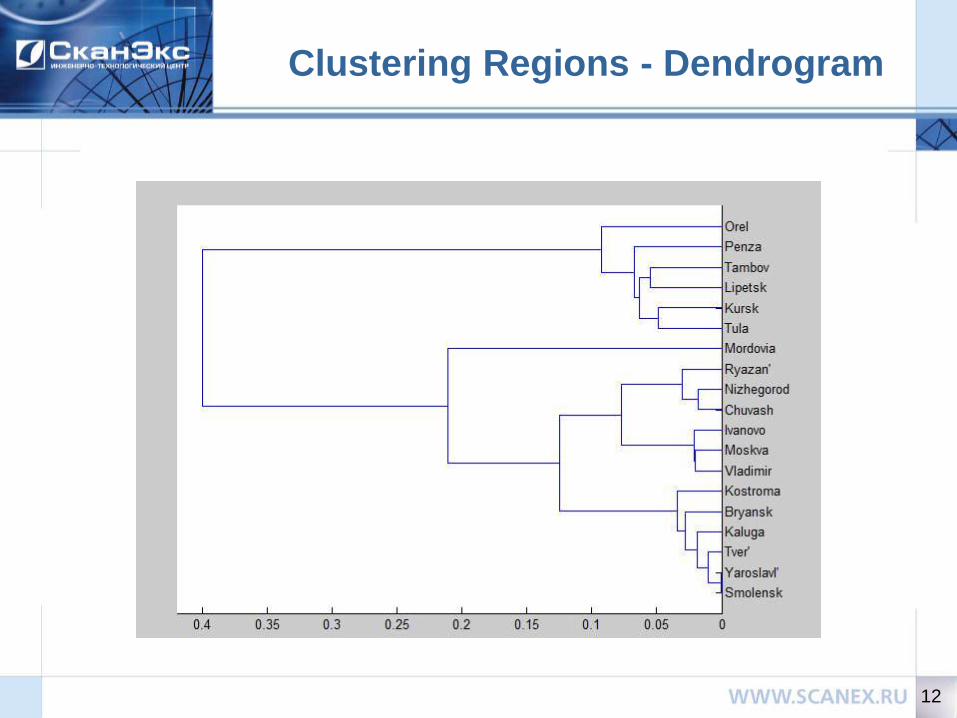
Clustering Regions - Dendrogram
12

Regions Clustered by Fire Trends
0
0.05
0.1
0.15
0.2
0.25
0.3
2002 2003 2004 2005 2006 2007 2008 2009 2010
Tula
Lipetsk
Penza
Kursk
Tambov
Orel
0
0.1
0.2
0.3
0.4
0.5
0.6
0.7
0.8
0.9
1
2002 2003 2004 2005 2006 2007 2008 2009 2010
Smolensk
Yaroslavl'
Kaluga
Bryansk
Tver'
Kostroma
0
0.1
0.2
0.3
0.4
0.5
0.6
0.7
2002 2003 2004 2005 2006 2007 2008 2009 2010
Vladimir
Moskva
Ivanovo
0
0.05
0.1
0.15
0.2
0.25
2002 2003 2004 2005 2006 2007 2008 2009 2010
Mordovia
Mordovia
0
0.1
0.2
0.3
0.4
0.5
0.6
0.7
0.8
2002 2003 2004 2005 2006 2007 2008 2009 2010
Chuvash
Ryazan'
Nizhegorod
13

Hotspot Count by Month
14
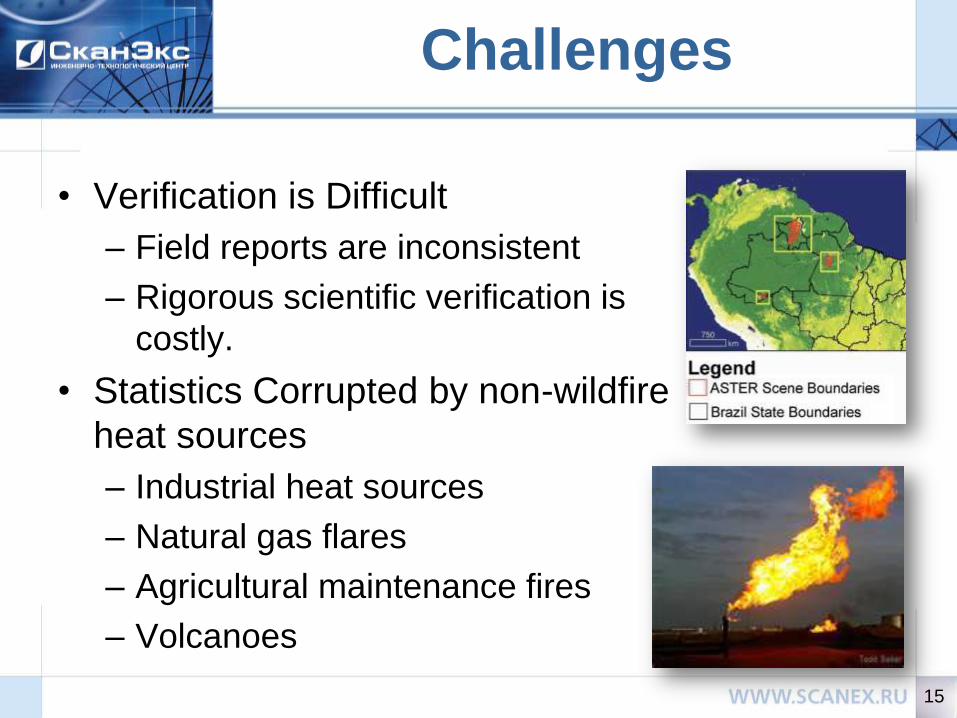
Challenges
• Verification is Difficult
– Field reports are inconsistent
– Rigorous scientific verification is
costly.
• Statistics Corrupted by non-wildfire
heat sources
– Industrial heat sources
– Natural gas flares
– Agricultural maintenance fires
– Volcanoes
15

16
Game With a Purpose:
Firefighters from Outer Space
• Goal: Attract volunteers to
labeling satellite data.
– Measure Precision/Recall
– Get Labels for types of fires
(forest, agricultural,
industrial)
• Problem: labeling is boring
• Solution: Make labeling process fun – turn it into a
game.
• Inspired by Luis von Ahn’s ESP game and ReCaptcha

Level 1: Firefighter
• Subset of hotspots that
have a corresponding high
resolution image are
identified.
• Random hotspot is selected
and shown to the user
• They are asked to
extinguish the fire or label
why the fire should not be
extinguished.
17
Extinguish

Training
• How can a person who’s never seen a satellite
image label images consistently?
• Tutorial
– First 10 images are pre-selected and are used for
training
– Next 10 images are pre-selected as well, and help
compare users and measure accuracy
• Afterwards, government inspection arrives randomly (Show expert-labeled hotspot and compare labels).
18

Post-processing Hotspots
• Can we post-process the results and remove nuisance detections?
• Proximity Hypothesis:
– Hotspots that are of industrial sources will be detected in the same spot over and over again.
– Hotspots that are near other hotspots are more likely to be significant wildfires.
19

Density Based Cluster Detection:
DBSCAN
• Computes pairwise distances for all points - O(N^2)
• Need to process > 500,000 hotspots .
• Use KD-Tree to optimize performance 20

Detecting Industrial Sources
• Approximated 10-15% of hotspots are from industrial sources.
• Optimal detection accuracy:
Precision (%) Recall (%)
Europe 76.23 100
Western Russia 85.08 87.17
Eastern Russia 75.94 83.99
21

Discriminating Agricultural Burns
Agricultural Burn
Equal Error Rate
* Only hotspots marked
consistently with the same
label by multiple players
were used.
Fo
rest
Fir
e
22
Radius
(days)
Radius
(km)
MinPts Clustered
Wildfires(%)
Not clustered
Agricultural(%)
Western
Russia
0.5 1 3 83.33 79.68
ROC Diagram

23
Part III: Current Work
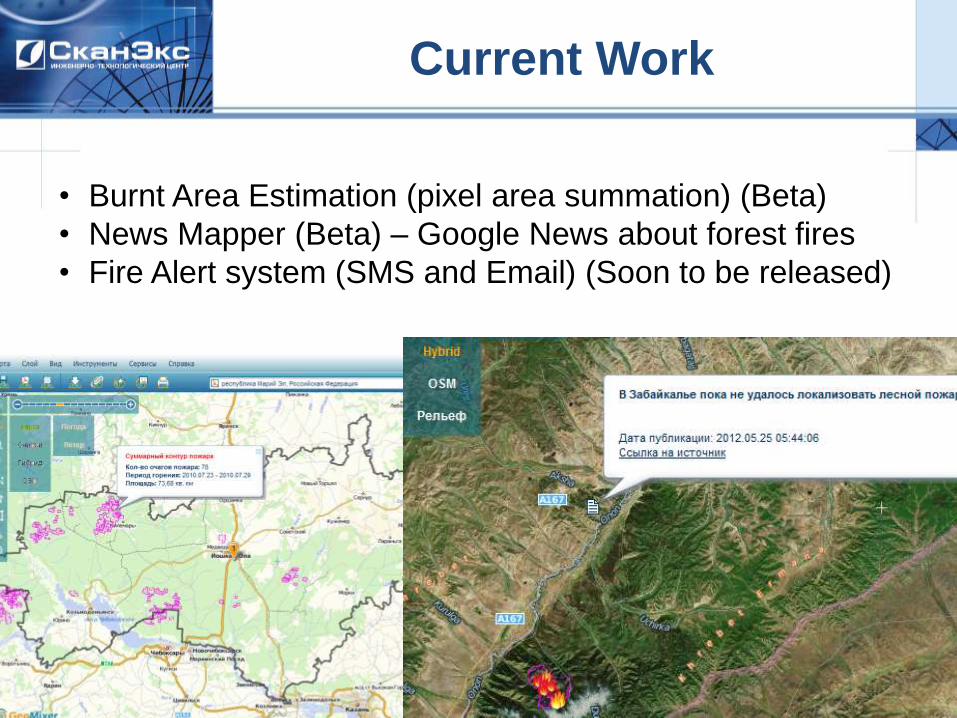
Current Work
• Burnt Area Estimation (pixel area summation) (Beta)
• News Mapper (Beta) – Google News about forest fires
• Fire Alert system (SMS and Email) (Soon to be released)

• VIIRS active fires
• Implemented contextual algorithm
and tested on a small set of images.
• Working on a machine learning based
algorithm with the Auton Lab at CMU
• Train from MODIS (MOD14) data.
• Get experts/volunteers to clarify
labels for borderline fires to train
further.
• Benefits: Easy to incorporate additional
evidence such as NDVI, traces of
smoke, density of hotspots, other
channels. Outputs true probability. 25
Ongoing Research
SCANEX.RU
FIRES.KOSMOSNIMKI.RU
We are open to collaboration!
26

Спутниковые снимки:
- низкого пространственного разрешения (NOAA, MODIS);
- среднего пространственного разрешения, со SWIR каналом
(SPOT-4/5, Landsat-5);
- всепогодные радиолокационные (RADARSAT-2).
Мониторинг пожарной обстановки
Fires.Kosmosnimki.Ru
Источники информации на данном этапе: спутниковые снимки
На следующем этапе: интеграция данных видеокамер, сообщений
очевидцев

Мониторинг пожарной обстановки,
данные низкого разрешения
Снимок SPOT 4 от 11.07.2011. 08:32 UTC
Очаги пожаров детектированные по данным MODIS. Республика Коми. 13.07.2011.
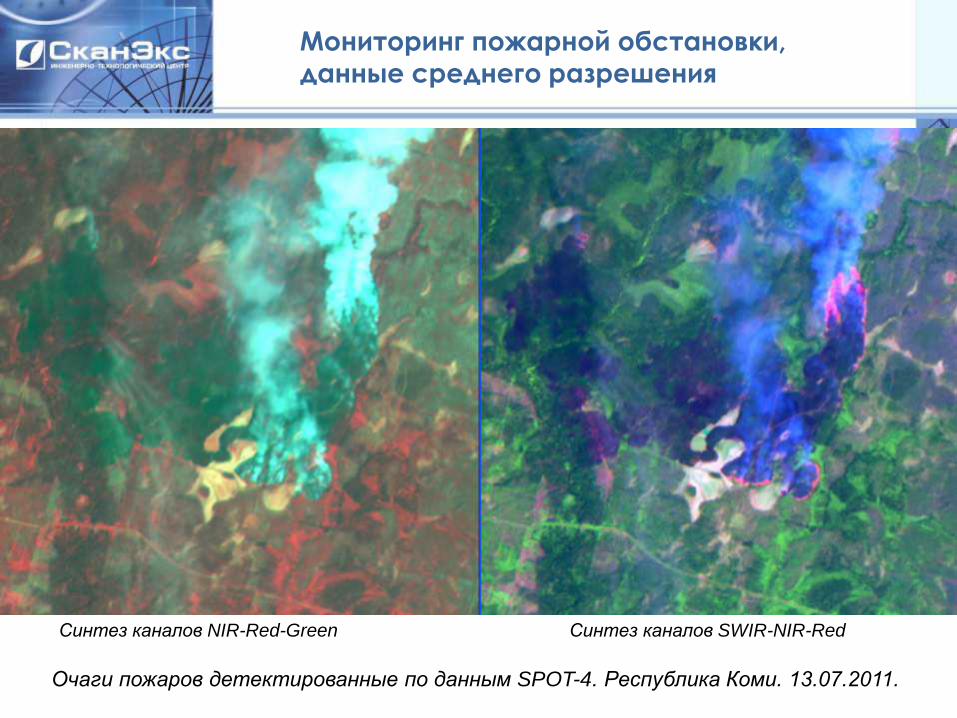
Мониторинг пожарной обстановки,
данные среднего разрешения
Снимок SPOT 4 от 11.07.2011. 08:32 UTC
Очаги пожаров детектированные по данным SPOT-4. Республика Коми. 13.07.2011.
Синтез каналов NIR-Red-Green Синтез каналов SWIR-NIR-Red

Интерфейс веб-сервиса мониторинга пожаров

Архитектура
• Оптимизация для многопользовательского доступа
• Разворачивание в сетях интернет/интранет
• Масштабирование на высокие нагрузки
• Интеграция оперативных данных со станции и с внешних геосервисов (стандарты / плагины)

DB / Fires hotspots
fire clusters
Web-site
API
user
LAN
user
Internet
user
GeoMixer API
System
administration
GeoMixer WEB-GIS
2
4 5
1
Fires Alerting
Service
Mobile
user e-mail / sms
7 a
b
c
a
b
b MOD14
Products
8
a
6 WMS
3 GIS
user
shp/tab/xml/kml
E-Mail:
order imagery
Scanex Operative
Imagery Data Flow
9
LESDOZOR
cameras
Fires Locations Video 11
10
Архитектура системы мониторинга пожаров

Интеграция в информационные системы и сайты
• Оптимизация для многопользовательского доступа
• Работа в сетях интернет/интранет
• Масштабирование на высокие нагрузки
• Интеграция оперативных данных со станции и с внешних геосервисов

Аналитические модули / кластеризация точек
Кластеризация по плотности термоточек + параметр времени
• Позволяет фильтровать ложные сигналы, такие как блики от воды. • Показывает только сгруппированные пожары на обзорных масштабах,
удобнее для восприятия • Позволяет отфильтровать неопасные и «ложные» пожары (сельхоз
палы, техногенные источники) • Позволяет приблизительно оценить площадь активного пожара и
выгоревшей территории, динамику

Техногенные источники
• Поиск по базе
архивных пожаров
• Визуальный
анализ по
снимкам
• Маскирование
областей «ложных
пожаров»
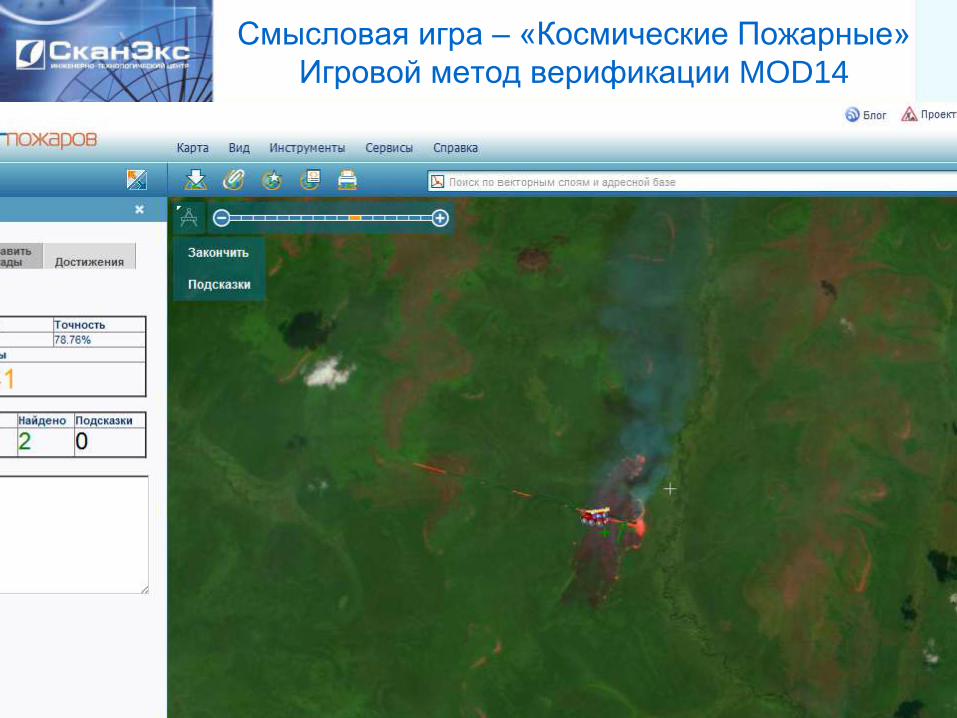
Смысловая игра – «Космические Пожарные»
Игровой метод верификации MOD14
Fires.Kosmosnimki.Ru/game

Аргументы и Факты (вместо заключения)
37
Акцент в сфере информационных технологий смещается от ПО к сервисам. Сервисы позволяют максимально гибко использовать технологии, а главное – интегировать данные и компоненты в сторонние информационные системы
Сервис это не просто доставка данных через интернет, конечное решение объединяет в себе тематические продукты, справочную информацию, пользовательский инструментарий, затачивается под тематичку решаемых пользователем задач Данные, собранные через краудсорсинг, могут быть использованы для
проверки автоматических методов (и для оперативного мониторинга) Космический мониторинг, а также данные из других источников, таких
как видеомониторинг, свидетельства очевидцев, будут поставлять
информацию для анализа и интеграции в публичные информационные
сервисы

38
Приходите на конференцию!
38
29.11-01.12 5я международная конференция «Земля из Космоса –
наиболее эффектиные решения»
02.12 «WEB & GIS» – миниконференция по Веб-картографии и ГИС
SCANEX.RU
FIRES.KOSMOSNIMKI.RU
Мы открыты навстречу сотрудничеству!