post-implementation review of the single use carrier bag ... · 3 1 introduction / background 41...
TRANSCRIPT

Post-Implementation Review of the
Single Use Carrier Bag Charge in
Wales
© Crown Copyright Digital ISBN 978-1-4734-5851-2
Social Research Number:
17/2016
Publication date:
14/03/2016

Post-Implementation Review of the Single Use Carrier Bag Charge in Wales
Jamie Warmington, Dr Nia Owen and Brian Mayne, Ricardo, Energy and Environment
Phil Downing, Icaro
Dr Mike Holland, EMRC
Professor Wouter Poortinga and Dr Lorraine Whitmarsh, Cardiff University
Views expressed in this report are those of the researcher and not necessarily those of the
Welsh Government
For further information please contact:
Environmental Quality and Regulation Branch
Economy, Skills and Natural Resources Group
Welsh Government
Cathays Park
Cardiff
CF10 3NQ
Email: [email protected]
Welsh Government Social Research, 20161
ISBN 978-1-4734-5851-2
© Crown Copyright 2016
1 Minor amendments were made to the labelling of figures on pages 35, 36 and 40 and the reference to the methodology section on page 33 on 27/09/2016.

1
Table of contents 2
3
Glossary of acronyms .......................................................................................................... 2 4
1 Introduction ....................................................................................................................... 3 5
2 Methodology ..................................................................................................................... 5 6
3 Findings - Literature Review ........................................................................................... 16 7
4 Findings - Impacts on Consumers .................................................................................. 19 8
5 Findings – Impacts on Retailers ..................................................................................... 43 9
6 Findings – Impacts on Suppliers of SUCBs .................................................................... 50 10
7 Findings – Impacts on Welsh Government and Local Government ............................... 52 11
8 Findings – Impacts on Donation to Good Causes .......................................................... 54 12
9 Findings – Environmental Impacts .................................................................................. 60 13
10 Findings – Summary of Overall impact ......................................................................... 69 14
11 Conclusions and Recommendations ........................................................................... 73 15
Appendix 1 – Literature Review ......................................................................................... 78 16
Appendix 2 – Retailer Survey Questionnaire .................................................................. 148 17
Appendix 3 – Consumer Survey Questionnaire ............................................................... 161 18
Appendix 4 – Economic Evaluation – Assumptions and Uncertainties Analysis .............. 174 19
Appendix 5 – Bag Demand Profile Database .................................................................. 189 20
21
22
23
24

2
Glossary of acronyms 25
26
Acronym Definition
CE Central Estimate
CO2 Carbon Dioxide
Defra Department for Environment, Food and Rural Affairs
EU European Union
LCA Life Cycle Assessment
LDPE Low Density Polyethylene
MRF Materials Recovery Facility
PP Polypropylene
RIA Regulatory Impact Assessment
RF Reference Flow
SOx Sulphur Oxides
SO2 Sulphur Dioxide
SUCB Single Use Carrier Bag
WLGA Welsh Local Government Association
WRAP Waste and Resource Action Programme
27
28
Reporting conventions 29
Percentages (%) are used where the base size is greater than 30; whereas the actual 30
number (N) is used where base sizes are smaller than 30, since percentages based on 31
such small numbers are not considered to be valid. 32
The survey questionnaires contained routing, whereby some questions were asked of 33
subsets of respondents depending on their answers to previous questions. Therefore, the 34
numbers of responses for which the findings are reported vary by question. Base sizes are 35
therefore reported for all findings. 36
Where percentages presented in tables do not sum to 100%, this is due either to computer 37
rounding or to the fact that for some questions, respondents were able to choose multiple 38
response categories. 39
40

3
1 Introduction / Background 41
1.1 Wales was the first country in the UK to introduce a Single Use Carrier Bag 42
(SUCB) Charge in order to reduce consumption and the associated environmental 43
impacts of SUCB production, use and disposal. The SUCB Charge (Wales) 44
Regulations 2010 introduced a minimum charge of 5 pence for each SUCB. Since 45
October 2011 the charge has been levied at the point of sale, both in store and for 46
distance selling methods, i.e. internet, telephone, mail order etc. The charge 47
applies to a range of places where goods are sold including supermarkets, 48
greengrocers, corner shops, clothing shops, pharmacies, cinemas, market stalls, 49
hotels and takeaway restaurants. The law also applies to sales from places 50
outside Wales if the goods are delivered in Wales.1 51
1.2 The objectives of the SUCB charge were to substantially decrease the number of 52
carrier bags consumed in Wales in order to reduce their adverse effects on the 53
environment by: 54
encouraging a shift in consumer behaviour away from SUCBs to re-usable 55
alternatives 56
reducing the resources used in the production of single use bags 57
preventing waste 58
improving local environment quality by reducing the effects of litter from 59
SUCBs.2 60
1.3 All single use bags whether made of paper, plastic, part plastic, recycled or 61
degradable plastic are covered by the charge. However, the charge does not 62
apply to SUCBs used for promotional items and free items such as samples, 63
leaflets and catalogues. Bags for life made from thick plastic, cloth, jute, cotton 64
and hessian are not covered as they are designed to be re-used.2 65
1.4 The regulations require sellers that employ 10 or more staff and who charge for 66
SUCBs to keep a record of scheme administration for each financial year.3 The 67
records must include: 68
the number of SUCBs charged for 69
the total amount received when charging for SUCBs 70
the net proceeds of the charge (after the deduction of VAT and reasonable 71
costs) 72
1 Further information can be accessed via the Welsh Government’s Carrier Bag Charge for Wales’s website.
Available at: www.carrierbagchargewales.gov.uk 2 Welsh Government (2011) Explanatory Memorandum to the Single Use Carrier Bags Charge (Wales)
(Amendment) Regulations 2011. [Online]. Available at: www.assembly.wales/sub-ld8664-em-e.pdf 3 Welsh Government (2010) The Single Use Carrier Bags Charge (Wales) Regulations 2010. [Online].
Available at: http://www.legislation.gov.uk/wsi/2010/2880/contents/made

4
where the net proceeds were allocated. 73
1.5 Retailers are responsible for the distribution of the proceeds. The Regulations do 74
not specify where the proceeds of the charge should go. However, Welsh 75
Government has developed a voluntary agreement on the use of the net proceeds 76
and this sets out the following principles: 77
the net proceeds are donated to good causes, which where possible will 78
benefit Wales 79
the net proceeds will provide additional support to good causes over and 80
above any existing arrangements 81
where retailers have more than 10 full-time employees, a copy of, or a link 82
to their record (containing the information outlined in paragraph 1.4) will be 83
provided to the Welsh Government when published for monitoring purposes 84
where retailers have fewer than 10 full-time employees, a statement will be 85
made outlining the name of the good cause(s) to which the money has been 86
donated.4 87
Project aims 88
1.6 The aim of this project was to conduct a post-implementation review of the SUCB 89
charge implemented in Wales in 2011. 90
1.7 The first stage of the project was to conduct a literature and data review. The 91
purpose of this stage was to identify what data were already available for an 92
evaluation of the SUCB policy, to ascertain what additional data were required, 93
and the approaches to obtaining these data to enable a robust evaluation of the 94
SUCB policy to be made. 95
1.8 The project objectives were to assess the following: 96
the impact the charge has had on the consumption of SUCBs and the 97
associated behaviour of consumers in Wales 98
the impact the charge has had on businesses in Wales 99
the extent to which the voluntary agreement with retailers has succeeded in 100
encouraging the donation of the net proceeds of the charge to good causes 101
the extent to which the charge has reduced littering of SUCB 102
4 Further information can be accessed via the Welsh Government’s Carrier Bag Charge for Wales’s website. Available at: www.carrierbagchargewales.gov.uk

5
1
2 Methodology 2
2.1 The Magenta book from HM Treasury5 has guided our approach to the policy 3
evaluation. 4
Literature review 5
2.2 A review of international literature was carried out with a focus on the 6
effectiveness of carrier bag charging schemes to reduce the consumption of 7
SUCBs. The review included peer reviewed academic papers, policy documents 8
and other (e.g. media) reports, reporting empirical data, detailed original analysis 9
and/or commentary on pre-existing empirical data. It considered impacts on 10
consumers, businesses and government. Over 120 sources were identified 11
through searches of bibliographic databases, internet searches and a call for 12
evidence. A summary of the literature review findings is presented in Section 3, 13
and the full literature review is available in Appendix 1. 14
Retailer survey 15
2.3 A survey of 504 retailers in Wales was undertaken by telephone between 18th 16
February and 9th March 2015. All of the retailers included within the survey issued 17
SUCBs to their customers. 18
2.4 The survey sampling frame was initially generated by selecting all retail 19
businesses falling within the UK Standard Industrial Classification of Economic 20
Activities (SIC) Division 47 (Retail), which includes both food and drink retailers 21
and non-food and drink retailers. In addition, takeaways (i.e. businesses falling 22
within UK SIC Division 56.10/3) were included because they were identified by 23
Welsh Government as an additional subsector of particular interest. The sample 24
provider was Experian.6 25
2.5 The sample frame was narrowed to focus only on single site retailers or, in the 26
case of retail chains, Head Offices only (i.e. to avoid interviewing multiple retailers 27
from a single chain). Table 2.1 summarises the characteristics of the sample 28
frame according to retail sub-sector and company size (number of employees). 29
The effective sample frame comprised 6,442 retailers in Wales. 30
31
5 HM Treasury (2011). The Magenta Book. [Online]. Available at:
https://www.gov.uk/government/publications/the-magenta-book 6 Experian is a leading global information services company, providing data and analytical tools to clients around the world. Their national business database records four million limited and non-limited active UK businesses with over five million contact names.

6
Table 2.1: Total Sample Universe: Retailers 32
Number of Retailers 33
Sector Number of Employees
1-5 6-10 11+ Total
A - Takeaway 1,403 248 77 1,728
B - Food and Drink Retail 815 154 74 1,043
C - Non-food and drink retail 2,958 491 222 3,671
Total 5,176 893 373 6,442 Source: Experian 34
35
2.6 Quota controls were set on business size (number of employees) and region in 36
order to reflect the known profile of the sampling frame: 37
The regional quota used a proportionate approach, based on the incidence of 38
retailers across regional groupings of local authorities in Wales (see Table 2.2 39
below). In order to ensure that the sample was as representative as possible, 40
the distribution of interviews by individual local authority area was also 41
monitored during fieldwork, even though no attempt would be made to 42
analyse at the local authority area level due to small numbers per individual 43
authority. 44
Disproportionate quota controls were applied for ‘size of business’ to enable 45
robust sub-group analysis for larger retailers, which were defined as those 46
with 11+ employees (see Table 2.3 below). 47
48
Table 2.2: Quotas for Region 49
Region Percentage of retailers in Region
Survey Quota
%* N
North (Anglesey, Conwy, Denbighshire, Flintshire, Gwynedd, Wrexham)
25 123
Mid & West (Carmarthenshire, Ceredigion, Pembrokeshire, Powys)
22 111
West / South Wales (Swansea, Neath Port Talbot, Bridgend, The Vale of Glamorgan, Rhondda Cynon Taff)
26 128
South East Wales (Blaenau Gwent, Caerphilly, Cardiff, Merthyr Tydfil, Monmouthshire, Newport, Torfaen)
28 138
Total
101
500
* Where percentages do not sum to 100% this is due to rounding 50 51

7
Table 2.3: Quotas for company size (number of employees) 52
Number of Employees
Percentage of retailers in Wales
%
Number of retailers in Wales
N
Disproportionate Survey Quota
N
1 to 10 92 462 400
11+ 8 38 100 Total
100
500
500
53
54
2.7 Interviews were offered on the basis of equality in both English and Welsh (with 55
1% of respondents opting to respond in Welsh). 56
2.8 It was often necessary to make several calls to an organisation to establish the 57
best person to speak to, and arrange a convenient time for the interview. 58
2.9 While not specifically excluded, none of the major supermarket chains were 59
included in the interviewed sample, with the approach being to use bag use data 60
collected by WRAP as part of a voluntary agreement on bag use by the seven 61
leading supermarkets across the UK.7 In addition, representatives from the major 62
supermarket chains were invited to attend a focus group (see 2.24 below). 63
2.10 The survey had a dual role both to supply key data for the economic model, and 64
to gauge opinion among retailers on a number of topics of interest to policy (such 65
as the impact of the charge on littering or satisfaction with the charge). The early 66
part of the questionnaire was designed around a series of question ‘loops’, 67
according to the range of bags retailers provided to their customers. For each 68
type of bag, retailers were asked about the numbers supplied, the charge to 69
customers and the impact of the charge. The latter part of the questionnaire 70
turned to attitudes to the charge, addressing a number of key topics of interest to 71
policy. 72
2.11 A copy of the survey questionnaire is provided in Appendix 2. 73
2.12 For analysis purposes, the data was re-weighted by company size to ensure that 74
the overall results, for the sample as a whole, reflect the known profile of retailers 75
in Wales. 76
Consumer survey 77
2.13 A survey of 1,011 Welsh consumers was undertaken by telephone between 2nd 78
and 30th March 2015. All respondents had undertaken a shop – whether food or 79
non-food based – in the previous month. 80
7 WRAP webpage, ‘WRAP publishes new carrier bag use figures’. Last updated 15
th July 2014. Available at:
http://www.wrap.org.uk/content/wrap-publishes-new-carrier-bag-use-figures-0

8
2.14 The sample frame was all individuals in Wales living in private residences with a 81
telephone landline. The sample was purchased from UK Changes. 82
2.15 The survey was conducted using Random Digit Dialling (RDD) sampling, where 83
numbers within the sample were called at random. Quotas were set on age, 84
gender and region (North Wales, Mid & West Wales, South West Wales and 85
South East Wales); according to the known profile of consumers in Wales (see 86
Table 2.4). As with the survey of retailers, in order to ensure that the sample was 87
as representative as possible, the distribution of interviews by individual local 88
authority area was also monitored during fieldwork, even though no attempt would 89
be made to analyse at the local authority area level due to small numbers per 90
individual authority. 91
2.16 When undertaking a telephone survey of the general population living in private 92
residences in Wales, it is not possible to randomly select a sample with a known 93
probability. The survey did not therefore have a statistically robust ‘probability 94
sample’. For a ‘probability sample’, the responding unit - the household or person 95
within the household - is chosen at random. Therefore, each member of the study 96
population has a known chance of being selected and a statistically representative 97
sample will be achieved. 98
2.17 However, the sampling method chosen for this Study followed the most robust 99
methods possible for a telephone survey given the cost constraints of the Study, 100
i.e. Random Digit Dialling was used but quotas were applied and the sample was 101
then weighted post-survey to ensure that the final sample profile matched the 102
known profile of the population of Wales according to age, gender and region. 103
2.18 The sample was therefore a ‘non-probability’, purposive sample so that although 104
the use of RDD would improve the likelihood of achieving a representative 105
sample, the application of quotas was likely to mean that the sample slightly over- 106
represented population sub-groups that were more readily accessible. In this kind 107
of quota sampling, representativeness is defined as achieving a sample that 108
matches the population on a relatively small number of known population 109
characteristics which in this case were age, gender and region. 110
111

9
Table 2.4: Consumer survey target quotas 112
Region Percentage of consumers
%*
North Wales 23
Mid & West Wales 17
South West Wales 29
South East Wales 32 Total
101
Gender Percentage of consumers
%
Men 49
Women 51 Total
100
Age group Percentage of consumers
%
16 to 34 years 29
35 to 54 years 33
55+ years 38 Total
100
* Where percentages do not sum to 100% this is due to rounding 113 Source: 2011 Census Data 114
115
2.19 All results are subject to margins of error - a sample has been surveyed (not the 116
entire population). With a ‘probability’ sample, there is a known probability that we 117
have accurately represented the true population and we are therefore able to 118
estimate confidence intervals for our estimates. When interpreting the findings 119
derived from a ‘non-probability’ sample, we were unable to depend on the 120
rationale of probability theory; for a quota sample, it is assumed that a sample that 121
is representative according to known population characteristics (age, gender and 122
region) is also representative according to other unknown characteristics - which 123
for this survey are attitudes and behaviours in relation to SUCBs. Whether the 124
reported attitudes and behaviours are representative of the ‘true population’ will 125
depend on how true this assumption is. 126
2.20 A number of studies have compared results obtained from quota surveys with 127
those from random probability surveys and other trusted data sources. The 128
overwhelming message from these studies is that data from quota and random 129
probability samples are, in the main, comparable: most comparisons reported in 130
the referenced studies showed either no differences or small differences between 131
sample types. These studies present evidence suggesting that the number of 132
significant differences arising from comparisons between probability sample 133

10
results and quota sample results are in line with chance expectation. While some 134
real differences were found, most observed differences were not large enough to 135
be of major practical concern given the purposes of the surveys.8 136
2.21 In order to test whether, for example, the differences between estimates derived 137
from the survey are statistically significant, we created ‘pseudo confidence 138
intervals’ based on the assumption that our sample is a simple random sample. 139
These statistical tests were undertaken at the 95% confidence level to ensure that 140
the result could not happen by chance more than five times out of 100. However, 141
because we know that our sample is not entirely random, we also know that the 142
margin of error we are assuming is, in reality, likely to be an underestimation so a 143
small number of the differences we are reporting as significant may not be 144
significant. 145
2.22 Interviews were offered on the basis of equality in both English and Welsh (with 146
2% of respondents opting for the latter). 147
2.23 A copy of the survey questionnaire is provided in Appendix 3. 148
Retailer focus group 149
2.24 Representatives of retailers and retail trade associations were invited to attend a 150
focus group held in Cardiff to discuss the impact of the SUCB policy on their 151
organisations and/or members. The focus group was held on 23rd April 2015. 152
Five organisations attended the focus group. 153
2.25 Trade associations invited to attend were those whose members would potentially 154
have been impacted by the charge. An email was sent to the trade associations 155
identified from business directories and online searches, inviting them to attend 156
the focus group. 157
2.26 The themes discussed at the focus group were: 158
top of mind thoughts about the SUCB policy 159
type of SUCBs and bags for life offered before charge was introduced in 160
2011 161
type of SUCBs and bags for life offered after the introduction of the charge 162
8 Both the text of the paragraph and the following references are taken from: Scottish Government (2011)
Technical Report of the Scottish Environmental Attitudes and Behaviours Survey 2008. [Online]. Available at: http://www.gov.scot/Publications/2009/03/25155151/6. For example:
Moser, C. and Stuart, A. (1953) ‘An experimental study of quota sampling.’ Journal of the Royal Statistical Society, Series A, Vol. 116 No. 4.
Stephenson, C., B. (1979) ‘Probability sampling with quotas: wan experiment.’ Public Opinion Quarterly, Vol. 43, No 4.
Marsh, C. and Scarbrough, E. (1990) ‘Testing nine hypotheses about quota sampling.’ Journal of the Market Research Society, Vol. 32 No.4.
Orton, S. (1994) ‘Evidence of efficiency of quota samples.’ Survey Methods Newsletter, Vol. 15, No 1
Groves, R. et al. (2004) Survey Methodology. New York: Wiley.
Myant, K. and Hope, S. (2006) ‘A comparison of quota and random samples for measuring sport participation.’ Research report for the Scottish Executive.

11
change in sale of bags 163
administration of the charge 164
reporting methods 165
non-compliance with the voluntary agreement 166
consumer feedback 167
donations to good causes 168
any other comments. 169
2.27 A further five organisations were unable to attend the focus group on the day and 170
these were offered individual semi-structured discussions over the telephone 171
covering the same themes discussed at the focus group in an attempt to capture 172
their feedback on the SUCB charge. 173
2.28 Retailers and trade associations were offered the opportunity to participate in the 174
focus group in English or Welsh. 175
The Views of Suppliers 176
2.29 Respondents to the survey of retailers were asked to name their SUCB suppliers. 177
To understand the impact of the SUCB policy in Wales, organisations were 178
identified from the top 10 most common suppliers identified by the retailers. Five 179
of the top 10 organisations were contacted for detailed qualitative feedback on the 180
impact of the charge. These suppliers ranged from a manufacturer of paper and 181
plastic bags, specialist packaging suppliers, cash and carry and catering 182
suppliers. 183
2.30 All five organisations were contacted via email and/or telephone to invite them to 184
participate in a structured discussion by telephone covering the following topics: 185
Overview of the business : 186
- size, location, the geographic area serviced by their business etc. 187
Type of bags manufactured and/or supplied: 188
- SUCB – plastic, biodegradable, paper etc. 189
- Bags for life – thick plastic, canvas, jute, etc. 190
How the bags they manufactured/supplied had changed since the charge 191
was introduced in 2011. 192
How their business had changed since the introduction of the charge. 193
Economic Evaluation 194
2.31 The production and disposal of single use carrier bags are a source of pollutant 195
emissions to air, waste water, solid waste and litter. These negative effects have 196
associated costs for society: for example, air pollutants have detrimental impacts 197
on human health, which in turn create additional costs of treatment incurred by 198
health services. Prior to the legislation introducing the SUCB charge in 2011, the 199

12
majority of SUCBs used by Welsh shoppers were provided free of charge. As 200
such, the price (or lack of price in this respect) of a SUCB did not reflect the 201
negative environmental and social costs associated with their production and 202
disposal. 203
2.32 In economics, impacts that are associated with producing or consuming a product 204
which are not captured by its price are known as ‘externalities’ (or effects that are 205
external to the price). These externalities create problems for society because 206
consumers do not face an ‘appropriate’ signal or price which reflects these costs, 207
leading to an ‘over-supply’ of the negative impact. 208
2.33 In this case where a SUCB is provided for free, this price does not reflect the 209
environmental and social costs associated with its production and disposal. As 210
such, the price paid by the consumer is below the level it would be if these effects 211
were appropriately captured. Given that the price is lower than it should be, it is 212
assumed in economic theory that consumers use more SUCBs than they would 213
otherwise have done, delivering a larger amount of the associated negative 214
environmental and social effects (the ‘externality’). 215
2.34 Economic theory would suggest that if SUCBs are provided for free, demand will 216
be above the ‘optimal level’ (i.e. the level of demand at which the price 217
comprehensively reflects all costs associated with production and consumption of 218
an SUCB). The implementation of the 5 pence charge therefore aimed to capture 219
at least some of the negative environmental and social cost in the charge, and 220
thus influence consumer behaviour such that consumption levels would be more 221
reflective of the true costs of SUCB production and disposal. 222
2.35 To support the implementation of the 5 pence charge, the Welsh Assembly 223
Government undertook a RIA9 in 2011. The RIA estimated that implementation of 224
the 5p charging scheme could lead to a reduction in SUCB use by an estimated 225
59% relative to the baseline level of use of 445 million SUCBs per annum, with a 226
170% increase in demand for bags for life over a 15-year period. The RIA 227
estimated that this could provide a net benefit of between £27.9 million and £32.3 228
million per year as a result of reduced environmental costs and increased social 229
benefits via charitable donations. 230
2.36 The purpose of this evaluation was to review the impact of the charge over the 231
time period from October 2011 to January 2015. The evaluation sought to review 232
the effectiveness of the policy in achieving the anticipated and desired outcomes. 233
To do so, this evaluation estimated and compared the benefits of the policy with 234
the costs. 235
2.37 To be able to evaluate the policy, given the lack of available data around bag 236
usage, a model was built to depict the number of bags (and different types of bag) 237
9 Welsh Government (2010) Regulatory Impact Assessment on the proposals to introduce a single use carrier
bags charge. [Online]. Available at: http://gov.wales/topics/environmentcountryside/epq/waste_recycling/substance/carrierbags/regulatory-impact-assessment/?lang=en

13
in circulation in each year over the evaluation period. The evaluation model was 238
developed with data collated from the literature review and from the retail and 239
consumer surveys. More specifically, data were collected in the retailer survey 240
regarding the number of different bags distributed in 2015. These were combined 241
with information (also from the retailer survey) regarding how the numbers of bags 242
distributed had changed annually since 2011, to define the number (and type) of 243
bags in circulation in each year of the evaluation period. 244
2.38 To assess the ‘net’ or additional impact of the policy, these data needed to be 245
compared to a counterfactual scenario: i.e. an estimate of the number of bags that 246
would have been issued if the charge had not been introduced. Given that the 247
counterfactual is a hypothetical scenario, no data readily existed that could be 248
used to define this scenario. As such, the counterfactual was also modelled for 249
the purposes of the evaluation. 250
2.39 The counterfactual took the same starting point in terms of the number and split of 251
bags as the ‘with policy’ scenario in 2011. To forecast forward, data published by 252
the Office for National Statistics10 depicting the change in the value of goods sold 253
were used as a proxy for the growth rate of bags year on year. Given that the data 254
expressed the value of goods sold in monetary terms (as opposed to volume 255
terms), it was necessary to adjust the growth rates taken from these data to 256
exclude the impacts of inflation between years. Using these data assumes that 257
changes in the retail value of goods (in constant prices) correspond to changes in 258
the physical volume of goods, which in turn reflect changes in the demand for 259
bags. In the absence of historical datasets for carrier bag consumption against 260
which to compare, this methodology for forecasting the baseline was considered a 261
reasonable proxy approach to take. 262
2.40 The timeframe across which costs and benefits have been assessed runs from 263
October 2011 (implementation of the 5 pence charge) through to the end of 2014: 264
inclusively a period of 3.33 years. 265
2.41 The key impact categories included in the evaluation are as follows: 266
Administrative burden and enforcement costs – the annual costs incurred by 267
Welsh Government, local authorities and retailers associated with ongoing 268
administration and enforcement action 269
Environmental damages – environmental impact categories valued under 270
this category are carbon impacts (global warming potential), air quality 271
(sulphur oxides, damage to human health and infrastructure) and littering 272
costs (which are valued via a proxy of the time taken to clear up littered 273
products within the environment) 274
10
Office for National Statistics webpage, ‘Time series explorer’. Available from: http://www.ons.gov.uk/ons/datasets-and-tables/data-selector.html?cdid=J467&dataset=drsi&table-id=4 [Accessed on 27/04/2015]
14
Waste management costs - costs associated with dealing with the quantities 275
of SUCB waste arising. Unit costs developed are based on gate fees so 276
reflect recycling and disposal values only 277
Donations to good causes – valuation of the additional donations to good 278
causes raised as a result of the 5 pence charge on SUCBs 279
Consumer Impact – net impact of the additional utility11 gained by 280
consumers in shifting to re-usable bags minus the utility lost via reduced 281
amenity of SUCBs. 282
2.42 In order to quantify the change in these variables and value them in economic 283
terms, several assumptions were made.12 Where possible, consistency has been 284
maintained with the original RIA methodology in order to allow the most direct 285
comparison.13 286
2.43 To calculate the net benefit of the policy, the results for the counterfactual 287
scenario have been subtracted from the results for the policy as implemented in 288
practice, in order to provide the net additional impact of the policy. 289
2.44 Using data collated in the retailer survey, additional high and low impact scenarios 290
were generated for sensitivity analysis. Sensitivity analysis is a tool used to 291
explore the nature, type and size of uncertainty around ‘medium’ quantitative 292
estimates of impacts. These additional scenarios demonstrate outputs with varied 293
assumptions in order to test the variability of the model and therefore the 294
robustness of the outputs generated. The high and low impact scenarios 295
addressed a key uncertainty for this model which related to the number of bags of 296
different types in circulation; this uncertainty is particularly important for the 297
results, since this assumption is integral to the most important impacts calculated 298
in the analysis (including both donations to good causes and environmental 299
impacts). 300
2.45 More information on bag demand profiles (estimated bag consumption) is 301
available in the detailed analysis section (see paragraph reference 4.30). It is 302
important to note that, as a result of this fundamental variation in bag demand, 303
each scenario (high, low, and medium impact) comprises both an observed level 304
of bag demand and accompanying counterfactual because, due to the way in 305
which bag numbers have been back calculated, each scenario reflects a potential 306
different starting position. Appendix 4 presents the analysis conducted, outlining 307
the key sensitivities involved in generating the model outputs. 308
11
Utility in this case refers to the value that a consumer places on using a particular bag based on for example its convenience, strength or attractiveness, and is theorised to define consumers’ purchasing decisions. For example, if a bag is more attractive and has the potential to be re-usable then consumers may feel it provides them with greater utility and thus they may value it more highly. 12
Detailed methodological notes can be found in Appendix 4. 13 However, as this is an evaluation piece, values have been adjusted for inflation and real benefits have been summed across the timeframe to represent a total observed impact, unlike in the earlier RIA which assessed average annual net impacts (total impact divided by the number of years appraised).

15
2.46 This evaluation sought to quantify the impacts of the charge on the following: 309
consumers; 310
retailers; 311
suppliers of SUCBs; 312
Welsh Government and the public sector; 313
donations to good causes; and 314
the environment. 315
2.47 For each, the costs and benefits of the charge have been identified using both 316
quantitative and qualitative methodologies. The findings of these are discussed in 317
detail in Sections 4 to 10 below. 318
1

16
3 Findings – Literature Review 2
3.1 The literature review identified that: 3
Carrier bag charging schemes can substantially reduce the consumption of 4
SUCBs. A reduction of 50% to 95% can be achieved in the short-term. Less 5
is known about the long-term effectiveness of these schemes, but the 6
evidence suggests that a charge may need to be increased after a number 7
of years to retain its effectiveness. 8
A range of approaches have been used to minimise the consumption of 9
SUCBs, including bans, charges and levies. The limited empirical evidence 10
available suggests that the popularity of carrier bag charges among 11
consumers tends to increase once they have been implemented and their 12
expected benefits (e.g. reduced litter) are observed in practice. The 13
popularity of charging schemes is also associated with the proceeds being 14
donated to charity rather than kept by retailers or collected by government. 15
This evidence highlights the importance of communicating the specifics of 16
schemes to the public in order to maximise their acceptance. 17
Bag re-use, bag abstention (i.e. not using a bag at all) and bag optimisation 18
(i.e. filling bags until they are almost full) have been observed in a number 19
of studies, but there is no clear evidence in the research literature of 20
positive spill over to other associated waste reduction or pro-environmental 21
behaviours. 22
There has only been a small increase in bin-liner sales in Wales compared 23
with the overall reduction in SUCB use. However, there has been a large 24
increase in bags for life sales equating to about a third of the overall 25
reduction in SUCBs.14 26
The impacts of carrier bag charging schemes on litter are more difficult to 27
assess due to a lack of systematic empirical evidence. However in 2013, 28
Keep Wales Tidy reported a marginal decrease of carrier bags in litter since 29
the Welsh SUCB charge was introduced.15 30
Retailers tend to express positive opinions about bag charging, once initial 31
fears about potential negative impacts, for example shoplifting, are not 32
realised and benefits are experienced. Indeed, the responses from the 33
British Retail Consortium and Association of Convenience Stores to the 34
Defra Environment Audit Committee expressed disappointment that their 35
members were to be exempt from charging under the proposed scheme for 36
England. However, evidence suggests that there are differences between 37
retailer categories with some, for example takeaways and clothing shops, 38
reporting more difficulties such as customer annoyance and loss of 39
advertising opportunities. 40
14
WRAP (2013) Effect of charging for carrier bags or bin-bags in Wales [Online] Available from: http://www.wrap.org.uk/node/18514 15
Keep Wales Tidy (2013). Written evidence on the sustainability of measures to reduce the use of plastic shopping bags submitted to the House of Commons Environmental Audit Committee.

17
3.2 Overall, the availability and quality of evidence to determine the wider impacts of 41
SUCB charging schemes is poor. Many studies do not use representative 42
samples or comparator groups, fail to report response rates and other 43
methodological information, and/or rely on self-reported behaviours (which tend to 44
over-state bag reuse) rather than behavioural observations or other objective 45
measures. 46
3.3 An assessment of the evidence identified in the literature review was carried out 47
to determine the additional research required to conduct a robust evaluation of the 48
SUCB charge for Wales. This highlighted that quantitative information was 49
available for many impacts of the SUCB charge, and this is summarised in Table 50
3.1. Note that a Red Amber Green (RAG) scoring system is used, where red 51
denotes that information is not available, amber denotes that information is 52
partially available, and green that the information is available. 53
54
Table 3.1: Availability of data from the literature review 55
Input data required
Data in existing
literature review
Is data available
for Wales?
Year for which data is
available
Impacts to manufacturing industry
Revenue (after SUCB charge) No - -
Revenue (before SUCB charge) No - -
Response to loss of Welsh market for manufacturing SUCBs
No - -
Impacts on retailers
Cost per bag purchased (excl VAT), before and after charge introduced
Yes No Prices
available online
Carrier bags sold after SUCB charge Partial –
supermarkets only
Yes Data
available from 2010
Carrier bags sold before SUCB charge Partial –
supermarkets only
Yes Data
available from 2010.
% retailer revenue reduced as a result of "small basket effects" whereby SUCB charge puts off "small basket" customers from shopping.
No - -
Other impacts to retailers arising from the need to buy and store fewer bags.
No - -
% revenue reduced by shoplifting Limited data Limited 2012
Change in demand for heavy duty plastic bags (quantitative)
Limited data Yes 2013

18
Input data required
Data in existing
literature review
Is data available
for Wales?
Year for which data is
available
Change in demand for bin liners (quantitative) Limited data Yes 2013
Charitable donations
Charitable contribution per bag sold Limited data For some retailers in
Wales 2013/14
Change in other charitable contributions after SUCB charge
Limited data For some retailers in
Wales 2013/14
Type of charity to which donations were made Limited data For some retailers in
Wales 2013/14
Costs to national and local government
Administrative costs for implementation/ enforcement for Welsh Government
No - -
Administrative costs for implementation/ enforcement for local government
No - -
Waste stream impacts
Weight per bag Yes,
quantitative - Various
% of SUCBs reused Limited data Yes 2012
% of SUCBs recycled Limited data Yes 2012
% of SUCBs to landfill Limited data Yes 2012
Quantity of additional bags bought by the public to replace carrier bags previously used for holding sports kits, sandwiches, various wastes etc.
Limited data Yes 2012
Costs for waste management
Recycling cost per bag - recyclate revenue per bag
Yes No – UK
wide Current prices
available
Landfill cost per tonne
Landfill tax rates, and
WRAP Gate fee reports
Yes Various
Cost for clearing up bag litter No
Environmental and health impacts
CO2 per bag Yes N/A Various
Shadow price of carbon Yes N/A 2013
Admissions due to E. Coli, salmonella and campylobacter bacteria related to bag reuse (qualitative)
Yes, quantitative
Yes 2013
Change in behaviour relating to other natural resource use (not SUCB) (qualitative)
Limited data Yes 2012
Littering of carrier bags Limited data Yes 2013/14

19
4 Findings – Impact on Consumers 56
57 4.1 As noted in Section 2, a survey of 1,010 consumers living in Wales was 58
undertaken in March of 2015. 59
4.2 As a basis for understanding bag use across a range of different shopping types, 60
the consumer survey first established the proportion of consumers who had 61
undertaken a range of shopping types within the one-month reference period (see 62
Table 4.1 below). For example, 81% of consumers reported having undertaken a 63
large food shop in store at a supermarket in the previous month. The following 64
subsections report the findings for each shopping type separately. 65
66
Table 4.1: How many times had consumers done various shopping activities in the 67
previous month? 68
Shopping activity
Percentage of consumers who had done this shopping
activity
Average number of shops per month16
% N
A large food shop in store at a supermarket
81 3.7
A smaller ‘top up’ shop in store for food items
89 7.1
A large food shop online 12 2.4
Bought non-food items on the high street
66 3.2
Bought non-food items at a retail park/out of town shopping centre
48 2.2
Collected food from a takeaway/restaurant
56 2.6
Base: 1,010 consumers in Wales, March 2015 69
The Use of SUCBs for Food Shopping 70
4.3 As noted above, 81% of consumers reported having undertaken a large food shop 71
in-store at a supermarket in the previous month. Among those consumers who 72
had done a large food shop in store at a supermarket, the average number of 73
such visits was 3.7 per month (i.e. just under one per week). 74
4.4 On their most recent large in-store food shop, 17% of consumers reported using a 75
plastic SUCB, 50% a thick plastic ‘bag for life’ and 49% a canvas, jute or cloth bag 76
16
The averages presented here are among those consumers who have done each shop in the previous month, not all consumers overall.

20
(see Figure 4.1 below). For smaller ‘top up’ shops, plastic SUCBs were used by 77
almost one in three consumers (29%), and similar proportions reported using a 78
thick plastic ‘bag for life’ (33%) and a canvas, jute or cloth bag (31%). 79
80
Figure 4.1: What type of bag did consumers report using the last time they a) went to 81
the supermarket to do a large food shop and b) did a smaller food shop? 82
Base: Consumers who had done each type of shop in the previous month in Wales – large supermarket shop 83 (817); smaller top up shop (889), March 2015 84
85
86
4.5 Among consumers who did a large food shop online, almost two-thirds (63%) 87
reported that they were given the option, when placing their order, to have the 88
food delivered with or without carrier bags. When given this option, half of 89
consumers (50%) reported ordering the delivery with bags and the other half 90
(50%) without bags. 91
The Use of SUCBs for Non-food Shopping 92
4.6 Overall, bag re-use was less prevalent for non-food shops than for food shops 93
(Figure 4.2). On their last non-food shop, around one in three consumers in Wales 94
(36%) reported only using bags they purchased from the shop, compared with a 95
similar proportion (38%) who used bags that they had brought with them.17 A 96
further 15% of consumers brought some of their own bags but supplemented 97
these by purchasing bags from the shop. 98
99
17 The question did not distinguish between SUCBs and bags for life.

21
Figure 4.2: How did consumers report bringing their shopping home the last time 100
they went shopping for something other than food? 101
Base: Consumers who had done a non-food shop in the previous month in Wales (765), March 2015 102 103 104
4.7 A greater proportion of consumers reported that they bought a bag from the shop 105
when undertaking a shop at a retail park (41%) compared with a high street shop 106
(31%) (table not shown). 107
The Use of SUCBs for Takeaways 108
4.8 Among respondents who had collected a takeaway in the previous month, close 109
to two-thirds of consumers (65%) used a plastic SUCB provided by the takeaway 110
and 13% a paper SUCB provided by the takeaway (see Figure 4.3 below). 111
4.9 The topic of ‘bags for life’ being used for takeaways was discussed at the Retailer 112
Focus Group. Participants pointed out that hessian bags do not suit the product 113
as hot food can leave a smell and mess in bags, limiting their reuse. It was 114
pointed out by participants that a trade association for takeaways looked at a 115
specific bag for life with a lining to keep it clean, but that the costs were found to 116
be prohibitive. In addition, it was pointed out that buying a takeaway is often a last 117
minute decision, so customers would not necessarily have bags for life with them. 118

22
Figure 4.3: In what type of bag did consumers report bringing their order home the 119
last time they collected food from a takeaway or restaurant? 120
Base: Consumers who reported having collected food from a takeaway or restaurant in the previous month 121 (566), March 2015 122
123
Consumer attitude to the charge 124
4.10 The findings of this Study suggest that support for the charge had increased since 125
it was introduced, with just over three out of every five (61%) consumers 126
interviewed reporting that they had been in support of the charge prior to its 127
introduction and 74% reporting that they supported it at time of interview (see 128
Figure 4.4 below). It should be noted that this finding relies on consumers having 129
an accurate recollection of their own pre-charge attitude and that, in addition, it is 130
possible that the question may have suffered from some level of ‘social desirability 131
bias’,18 where consumers’ current attitudes may colour their recollection of their 132
past attitude. 133
134
18 Social desirability bias describes the tendency of survey respondents to answer questions in a manner that will be viewed favourably by others. It can take the form of the over-reporting of perceived ‘good behaviour’ or the under-reporting of perceived ‘bad’ or undesirable behaviour.

23
Figure 4.4: Consumer attitude towards the charge: before and after introduction 135
Q13a. Thinking back to before the 5p charge was introduced, to what extent would you say that you supported or opposed it? Would you say that you…?
Q13b. Using the same scale, how do you feel about it now?
Base: 1,011 Consumers in Wales, March 2015 136
137
138
4.11 Almost two out of every three consumers (65%) interviewed agreed with the 139
statement ‘the charge for single use carrier bags discourages me from using 140
them’ (see Figure 4.5 below), while a similar proportion (66%) agreed with the 141
statement ‘the charge has helped to reduce littering in my local authority area’. 142
Nearly half of consumers (45%) agreed with the statement ‘the rules for when you 143
can have a free bag are confusing’. 144
4.12 Some of these attitudinal statements can, however, be compared against a study 145
undertaken by Exodus in Wales in 201219 (tables not shown). These comparisons 146
suggest that there had been no significant change in attitudes over the three 147
years from 2012 to 2015 - there are some minor differences in results but these 148
are within the margin of error. For example, the 2012 study found that 68% of 149
consumers agreed that the charge discouraged them from using SUCBs, a figure 150
that is not significantly different to the 65% found by this Study in 2015. Likewise, 151
the 2012 study found that 41% of respondents agreed that they felt guilty if they 152
took a new SUCB at the till, a figure that is not significantly different to the 44% 153
found by this Study in 2015. 154
19
Consumer behavioural study on the use and re-use of carrier bags 2012, prepared by Exodus Research on behalf of Zero Waste Scotland and the Welsh Government (2012)

24
Figure 4.5: Attitudes towards the charge 155
Q14. To what extent would you say you agree or disagree with the following statements?
Base: 1,011 Consumers in Wales, March 2015 156 157 158 159
4.13 The results of the consumer survey demonstrate that bag use varied by shopping 160
type (Figure 4.6). For example, one in 10 of those consumers (10%) who had 161
undertaken a large food shop in store bought a new SUCB, compared with 20% of 162
those who had done a smaller top up shop, 37% who had done a non-food shop 163
and 76% of those who had collected a takeaway. 164
165
Figure 4.6: The proportion of consumers who reported purchasing a SUCB by type of 166
shop 167
Base: Consumers who reported having done each type of shop in the previous month: large supermarket 168 shop (817); smaller top up shop (889), non-food shop (765); Takeaway (566), March 2015 169
170

25
4.14 Turning to the use of bags for life (see Figure 4.7 below), just over four in five 171
(84%) consumers who had done a large food shop in store reported using a bag 172
for life. One in 20 (5%) said that they did not use bags for life for this type of shop 173
and 11% reported having bags for life at home but said that they tended to forget 174
them when doing a large food shop in store. For smaller ‘top up’ food shops, the 175
proportion of consumers who reported using a bag for life on their last shop was 176
three in five (60%), and for non-food shops it was close to two in five (43%). 177
178
Figure 4.7: The proportion of consumers who reported using a bag for life by type of 179
shop 180
Base: Consumers who reported having done each type of shop in the previous month: large supermarket 181 shop (816); smaller top up shop (889); non-food shops (765), March 2015 182 183 This graph combines results from different questions to present bag for life re-use across the different 184 shopping types. 185 186
To what extent were consumers charged for SUCBs? 187
4.15 One in three consumers (33%) reported that they had been given a carrier bag in 188
Wales without being charged for it during the previous year (Figure 4.8). Of the 189
337 consumers who were not charged, 31% reported that this happened at a 190
corner shop, local greengrocer, butcher or fishmonger, 28% at a takeaway and 191
15% at a clothing or shoe shop. When asked, none of the respondents said that 192
they had reported the incident. 193

26
Figure 4.8: To what extent and for which types of shops did consumers report not 194
being charged for SUCBs? 195
Q16. Over the last year, do you remember visiting any shops in Wales where you were given a carrier bag but were not charged for it? This could be any type of shop, including supermarkets, high street shops, market or festival stalls, takeaways and food outlets.
Q17a. Was it any of the following types of shop(s), or another type?
Q16 Base: 1,011 Consumers in Wales, March 2015 196 Q17a Base: Consumers who reported being given a carrier bag in Wales but not charged for it (337), March 197 2015 198
199
Bag re-use and disposal 200
4.16 One in four (25%) consumers reported that they typically re-used plastic SUCBs 201
once, and almost one in three (32%) re-used them 2-3 times (Figure 4.9). Close to 202
one in 10 (11%) reported that they re-used them 11 or more times. Consumers 203
who used plastic SUCBs reported re-using them on average at least 3.6 times.20 204
However, these figures highlight a limitation of this Study: the largest category that 205
consumers could report was 11+ times. This category was chosen in 206
acknowledgement of the fact that consumers would be unlikely to be able to 207
accurately estimate the number of occasions on which they had used individual 208
SUCBs once they had used them in excess of 10 times. However, with no 209
maximum to the range, the figure of 11 was used to calculate the average number 210
of times bags were re-used, which means that the estimate is an underestimation. 211
However, the extent to which the figure is an underestimation is likely to be 212
relatively limited in the case of plastic bags (where a small proportion – 11% - 213
chose the 11+ category) and extremely limited in the case of paper bags (where 214
20
This average calculation is based only on those who use this bag type, i.e. excluding anyone who says they do not use it. It also uses mid-points where a data range is given e.g. 4-5 and the mid-point for the top category of 11+ is taken to be 11).

27
only 1% chose this category). Therefore, the impact on the overall average 215
calculation is likely to be small. 216
4.17 In contrast, re-use of paper SUCBs was reported to be less common – among 217
those who had used/received them, two in five (40%) said that they never re-used 218
them, while almost one in three (32%) said that they had been re-used once. 219
Consumers who used paper SUCBs reported re-using them on average at least 220
1.3 times. 221
222 Figure 4.9: How many times did consumers typically report re-using SUCBs before 223
disposal? 224
Base: Consumers in Wales who reported using each type of bag, excluding respondents who said ‘never use’ 225 or ‘don’t know’ – plastic carrier bags (825); paper carrier bags (420), March 2015 226 227
228
4.18 Bags for life were reportedly re-used more often than SUCBs (Figure 4.10). 229
Around one in three consumers (32%) reported that they had re-used thick plastic 230
bags for life 50+ times, and over three-quarters (76%) reported that they had re- 231
used a canvas, jute or cloth bag 50+ times. The average number of re-uses was 232
25.5 for thick plastic bags for life and 43.6 for canvas, jute or cloth bags for life. 233
However, these figures highlight a limitation of this Study: the largest category that 234
consumers could report was 50+ times. This category was chosen in 235
acknowledgement of the fact that consumers would be unlikely to be able to 236
accurately estimate the number of occasions on which they had used their bags 237
once they had used them in excess of 50 times. However, with no maximum to 238
the range, the figure of 50 was used to calculate the average number of times 239
bags were re-used, which means that the estimate is an underestimation. Unlike 240
for SUCBs, where the margin of the underestimation is likely to be very small 241
(given the small proportion of responses falling into the top category), here the 242
underestimation is likely to be large because of the higher proportion of responses 243
in the top 50+ category. This is especially the case for canvas, jute or cloth bags 244
for life. 245

28
4.19 To bring re-usable bags below the global warming potential of SUCBs, the 246
Environment Agency’s Life Cycle Assessment (LCA) (2011)21 found that 247
compared with standard SUCB High Density Polyethylene(HDPE) bags 248
(containing no recycled content) thick plastic bags for life (low density 249
polyethylene (LDPE)) needed to be re-used four times, non-woven polypropylene 250
bags 11 times and cotton bags 131 times . 251
4.20 This Study is able to conclude, based on the self-reported behaviour found in the 252
consumer survey, that thick plastic ‘bags for life’ were being re-used on average 253
on at least twice the number of occasions required to offset the global warming 254
potential of SUCBs. 255
4.21 On the basis of the consumer survey findings, the authors estimate that canvas, 256
jute or cloth bags for life were being re-used on average at least 43.6 times. The 257
most direct comparator within the Environment Agency’s study was cotton bags, 258
which need to be used significantly more than this (131 times) to offset the global 259
warming potential of SUCBs but, as noted above, the average estimation for this 260
Study is known to be an underestimation. 261
262
Figure 4.10: How many times did consumers typically report re-using bags for life 263
before disposal? 264
Base: Consumers in Wales who reported using each type of bag, excluding respondents who said ‘never use’ 265 or ‘don’t know’ – Bags for life – thick plastic (848); bags for life – canvas, jute, cotton (773), March 2015 266
267
268
4.22 The way in which consumers disposed of their bags varied according to the type 269
of bag (Figure 4.11). Seven in 10 consumers (70%) who used/received paper 270
SUCBs reported recycling them. A total of 44% of those who used plastic SUCBs 271
reported recycling them, whilst a similar proportion (43%) said that they put plastic 272
21
Environment Agency (2011) Life cycle assessment of supermarket carrier bags: a review of the bags available in 2006. [Online]. Available at: https://www.gov.uk/government/uploads/system/uploads/attachment_data/file/291023/scho0711buan-e-e.pdf

29
carrier bags in the general rubbish - this may be due to the fact that plastic bags 273
are not accepted by many kerbside recycling schemes. 274
275
Figure 4.11: How did consumers report disposing of different types of bag? 276
Q8a/b. When a [BAG TYPE] wears out or gets old, what do you do with it?
Q10a/b. What do you do with a [BAG TYPE] when you dispose of it?
Base: Consumers who reported using each type of bag: bags for life – thick plastic (848); bags for life – 277 canvas, jute, cloth (773); plastic carrier bags (825); paper carrier bags (420), March 2015 278
279
280
4.23 It had been theorised that SUCBs were being re-used as bin liners and for other 281
purposes. The survey therefore explored whether consumers had found 282
themselves buying, or buying more of, any other types of bags since the charge 283
was introduced. Over half (56%) of respondents reported that they had not either 284
bought or bought more of any other type of bag (see Figure 4.12 below). 285
However, 43% of respondents reported that they had bought or bought more of 286
other types of bag, with canvas, jute or cotton bags for life being bought by 62%, 287
thick plastic bags for life purchased by 60% and bin liners by 1%. 288
4.24 WRAP conducted research (published in 2013)22 to assess the effect of charging 289
for carrier bags on bin-bag sales in Wales. The study found that from the 290
introduction of the SUCB charge in October 2011 to the end of the study in June 291
2013, there was an increase in the sales of pedal-bin and swing-bin liners in 292
Wales compared to the data for Great Britain as a whole. This suggests that 293
some people in Wales were using SUCBs as bin liners prior to the charge being 294
introduced. The study reported that in 2012, the uplift in pedal-bin and swing-bin 295
liners sold in the seven grocery retailers that provided data for the report, was 296
22
WRAP webpage. ‘Effect of charging for carrier bags on bin-bag sales in Wales’. Available at: http://www.wrap.org.uk/node/18514

30
around 4% (by number or weight) of the reduction in SUCBs. However, the study 297
also reports that if other changes in SUCB usage were included (i.e. those 298
associated with approximately 20% of the grocery retail market and other non- 299
grocery sectors not covered by the Study), the uplift in sales would have been 300
comparatively smaller. No increase was found for other types of bin bags, 301
including refuse bags and nappy sacks. 302
4.25 It is not possible to directly compare the results of this Study to those of the 303
WRAP report, as the estimates provided by this Study are based on self-reported 304
information about consumer behaviour and the WRAP study is based on bag 305
sales information from retailers. However, the authors feel it is safe to conclude 306
that both studies found a limited impact on bin liner sales. 307
308
Figure 4.12: The impact of the charge on consumer purchase of other types of bag 309
Q12a. Since the charge for carrier bags was introduced, have you found yourself buying, or buying more of,
any other types of bags?
Q12b. Which bags do you buy more of since the introduction of the carrier bag charge?
Q12a Base: 1,011 consumers in Wales, March 2015 310 Q12b Base: Consumers who reported buying, or buying more of, other types of bags in response to the 311 charge (567), March 2015 312 313
The impact of the SUCB charge on SUCB purchase 314
4.26 The survey demonstrated the impact of the charge on SUCB use for food 315
shopping (Figure 4.13). Over one-third of consumers (35%) reported that they had 316
stopped taking SUCBs altogether since the charge was introduced and a further 317
42% of consumers reported that they took fewer SUCBs than before the charge 318
was introduced. 319
320

31
Figure 4.13 What impact has the charge had on the number of SUCBs taken by 321
consumers when buying their main food shop? 322
Q11. Since 2011, shops in Wales have been required to charge 5p per bag to customers that want or need a single use carrier bag. Thinking about your main food shopping, how has the number of single use carrier bags that you take from the supermarket changed as a result? Do you…?
Base: 1,011 consumers in Wales, March 2015 323
324
The possible impact of increasing the SUCB charge 325
4.27 The survey explored the potential impact of increasing the level of the charge to 326
10 pence per bag and to 20 pence per bag. Only respondents who reported still 327
using SUCBs were asked the question, and the question was randomised so that 328
half of the respondents were asked about an increase to 10 pence and half about 329
an increase to 20 pence. The results show that both increases would be likely to 330
have an impact on SUCB purchase (Figure 4.14). With an increased charge of 10 331
pence, 42% of respondents reported that they would buy fewer SUCBs and 13% 332
said that they would stop buying SUCBs altogether. With a 20 pence charge, 57% 333
of respondents said that they would buy fewer SUCBs and 23% said that they 334
would stop buying SUCBs altogether. 335
336
337
338
339

32
340 Figure 4.14 What might the impact be of increasing the bag charge? 341
Q15a. We are interested in finding out what kind of impact it would have on the amount of single use carrier bags people would buy if the charge was increased. If the carrier bag charge was increased to [10/20p], would you be likely to buy more, fewer or about the same amount of bags when you do your main food shop?
Base: Consumers who had not stopped taking SUCBs altogether when doing a large food shop (605), split 342 into two samples – Sample X testing 10 pence (299) and Sample Y testing 20 pence (306), March 2015 343 344
345
4.28 The majority of retailers issuing SUCBs to their customers in Wales reported that 346
the charge had led to a decrease in the number they needed to provide (Figure 347
4.15). Three-quarters (75%) of those who issued single use plastic bags reported 348
a decrease since the charge was introduced, as did 77% of retailers who issued 349
single use biodegradable/starch bags and 47% of retailers who issued single use 350
paper bags. A small number of retailers reported that the charge had led to an 351
increase in the number of SUCBs they issue to customers: the actual numbers 352
were five retailers who issued plastic bags and two retailers who issued paper 353
bags; there was no pattern in terms of the kind of retailer reporting an increase. 354
4.29 The reduction in the use of SUCBs reported above was supported by the findings 355
from the retailer focus group, with all of the participants reporting a considerable 356
decline in the number of SUCBs provided after the charge was introduced. There 357
was general agreement among participants that the number of SUCBs issued had 358
decreased and the figures quoted were between an estimated 85% and 96%. 359
However, some retailers felt that, following the initial reduction in SUCB use since 360
the charge was introduced in 2011, there had been a slight increase in more 361
recent years. 362

33
Figure 4.15 Impact of the charge on the number of bags issued to customers 362
Q4. How has the amount of [ADD BAG TYPE] that your business provides to customers in Wales changed since the introduction of the charge in 2011? Would you say it has…?
Base: Retailers offering each type of SUCB to customers: plastic bags (427); paper bags (109); 363 biodegradable/starch (40); re-usable bags (35), February/March 2015 364
365
Economic Evaluation 366
Impacts on bag demand 367
4.30 The key determinant of the success or failure of the policy was always going to be 368
the extent to which the 5 pence charge was a sufficient incentive to change 369
consumer behaviour and shift demand away from SUCBs to re-usable 370
alternatives. Therefore, the key aim of this evaluation was to gather primary 371
information on bag demand profiles (estimated bag consumption) across the 372
evaluation period with particular reference to how demand is estimated to have 373
shifted as a result of the policy. 374
4.31 As noted in the methodology section (see Section 2 above), modelling was 375
required based on primary information (new evidence gathered specifically for this 376
project via surveys) to develop bag demand profiles for the evaluation. 377
Specifically, the bag demand profiles developed were based on the results of the 378
retailer survey. Data collected included the estimated number of bags issued24 by 379
each retailer, split by type of bag and by retailer size (number of employees). 380
These figures per retailer type and size were then multiplied by the number of 381
retailers in Wales to provide an estimate of the total number of bags issued within 382
the Welsh economy within the time-frame of the evaluation. 383
384
24
Retailers were asked to estimate the approximate number of bags issued against a set of pre-coded ranges.

34
386
4.32 For chain supermarkets, a slightly different strategy was employed. To avoid the 387
risk that chain retailers could be double counted by the survey, only one shop for 388
a given retail chain was surveyed. In addition, questions were phrased specifically 389
to ask about the number of bags sold across all shops within the chain in Wales. 390
The primary data gathered through the survey was combined with WRAP (carrier 391
bag) data available for the period 2011 to 201324 from seven of the leading 392
supermarket chains that were not included in the survey. The two datasets were 393
combined as a direct sum of the bag numbers estimated from the retailer survey 394
plus the bag numbers for supermarkets from the WRAP data. Although the final 395
figures do not therefore include all large supermarkets, the approach taken in 396
combining the two datasets was the best available solution that would provide a 397
best estimate of bag use in Wales, albeit it is likely to represent a slight 398
underestimation of bag sales. It should be noted that this underestimation will be 399
reflected, in turn, in a slight underestimation of the charitable donations and 400
environmental benefits generated as a result of the policy’s implementation. 401
4.33 To assess changes in bag demand between October 2011 and January 2015, 402
retailers were asked the extent to which the number of bags issued had increased 403
or decreased since the charge was introduced. Retailers were asked to estimate 404
the magnitude of the change against a set of pre-coded ranges. The highest and 405
lowest values for the ranges were used to develop scenarios of bag demand 406
ranging from high to low plus a medium ‘best estimate’ figure. Scenarios reflecting 407
high, medium and low estimates of bag demand (based on modelling separate 408
scenarios reflecting the upper and lower ranges for the variables used in the 409
calculation), and counterfactual (business as usual (BAU)) (estimated as 410
explained in Paragraph 2.38) scenarios are presented in Figures 4.16a to Figure 411
4.16d, below. 412
4.34 Figures 4.16a to 4.16d show the demand profiles for 2011 to 2015 (calendar 413
years) for a range of bag types and shows that SUCB bag usage is significantly 414
lower than the counterfactual or BAU scenario (for the figures, please see 415
Appendix 5). Although the results indicate that SUCB use increased between 416
2012 and 2015 (this can also be seen in Figure 4.17), the results also show that 417
the demand for bags for life (plastic and fabric) has increased compared to the 418
counterfactual or BAU scenario. Please note that for bags for life, there is less 419
divergence across the low, medium and high scenarios i.e. the lines appear close 420
together; this is because there was less variation for bags for life than for SUCBs 421
when retailers were asked to estimate the change over time in the numbers of 422
bags used. 423
424
425
24 WRAP webpage. ‘Effect of charging for carrier bags on bin-bag sales in Wales’. Available at; http://www.wrap.org.uk/node/18514

35
Figure 4.16a: Estimated demand profiles, trends from 2011 and 2015 by bag type: 424
Single Use Carrier Bags - Plastic 425
426
427
428
Figure 4.16b: Estimated demand profiles, trends from 2011 and 2015 by bag type: 429
Single Use Carrier Bags - Paper 430
431
432
Figure 4.16c: Estimated demand profiles, trends from 2011 and 2015 by bag type: 433
Bags for Life - High Density Plastic Bags 434
435

36
Figure 4.16d: Estimated demand profiles, trends from 2011 and 2015 by bag type: 436
Bags for Life - Canvas Bags 437
438 439
440
4.35 Estimated changes in bag demand are presented by sector (food and drink, non- 441
food and drink and takeaways) between 2011 and 2014 in Figure 4.17 below. 442
The graph shows that the food and drink sector is responsible for most of the 443
bags issued across all years of the evaluation, with the annual share ranging from 444
a high of 91% in 2011 to a low of 85% in 2012. The majority of the food and drink 445
retail bags were issued by supermarkets. The remaining bags issued were split 446
fairly equally between the non-food and drink and takeaway sectors. 447
448
Figure 4.17: Estimated SUCB demand by sector between 2011 and 201426 449
450
451
26
Note: Bag demand for 2011 appears significantly higher than other years because 2011 figures represent a full year of estimated bag demand, including the period before the policy was implemented. This figure presents annual data based on the results of the retail survey and WRAP supermarket data for SUCBs. Fieldwork was completed in early 2015, and thus no full year’s worth of data was available for 2015.

37
4.36 The results of the bag demand profile modelling shown in Figure 4.16a to Figure 454
4.16d, above, demonstrate that in all cases the 5 pence charge (i.e. fiscal element 455
of the policy) has had the desired effect on bag demand (for the figures please 456
see Appendix 5). In the case of the overall best estimate (medium) scenario 457
developed as part of this Study, it is estimated that from a starting point of 375 458
million carrier bags (all types) in 2011 (which includes data for the period before 459
the charge was introduced in October 2011), the consumption of all bag types 460
reduced by 57% between October 2011 to January 2015. It should be noted that 461
the total reduction is likely to be higher as the baseline figure for 2011 is likely to 462
be an underestimation because the figure relates to the full calendar year but the 463
charge was introduced in October 2011. The results also show an estimated 464
reduction of 70% in the consumption of SUCBs (the key target for this policy) 465
between October 2011 and January 2015 (Figure 4.16a to Figure 4.16d). In 466
comparison, the RIA estimated a baseline figure of 445 million SUCBs per annum 467
and modelled an estimated reduction of 59% over a 15-year period. 468
4.37 The reduction in demand estimated above will have led, in turn, to reductions in 469
the negative environmental and social effects associated with the production and 470
consumption of SUCBs. 471
4.38 The reduction in the use of SUCBs of 70% estimated by this Study for the period 472
of October 2011 to January 2015, is significantly higher than the estimate of 59% 473
the RIA estimated might take place over a 15-year period. Therefore, it would 474
appear that the Welsh implementation has been more effective than expected in 475
changing consumption habits. 476
4.39 It is important to highlight that although based on new primary research in the 477
form of the retailer survey, the estimates presented in Figures 4.16a to d are still 478
only modelled estimates derived from a sample of retailers. Therefore, the figures 479
provided are representative only of the estimated range of impacts with central 480
‘best estimate’ figures utilised to conduct the impact analysis. Therefore although 481
bag demand profiles provide the range of estimates for overall impacts variables, 482
such as price per bag and number of re-uses are maintained as central estimates 483
across all three scenarios. These variable factors are later sensitivity tested 484
however to ascertain the impact of their variability on the overall results of the 485
evaluation. 486
Impact on consumer utility and expenditure 487
4.40 The RIA estimated the value of potential consumer benefits to be between £21 488
million and £32 million per annum. 489
4.41 This evaluation has estimated the net effect on consumers of the SUCB charge. 490
Two impacts on consumers are assumed to result from the implementation of the 491
5 pence charge: the increase in expenditure on bags (whether SUCBs or bags for 492
life) by consumers, and the change in overall utility derived by consumers from 493
using bags (i.e. the value that a consumer places on using a particular type of 494

38
bag, for example, based on its convenience, strength or attractiveness). For 495
example, a consumer may value a textile bag above that of a single use plastic 496
bag due to the aesthetic look and the potential to use it in multiple circumstances. 497
These impacts may represent an overall benefit or cost depending on the sum of 498
the impacts across all individual consumers, taking into account the modelled 499
shifts in demand for different bag types over time. 500
4.42 In terms of expenditure, the implementation of the 5 pence charge and shifting 501
between bag types was expected to have an impact on spending by consumers 502
on bags. Firstly, where consumers continue to use SUCBs, they would have to 503
pay 5 pence for each bag. Secondly, where consumers shifted from SUCBs to re- 504
usable bags, they would have to pay the price of a re-usable bag. The net impact 505
will be the sum of the total spent on bags under the ‘with charge’ scenario (taking 506
into account shifting between bag types), compared with the total spent on bags 507
under the counterfactual (i.e. no charge introduced). 508
4.43 Even though a change in expenditure represents a real impact on consumers, 509
these monetary flows act as transfer payments26 shifting money between 510
economic operators27 rather than creating additional value: for example, where 511
consumers were charged 5 pence for a SUCB, this is a cost to the consumer of 5 512
pence but provides additional revenue to good causes of up to 5 pence. However, 513
because the economic evaluation has been undertaken from the perspective of 514
society as a whole, these effects are considered to cancel each other out without 515
generating additional value, so are not included in the final net impact. 516
4.44 The introduction of the SUCB charge was intended to provide an incentive to 517
switch to use re-useable bags. However, these incentives relate only to the 518
scenario where the 5 pence charge has been implemented and not to the 519
counterfactual ‘without charge’ scenario. 520
4.45 In order to calculate the magnitude of the incentive to consumers, we can look at 521
the number of times, on average, consumers reported re-using bags for life of 522
various kinds. For example, the survey data demonstrated that on average bags 523
for life were re-used at least 14 times more than SUCBs. It is therefore inferred 524
that one bag for life replaces the need to buy (at least) 14 SUCBs. Once the 5 525
pence charge was implemented, there was therefore a significant incentive arising 526
from switching to using one bag for life in the place of 14 SUCBs (assuming the 527
carrying capacity is the same). The difference between the cost of a single bag for 528
life and the cost of 14 SUCBs (at a price of 5 pence each) is therefore estimated 529
to be at least 43 pence per additional average re-usable bag bought (i.e. the 70 530
26
Transfer payments being the movement of money between people and businesses without any additional value (as either money or products) being generated. So for example, moving 5 pence from the consumers’ pocket to a charitable organisation is only a transfer unless that 5 pence is used to generate greater than 5 pence in value for the economy via the NGO’s activities. 27
Economic operators being all actors within the economy, including consumers, businesses, third sector organisations and government agencies.

39
pence cost of 14 SUCBs minus the 28 pence average cost of a bag for life). This 531
is based on the average cost of a bag for life purchased, which has been 532
weighted in line with the proportional split of bag for life type and price. It is worth 533
repeating that the way this Study asked respondents to record the number of 534
times bags for life of different kinds were re-used included a final range of ‘over 535
(e.g. 50 times)’, so that the incentive for switching to bags for life is likely to be an 536
underestimation. However, the fact remains that a net incentive exists for 537
consumers to switch to re-useable bags. 538
4.46 However, in exploring the element of consumer benefits, this Study has revealed 539
the complexity of consumer behaviour, which was also noted in the original RIA. 540
Some consumers reported that they continued to use SUCBs after the 541
introduction of the charge, even when it was more financially beneficial to use re- 542
usable bag types. Hence, the decision of which bag type to use was clearly not 543
purely a financial one. Consumers may forget to take their bags shopping or may 544
also take into account the utility or value they gained from using different bag 545
types,28 comparing this value to the price of each type of bag in order to select the 546
best option for them in a given situation. Further information on the approach to 547
monetising the value of utility is provided in Appendix 4. 548
4.47 The net impact of the charge on consumers depended on the net change in 549
expenditure and the net change in utility, summed across all consumers, between 550
the ‘with charge’ and ‘without charge’ (i.e. counterfactual) scenarios. As an 551
illustration, based on bag demand profiles for 2014, it is estimated that consumers 552
paid a total of £17 million for carrier bags (with £6 million of this going to charity) 553
versus a cost of approximately £4.5 million if no charge was in place; an overall 554
shift of £12.5 million. Therefore consumers would have to gain a net improvement 555
in utility from the switch to re-usable bags valued at least £12.5 million in order for 556
the net impact on consumers to be positive. The results presented in Figures 4.18 557
and 4.19 illustrate an estimated cumulative net benefit to the population29 of 558
between £0.5 million (high scenario) and £4.1 million (low scenario) for the period 559
October 2011 to January 2015 as a result of some consumers using fewer 560
SUCBs. These net benefits to consumers represent only the change in utility 561
value to consumers (expenditure has been excluded as it is a transfer between 562
economic operators)26 27 and, in order to act as a direct comparator, have been 563
estimated based on methodologies developed for the RIA.30 The RIA method 564
28
That is the value that a consumer places on using a particular bag, for example, based on its convenience (having to remember it for every shop), strength or attractiveness. 29
Taking into account the fact that some consumers still pay the charge and use SUCBs.
30 Welsh Government (2010) Regulatory Impact Assessment on the proposals to introduce a single use
carrier bags charge. [Online]. Available at: http://gov.wales/topics/environmentcountryside/epq/waste_recycling/substance/carrierbags/regulatory-impact-assessment/?lang=en

40
estimates the utility benefit associated with the combined effects of SUCB 563
reduction and switching to bags for life. 564
565
Figure 4.18: Annual net costs or benefits associated with the change in consumer 566
utility with the introduction of the charge 567
568 569
Figure 4.19: Cumulative consumer utility costs and benefits versus the baseline (no 570
charge implementation) as a result of policy implementation 571
572 573
4.48 In conducting this analysis, various assumptions were made regarding consumer 574
behaviour e.g number of times on average each bag type is re-used and the 575
relative lifetime cost differential (difference in the cost of bags taking into account 576
the number of re-uses) between bag types, and as such this analysis is sensitive 577

41
to variations in these factors . As such, variables that influence this have been 580
sensitivity tested to establish how they may alter the outcomes of the impact 581
analysis for this measure. Further details of the sensitivity analysis31 are 582
presented in Appendix 4. 583
4.49 However, even though the overall monetary value of the net impact on consumers 584
is sensitive and difficult to quantify, it is an important effect since as noted above, 585
the RIA32 estimated the value of this benefit to be between £21 million and £32 586
million per annum. This evaluation suggests that the RIA estimate of potential 587
consumer benefits may have been an overestimation however, estimating annual 588
impacts for 2013 and 2014 of around £1.5 million. 589
4.50 The difference between the net impacts estimated in the RIA and in this Study 590
arises due to two factors: firstly, differences in the price assumed for bags for life 591
and secondly, differences in the estimated uptake of bags for life. 592
4.51 In the RIA, the average cost per bag for life was estimated to be 16 pence per bag 593
versus a figure 28 pence per bag estimated by this Study (calculated average of 594
reported bag sales). This difference means that although the extent to which bags 595
were re-used assumed by the RIA and as reported by this Study was found to be 596
similar (ratio of one SUCB to 14 re-usable bags), the benefits to consumers per 597
bag for life bought are significantly lower in this Study, resulting in the reduced 598
overall positive impact. 599
4.52 A difference in the rate of uptake and substitution also explains the net loss of 600
utility in 2012 as modelled for this Study. As can be seen in Figures 4.18 and 601
4.19, as consumers shifted rapidly away from SUCBs in the 2011 and 2012 602
period, uptake in demand of bags for life developed more slowly. The benefits 603
accrued from greater bag for life use therefore only begin to outweigh the lost 604
utility from reducing demand for SUCBs from 2013 onwards. 605
4.53 As a result of the reduced net impact on consumers estimated for this Study, 606
when the negative impacts of lost consumer convenience in reduced SUCB use 607
are subtracted, the net impact on consumers has been estimated to be of a lower 608
order than initially projected in the RIA. 609
4.54 However although differing in magnitude, the overall direction of the estimated 610
benefit is the same in both the RIA and this Study. 611
4.55 In order to test whether the charge had the effect of increasing consumer 612
knowledge and understanding of the rationale for the charge, the evaluation 613
assessed how the demand for bags has developed over the period. Where 614
consumers better understood the environmental and social costs associated with 615
31
Sensitivity analysis is detailed in section 2.44 32 Welsh Government (2010) Regulatory Impact Assessment on the proposals to introduce a single use carrier bags charge. [Online]. Available at: http://gov.wales/topics/environmentcountryside/epq/waste_recycling/substance/carrierbags/regulatory-impact-assessment/?lang=en

42
using SUCBs, the authors theorised that this would translate into a sustained 616
trend in reducing SUCB sales (or at least a growth rate that is below that 617
anticipated in the counterfactual scenario) over the evaluation period. It was 618
theorised that consumers would respond instantly to a change in price, but that 619
changes in behaviour (in response to greater knowledge) may take more time to 620
materialise. As such, any change in bag demand after the first few months could 621
be attributed to changing knowledge rather than a fiscal signal. 622
4.56 As discussed previously, following the introduction of the charge in October 2011 623
and the initial substantial drop in bag demand, there was a growth in SUCB sales 624
over the following years from 2012 to 2014. This is the opposite of what we would 625
expect if the theory set out in Paragraph 4.54 was correct. The growth rate of 626
demand for bags after the first year under the ‘with charge’ scenario was 627
estimated to be 14% above that of the counterfactual sales volume growth of 2%. 628
Although the evaluation only represents three years of data, if this trend in 629
familiarisation with the charge were to continue then the benefits of the policy in 630
reducing SUCB use could be gradually eroded, as the difference in the demand 631
for bags narrows between the ‘with charge’ and counterfactual scenario. However, 632
as this happens at least the 5 pence charge now applied to bag purchases 633
should, to some extent, cover the externalities associated with the environmental 634
damages caused by the production and consumption of SUCBs. 635
636

43
5 Findings – Impacts on Retailers 637
5.1 Almost two in three retailers issuing SUCBs to consumers in Wales that took part 638
in the survey (65%), said that the charge has had a neutral impact on their 639
business (Figure 5.1). Just over one in five retailers (22%) said that the charge 640
has had a positive impact, while 13% said the charge has had a negative impact. 641
5.2 There are some differences in the reported impact of the charge across retailers. 642
For example, a greater proportion of retailers with a turnover of more than 643
£200,000 per annum reported that the charge had a positive impact (31%), 644
compared with those with a turnover of less than £200,000 per annum (16%). By 645
contrast, there was little variation in opinion by the retail sector, with the balance 646
of positive/negative responses similar across food and drink retailers, non-food 647
and drink retailers and takeaways. 648
649
Figure 5.1: What impact do retailers say the charge has had on them, overall? 650
Q16. Taking everything into account, which of the following would you say best describes the impact on the business of charging for all single use carrier bags?
Base: All retailers issuing SUCBs (504), February/March 2015 651
652
653
5.3 Feedback about the SUCB charge received via the retailer focus group was 654
generally positive, with many reporting that business costs had reduced as a 655
result of the charge as fewer bags were being purchased. An example of this was 656
where previously they would have purchased a range of different bag sizes, they 657
now felt able to limit the different sizes of their bags to one or two. It was also 658
noted that there was a difference of opinion regarding the quality of bags with one 659
attendee saying the quality and size have remained the same, before and after 660
the charge, whilst another highlighted that a better quality of bag was now 661
supplied, as the retailer believed that customers expected a better quality bag as 662
they were now paying for it. 663

44
5.4 Turning to the perceived benefits and disadvantages of the charge to retailers, 664
survey respondents were initially asked about these unprompted and in both 665
cases the most commonly cited response was ‘none’ – 46% of retailers reported 666
that they experienced no benefits to their business (Figure 5.2), while 59% 667
reported that they experienced no disadvantages to the business (Figure 5.3). 668
This reflects the response reported above in Figure 5.1, where retailers reported 669
the charge having a largely neutral impact. 670
671
Figure 5.2: What are the perceived benefits of the charge? 672
Q17. In what ways, if any, would you say the charge has benefited the business?
Base: All retailers issuing SUCBs (504), Feb/March 2015 673
674

45
Figure 5.3: What are the perceived disadvantages of the charge? (unprompted) 675
Q18. In what ways, if any, would you say the charge has been a disadvantage to your business?
Base: All retailers issuing SUCBs (504), February/March 2015 676
677
5.5 When asked, unprompted, about the benefits of the charge, the answer given by 678
the greatest proportion of retailers (23%) was that it saved them money on bag 679
purchases, followed by those who said it was good for the environment (16%) and 680
generated money for charity (13%). Just over one in 10 (11%) identified the 681
benefit of less waste and one in 20 (5%) cited less litter. 682
5.6 Turning to the disadvantages, the most common issue related to customer 683
unhappiness/complaints – cited by 27% of retailers issuing SUCBs in Wales. 684
Aside from this issue, the remainder of the disadvantages that were identified 685
were raised by 7% or less of respondents. 686
5.7 The survey also explored five issues by directly prompting them – shoplifting, 687
customer satisfaction, the cost of supplying bags, litter and any costs the retailer 688
has to pay in respect of cleaning up litter around their premises. 689
5.8 The results (Figure 5.4) largely confirm the neutral or slightly positive impact of the 690
charge. For example, 92% of retailers said that the introduction of the charge had 691
no impact on levels of shoplifting (versus 4% who reported that it had led to an 692
increase, 1% who said it has led to a decrease, and 3% that didn’t know). On the 693
subject of litter, around four in five (78%) reported no change, 12% a decrease, 694
5% an increase and 5% that didn’t know. The most positive impact on retailers 695
issuing SUCBs is in respect of the cost of supplying bags - 42% reported that the 696
cost had decreased since the introduction of the charge (versus 4% who said that 697
the cost had increased, 50% who said that there had been no impact and a further 698
4% that didn’t know). 699

46
5.9 The issue of shoplifting was raised in the retailer focus group. Retailers recalled 700
that in the past, if someone walked into a shop with a bag for life they would 701
assume there was the possibility that they could be a shoplifter. As a result of the 702
charge this type of identification has become increasingly difficult. 703
Figure 5.4: What impact has the charge had on key issues? 704
Q19.Thinking about the impact that the introduction of the bag charge in 2011 has had, would you say it caused an increase, decrease or has had no impact on …
Base: All retailers issuing SUCBs (504), February/March 2015 705 706 707
5.10 The research suggests the charge has been well administered (Figure 5.5). For 708
example, four in five retailers issuing SUCBs (80%) agreed with the statement ‘the 709
rules of the charge have been communicated clearly to retailers’, compared with 710
18% who disagreed (whilst the other 2% of respondents did not have a view on 711
this issue or didn’t know). Furthermore, over nine in 10 (92%) agreed with the 712
statement ‘we are very clear about our responsibilities under the scheme’. 713
Retailers issuing SUCBs in Wales also appear comfortable with the enforcement 714
regime – over four in five (84%) agreed with the statement ‘the charge has been 715
enforced appropriately’. 716
5.11 Results from the retailer focus group also supported this; the group reported that 717
the SUCB charge awareness campaign was consistent across all types of goods 718
and shops, with a consistent marketing approach. Therefore, consumers 719
understood what was happening and were prepared before the charge was 720
introduced. Feedback from the focus group highlighted that some shops continue 721
to display the posters as a reminder for tourists visiting Wales. 722
723

47
Figure 5.5: What impact has the charge had on key issues? 724
Q19.Thinking about the impact that the introduction of the bag charge in 2011 has had, would you say it caused an increase, decrease or has had no impact on …
Base: All retailers issuing SUCBs (504), February/March 2015 725
726
5.12 Retailers reported spending relatively little time administering the charge in the 727
past year. Over half (58%) said that they had spent no additional time 728
administering the charge over the past year, while a further 27% said that they 729
have spent one day or less. 730
5.13 It is worth noting that retailers who attended the focus group stated that the 731
importance of staff training should not be underestimated, as they have the 732
responsibility to communicate the charge to customers. It was identified that 733
initially there had been some staff reluctance to promote the scheme. 734
5.14 With regards to the charge moving forward, the majority of retailers issuing 735
SUCBs in Wales – close to three-quarters (74%) – said that they were happy to 736
see the charge continue as it is (Figure 5.6). A further 14% said that they were 737
happy but would like to see some changes, while around one in 10 (9%) said that 738
the charge should be removed. 739
48
Figure 5.6: What do retailers think about the charge going forward? 740
Q23. Thinking about the charge going forward, which of the following statements is closest to your view?
Base: All retailers issuing SUCBs (504), Feb/March 2015 741
742
5.15 Among those retailers who agreed that that they were ‘…happy for the charge to 743
continue, but would like to see some changes’, the most requested change was 744
for additional exemptions for certain kinds of retailers (cited by 45% of this group). 745
Other propositions included charging for only plastic SUCBs (18%), providing 746
more information for retailers (15%) and more information for consumers (10%). 747
Economic Evaluation 748
5.16 The implementation of the policy has had three key impacts on the balance sheet 749
of retailers: changes (likely increases) in revenues associated with bag sales (now 750
including SUCBs sold with a 5 pence charge), changes in costs of purchasing 751
bags from wholesalers, and the cost of charitable donations. However, these 752
financial flows act as transfer payments redistributing money between economic 753
operators: for example, where a consumer now pays 5 pence for a SUCB, this is 754
a cost to the consumer of 5 pence and a benefit to the retailer of 5 pence. Hence 755
given this economic evaluation has been undertaken from the perspective of 756
society as a whole, these effects were considered to cancel out without 757
generating additional value or an overall net effect to the economy or society, and 758
so have not been taken into account. 759
5.17 Additional costs to retailers associated with the administration of the charge have 760
been captured within this evaluation. These administrative costs arise from the 761
requirement of firms to implement additional data capture systems and staff time 762
to record bag sales information. 763
764

49
765
5.18 An estimate of this additional cost to retailers has been made based on estimated 766
staff time spent on specific bag reporting tasks as recorded through the retailer 767
survey. From this survey, it was apparent that the majority of retailers spent less 768
than a day of staff time implementing the charge per year. The average figures 769
per sector and company size ranged from 0.16 to 0.84 days per year. When this is 770
scaled to the population of retailers in Wales, and assuming an average daily 771
income of retail workers of £65 (ONS AWE data)33), total administrative costs of 772
the charge have been estimated to be less than £0.18 million per annum. 773
5.19 In comparison to the RIA this is significantly lower than the anticipated cost to 774
retailers, which was initially estimated to be in excess of £0.9 million per year. 775
Although there is some additional pressure put on retailers in terms of 776
administration, it is likely that systems used by retailers have been installed in a 777
manner that efficiently records and captures the carrier bag sales data as required 778
by the regulation to minimise the impact. 779
780
781
33
Office of National Statistics average weekly earnings data: Available from: www.ons.gov.uk/ons/rel/lms/labour-market-statistics/april-2015/dataset--earnings.html

50
6 Findings – Impacts on Suppliers of SUCBs 782
6.1 All of the organisations that provided feedback were suppliers of bags and did not 783
directly manufacture the bags, though some did offer personalised design and 784
printing services. A bag manufacturer was contacted but would not provide any 785
feedback citing commercial sensitivities. 786
6.2 Most of the organisations supplied bags to all of the UK and only one organisation 787
supplied bags to customers in Wales only. 788
6.3 All organisations noticed a change in the number of SUCBs purchased since the 789
charge was introduced. One organisation stated that they had noticed a drop in 790
printed SUCBs specifically, as retailers were seen to be purchasing plain bags to 791
further reduce costs. 792
6.4 Prior to the charge being introduced one organisation reported some confusion 793
around the types of bags to which the charge would apply, and believed that the 794
charge was being applied to polythene bags only. As a result some clients, who 795
thought the charge would not apply to paper bags, not only spent money on 796
purchasing paper bags but also incurred further expenditure by using the 797
opportunity to invest in printing new designs on their bags. 798
6.5 The one organisation that only supplied SUCBs in Wales described the impact on 799
the number of SUCBs sold as ‘devastating’. Despite this initial reaction, the 800
organisation diversified their product range. Prior to the charge, SUCBs 801
accounted for 25% of their sales and now it is approximately 2%. The organisation 802
stated that the SUCB charge has had an impact on their turnover, however they 803
reported no jobs had been lost. 804
6.6 It was noted by one organisation that the retailers are very concerned with the 805
image of their businesses and their advertising on printed bags is very important. 806
6.7 Most of the organisations already supplied bags for life such as jute, cotton or 807
non-woven bags before the introduction of the charge and some have noticed an 808
increase in demand across the UK, which has not affected the high demand for 809
SUCBs outside Wales. Another organisation found that it had limited demand due 810
to larger food retailers offering bags for life at relatively low prices. 811
6.8 The results of this qualitative feedback suggest that businesses in Wales involved 812
in the supply of SUCBs have been impacted by the charge. However, further 813
research is required to gain additional feedback from the sector. 814
Economic evaluation 815
6.9 Impacts on business arise at a series of levels through the supply chain: 816
Changes in costs and revenues to manufacturers of different types of bag: 817
those dealing exclusively with SUCBs and paper carrier bags would see a 818

51
loss of trade, whilst those dealing exclusively in bags for life made of plastic 819
or cotton would see trade increase. 820
Changes in costs and revenues of wholesalers: these are considered likely 821
to be less sensitive than manufacturers as they will naturally stock a wider 822
range of products. 823
6.10 In common with the impacts for retailers, many of the effects on manufacturers 824
and wholesalers associated with the policy act as transfer payments, redistributing 825
money between economic operators. Again, given the economic evaluation is 826
undertaken from the perspective of society as a whole, these financial transfers 827
have not been considered in this evaluation as they generate no additional value 828
to the economy as a whole. For example, the 5 pence charge has reduced 829
demand for SUCBs, which in turn has delivered cost savings for retailers which 830
now purchase fewer SUCBs. However, this reduced cost for retailers will be 831
‘cancelled out’ by reduced revenues for suppliers. 832
6.11 Although from a societal perspective these affects net out, this overlooks 833
potentially important trends within the sector. There is the potential for 834
distributional issues between firms, for example some companies are affected 835
more than others (e.g. manufacturers of plastic bags relative to manufacturers of 836
re-useable bags), and where affected businesses are located. That said, the 837
evidence from the surveys suggests that such effects are limited. Further, there 838
may be some impact on employment by bag manufacturers: however, in 839
economic appraisal from a societal perspective, this is balanced by this resource 840
becoming available to undertake productive activity in a different sector of the 841
economy, as money saved through reduced bag purchases will be spent 842
elsewhere. 843
844

52
7 Findings – Impacts on Welsh Government and Local Government 845
Economic Evaluation 846
Administrative burden of the Welsh Government 847
7.1 Implementation of the charge requires resource at the Welsh Government level. 848
At the time of the evaluation, it was reported that there were two Full-Time 849
Equivalent staff working on the policy at an estimated gross cost of £79,452 (2015 850
prices). Since, the activity of these staff was not directly related to the carrier bag 851
charges or demand for bags, this figure has been considered as constant. 852
Therefore although bag demand profiles change, for this evaluation it has been 853
considered that policy administration costs at the Welsh Government level 854
remained at a consistent level throughout the evaluation timeframe. 855
Administrative burden of local authorities 856
7.2 In addition to these relatively fixed costs, there have also been variable costs 857
associated with enforcement of cases of non-compliance. Currently, the 858
legislation provides a power for local authorities to enforce the carrier bag charge. 859
It should be noted that this power is different to a duty; duties are accompanied by 860
finance to enforce compliance, whereas powers are not. Local Authority Trading 861
Standards departments are responsible for enforcing over 100 pieces of primary 862
legislation, and many more Regulations and Orders. They respond to intelligence 863
from other agencies, businesses or complaints from the public; therefore their 864
activity directly relates to complaints made and intelligence received. Once non- 865
compliance is identified, the trader will be provided with advice in order to achieve 866
compliance. It is only when advice and information is ignored or repeated 867
mistakes are made, that enforcement tools will be used. 868
7.3 Since the introduction of the charge in October 2011 and, up to February 2013, 25 869
complaints have been received by Trading Standards from consumers across 870
Wales. All were investigated and nine of these were deemed justified. Four 871
complaints were received from businesses about other businesses; two were 872
justified. In addition, 141 requests for advice were received from businesses 873
regarding their obligations. Eleven requests for advice were received from 874
consumers regarding the Regulations and 127 enforcement contacts have been 875
made with businesses. This includes proactive inspections, test purchases and 876
reactive visits as a result of complaints received or letters of advice issued. 877
7.4 These activities will have had an associated compliance cost. This was estimated 878
as £1 million per annum in the Welsh Government SUCB 2010 charge impact 879
assessment. From correspondence with the Welsh Government, we understand 880
that the level of activity which actually occurred in the evaluation period has not 881
been greater than that anticipated in the RIA. This is supported by the survey 882
results undertaken which highlighted that it was rare for consumers not to be 883
charged for SUCBs, and where this did occur consumers were unlikely to raise it 884

53
as an issue with Trading Standards. As a result, within this evaluation the initial 885
estimate of £1 million per annum has been adjusted for inflation but otherwise 886
maintained as constant within the evaluation timeframe. Figure 7.1 shows the 887
annual costs and benefits resulting from administrative burden and enforcement 888
costs. 889
7.5 This impact category was subject to sensitivity testing (with the results presented 890
in Appendix 4) as it is considered highly likely that costs may have been much 891
lower than originally estimated. This is because although issues have been 892
raised, evidence gathered as part of the evaluation suggests that only limited legal 893
and enforcement activity has been undertaken. The difference could have been 894
as high as £3 million across the timeframe of evaluation. If this is the case then 895
the net benefit and the cost benefit ratio of the policy will be higher as a result of 896
lower costs associated with reduced investments of public funding, representing 897
more efficient and effective policy implementation. 898
899
Figure 7.1: Annual costs and benefits resulting from administrative burden and 900
enforcement costs 901
902 903

54
8 Findings – Impacts on Donations to Good Causes 904
8.1 Figure 8.1 shows that among retailers in Wales who charge for their bags, over 905
three-quarters (78%) reported that they donated all net proceeds to good causes. 906
A further 9% reported that they donated a proportion of the net proceeds to good 907
causes, while 7% reported that they give none. 908
8.2 Focusing on retailers issuing SUCBs in Wales who reported that they take at least 909
some of the net proceeds for administrative costs (71 of retailers surveyed), close 910
to four in five (81%) cited spending part of the proceeds on the cost of purchasing 911
bags whereas around one in 10 (9%) said they ‘use the money to put back into 912
the business/running of the business’. 913
914
Figure 8.1: What proportion of the charge do retailers issuing SUCBs in Wales report 915
is used for good causes and what proportion for administration? 916
Q10. Ignoring VAT and focusing just on the net proceeds from the charge, what proportion of the charge would you say the business sets aside for charitable donations and what proportion for general administration/business costs? A broad estimate is fine.
Base: Those who make a charge for their bags (464), February/March 2015 917 918
919
8.3 Just over half (54%) of retailers giving the net proceeds to a good cause reported 920
that they donate to a single organisation. A proportion (19%) reported that they 921
give to two good causes, while one in four (25%) said that they give to three or 922
more. Looking at the type of good cause to which the proceeds were donated, 923
two- thirds of retailers (67%) give to a health/disability cause followed by ‘local 924
community causes’ (29%) and causes focused on young people (10%). Around 925
one in 20 (6%) gave to environmental causes. 926

55
927
8.4 Feedback from the retailer focus group and additional discussions with retailers, 928
highlighted a number of approaches for distributing the net proceeds of the 929
charge. For example, one large retailer reported that they invite submissions from 930
good causes and had supported in excess of 250 organisations since the 931
introduction of the charge. In contrast, other large retailers reported that the net 932
proceeds of the charge was distributed to a smaller number of good causes. One 933
takeaway reported that it kept a number of charity boxes on its counter so that 934
customers could choose which charity they wished to donate their 5 pence charge 935
to; they found that this approach resulted in greater donations, as consumers tend 936
to donate more than 5 pence. 937
8.5 Of retailers issuing SUCBs in Wales that donated net proceeds to good causes, 938
3% said that the donation was in place of other donations to good causes that 939
they had been making previously. The retailer survey demonstrated that, in the 940
majority of cases, the donation was either in addition to pre-existing donations 941
(reported by 68% of retailers) or was the only donation they made (27%). There 942
was some variation in the trend observed across the retail sector, with a higher 943
proportion of food and drink retailers reporting that their donation was in addition 944
to pre-existing donations (74%); while takeaways said that it was their only 945
donation to good causes (36%). 946
8.6 While the findings of the retailer survey provide a positive picture of the charge’s 947
impact on donations to good causes, the consumer survey suggests that 948
awareness of the charge’s role could be higher. Figure 8.2 shows that at the time 949
of the consumer survey, only half of consumers (50%) said that they thought the 950
proceeds of the charge were donated to good causes. In contrast, 7% said they 951
thought it was paid directly to the Welsh Government and 2% to local authorities, 952
while 6% thought it was retained by retailers. Just over one in three consumers 953
(36%) said that they did not know what happened to the proceeds from the 954
charge. 955
8.7 Feedback from the retailer focus group suggested that attendees believed that all 956
organisations should publicly report on the number of SUCBs issued, as the data 957
was already recorded by businesses or could be obtained directly from suppliers. 958
One suggestion was for a requirement to display information on the number of 959
bags issued and what good causes had been supported within shops. However, 960
the focus group commented that it would be crucial that any such reporting 961
mechanism would be simple to use to avoid any additional administrative burden 962
on retailers. 963
964
965

56
966
Figure 8.2: Awareness of what happens to the charge 967
Q18. As far as you are aware, what happens to the money that businesses charge for single use carrier bags?
Base: 1,011 consumers in Wales, March 2015 968
969
970
Economic Evaluation 971
Donations to Good Causes 972
8.8 Another impact category captured in the evaluation was the donations to good 973
causes. This reflects the additional benefits accrued as a result of donations made 974
to good causes via the 5 pence charging scheme’s implementation. The first 975
stage of this calculation was to multiply the charge rate (5 pence per bag) by the 976
number of bag sales for single use bag types (paper and plastic SUCBs). This 977
total potential donated to charity was then scaled based on data from the retailer 978
survey regarding what proportion of the charge was actually donated to charity, 979
less any value retained to cover costs of administration. An average donation rate 980
of 87% was used as the key scaling factor in calculating the actual donations 981
made. The results of this calculation are highlighted in Figure 8.3 below. 982
8.9 Figure 8.4 shows that significant donations to good causes have been made as a 983
result of the implementation of the 5 pence charge across the sensitivity 984
scenarios. The sensitivities also show the expected trend that if bag sales are at 985
the higher end of what is expected, then donations to good causes will be highest. 986
987

57
Figure 8.3: Annual charitable donations 988
989
990
Figure 8.4: Cumulative donations to good causes versus the baseline as a result of 991
policy implementation 992
993 994
995
Social benefit of donations to good causes 996
8.10 Charitable donations have two impacts for consideration in the economic 997
evaluation: first the scale of the donations as assessed above, and second the 998
social benefit that these donations deliver. 999
8.11 Given that the economic evaluation is being undertaken from the perspective of 1000
society as a whole, the first of these impacts is excluded from the evaluation given 1001
it is a transfer from one section of society to another: the benefit of the donation 1002
received by the charity is equally offset by the additional cost to the consumer (via 1003

58
the retailer). The result is the financial donations themselves do not have a net 1004
impact for the Welsh economy. However, the actions and activities that are 1005
undertaken by the charities in receipt of the donations will deliver real benefits for 1006
society. 1007
8.12 In order to understand this interplay between social benefit and funding transfers, 1008
research was undertaken to review literature which aims to quantify the wider 1009
social economic benefits of donations to good causes. Work undertaken by 1010
Oxford Economics (2012) estimated the social benefit of charitable donations to 1011
the voluntary sector to be between £2.60 and £2.90 per £1 donated/invested. This 1012
factor highlights the fact that for each £1 donated to the voluntary sector there will 1013
be wider economic benefits including job creation, environmental benefits and 1014
social benefits from improved education, health and reduced long- term social 1015
costs associated. 1016
8.13 The lower bound of this estimate has been utilised in the model developed which 1017
represents a net impact of £1.60 of social benefit for each £1 donated. This net 1018
effect therefore includes the subsequent cost to the charity of spending the 1019
charitable donation received, combined with the benefit delivered. These results 1020
are presented in Figures 8.5 and 8.6. 1021
1022
Figure 8.5: Annual net social benefits resulting from donations to good causes 1023
1024 1025
1026

59
Figure 8.6: Cumulative net social benefits resulting for donations to good causes 1027
1028 1029
1030

60
9 Findings – Environmental Impacts 1031
9.1 The findings of the retailer and consumer surveys provide mixed evidence on the 1032
impact of the charge on littering, with some responses suggesting the charge has 1033
had a neutral impact, whilst others indicated a positive impact. 1034
9.2 As already noted in Section 5.8, almost four in five retailers (78%) reported that 1035
the charge has had no impact on the amount of litter around their premises 1036
(Figure 9.1). A small minority (5%) reported that littering had increased, whereas 1037
12% reported that litter had decreased. However, when asked a broader question 1038
in an agree/disagree format, the neutral impact was less prominent, with over half 1039
(59%) of retailers agreeing with the statement ‘the charge has helped to reduce 1040
litter’. 1041
1042
Figure 9.1: Retailer perspective on the impact of the charge on litter 1043
Q19.Thinking about the impact that the introduction of the bag charge in 2011 has had, would you say it caused an increase, decrease or has had no impact on … Q21.To what extent do you agree or disagree with the following statements about the bag charge in Wales?
Base: All retailers issuing SUCBs (504), February/March 2015 1044
1045
1046
9.3 Turning to consumers’ views, two-thirds (66%) agreed with the statement ‘the 1047
charge has helped to reduce littering in my local authority area’ (Figure 9.2). In 1048
contrast, almost one in four (24%) disagreed with the statement, while 11% said 1049
that they ‘don’t know’. 1050
1051

61
Figure 9.2: Consumers’ perception of the charge’s impact on litter 1052
Q14. To what extent would you say you agree or disagree with the following statements? The charge has helped to reduce littering in my local authority area
Base: 1,011 consumers in Wales, March 2015 1053
1054
Economic Evaluation 1055
Environmental burdens 1056
9.4 The production, consumption and disposal of carrier bags has a range of 1057
associated negative environmental and social effects. These effects have a cost 1058
to society: for example, air pollution has a detrimental impact on human health, 1059
which in turn implies a remedial cost for health services. Before the 1060
implementation of the 5 pence charge, SUCBs were provided for free. As such, 1061
the price for SUCBs (or lack of price in this respect) did not reflect these 1062
environmental and social costs associated with the production, consumption and 1063
disposal of these products. The existence of these wider environmental costs 1064
(known to economists as ‘negative externalities’) which were not captured in the 1065
price, create an issue for society: as the price of SUCBs was below what it would 1066
have been if these effects were adequately reflected in the market price, the use 1067
of SUCBs is higher delivering a consequent larger negative environmental and 1068
social impact. 1069
9.5 In the case of carrier bags (and specifically this evaluation), the associated 1070
environmental effects include: 1071
GHG Emission of Greenhouse Gases (GHG) with Global Warming Potential 1072
GHG emissions produced in the production of carrier bags has an inherent 1073
damage cost in relation to its contribution to long-term global warming impacts. 1074
Valued at £4 per tonne of carbon dioxide equivalent34 (as a result of producers 1075
34
Department of Energy and Climate Change (2014) Updated short-term traded carbon values used for UK public policy appraisal.
[Online]. Available at:

62
being covered by carbon trading schemes) and scaled to a per bag basis, this 1076
provides a range for this impact of £0.0001 to £0.0238 depending on bag type. 1077
Emission of pollutants to air with direct impacts on human health 1078
Similar to GHG emissions, the production of carrier bags also results in emissions 1079
of harmful pollutants being released into the atmosphere. These gases (and SO₂ 1080
in particular) have a range of associated negative impacts, including to human 1081
health, crops and infrastructure in urban environments. Taking a unit damage cost 1082
for SO2 of £1,633 per tonne35 and scaled to per bag, provides an impact range of 1083
£0.0002 to £0.010 per bag depending on bag type. 1084
Litter costs 1085
Plastic bags are of specific concern for litter clean-up costs as their characteristics 1086
(lightweight, non-degradable) mean that they are easily dispersed and sometimes 1087
difficult to recover from the environment. This can have significant clean-up costs 1088
for local authorities or regional action groups, and therefore are included within 1089
the evaluation process. 1090
Water pollution 1091
Liquid effluents derived from bag manufacture will require treatment either at the 1092
manufacturing plant or off-site at a sewage treatment works prior to release to 1093
open waters. The costs of this treatment will be accounted for by manufacturers 1094
and hence internalised in the price of bags. As treatment facilities operate to legal 1095
limits on discharge, there should be little or no difference in the quality of water 1096
sent out after treatment, whether or not water sent to the treatment facility 1097
includes discharges from bag manufacturers. Overall, this evaluation has 1098
therefore considered that the costs of water pollution will be zero given that this 1099
will already be captured in the costs faced by manufacturers. This view of course 1100
assumes that bag manufacturers will all be subject to regulation, which may not 1101
be the case for bags manufactured outside of the EU. It also takes no account of 1102
water pollution arising from littered bags. 1103
9.6 More detailed information on the methodologies utilised for valuation are available 1104
in Appendix 4. 1105
9.7 For all of the above impact categories, a set of unit values was derived to capture 1106
the combined impact per bag type. These values were based on a combined 1107
valuation methodology which utilised LCA data to quantify the scale of the 1108
environmental impact and publicly available valuation factors per unit of pollutant. 1109
These impact factors were then scaled to produce a unit value per bag for 1110
https://www.gov.uk/government/uploads/system/uploads/attachment_data/file/360277/Updated_short-term_traded_carbon_values_used_for_UK_policy_appraisal__2014_.pdf 35
Department for Environment, Food and Rural Affairs (2013). Air quality: economic analysis. [Online]. Available at: https://www.gov.uk/air-quality-economic-analysis

63
inclusion within the evaluation model. The resulting per bag values are presented 1111
in Table 9.1. 1112
9.8 On a per bag basis, these carbon impacts and air pollution impacts are worse for 1113
more resource intensive production of bags for life. However, the re-usability of 1114
these bags and their ability to replace multiple numbers of their single use 1115
counterparts, means that the overall impact of shifting to bags for life is of 1116
significant benefit to the environment. 1117
1118 Table 9.1: Summary of Environmental unit costs applied in the model 1119
Carrier bag type
CO₂ impact
£
Air
Quality
£
Water Cost
£
Littering cost on
land
£
Total
per bag
£
Number of times
bag used
N
Total
per use
£
SUCB
0.0001 0.0002 0.0000 0.012 0.0123 2.03 0.00607
Paper bag
0.0003 0.0009 0.0000 0.002 0.0032 2.60 0.00123
LDPE bag
0.0005 0.0008 0.0000 0.003 0.0043 2.43 0.00177
Non-woven PP bag
0.0013 0.0025 0.0000 0.001 0.0048 5.80 0.00083
Cotton Bag
0.0238 0.0999 0.0000 0.004 0.1247 125.70 0.00099
1120
1121
9.9 Figure 9.3 shows the annual costs resulting from the environmental impacts of 1122
carrier bag production between 2011 and 2014. Note that for 2011, the results 1123
have been adjusted as the charge was introduced in October 2011. 1124
1125
1126

64
Figure 9.3: Annual costs resulting from environmental impacts of carrier bag 1127
production 1128
1129
1130
Figure 9.4: Cumulative environmental benefits versus the baseline as a result of 1131
policy implementation 1132
1133
1134
9.10 Figure 9.4 shows that the estimated environmental benefit associated with the 1135
policy is a positive net impact of between £0.9 million and £1.3 million (circa £0.3 1136
million annually). However, when compared with the RIA36 they represent a 1137
relatively low estimate of the benefits of the charge. The RIA estimated potential 1138
benefits of between £4 and £6 million of annual benefits (£60–£90 million for the 1139
15 year appraisal period). 1140
36
Welsh Government (2010) Regulatory Impact Assessment on the proposals to introduce a single use carrier bags charge. [Online]. Available at: http://gov.wales/topics/environmentcountryside/epq/waste_recycling/substance/carrierbags/regulatory-impact-assessment/?lang=en

65
9.11 The reason for this difference is partially driven by the alternative bag demand 1141
functions used (as drawn from new datasets), but also reflects calculations for this 1142
evaluation being undertaken with lower environmental damage costs per bag. 1143
When comparing the two studies it was understood that previous work undertaken 1144
utilised unit costs per bag which overestimated the potential environmental costs 1145
of bags. As such it is believed that the lower estimate presented in this evaluation 1146
(although still significant in scale), represents a more realistic estimate of the 1147
environmental costs of bag sales in Wales. 1148
9.12 Although benefits are not as high as initially forecast, it is clear that the policy 1149
implementation has still performed its desired purpose in dis-incentivising SUCB 1150
use and significantly reducing the environmental impacts that they place on 1151
society. 1152
9.13 However, it is likely that the figures presented underestimate the environmental 1153
benefits since for example, no data is available on the changing volume of SUCBs 1154
within litter and no ‘willingness to pay studies exist to monetise the true value of a 1155
litter free environment. However, from the environmental factors that can be 1156
valued, it is clear that although the estimated environmental benefits listed above 1157
are to some extent eroded due to the larger resource embedded in bags for life, it 1158
is highly likely that the benefit of a cleaner, litter-free environment will be valued 1159
more highly by society. This is due to the proxy values (market equivalents) 1160
utilised in this study being less than the total social cost of litter and environmental 1161
degradation caused by plastic bags. This is a major reason as to why 1162
environmental economic evaluation is difficult to conduct fully, as many of the 1163
assets such as a “clean environment” are only valuable via the nearest market 1164
value and as such, are only estimates of the true societal costs – we can only 1165
value something that we have a value for. 1166
Waste management costs 1167
9.14 In order to estimate the cost of waste disposal and recycling, it was first required 1168
that the proportion of bags going to different waste streams (recycling, disposal, 1169
litter) be identified. Data was gathered during the consumer survey in which 1170
consumers where asked about the waste fate of their carrier bags, the result of 1171
which is illustrated in Figure 9.5. 1172
1173
1174

66
1175
Figure 9.5: Survey results identifying the proportional disposal routes by bag type 1176
1177 1178
1179
9.15 Once an understanding of the proportion of bags in each waste stream was 1180
prescribed as above, unit valuations per bag type were derived. For the purpose 1181
of this evaluation, WRAP gate fee reports37 for materials recovery facilities (MRF) 1182
(recycling) and landfill (disposal) were utilised to identify a proxy value for which 1183
Local Authorities charge/rebate per tonne, and then scaled to a per bag level (see 1184
Table 9.2). 1185
1186
Table 9.2: Recycling and disposal costs per bag utilised in the evaluation model 1187
1188
9.16 Figure 9.6 shows the estimated annual costs associated with waste management 1189
arrangements for the quantity of bags used. For the purpose of this report, the 1190
recycling and disposal figures have been fixed at the 2013/14 UK values with the 1191
assumption that local authority contracts for disposal have been maintained 1192
across the timeframe of the evaluation. 1193
37
WRAP website. Available at: http://www.wrap.org.uk/content/wrap-annual-gate-fees-report
Yearly calculated £/bag
2013/14 recycling
2014/14 disposal
£ £
Plastic SUCB £0.000073 £0.00017
Paper SUCB £0.00050 £0.00116
Plastic bag for life £0.00031 £0.00073
Cotton bag £0.00165 £0.0038

67
Figure 9.6: Annual costs resulting from waste management 1194
1195
1196
Summary and comparison to original RIA 1197
9.17 The results presented in Figure 9.7 estimate that the cumulative impact for the 1198
waste management sector could be a £0.1 million benefit in relation to costs of 1199
treatment and disposal of waste streams. This estimated benefit is driven by the 1200
significant reduction in SUCB sales and the reduced effort required to manage 1201
this waste stream via recycling and disposal routes, which outweighs any increase 1202
in demand for other, potentially more costly bag types. Although a relatively small 1203
factor of the overall evaluation outcome, this represents a real benefit for the 1204
sector and does not capture other associated unvalued impacts such as resource 1205
depletion and circularity in the economy. For example, the assessment is unable 1206
to evaluate the benefit of the reducing material consumption, which is the best 1207
waste management technique according to the waste hierarchy. This policy 1208
implementation has adhered to this principle in reducing bag sales and therefore 1209
overall benefits may be higher in that there are unvalued impacts associated with 1210
the reduction of extraction of abiotic resources. 1211

68
Figure 9.7: Cumulative waste management benefits versus the baseline as a result of 1212
policy implementation 1213
1214
1215
1216
1217

69
10 Findings – Summary of overall Impact 1218
10.1 An overview of the total impacts of the 5 pence charging scheme is provided in 1219
Table 10.1 and Figure 10.1. The net benefit of the policy is estimated at being 1220
between £27.9 million and £32.3 million for the period 2011 to 2015 with the best 1221
estimate of benefits being £30.3 million. Further detail on the sensitivity around 1222
the medium estimate is presented in Appendix 4. 1223
10.2 The impact of the social benefit from charitable donations provides the largest 1224
benefit associated with the policy. As such, any variation in either the proportion of 1225
charge donated or the ratio of donations to social benefit could significantly impact 1226
the results. This impact could be positive or negative depending on the direction 1227
of the change. In the most extreme case, if no social benefit is accrued beyond a 1228
direct transfer of £1 donated, then the benefits of the policy could be reduced by 1229
as much as £29 million–£32 million (i.e. no added value will be created by 1230
donations received and thus overall positive effects of the policy will be 1231
significantly reduced). 1232
10.3 In relation to environmental impacts, the results show that the valuation of SOX 1233
would have to be raised significantly for the shift in bag demand to have a net 1234
negative impact on the environment. Similarly if the proportion of carrier bags 1235
littered were reduced, then smaller clean-up costs associated with littering in the 1236
base case could mean that benefits of the charge in reducing these costs are 1237
lower. It is important to note that the environmental benefits of the charge may be 1238
underestimated as there is no evidence on which to assess the differential impact 1239
on watercourses (although this is not anticipated to have been a large contributing 1240
factor), air quality damage costs used are known to represent only a subset of the 1241
impacts of air pollution, and the proxy value of costs to clean up littered waste 1242
may not capture all social value placed on the reduced appearance of litter. 1243
1244
1245

70
Table 10.1: Key outputs from evaluation 1246
Option 1247
Total impact over evaluation timeframe
Net Impact Compared with
baseline
Difference to best estimate
£m £m %
Baseline (best estimate)
-3.5 0.0 0.0%
Best estimate
26.8 30.3 0.0%
Low estimate
24.4 27.7 -8.7%
High estimate 28.8 32.7 8.0%
1248
Figure 10.1: Total modelled costs and benefits for the timeframe of evaluation 1249
1250
1251
10.4 Table 10.2 and Figure 10.2 present a summary of the key impacts of the SUCB 1252
policy. The key contributing factors in the accumulation of benefits for the Welsh 1253
economy include: 1254
Social benefit of donations to good causes 1255
Through the implementation of the 5 pence charge for SUCBs, additional 1256
donations to good causes have been raised equalling between £16.8 million and 1257
£21.9 million between October 2011 and January 2015. As a result of these 1258
donations to good causes, it is estimated that there could be social benefits of 1259
between £26.9 million and £35 million between October 2011 and January 2015 1260

71
accrued through environmental, health and employment benefits within the Welsh 1261
economy. 1262
Consumer benefit 1263
This Study estimates that consumers also accumulated benefits through using re- 1264
usable bags rather than paying for SUCBs. These benefits are estimated at 1265
between £0.5 million and £4.1 million for the period October 2011 to January 2015 1266
Environmental Benefits 1267
Due to the significant shift in demand away from single use bag varieties to re- 1268
usable bag types (plastic or fabric), it is estimated that benefits of between £0.9 1269
million and £1.3 million for the period October 2011– January 2015 have been 1270
achieved. These benefits have arisen from reduced externalities associated with 1271
the production and use of single use bags and their impact upon global warming, 1272
air pollution and litter clear up costs. 1273
1274
Table 10.2: Summary of key impact categories 1275
Option
Total Net Impact
Low
£m
Best
Estimate
£m
High
£m
Administration and enforcement -3.7 3.7 -3.7
Social benefits of charitable donations
26.8 30.4 35.1
Waste management 0.1 0.1 0.1
Environmental impact 0.9 1.0 1.3
Consumer impact 4.1 3.1 0.5
Retailer costs -0.6 -0.6 -0.6
Total Net Impact
27.7
30.3
32.7
1276

72
Figure 10.2: Proportional attribution of economic benefits accrued under the best 1277
estimate scenario 1278
1279 1280
10.5 As this analysis has been undertaken as an evaluation of the policy’s 1281
implementation, not only was it key to understand the overall impact of the policy 1282
but also to some degree, how the implementation and resulting impacts related to 1283
what was anticipated in the policy appraisal in the development stage. To facilitate 1284
this comparison, each impact category (impacts on consumers’ businesses, 1285
NGOs, Welsh Government and the environment) has been taken in comparison to 1286
the forecast benefits as anticipated within the RIA conducted in 2010.38 1287
1288
1289
38
Available from here: http://gov.wales/docs/desh/publications/100604carrier-bag-charge-regulatory-impact-assessment-en.pdf

73
11 Conclusions and recommendations 1290
1291
11.1 This review estimates the net benefit to Welsh society of the implementation of 1292
the SUCB charge to be between £27.9 million and £32.3 million over the period 1293
October 2011 to January 2015, with the best estimate of benefits being £30 1294
million, which is an average of £8.8 million per annum 1295
11.2 An attempt to compare the benefits estimated by this Study with those identified 1296
by the Regulatory Impact Assessment (RIA), demonstrates that some of the 1297
assumptions made for the RIA have not proven to be correct in practice. For 1298
example, the RIA assumed an average cost per bag for life of 16 pence, while this 1299
Study found that the average price paid by consumers was 28 pence per bag 1300
(calculated average of reported bag sales). The RIA looked at the potential impact 1301
of the regulation, and estimated that the SUCB charge would produce annual 1302
benefits of between £24 million and £38 million per annum while the net benefit as 1303
estimated by this Study was between £28 million and £32 million. 1304
11.3 Further detail on the performance of the policy is presented below. 1305
11.4 This review estimates a 57% reduction in use of all bags (SUCBs plus ‘bags for 1306
life’) and estimates that between October 2011 and January 2015 SUCB usage 1307
decreased by 70%, highlighting the success of the charge in reducing bag 1308
demand. Work undertaken by the Waste and Resources Action Programme 1309
(WRAP) for supermarkets in Wales showed that from the period 2010 to 2014, 1310
there was a 78% decline in SUCB purchases. The difference between the 1311
estimates derived from this Study and the WRAP surveys is likely to reflect the 1312
inclusion of non-supermarket retailers in this Study. 1313
11.5 The WRAP data for supermarkets suggests that between the calendar years 2012 1314
and 2014, there was an increase in SUCB use at 18% above that of the 1315
anticipated change in sales volume growth at 2%, indicating that consumers are 1316
purchasing more bags. This may impact on the benefits of the charge in the 1317
longer term. 1318
11.6 The results from this study also highlight that re-use of plastic SUCBs is common 1319
in Wales with only 9% of consumers who use/receive them saying they are never 1320
re-used. On average, consumers are reporting re-using plastic SUCBs 3.6 times 1321
and paper SUCBs 1.3 times. By comparison, re-use of bags for life is far more 1322
common, with the average number of re-uses being 25.5 and 43.6 times for thick 1323
plastic bags for life and canvas, jute or cloth bags for life respectively. Comparing 1324
these results to the Environment Agency’s LCA on carrier bags suggests that 1325
thick plastic bags for life are re-used over double the amount of times required to 1326
offset the global warming potential (11 times). There is no direct comparator for 1327
canvas, jute or cloth bags within the Environment Agency’s study, only cotton 1328
bags were included. Cotton bags need to be used 131 times in order to offset the 1329
74
global warming potential. However, it should be noted that within the consumer 1330
survey the largest category that consumers could report was 50+, with a figure of 1331
50 used for this response to calculate averages. Hence, further studies may 1332
identify higher levels of re-use for canvas, jute or cloth bags than identified in this 1333
study. 1334
The views of Retailers 1335
11.7 Among retailers surveyed that charge for their bags, around one-fifth of these 1336
reported that the SUCB charge had had a positive impact on their business (22%) 1337
compared with 65% who reported a neutral impact and 13% a negative impact. 1338
Overall, 74% of those retailers who charged for their bags agreed with the 1339
statement: ‘we are happy to see the charge continue as it is’, a further 14% 1340
agreed that ‘we are happy for the charge to continue, but we would like to see 1341
some changes’, and 9% agreed that ‘we would like to see the charge removed’. 1342
11.8 Retailers reported a number of benefits associated with the charge, including cost 1343
savings on the purchase of bags (23%), environmental benefits (16%), generation 1344
of money for charity (13%), reduced waste (11%) and less litter (5%). In terms of 1345
disadvantages, the most common issue highlighted related to customer 1346
unhappiness/complaints (27%), with few other disadvantages identified. 1347
11.9 Retailers provided estimates of the time required to administer the charge. Over 1348
half of those retailers who issued SUCBs (58%) reported that they had spent zero 1349
days administering the charge over the previous year, and a further 27% reported 1350
spending one day or less, whilst 5% reported they spent more than one day, and 1351
11% were not able to report on how much time had been spent administering the 1352
charge. 1353
11.10 This review estimated that the total administrative cost of the SUCB charge to 1354
retailers in Wales to be less than £180k per year. This is significantly lower than 1355
the £900k per annum anticipated by the RIA, but as previously stated that 1356
appraisal was based on different assumptions. 1357
The views of Consumers 1358
1359
11.11 The majority of the consumers surveyed for this Review were supportive of the 1360
charge. Consumers were asked whether they supported or opposed the charge: 1361
the level of support (respondents reporting that they strongly supported or tended 1362
to support the charge) increased from the 61% reported by Exodus39 prior to the 1363
introduction of the charge, to a finding of 74% for this Study. Consumer support 1364
for the charge is also suggested by the self-reported actions of consumers, with 1365
42% reporting that they took fewer SUCBs from shops than before the charge 1366
was introduced and 35% indicating that they had stopped taking SUCBs 1367
altogether. 1368
39
Consumer behavioural study on the use and re-use of carrier bags 2012, prepared by Exodus Research on behalf of Zero Waste Scotland and the Welsh Government (2012).

75
11.12 The Study found that SUCB use varied by the type of shopping, with 78% of 1369
consumers reporting having used a SUCB for their most recent takeaway 1370
purchase (65% plastic and 13% paper), compared with 36% for their most recent 1371
non-food shop, 29% for a ‘top up’ food shop and 17% during their regular 1372
supermarket food shop. 1373
11.13 This does highlight that there is potential to further engage with consumers 1374
particularly in relation to non-food shops and takeaways. The reasons for these 1375
differences also need to be better understood. It may be a result of a difference in 1376
planned and unplanned shopping, or in relation to the number of bags used. For 1377
example, consumers may find it more acceptable to pay 5p for one bag when 1378
purchasing a takeaway or clothes shopping, compared with needing to purchase 1379
several bags when food shopping. 1380
11.14 Consumers were asked if they had been given a carrier bag in Wales without 1381
being charged for it. A third of respondents reported that they had not been 1382
charged, and the types of shop in which this had occurred were a corner shop, 1383
local greengrocer, butcher, fishmonger, clothing/shoe shop and takeaway. This 1384
highlights potential shop types to target with an engagement campaign as well as 1385
potential areas to target for enforcement. 1386
11.15 This review has estimated that consumers have accumulated benefits of between 1387
£0.5 million and £4.1 million between October 2011 and January 2015 through the 1388
improved utility of re-usable bag types over their single use counterparts. That is 1389
the value a consumer places on using re-usable bags over SUCBs, e.g. strength, 1390
attractiveness etc. 1391
The Views of Suppliers of SUCBs 1392
11.16 Respondents to the survey of retailers were asked to name their SUCB 1393
supplier(s). Five of the top 10 reported suppliers of SUCBs were contacted for 1394
detailed qualitative feedback on the impact of the charge. These suppliers ranged 1395
from manufacturers to distributors and wholesalers based in Wales. 1396
11.17 The suppliers reported that they had experienced a negative impact on their 1397
business, with reports of a decline in overall sales, and a need to diversify their 1398
business. 1399
Good causes 1400
11.18 At the point of writing, there is no statutory duty on retailers to donate the money 1401
raised by SUCB sales to good causes, this aspect forms part of the voluntary 1402
agreement developed by Welsh Government that retailers can sign up to. 1403
11.19 Overall, 78% of those retailers who charged for their bags reported that they 1404
donated all of the net proceeds to good causes, a further 9% reported that they 1405
gave a proportion and 6% said they didn’t know how much was donated. The 1406
remainder (7%) reported that they did not make any donations, whilst 1% refused 1407
to answer the question. 1408

76
11.20 Over half of retailers reported donating the net proceeds to a single organisation, 1409
19% gave to two good causes, whilst 25% donated to three or more. In terms of 1410
the type of good causes supported, two-thirds of retailers donated to a 1411
health/disability cause, followed by local community causes (29%) and young 1412
people (10%), with only 6% donating to environmental causes. This donation was 1413
in the majority of cases in addition to pre-existing donations (68%) or the only 1414
donation made (27%). Only 3% reported that the donation of net proceeds was in 1415
place of other donations made previously. This suggests low levels of 1416
displacement associated with the charge. 1417
11.21 The survey also highlighted that the awareness of the voluntary agreement and its 1418
requirement to donate the net proceeds to good causes could be higher, as only 1419
half of consumers agreed that the proceeds of the charge went to good causes, 1420
and 36% stating that they ‘didn’t know’ what happened to the proceeds from the 1421
charge. 1422
11.22 Through the implementation of the 5p charge for SUCBs, additional donations to 1423
good causes have been estimated as between £16.8 million and £21.9 million for 1424
the period October 2011 to January 2015. As a result of these donations to good 1425
causes it is estimated that there could be social benefits of between £26.9 million 1426
and £35 million between October 2011 and January 2015 accrued through 1427
environmental, health and employment benefits within the Welsh economy. 1428
Environmental impact 1429
11.23 This review used both consumer and retailer surveys to assess the impact of the 1430
charge on littering. Overall, 78% of those retailers who issued SUCBs reported 1431
no change to the amount of litter ‘around their premises’, but when asked whether 1432
they agreed with the following statement, 59% of retailers agreed that ‘the charge 1433
has helped to reduce litter’. The disparity between these two findings may reflect 1434
the difference in the wording of the two questions with the former explicitly limited 1435
to their own premises and the latter potentially interpreted to relate to a wider 1436
area. Overall, 66% of consumers agreed with the statement ‘the charge has 1437
helped to reduce littering in my local authority area’. 1438
11.24 Further research on the impact of the charge on littering is required, and it is 1439
suggested that this research is focussed on collation of SUCB data within litter 1440
surveys conducted by local authorities, ensuring that the approach to sampling is 1441
appropriate for SUCBs. 1442
11.25 Due to the significant shift in demand away from SUCBs to re-usable bag types 1443
(plastic or fabric), it is estimated that benefits of between £0.9 million and £1.3 1444
million have been achieved (circa £0.3 million annually). These benefits have 1445
arisen from reduced externalities (i.e. associated negative environmental and 1446
social effects) associated with the production and use of SUCBs and their impact 1447
upon global warming, air pollution and litter clear up costs. 1448

77
11.26 The RIA estimated potential benefits of between £4 million and £6 million of 1449
annual benefits (£60–£90 million for the 15 year appraisal period). The reason for 1450
this difference is associated with the bag demand data used in this study, but also 1451
reflects calculations for this evaluation being undertaken with lower environmental 1452
damage costs per bag. As such it is believed that the lower estimate presented in 1453
this evaluation (although still significant in scale) represents a more realistic 1454
estimate of the environmental costs of bag sales in Wales. 1455
Recommendations 1456
11.27 The authors of this Review have identified issues that could be targeted by Welsh 1457
Government to further improve understanding of the impacts of the existing 1458
charge and ensure its continued effectiveness: 1459
encourage consumers to take re-usable bags along when doing non-food 1460
shopping and collecting takeaways; 1461
encourage consumers to report instances of where they have not been 1462
charged; 1463
promote awareness of the charge among staff working in the types of shops 1464
where consumers reported they had not been charged, i.e. corner shops, 1465
local greengrocers, butchers, fishmongers, clothing/shoe shops and 1466
takeaways and target enforcement in those shop types. 1467
1468
11.28 The Welsh Government could consider further research in relation to the 1469
environmental impact of the charge on littering, as well as the impact on suppliers 1470
of SUCBs in Wales - both of which have been identified by this review to have 1471
limited available data. There is potential for more information on littering to be 1472
collated through the collation of additional data recorded via the Keep Wales Tidy 1473
Local Environmental Audit and Management System (LEAMS). 1474
11.29 It is recommended that the Welsh Government should continue to monitor levels 1475
of bag usage, because the WRAP supermarket bag usage data gives a 1476
provisional indication that SUCB use may have begun increasing again in Wales. 1477
If further research conclusively demonstrates that SUCB use is increasing, the 1478
Welsh Government may wish to consider increasing the charge. 1479
11.30 Results from this Study highlighted that increasing the charge would result in 1480
consumers purchasing less SUCBs. It is recommended that Welsh Government 1481
monitor the impact of Northern Ireland’s policy of extending the 5 pence charge to 1482
all bags with a retail value of less than 20 pence including bags for life to assess 1483
its impact on bag use. 1484
1485
1486

78
Appendices
Appendix 1 – Literature Review
1 Methodology
Literature Review
The review identified relevant sources of evidence ranging from peer-1.1
reviewed literature to policy documents and reports (so-called ‘grey
literature’) through (1) searches of bibliographic databases (Web of
Knowledge, Scopus, and Google Scholar); 2) general web searches
(Google); and (3) a call for evidence posted on relevant email lists
(Sustainable Development Research Network, Environmental Psychology
Jiscmail, International Association of People-Environment Studies).
The principles of a systematic literature review were used to identify 1.2
relevant peer-reviewed articles on the impacts of carrier bag charging
schemes, the consumption of SUCBs and associated behaviours. The Web
of Knowledge, Scopus, and Google Scholar databases were searched for
publications published between 1994 (when the first plastic bag tax was
introduced in Denmark) and 2014, using the search terms ‘carrier bag’
and/or ‘plastic bag’ in combination with ‘levy’, ‘tax’, or ‘charge’ (and variants
thereof). In order to identify non-peer reviewed publications, including
policy documents and reports, general web searches were conducted with
the same combinations of search terms. This process led to identification of
over 120 sources, all of which were examined in greater detail to identify
whether they contained evidence suitable for inclusion in the literature
review.
Publications were included in the review if they reported original empirical 1.3
data, detailed original analysis and/or provided a commentary on pre-
existing empirical data on the impacts of carrier bag charging schemes and
other policy initiatives to reduce the consumption of SUCBs. This includes
field experiments and other non-policy interventions that have tested
methods to reduce the consumption of SUCBs and associated behaviours
in natural settings (e.g., supermarkets). Lab-based experiments and other
studies in non-natural settings were excluded from the review. The studies
and reports were critically appraised in terms of their relevance, quality and
coverage to ensure that the evidence was of sufficiently high quality for
meaningful assessment of evidence gaps. In addition, data were included
from retailers’ publications, trade bodies and other sources, which indicated
the number of bags sold and the wider impacts of bag reduction initiatives.
Studies and research projects that have been undertaken as part of the 1.4
Welsh SUCB charge, including, but not limited to, AEA Technology plc’s
single use bag study, Cardiff University’s evaluation of the Welsh SUCB
charge, Zero Waste Scotland’s behaviour study on the use and re-use of

79
carrier bags, and BIO-IS’s ‘Reducing plastic bag use in the UK and Ireland’
(Lyons, 2013), were included in the literature review.
In addition, discussions were held with the Welsh Local Government 1.5
Association and Keep Wales Tidy to discuss the data they hold related to
the SUCB charge, and capture any other feedback on the charge.
The results of the literature review are presented in Section 2. Implications 1.6
are drawn both for policy (e.g., how effective charging has been in different
contexts) and also for research (e.g., how best to conduct further
evaluations and improve the evidence base).
Monitoring Data Review
The monitoring data review was undertaken to ensure that the literature 1.7
review was fit for purpose. A staged approach was used. Foremost, the
project economists identified the impact categories which were to be
considered during evaluation. These were split into ‘final impacts’ and
‘contributing impacts’.
The data, which would be required to feed into the impact calculations, 1.8
were outlined. For example, total enforcement costs could be calculated as
an addition of marketing, legal, administrative and other costs. An outline of
the final and contributing impacts and their associated estimation approach
is provided in Table 1.
The results of the literature review were then compared with the data inputs 1.9
listed. It was flagged where data were available (and the associated section
was noted). Where data were either not available or inapplicable through
being related to another country or timeframe, a strategy to collect relevant
information was outlined.
Where information required further collection, the costs and benefits of 1.10
doing so were considered.
The results of the monitoring data review is provided in Section 3. 1.11

80
Table 1: Final and Contributing Impacts
Final Impacts Contributing
impacts
Expected effect of
SUCB policy on
final impact
(negative/ positive
impact or negative
or positive)
Impact estimation
Qualitative
(Ql),
Quantitative
(Qn) or
monetised (£)
Enforcement
costs
Administrative,
marketing,
legal and
other costs
Enforcement costs
increase
Administrative + marketing
+ legal + other costs £
Retailer
profits
Small basket
effects
Business profits
decrease
% revenue reduced x total
revenue (before SUCB
charge)
£
Shoplifting Business profits
decrease
% revenue reduced x total
revenue (before SUCB
charge)
£
Administrative
burden
Business profits
decrease
Change in administrative
costs £
Carrier bag
production
reduction
Business profits
increase
Cost savings = (Change in
number of carrier bags
sold) x price per bag
£
Manufacturer
profits
Carrier bag
production
reduction
Business profits
decrease
Profit change = (Change in
number of carrier bags
sold) x profit per bag
produced
£
Social and
Environmental
Investment
Charitable
donation Investment increases
Charitable contribution =
(carrier bags sold after
SUCB charge x charitable
contribution per bag) +
(other charitable
contributions after SUCB
charge - other charitable
contributions before SUCB
charge)
£
Community
network
building
Investment increases
Building networks between
businesses and
communities who provide a
greater level of gift in kind
Ql
Waste
Management
SUCBs
recycled
Number of SUCBs
managed decreases
Cost savings = % of
SUCBs recycled x (Change
in carrier bags sold) x
(recycling cost per bag -
recyclate revenue per bag)
£
SUCBs to
landfill
Number of SUCBs
managed decreases
Cost savings = % of
SUCBs to landfill x (Change
in carrier bags sold) x
weight per bag (tonnes) x
landfill cost per tonne
£
Litter Litter decreases
Change in perception of
carrier bags in
trees/hedges/rivers
Ql

81
Final Impacts Contributing
impacts
Expected effect of
SUCB policy on
final impact
(negative/ positive
impact or negative
or positive)
Impact estimation
Qualitative
(Ql),
Quantitative
(Qn) or
monetised (£)
SUCB reuse Reuse increases % of SUCBs reused Qn
Increase in
other bag use
Substitution
effect from
SUCB to
heavy duty
bags
Heavy duty bag use
changes
Change in demand for
heavy duty bags Qn
Bin liner use Bin liner use changes Change in demand for bin
liners Ql/Qn
Carbon
emitted
Carrier bag
production
reduction and
bag design
Carbon emitted in
manufacture
decreases
Carbon savings = CO2 per
bag x Change in carrier
bags sold x shadow price of
carbon
£
Environmental
sustainability
multiplier
effect
Environmental
behaviour
change
Environmental
behaviour improves
Change in behaviour
relating to other natural
resource use (not SUCB)
Ql
Human health Food
poisoning
Risk of food
poisoning increases
Admissions due to E. Coli,
salmonella and
campylobacter bacteria
related to bag reuse
Ql/Qn
2 Findings
In this literature review we collated the available national and international 2.1
evidence on the impacts of SUCB charging schemes. This includes impacts
on consumers, businesses and government, as well as wider environmental
and health impacts.
The literature review covers both primary and secondary impacts of carrier 2.2
bag charging schemes on consumers. The primary impacts include public
attitudes to carrier bag charging schemes, the short-term and long-term
effectiveness of carrier bag charging schemes, and the impacts of carrier
bag charging schemes on different consumer groups. The secondary
impacts include behavioural adaptations, substitution effects, behavioural
spillover, and other unintended consequences, such as shoplifting. The
consumer section of the literature review also presents evidence on the
relative effectiveness of alternative policy instruments to reduce the
consumption of SUCBs, i.e., bans and voluntary measures.
The business section of the review considers the impacts of carrier bag 2.3
charging schemes on retailer profits, bag manufacturing, and small basket
shops, as well as the use and distribution of the proceeds.

82
The government section of the review focuses specifically on the cost of 2.4
administering and enforcing carrier bag charging schemes.
The environmental impacts section reviews Life Cycle Assessments (LCAs) 2.5
to determine the impacts of carrier bag charging schemes on bag
manufacturing, bag disposal through regulated waste systems, and
improper disposal (e.g., via littering).
The health impacts section specifically focuses on the potential for re-use of 2.6
SUCBs and bags-for-life to pick up microbial contamination.
Primary impacts of carrier bag charging schemes on consumers
Public attitudes to carrier bag charging schemes
Carrier bag charging schemes are generally popular among the public 2.7
where they are introduced. For example, despite Irish consumers being
somewhat reluctant to support the ‘plastax’ charge prior to its introduction
(Drury Research, 2000), Convery et al. (2007) reported that they became
more positive after the policy was implemented. A national survey on
environmental attitudes and actions showed that, one year after the Irish
plastax was introduced, 91% of the Irish population were in favour of the
plastic bag tax and only 6% against (Drury Research, 2003).
A survey among Sainsbury’s and M&S customers in Plymouth, UK (n=100), 2.8
using a convenience sampling strategy, found that 78% would support all
shops charging for bags and that 60% would bring their own bags if this
happened (Kwong 2014). When asked how the money from such a charge
should be spent, shoppers at M&S (who voluntarily charge for SUCBs)
tended to favour environmental charities (62% vs. 20% of Sainsbury’s
customers), while shoppers at Sainsbury’s (78% vs. 34% of M&S
customers) preferred prices of goods to be reduced (ibid).
A Manchester study (n=100) conducted in a single supermarket, similarly 2.9
using a convenience sampling strategy, found that 55% of shoppers
supported a plastic bag charge, with similar levels (59%) stating they were
aware of the environmental impacts of plastic bags (Musa et al., 2013).
A survey conducted in the State of Johor in Malaysia (n=262) found high 2.10
consumer awareness (94%) of the charge (which is implemented one day
per week in major retailers) and its environmental benefits (66%) with
support for a plastic bag ban in supermarkets but not elsewhere, such as
markets (Zen et al., 2013). No methodological information was provided
about how the data were collected.
Research conducted in Hong Kong (n=3,022) found that consumers were 2.11
similarly very positive about the recently-introduced 50-cent (£0.041) bag
1 Throughout this report, local currencies are converted into GBP using September 2014 exchange rates.

83
levy and most supported its immediate roll-out to most retail businesses
(Friends of the Earth [HK], 2010).
Support for the Chinese plastic bag charge (which is set by individual 2.12
retailers at an average of CNY0.33 or just over £0.03) was also found to be
high at 80%, according to a poll conducted after its introduction (O’Loughlin,
2010). Similarly, He (2012) reported that the mean supportive attitude
dropped from 4.46 (SD=0.3) on a 5-point scale to 4.07 (SD=1.07) four
months after the plastic bag regulation was implemented (n=1,039 before;
n= 2,035 after). These findings are in clear contrast to Convery et al (2007)
and Poortinga et al. (2013). The disparity in findings may be due to cultural
or income differences and/or in pre-charge communications. He (2012)
attributes the drop in public support to the greater inconvenience caused by
charging (implying expectations may have been somewhat unrealistic).
Sharp et al (2010) found no significant changes in support for a ban on 2.13
plastic bags in a longitudinal sample of 252 respondents that were
interviewed before and after a ban came in to force in the state of South
Australia.
In a quasi-experimental study with nationally representative samples of 2.14
n=500, Poortinga et al. (2013) found that support for the Welsh carrier bag
charge was already high in 2011 before it was introduced (59%). Support
for the Welsh carrier bag charge increased to 70% in 2012 after it was
introduced. The study also found that the Welsh public perceive a carrier
bag charge as “a good way of reducing waste” and think it “helps to reduce
litter”, with agreement increasing from 77% and 70% respectively before to
79% and 76% after the introduction of the carrier bag charge in Wales.
Other research (Zero Waste Scotland and Welsh Government, 2013) with 2.15
samples weighted to Census data (n=984 in Wales and n=1014 in
Scotland) found that more Welsh than Scottish consumers strongly agree
that “Charging 5p for each single-use carrier bag is” (or “would be”, in the
case of Scotland) “a good way of reducing waste” (34% vs. 24%) and
“helping to reduce littering” (32% vs. 22%), and benefited charity (30% vs.
23%).
Retailer perceptions were assessed through a survey of independent 2.16
retailers across three rural town and village shopping locations in SE Wales
about customer reactions to the charge (93 out of 125 retailers responded,
representing a response rate of 74%). The survey found that around 40% of
retailers believed the public approved, while 32% (particularly takeaways,
hardware shops, and clothing retailers) thought they disapproved (Jones,
2012). This is consistent with research showing that consumers want and
expect to receive a SUCB from high street, especially expensive, stores
because it signals prestige, is seen as part of the shopping experience,

84
offers proof of purchase when leaving the store, and makes returning items
in original packaging easier (WRAP, 2005; Jones, 2012).
Furthermore, the public is particularly supportive of the money raised being 2.17
given to charity, as indicated in Irish (AEA Technology, 2009; McDonnell et
al., 2008) as well as Welsh research (Frater, 2011a; Nash et al., 2012).
However, awareness of the use of funding is not universal: almost one year
after its introduction, only 64% of respondents to a random household
sample in SE Wales (n=153, representing a 51% response rate) selected
“charities or good causes” from a list of potential beneficiaries of the
charge; while 16% selected “Welsh Government”, 8% “The shopkeeper”,
10.5% “Don’t know” and 1.9% “Other” (Jones, 2012). It is not clear from
this, or other, research whether the public is aware that the proceeds are
passed on to charities or good causes on a voluntary basis, albeit expected
by WG. Nevertheless, the perception that retailers do not benefit directly
from the charge appears to help the acceptance of the Welsh carrier bag
charge (e.g., Nash et al., 2012). Killian (2005) attributed the relative
success of the Irish levy to an effective use of the Revenue Services, both
in terms of aiding traders implementing the charge and collecting the
revenues for environmental projects.
Other research highlights the importance of communicating the specifics of 2.18
a ban or charge to ensure public support and compliance (Cascadia, 2011;
IEEP, 2014). Information provision is also an important component of habit
formation for bag re-use, as forgetting to bring one’s own bags is one of the
most common reasons given for not using reusable bags (Laakso, 2013;
Musa et al., 2013; cf. Yeow et al., 2013). For example, Zero Waste
Scotland and Welsh Government (2012) found that consumers who took a
new SUCB at the till most often did so because they ‘did not have their own
bags to hand’ (43% in Scotland and 58% in Wales).
Yeow et al’s (2013) analysis of UK attitudes to ‘bags-for-life’ shows they are 2.19
used primarily for environmental reasons, with personal utility (e.g., bags
being stronger and bigger), economic reasons (e.g., to save money on
SUCBs), social reasons (e.g., other people are using them) or other
reasons (e.g., free bag-for-life promotions) being less common (cf.
Hawkins, 2001). The study involved several data sources, including an
online questionnaire (n=316) posted on discussion fora and distributed via
email to professional networks (i.e., convenience and snowball sampling).
When survey respondents were asked how they would persuade others to
adopt them, environmental arguments were also the most popular, followed
by personal utility and social reasons.
The practical and economic utility of bags-for-life is further indicated by 2.20
research using a more representative public sample (n=2,000). Zero Waste
Scotland and Welsh Government (2012) found that around half of Welsh

85
and Scottish consumers preferred fabric bags-for-life if they had to buy one,
with the most popular reasons being they are stronger than SUCBs (49%).
The most common unprompted reason for using a bag-for-life, given by
47% of Welsh respondents, was to save money. In Scotland, more
mentioned environmental or practical reasons for using bags-for-life. This
perhaps suggests that the charge could – at least while in place – crowd
out (intrinsic) environmental motives in favour of (extrinsic) economic ones,
which is a well-known phenomenon in economic psychology (see Frey &
Jegen, 2001; cf. WRAP, 2005). However, a notable three in ten
respondents in both countries would choose to pay for a SUCB if required
to buy one either because the charge is too small to worry them (54%) or
because they could re-use the bag as a bin liner (20%). Many also felt
SUCBs continue to be a convenient option (45% Wales, 60% Scotland),
particularly for smaller shops, and when own bags have been forgotten
(36% Wales, 37% Scotland). While it is expected that some people will
prefer to pay the charge and that re-use as a bin liner is preferable to no
reuse, these findings raise the question of whether the charge is set at a
socially-optimal level (i.e., if 16% in Wales consider the charge too small to
worry about). Further evidence relating to appropriate levels for bag
charges is discussed later.
Single use carrier bag use: short-term effects
The available evidence on the effectiveness of carrier bag charging 2.21
schemes suggests that a reduction in the consumption of SUCBs of 50 to
95% can be achieved in the short term, depending on the size of the
charge, its design, and the quality of the communication accompanying the
introduction (Convery et al., 2007; Hasson et al., 2007; Dikgang & Visser,
2012a,b; He, 2010; 2012; AEA Technology, 2009).
The Irish ‘plastax’ levy appears to be one of the more successful schemes 2.22
to date. Plastic bag consumption fell from an estimated 328 bags per capita
per year to about 21 after its introduction (Convery et al., 2007; Lyons,
2013; Doyle & Hagan, 2013; Clarke, 2014), a reduction of about 94%.
However, plastic bag use started to increase again, up to 33 bags per
capita in 2007, and the levy was therefore raised in 2007 (see below). The
Irish levy does not differentiate between different types of plastic, and
therefore includes biodegradable bags. Significant reductions in bag use of
up to 95% have also been evidenced for UK retailers who have voluntarily
introduced a charge for bags (AEA Technology, 2009).
The plastic bag charge that was introduced in China in 2008 appeared to 2.23
be somewhat less effective than the Irish charge. Evaluations of the
scheme (using ad-hoc observations, small-scale surveys, and secondary
sources) have found that consumer awareness about the charge was low
and that many retailers failed to apply the charge (O’Loughlin, 2010;

86
Qunfang, 2011). Data compiled by a Chinese retail association from sales
volume, market share, and other factors (reported by O’Loughlin, 2010)
indicate, however, that where shops had implemented the charge, a
reduction in bag use was observed; with plastic bag use within
supermarkets across the country being 66% lower 12 months after the
charges had been introduced. This was confirmed by He (2010; 2012) who
surveyed shoppers in the open markets and supermarkets in two Chinese
cities before and after policy implementation (total n=3,074). He found that,
overall, Chinese consumers reduced their overall plastic bag consumption
by 49% per cent, and the average number of new bags used per trip
decreased by 64%, from 3.0 to 1.1. Notable differences were found in
plastic bag use between supermarkets and the open market. Before the
policy was introduced, people surveyed in the open market consumed three
more bags per week than those surveyed in supermarkets. The difference
increased to 5.3 bags per week after the introduction of the charge, despite
a reduction in bag consumption in both areas. He (2012) suggests this may
be due to better pre-packaging of goods in supermarkets (necessitating
fewer bags) and the more competitive nature of the open market to provide
plastic bags for free.
Knowler (2008, cited in Dikgang et al., 2012a) reported that the South 2.24
African charge introduced in May 2003 led to a 90% decrease in the
consumption of plastic bags, while Hasson et al (2007) reported a decrease
between 60-90%. However, the consumption of plastic bags rose again
after the price was reduced from 0.46 to 0.17 Rand in August 2003 (£0.03
to £0.01). The effect of the price change was not uniform across retailers:
while the overall decrease was still in the order of 50-80% for most retailers,
one retailer targeting lower-income consumers saw an increase in plastic
bag sales after the charge was reduced, even compared to the baseline
period in which bags were given out for free (Hasson et al., 2007). Dikgang
et al. (2012a) estimated the overall reduction in plastic bag consumption to
be 44%, with a high-income retailer and low-income retailer experiencing
57% and 50% reductions respectively. This makes the South African levy
one of the least successful schemes, in particular in the long-term. This
relative lack of success may be in part be due to an absence of a pre-
emptive campaign to raise consumer awareness about the charge and a
sharp drop in price only three months after the charge was introduced
(Dikgang et al., 2012b).
Killian (2005) conducted a detailed comparison of the Irish and South 2.25
African charges, from which she concluded that the relative success of the
Irish levy could be attributed to an effective use by the Irish Revenue
Services, both in terms of practical support and legitimacy (see above).
Various authors identify economic interest of and pressures from plastic-
bag manufacturers, and an absence of effective awareness campaigns, as

87
factors that have contributed to the sub-optimal implementation of the
South African charge (e.g., Killian, 2005; Dikgang et al., 2012a,b)
The plastic bag legislation introduced in Botswana in 2007 is unique in the 2.26
sense that it does not stipulate the amount that retailers have to charge for
plastic bags (Dikgang & Visser, 2012). On average, retailers charged
around 0.18 Botswana Pulas (£0.01). Data from retailer sales show that
plastic bag consumption dropped 24% in the weeks following the
introduction of the charge, and fell overall by 50% within 18 months
(Dikgang & Visser, 2012). The decline after 18 months was steepest for
high-income retailers (64%) followed by low-income (58%) and upper
middle-income (56%) retailers, with lower middle-income retailer only
seeing an overall decrease of 26%.This disparity can in part be explained
by the higher (72%) price increase over the 18 month period charged by
high-income and low-income (44%) retailers, compared to the average
(33%) increase (ibid).
The Botswanan charge appeared far more effective than the previously 2.27
reported South African charge, despite the charge being significantly lower.
Dikgang and Visser (2012; Dikgang et al 2012a) suggest this is at least in
part because the price of a Botswanan plastic bag increased by 33% in the
first 18 months after the charge was introduced, whereas the South African
charge fell on average by 46% within three months (see also below).
Clearly, other factors may also account for these different experiences with
carrier bag charging, including cultural and income differences between the
two countries.
In a cross-sectional study, with a sample recruited from an online research 2.28
agency panel (n=8,000), comparing waste-prevention behaviours of
consumers in three Japanese mega-cities, Kurisu and Bortoleto (2011)
found significantly higher rates of self-reported ‘own bag use’ (81%) in Aichi
compared to the other two mega-cities, most likely as a result of
widespread charging in that area. Bringing your own bag was far less
common in Tokyo (57%) and Osaka (50%) where charging was not fully
implemented yet. Wards in Tokyo where plastic bags were no longer
distributed for free saw a similar level of own bag use as in Aichi (81%).
The 50 cents (£0.04) levy introduced in Hong Kong in July 2009 was 2.29
assessed by Friends of the Earth (HK) (2010) using a three-stage survey
(one month before, one month after, and six months after its introduction)
with over 3,000 consumers. They found that the SUCB consumption
dropped from 78% pre-charge to 54% one month post-charge, and 15% six
months later. Furthermore, 77% of the sample claimed to ‘always’ bring
their own bags six-months post-charge, compared to 53% pre-charge,
indicating a change in bag reuse habits.

88
The reduction in single-use carrier bags in Wales was at the higher end of 2.30
the spectrum. Data published by the Waste & Resources Action
Programme (WRAP) shows that supermarket customers in Wales used
80% fewer single-use bags in 2012 relative to 2010, the year before the
charge was introduced. Single-use carrier bag use by supermarket
customers in England increased by 4% over the same time period. The
Welsh Government reported a 70-96% reduction in the consumption of
SUCBs in food retail, using figures compiled by the British Retail
Organisation. However, consumer behaviour appears to differ by retailer
type and sector with bag reuse in supermarkets higher than in other shops
(e.g., 64% versus 43% post-charge claiming to ‘always’ take their own bags
in the Poortinga et al., 2013 survey).
Poortinga et al (2013) also evaluated the effectiveness, as well as further 2.31
attitudinal and behavioural impacts, of the Welsh SUCB charge. The study
used quota samples of 500 to represent the populations of Wales and
England, with the English sample serving as comparator. Respondents
were interviewed just before and six months after the introduction of the
carrier bag charge in Wales. The study found a statistically significant
difference between the countries. While an increase in own bag use ‘at last
visit’ to the supermarket was identified in both samples, the increase was
significantly greater in the Welsh sample (rising from 61% to 82%; Figure
1). This measure assessing the most recent supermarket visit may be more
amenable to memory, and therefore less open to social desirability bias,
than measures asking about typical behaviour. However, typical behaviour
may be more useful as an indicator of habit (e.g., Verplanken & Wood,
2006). Indeed, the study also showed that habits were changed as a result
of the charge: before the introduction of the carrier bag charge, 42% of the
Welsh sample reported ‘always’ taking their own bag to the supermarket;
after the introduction a significantly higher proportion (64%) reported this;
similarly, before the introduction of the carrier bag charge only 27% ‘always’
took their own bag to ‘other shops’, while more than two-fifths (43%)
reported doing so after the introduction of the carrier bag charge.

89
Figure 1: Percentage bringing their own bag to the supermarket ‘at
their last visit’ in Wales and England before and after the introduction
of the carrier bag charge
Source: Poortinga et al., 2013
A third study of the Welsh carrier bag charge (Zero Waste Scotland and 2.32
Welsh Government, 2012), which included Scotland as a comparator,
demonstrated the efficacy of the charge. The study used behavioural
observations as well as self-reported behaviours. Observations show that
one year after the Welsh charge was introduced less than one-fifth (18%) of
containers used by Welsh consumers were SUCBs, compared to 70% by
Scottish consumers. The study also observed that bags-for-life were used
by more than 6 out of 10 consumers in Wales, but only 2 out of 10 in
Scotland. Re-used SUCBs accounted for 8% of containers used in Wales
and 2% in Scotland. The study highlights the limitations of using self-report
data as compared to behavioural observations: households appear to
systematically over-state bag re-use and under-state SUCB consumption
(see
2.33
Table 2). Note that these differences may in part be due to methodological 2.34
differences, as well as to social desirability affecting self-reports (as noted
in previous research; e.g., Corral-Verdugo, 1997). While the survey asked
about the ‘last time’ respondents visited a shop, observations were made of
a different sample of shoppers on a particular date – however, disparity
0
10
20
30
40
50
60
70
80
90
100
Before After
Wales
England

90
here would not account for the systematic differences observed. The report
authors, however, note that the differences between self-reported and
observed behaviour may be compounded by respondents taking bags-for-
life but forgetting to use them in-store, rather than entirely a social
desirability effect. Consistent with others’ findings (Jones, 2012; Poortinga
et al., 2003), the study showed that bag reuse was higher at food chains
(such as Tesco, Sainsbury’s, Morrisons, ASDA, Co-op Food, Waitrose M&S
Food, Spar) than at non-food chains (e.g. clothing retail) and independent
shops (e.g. local butchers).
Table 2: Proportion of consumers taking new SUCBs and reusing
bags in different retail contexts and comparing different research
methods
Type of store2 Scotland Wales
Reuse bag-
for-life (%)
New SUCB
(%)
Reuse bag-
for-life (%)
New SUCB
(%)
Stated
behaviour
Food chain 65.2 24.8 79.4 9.6
Non-food chain 24.8 56.3 54.7 27.9
Independent 33.3 27.3 53.3 12.9
Observed
behaviour
Food chain 27.7 66.3 51.2 15.8
Non-food chain 0.7 65.9 17.6 25.9
Independent 2.9 60.4 32.7 24.3
Source: Zero Waste Scotland and Welsh Government, 2012
Single use carrier bag use: long-term effects
Little is known about the long-term effectiveness of plastic bag charging 2.35
schemes. Two countries where the long-term effects have been studied
extensively are Ireland and South Africa. The two countries constitute very
different case studies. In Ireland, the charge lost value due to inflation;
while in South Africa the charge was reduced in absolute terms three
months after its introduction.
As mentioned above, while the ‘plastax’ in Ireland decreased plastic bag 2.36
consumption from 328 to 21 bags per capita per year initially, this increased
to 33 bags per capita in 2007 before the levy was increased. After the levy
was increased, plastic bag consumption fell to 26 bags per capita per year
in 2007 (Pre-Waste, 2011), 18 bags per capita in 2010 and 14 bags per
capita in 2012 (Clarke, 2014). The Irish evidence suggests that a plastic
bag charge may need to be increased after a number of years in order to
2 Examples of ‘food chains’ in the study were: Tesco, Sainsbury’s, Morrisons, ASDA, Co-op Food, Waitrose M&S Food, Spar. Examples of ‘non-food chains’ were: New Look, Next, Boots, B&Q, WHSmith, Argos, M&S, Sports Direct, Superdrug. Examples of ‘independents’ were: local butcher, newsagent, baker, market stalls, clothing and gift shops.

91
retain its effectiveness. However, low levels of bag use have been
sustained for several years since the 2007 increase (with no further
increases to the charge). This may suggest that the initial levy was not set
at a socially optimal level to create sustained behaviour change. Other
factors, such as associated communications campaigns, may also have
contributed to the success of the increased Irish charge.
In South Africa, plastic bag use increased around two years after the 2.37
introduction of the plastic bag levy. However, in South Africa the price of the
plastic bag levy fell substantially three months after its introduction, which
could partly account for the observed increase in bag use (Dikgang et al.,
2012). Indeed, this is supported by the disparity in consumer behaviour
observed between retailer type: low-income retailers barely reduced the
price of SUCBs and saw very little rebound in bag consumption to 2008;
while middle- and high- income retailers dropped bag prices more
significantly and saw equivalent (albeit gradual over 1-2 years) increases in
SUCB consumption (ibid). On the other hand, Jones (2012) suggests the
short-term efficacy of the South African charge was likely to be in part due
to the initial shock-value of the charge to which consumers subsequently
habituated. However, even accounting for rebound, bag consumption
across retailers in 2008 (between 8 and 13 per 1000 Rand of shopping) still
did not reach baseline (around 40 bags per 1000 Rand in 2002). Similar
rebound effects have been observed in Hong Kong, where plastic bag
disposal reduced by 36% between 2005 and 2009 (the charge was
introduced in 2009). However, it started to increase again in 2010 (Chan,
2011, cited in Kwong, 2014). The scarcity of long-term data from other
charges, however, make it difficult to delineate the effects of habituation
and price changes, indicating this is a priority for future work.
Elsewhere, rebound effects from bag charges have so far not been 2.38
observed. Charges introduced in certain shops in Portugal in 2007 resulted
in reductions of 64% by 2009. However, no measurements were taken in
between. It is therefore not known if the reduction was greater shortly after
the charges were brought in. In the UK, retailers Marks & Spencer (2014)
report that their £0.05 charge (donated to environmental causes) for food
bags introduced in 2007 led to a drop of 75% in plastic bag use by 2012,
which has been maintained to 2014. According to Schembri (2006), the
Maltese eco-tax scheme, which included a tax on non-degradable plastic
bags and a communications campaign to highlight negative impacts of
plastic and positive impacts of the tax, led to a complete shift from ‘normal’
to ‘degradable’ plastic bags after 18 months. However, this change appears
to have been driven by retailers changing bag supplies, rather than a
change in consumer behaviour.

92
In Wales, latest figures from supermarkets suggest a slight increase in the 2.39
number of SUCBs sold from 1.7 to 2.0 per capita per month between 2012
and 2013. However, this still represents a significant decrease from the
baseline figure (pre-charge) of 9.6 per capita per month in 2010, and is
smaller than the increases in bag use observed in England and Scotland
(where charges had not yet been introduced) over the last 12 months
(WRAP, 2014; see Figure 2). Note that this data is based on monthly sales
figures provided by seven leading UK supermarkets (e.g., Tesco,
Sainsbury’s). It should be noted that data quality is not known and that data
were not available for other supermarkets. Furthermore, as noted earlier,
bag reuse in supermarkets is likely to be higher than for any other type of
retailer.
Figure 2: Single-use carrier bag sales in supermarkets per capita per
month in the UK3
Source: WRAP
Impacts on different consumer groups
One argument against carrier bag charges is that they could be considered 2.40
a regressive economic policy. That is, they impose a greater burden on
lower-income groups than higher-income groups (Baker, 2011; Jones,
2012). However, as proponents have argued, the charge can easily be
avoided by reusing bags – indeed, this is the behaviour change intended by
the charge. It seems the Irish levy did not have strong implications for
income distribution (IEEP, 2014) and a consumer survey after its
introduction did not indicate different views about their charge (including
3 Participating supermarkets were Asda, Co-operative Group, Marks & Spencer, Morrison’s, Sainsbury’s, Tesco and Waitrose.
0
2
4
6
8
10
12
14
16
18
UK
England
Scotland
Wales

93
financial burden) amongst different socio-economic groups (Convery &
McDonnell, 2003).
Based on a contingent valuation study with Utah (US) consumers (based 2.41
on a combination of random and convenience samples; n=275), Dunn
(2014) concludes that older, female and lower-to-middle-income individuals,
as well as larger-sized households, are more likely to switch to reusable
bags when faced with a tax on plastic bags.
Other studies show similar age, as well as gender, effects to those of Dunn 2.42
(2014) (e.g., Zero Waste Scotland and Welsh Government, 2012; WRAP,
2005). For example, Poortinga et al. (2012) found that older consumers, as
well as women, were more likely to bring their own bags to the supermarket
both before and after the introduction of the Welsh charge (see Figures 3
and 4).
In addition, the Poortinga et al (2012) study found that gender, age and 2.43
income were associated with ‘always’ taking one’s own bag/s to the
supermarket and to other shops. Men were 37% less likely to always take
their own bag/s to the supermarket and 32% in the case of other shops;
younger participants (aged between 16 and 24 years) were 51% less likely
to take their own bags to the supermarket and 70% less likely to take them
to other shops, whilst older participants (in particular those aged 65 years
and over), were more 3.5 times likely to take their own bag/s to the
supermarket and 3.6 times in the case of other shops. Those on higher
incomes (over £20k) were 53-62% less likely to take their own bags to other
shops than those on the lowest (up to £10k) incomes, although there was
no difference in attitudinal support for the charge by income group.

94
Figure 3: Own bag use among men and women before and after the
introduction of the SUCB
Source: Poortinga et al., 2012
Figure 4: Own bag use by age group before and after the introduction
of the SUCB in Wales
Source: Poortinga et al., 2012
0
10
20
30
40
50
60
70
80
90
100
Female Male
Before
After
0
10
20
30
40
50
60
70
80
90
100
16-24 25-34 35-44 45-54 55-64 65+
Before
After

95
Other research highlights that, alongside socio-demographic factors, 2.44
attitudinal variables are strong predictors of consumer behaviour
(Jayaraman et al., 2011). For example, Lam and Chen (2006) surveyed 150
hypermarket shoppers before and after shopping two years after SUCB
charging was introduced in Taiwan. The findings showed that both
intentions to bring their own bags and actual bag reuse were predicted
primarily by self-efficacy of bringing bags, as well as positive attitudes,
environmental concern, and personal norms4. In addition, actual SUCB
consumption was predicted by income as well as situational factors (e.g.,
buying more than planned). This highlights the value of including
psychological and contextual variables alongside demographic information
to fully understand SUCB consumption.
Secondary impacts of carrier bag charging schemes on consumers
Behavioural adaptations
Besides bag re-use, two behavioural adaptations that have been observed 2.45
where charging has been introduced (e.g., Zen et al., 2013) are bag
abstention (i.e., not using a bag at all) and bag optimisation (i.e., filling bags
until they are almost full), In an observational study that compared
shoppers in Portuguese supermarkets that charge €0.02 (just under £0.02)
versus those that do not charge for bags, Luís and Spínola (2010) found
that more customers re-used bags (37% vs. 0%), avoided using bags
altogether (12% vs. 5%), and filled their bags completely (52% vs. 17%) in
shops charging for bags. In Wales, observations of bag abstention following
the introduction of the charge indicate that 40% of shoppers (compared to
27% in Scotland) took at least some items loose from food chains, such as
Tesco and M&S Food (with 19% vs.14% doing so in non-food chains, and
29% vs. 11% doing so in independent stores; Zero Waste Scotland and
Welsh Government, 2012). Here, self-reports of taking items loose were
lower as compared to the behavioural observations, although the
observations include shoppers using containers as well as taking some,
often bulky, loose items (e.g., multi-pack toilet rolls or nappies).
Behavioural spillover
Behavioural ‘spillover’ is the idea that undertaking one (pro-environmental) 2.46
behaviour can lead to adopting other, associated behaviours (Thøgersen,
1999; Austin et al., 2011). It is notable that one of the arguments for
4 Lam and Chen (2006) used composite psychological measures of attitude towards the behaviour (e.g., ‘It is worthwhile to bring my own bag(s) to shopping’), environmental concern (e.g., ‘I worry that plastic trash will damage the health of our next generation’), personal norm (e.g., ‘I feel obliged to comply with the government’s plastic bag restriction’), self-efficacy (e.g., It is easy for me to bring a bag to shopping’) and response efficacy (e.g., ‘If I have a habit of not requesting plastic bags, I can help Taiwan to reduce its plastic trash’).

96
introducing the Welsh charge was that it would change Welsh social
attitudes to resource use away from a ‘throwaway society’ to a more
sustainable one, supporting several waste and environmental objectives
and changing a host of behaviours (not only bag use per se; AEA
Technology, 2009). Poortinga et al. (2013) examined whether the
consumption of re-usable bags could act as such a ‘catalyst’ for further
waste-conscious changes. Drawing on the spillover literature, they
hypothesised this process would be mediated by a change in identity, such
that environmental concern and/or waste-consciousness would become
more central to people’s sense of self. Such a heightened sense of green or
waste-conscious identity may, given appropriate opportunities, lead on to
other pro-environmental actions. They found higher levels of a waste-
conscious/environmental identity5, after when compared with before the
carrier bag charge was introduced in Wales, which they suggest could lead
to other waste-conscious decisions in the longer term. This observed
change in identity is consistent with previous qualitative research which
shows that using ‘environmentally-friendly’ bags signals and reinforces
one’s self-identity since it is a visible, public display of pro-environmental
commitment (Cherrier, 2006).
However, despite this change in identity, Poortinga et al. (2013) did not find 2.47
evidence of behavioural spillover to other types of waste or environmental
actions among the Welsh public within the timeframe of their study
(September 2011 – May 2012). This is consistent with Frater’s (2011a)
research that suggested shoppers did not make any connection between
the charge and broader consumption behaviours. No other research has
made appropriate pre- and post- charge measurements of other waste or
environmental behaviours in Wales or anywhere else, so no conclusions
can be drawn about spillover arising from environmental charges, including
SUCB charges. This would thus appear to be a significant gap in the
literature that future consumer behaviour studies could address.
Substitution effects
Sherrington et al. (2012) use supermarket carrier bag sales data collected 2.48
by WRAP (2012) for the UK Voluntary Agreement on Carrier Bags to
estimate the size of substitute effects of reduced SUCB consumption.
Substitution effects are considered in terms of (a) using other types of
container than SUCBs for ‘primary uses’ (i.e., carrying shopping) and (b)
using alternatives to SUCBs for ‘secondary uses’ (e.g., lining bins). They
suggest that for every 1000 SUCBs avoided in the supermarkets that
provide data to WRAP, 29 LDPE (low density polyethylene) ‘bags-for-life’
are used, and 4 other re-usable bags, such as bags made from cotton.
5 Measured with four statements, e.g., ‘I think of myself as a waste conscious person’; ‘I think of myself as someone who is very concerned about environmental issues’.

97
However, the report does not make clear how many times it is assumed
these more durable alternatives would be used. Similarly, they used 2005
WRAP data to estimate that per 1000 SUCB reduction, 40% more bin liners
will be used. This estimate was based on self-reported re-use of SUCBs,
with 76% of consumers reporting re-using all or most SUCBs, of which 53%
reported re-use as a bin liner (WRAP, 2005). However, this could not be
confirmed by a more recent study by WRAP (2013a). The latter study found
as little as a 4% increase in bin liner sales as compared to the reduction in
SUCBs, and a 130% increase in bag-for-life sales (discussed further
below). Similarly, an evaluation of the Hong Kong bag levy found only a 2%
increase in bin liner sales following its introduction (Friends of the Earth
[HK], 2010).
Other research shows that bin liners are the most common re-use of carrier 2.49
bags (Musa et al., 2013; Zen et al., 2013; Zero Waste Scotland and Welsh
Government, 2012). Poortinga et al. (2012), however, found only a small
reduction in the self-reported use of carrier bags as bin liners between
September 2011 and May 2012; those claiming to ‘always’ re-use carrier
bags for ‘other purposes (e.g., as a bin liner)’ dropped from 57% to 51%
following the introduction of the charge. This drop in secondary use (e.g.,
as bin-liners) is consistent with the reported increase in SUCBs for primary
(i.e., shopping) purposes (discussed earlier). Other research found that the
number of Welsh householders using carrier bags as bin liners decreased
after the introduction of the carrier bag charge, whilst those using purpose-
made bin liners increased (Zero Waste Scotland and Welsh Government,
2012). Similar findings were observed in China after the introduction of bag
charging, resulting in authorities formulating standards for bin liners,
including biodegradable liners (O’Loughlin, 2010). Since the price of bin
liners varies considerably, this substitution may or may not be economically
rational; it is unclear, however, from this analysis whether consumers
undertake any sort of economic calculation of the cost of buying bin-liners
versus new SUCBs.
Using electronic point-of-sale data from across the retail sector, WRAP 2.50
(2013a) found that the introduction of the Welsh SUCB charge was
associated with an increase in bin-bag sales. Bin-bag sales were found to
be persistently higher in Wales & West than in Great Britain as a whole
after the introduction of the charge (Figure 4). This suggests that people in
Wales were using some of the SUCBs as bin liners before the charge was
introduced, and that the charge was responsible for the increased sales.
However, the increases in bin liner sales were small in comparison to the
overall reduction in SUCBs. As noted, WRAP estimated that the increase in
bin liner sales was only 4% of the reduction in SUCBs by weight or number.
While this sales data points to small secondary substitution effects from
SUCBs in respect of bin-bags, more detailed (e.g., qualitative) consumer

98
behaviour data would help elucidate how these substitution effects have
occurred and what other factors (e.g., bin-bag abstention) may also be
occurring.
Figure 4. Indexed sale of pedal-bin liners in Wales & West and Great
Britain
Source: WRAP, 2013a6
The WRAP study using retailer point-of-sale data also found that there was 2.51
a substantial increase in the use of ‘bags-for-life’ at the time of the
introduction of the charge in the order of +130% (WRAP, 2013a). In terms
of material, this equated to 28% of the overall reduction in SUCBs. The
report therefore concludes that the positive effects of the Welsh SUCB
charge outweigh the magnitude of unintended consequences in terms of
increased bin-bag and ‘bags-for-life’ sales. This would appear to undermine
claims that charging for carrier bags has an overall negative impact on the
environment due to an increase in vehicles delivering heavier bags (PAFA,
2014).
A plastic bag charge may also have also unintended environmental impacts 2.52
if bags-for-life are not being re-used and replaced as intended (AEA
Technology, 2009). While an overwhelming majority of shoppers re-use
‘bags-for-life’ at least once (e.g., Clarke, 2014), there is some evidence that
a significant proportion of heavy-duty plastic bags ultimately end up in
landfill. Zero Waste Scotland and Welsh Government (2013) found that
most households (93% in Wales, 86% in Scotland) own one or more bags–
for-life, and use them at least ten times (70% Wales, 68% Scotland).
However, of those that had disposed of a bag-for-life within the last year
6 100 = four weeks to 12th June, 2010

99
(32% Wales, 23% Scotland), 30% of Welsh and 40% of Scottish
respondents said that they did this using the general waste stream rather
than recycling them. Furthermore, and consistent with previous research
(WRAP, 2005), almost no-one (0.3%) returned to the retailer to request a
replacement bag-for-life once it had worn out. Overall, these results
suggest that more could be done to improve recycling and replacement
rates of ‘bags-for-life’. In respect of replacement, this might include
requiring retailers to advertise that they replace ‘bags-for-life’ for free in
order to raise awareness of this option. This should be facilitated by the fact
that consumers are more likely to use a branded ‘bag-for-life’ that they have
purchased from the store they tend to shop in (Zero Waste Scotland and
Welsh Government, 2013).
Another unintended consequence of carrier bag reuse relates to consumer 2.53
health. This is discussed in detail later under ‘Health Impacts’.
Shoplifting
Prior to introducing the Welsh charge, concerns were raised that shoplifting 2.54
would be made easier when large numbers of people carry their own bags
(AEA, Technology, 2009). However, while a small increase in shoplifting
was reported following the Irish charge, this was small compared to
retailers’ savings associated with purchasing fewer bags and related
storage costs (ibid). Based on a survey among retailers in Ireland, Convery
and McDonnell (2003) concluded that shoplifting rose initially in some
stores (e.g., supermarkets) but returned to pre-levy levels within a year of
its introduction. However, this research was based on retailer perception
(elicited through interviews with seven leading retailers from diverse
sectors, whose market share represents around 50% of Irish retail sales)
rather than shoplifting statistics from financial or electronic data. Other
research using Radio Frequency Identification Tags (RFIDs) showed no link
between shoplifting and customers carrying their own bags (Pate et al.,
2011 cited in Jones, 2012); although RFIDs are more commonly used in
some retail sectors (e.g., clothing, technology) than in others (e.g.
supermarkets). One small-scale survey in rural SE Wales found that only
3% of retailers reported an increase in shoplifting (Jones, 2012). Overall,
UK retailers have recorded a decline in shoplifting in the 12 months up to
February 2014 (ACS, 2014).
The effectiveness of different policy instruments to reduce carrier bag
use
SUCB bans, levies and voluntary measures
Limited research has been conducted on the relative effectiveness of 2.55
different policy instruments, including SUCB bans, pricing instruments (i.e.,
a levy, charge or tax), and voluntary (non-regulatory) retailer measures, to

100
reduce the consumption of SUCBs. Coercive policies (i.e., bans) have
mainly been used in countries, such as India and Bangladesh, where
plastic bag use is associated with public health and environmental risks
(e.g., flooding). In contrast, European countries have tended to favour
pricing instruments and voluntary measures (Ritch et al., 2009).
Comparisons of the economic, social and environmental impacts of bans,
pricing instruments and voluntary retailer measures to reduce the
consumption of SUCBs highlight the various strengths and weaknesses of
the different approaches, but tend to favour pricing instruments in terms of
offering a balance of environmental benefits, consumer choice/equity, and
business/administrative costs (Miller, 2012; City of Fort Collins, 2012;
Nolan-ITU, 2002; Sugii, 2008; GHK, 2007; Tough, 2007; DoENI, 2012; cf.
Nilsen, 2010).
Furthermore, comparisons of the efficacy of SUCB bans, pricing 2.56
instruments, and voluntary measures that have been rolled out by national
governments show levies to be slightly more effective (73% reduction in
plastic bags) than bans (68% reduction), and considerably more effective
than voluntary retailer action (31% reduction) – although there is
considerable variation within these categories due to various contextual
factors relating to the implementation of the policy (Miller, 2012; see Figure
5; cf. GHK, 2007). For example, in Malaysia, where a charge is only applied
one day per week, many shoppers simply buy less on charging days than
on non-charging days (Zen et al., 2013). Research also suggests that
where environmental policies (including those to reduce the consumption of
SUCBs) have been most successful, multiple tools were used (e.g.,
economic, communication, standards) to ensure stakeholder and consumer
compliance (Pape et al., 2011; Hasson et al., 2007). While it may seem
surprising that bans are not more effective than pricing instruments, those
that have been implemented to date (e.g., in Taiwan and South Australia)
have only been in force for a relatively short period of time or included
numerous exemptions and illegal selling (Miller, 2012). In South Australia,
retailers could still offer paid-for alternatives, such as compostable plastic
bags and ‘green’ bags designed for multiple use after a ban on plastic bags
was introduced (Sharp et al., 2010).

101
Figure 5. Reduction in plastic bag consumption by policy type
Source: Miller, 2012
Research conducted by Sharp and colleagues (2010), based on 1,167 2.57
consumer interviews pre-ban and follow-up interviews with a sub-set
(n=253) post-ban, found that self-reported own bag use rose sharply to
95% after a legislated retail ban on single use polyethylene bags in South
Australia, as compared to 60% before the ban. However, a sizeable
proportion of the shopping public (18%) still bought compostable SUCBs
after the ban was in place. Overall, the impact of a ban on single-use plastic
bags appears to be of a similar size to that of a plastic bag charge if
retailers can still offer paid-for alternatives such as compostable SUCBs
(Cascadia, 2011). Schemes where retailers could decide how much to
charge (whether this is a voluntary or mandatory charge) have shown
substantial reductions in plastic bag use as retailers typically charged high
prices (Jones, 2012). Research conducted in China (cited in Jones, 2012)
and elsewhere (e.g., South Africa, Ireland) also suggests the level of the
charge influences its efficacy (as discussed further in next sub-section).
There is evidence that mandatory charging instruments are more effective 2.58
in reducing the use of single-use carrier bags than voluntary measures. For
example, research for Colorado’s City of Fort Collins (2012) estimated that
customer education alone would result in only 5% reduction in total carrier
bag use, compared to around 50% with a fee charged for disposable bags
and over 60% with a ban on disposable bags. Field experiments in which
supermarket shoppers received ‘prompts’ or ‘persuasive normative
messages’ or made ‘pledges’ similarly found only moderate reductions in
carrier bag use (Ohtomo & Ohnuma, 2014; De Groot et al., 2013; Laakso,

102
2013). Broadly consistent with the very small predicted or observed
changes in consumer behaviour in these studies, Malaysian research
suggests consumer education had no effect on consumption of SUCBs
(although levels of baseline awareness is not known; Jayaramen et al,
2011).
In 2007, 21 UK retailers agreed with Defra to cut the environmental impact 2.59
of the carrier bags they give out by 25% between May 2006 and December
2008. In 2008, the British Retail Consortium (BRC) entered a voluntary
agreement with the Scottish Government, Defra, the Welsh Assembly
Government, and the Northern Ireland Department of the Environment to
reduce the number of single-use carrier bags by 50% between 2006 and
2009. This higher target was narrowly missed with a 48% reduction
measured for the UK (WRAP, 2009). Once the voluntary agreement ended
in 2009, however, a small increase (from 7.2 billion in 2009 to 7.6 billion in
2010 and 8.0 billion in 2011; from a baseline of 12.2 billion in 2006) in
SUCBs was observed in the UK (WRAP, 2013c).
The UK carrier bag voluntary agreement also provides indications of how 2.60
supermarket behaviour can affect carrier bag use. Notably, supermarkets
that saw the greatest increase in sales of ‘bags-for-life’ were the ones that
removed SUCBs from direct view of customers (WRAP, 2009). While other
supermarkets achieved some success by rewarding customers with ‘card’
points for reusing bags, these effects appeared smaller overall. The
findings of this study should however be treated with caution, as they were
based on a limited number of case studies and no consistent strategy was
used across the different supermarkets to evaluate the impacts of the
voluntary measures. Furthermore, no information is provided about how the
reductions were calculated.
Although, bags-for-life usage remained static at around 5% between 2006 2.61
and 2012, the largest proportion of users seem to have adopted them
around 2008 when the voluntary agreement between BRC, leading
supermarkets and the UK governments to reduce single-use carrier bag
was introduced (Yeow et al., 2013). Most of the shopping public (67%) also
heard about them from supermarkets, pointing to the active role of large
retailers in their promotion (e.g., provision of prompt magnets, voluntary
charging for SUCBs, and offering green loyalty points; Yeow et al., 2013).
Ohtomo and Ohnuma (2014) used observations and questionnaires in 2.62
Japanese supermarkets and found that a voice prompt by cashiers (i.e.,
asking shoppers if they wanted a plastic bag) reduced the number of
shoppers accepting plastic bags to 73%, as compared to 78% in the
baseline period when cashiers stayed silent; the intervention also produced
an equivalent increase in the motivation to use fewer plastic bags. Laakso
(2013) similarly found that customers considered a voice prompt was to be

103
the most significant in-store influence on their bag re-use behaviour. These
findings are consistent with the Zero Waste Scotland/Welsh Government
(2012) study of the Welsh and Scottish shoppers’ bag use behaviour; their
findings suggest the far higher usage rate of SUCBs in Scotland is at least
in part to do with cashier behaviour (i.e., packing items into SUCBs without
consulting the consumer). As noted earlier (‘short-term effectiveness’
section), this highlights the significance of SUCB charging for breaking
habits (both on the consumer and retailer side) and the importance of
changing defaults (Sunstein & Reisch, 2013).
De Groot et al. (2013) conducted a naturalistic experiment (n=200) in a UK 2.63
supermarket to examine how normative messages could encourage
shoppers to use fewer plastic bags. They found that shoppers used, on
average, significantly fewer plastic bags per trip when an injunctive norm
message (‘Shoppers in this store believe that re-using shopping bags is a
worthwhile way to help the environment. Please continue to re-use your
bags’; 2.04 bags used) or a combined personal and injunctive norm
message (‘Shoppers in this store believe that re-using shopping bags is a
worthwhile way to help the environment. We thank you for helping the
environment by continuing to re-use your bags’; 1.86 bags) was shown than
when only an environmental message was shown (‘Caring for the
environment. Reuse your bags’; 3.12 bags). Laakso (2013) tested a
community-based social marketing (CBSM) approach to bag reuse,
involving educating customers about reasons for re-use, encouraging them
to make a written pledge, and giving normative messages and prompt
stickers in a Washington supermarket (pre-n=164; post-n=144), and found
an 11% reduction in SUCBs. Information campaigns have also been used
elsewhere with indications of some impact on bag use habits; for example,
the No Plastic Bag Day (NPBD), co-organised by environmental groups in
Hong Kong and involving 39 participating retailers by November 2006, led
to 51% of consumers claiming to be developing the habit of not using
plastic bags or bringing their own bags when shopping on NPBD (GHK,
2007).
In a rare example of a SUCB experiment not set in a supermarket context, 2.64
a pilot study conducted in the Netherlands non-food retail sector found that
the visual removal of free small plastic bags in combination with pricing of
larger ‘heavy duty’ bags at a minimum of €0.10 (£0.08) reduced the overall
number of (free or paid-for) plastic bags issued per purchase (transaction)
by 70-77% (Kennisinstituut Duurzaam Verpakken, 2014). This can be
compared to a reduction of 48% in a shop that already charged for plastic
bags in the baseline period. In this particular pilot, retailers were asked to
provide information on the number of bags issues, their price, as well as the
number of purchase transactions over a 3-month period in the Christmas
shopping season. The whole of 2012 was used as the baseline period.

104
The Dutch pilot study also found that the proportion of transactions in which 2.65
free plastic bags were issued dropped from 57-95% in the baseline period
to 4-5% in the pilot period (Kennisinstituut Duurzaam Verpakken, 2014).
The reduction was the smallest in the shop that already charged for plastic
bags in the baseline period (from 64% to 31%). The proportion of
transactions in which larger paid-for ‘heavy duty’ bags were issued
increased from 0-2% to 3-25%. The increase was the smallest in the shop
that already charged for plastic bags in the baseline period (from 2% to
3%). Overall, the increase in larger ‘heavy-duty’ plastic bags only partly
offset the decrease free plastic bags. This suggests that the visual removal
of plastic bags in combination with shops stopping actively offering them to
customers can have the same effect as a carrier bag charging scheme.
In a field experiment conducted in the semi-organised retail section (i.e., 2.66
180 fruit and vegetable shops) in and around Delhi, Gupta and
Somanathan (2011) and Gupta (2011) examine the effectiveness of several
price and non-price instruments to reduce the use of plastic bags in India.
The staged experiment consisted of three cumulative phases (i) provision of
information to consumers, (ii) a cash-back scheme contingent on use of
non-plastic bags and (iii) provision of substitutes for plastic bags. The
information provision treatment included both negative information (showing
the harmful effects of plastic bag use) and positive information (stressing
the positive impacts of cutting down on plastic bags). The results indicate
the cumulative introduction of these measures led to an increase in own
bag use from 4.6% before to 17.8% after. The number of consumers who
would only use plastic bags reduced from 80.8% to 57.1%. In general,
positive information appeared more effective than negative information.
Dai (1998) reported on the voluntary ‘Use Less Plastic Bags’ campaign that 2.67
was conducted among retailers and wet markets in Hong Kong in the
1990s. Participating retailers and market stall owners were encouraged to
develop the promotion and reduction programmes themselves with the help
of the campaign committee. Both campaigns achieved a 9-10% reduction in
plastic bag use, with the number of consumers bringing their own bag
increasing from 12.5% before to 31.5% a year after the campaign.
Reduction measures adopted included staff education and training,
displaying (‘Use Less Plastic Bags’) campaign posters in prominent
locations, and providing alternative carriers, such as paper bags and
paperboard drink carriers.
Overall, it appears that, while they are easy to implement, voluntary 2.68
agreements are not optimal in terms of reducing SUCB consumption
(Lyons, 2013). At the other end of the spectrum, the evidence suggests that
a complete ban could be as effective as a charge, but would leave little
flexibility to producers, retailers, and consumers. Carrier bag charging

105
schemes are found to be highly effective while, at the same time, being
publicly acceptable.
Size of the charge
There is conflicting evidence about the level at which a tax or charge needs 2.69
to be set to be effective. According to economists, a carrier bag tax or
charge is a typical market-based instrument that provides a market signal
for consumers to internalise the costs of environmental pollution it produces
(Convery & McDonnell, 2003), with the marginal social cost of a plastic bag
being estimated to be around $0.10 (£0.06; Akulian et al., 2006). However,
carrier bag pricing instruments are not strictly ‘Pigouvian’7 in the sense that
they aim to change consumer behaviour rather than cover the external
costs of carrier bag use (Convery et al., 2007).
Willingness to pay (WTP) studies have been used to estimate the level at 2.70
which charges need to be set to discourage consumers using SUCBs. A
study conducted in 1999 (i.e., three years before the introduction of the Irish
charge) with 1,003 Irish adults found that only 8% of Irish consumers found
it worth paying more than €0.07 (£0.05) for a plastic bag (Drury Research,
2000; cited in Convery et al., 2007). The success of the Irish initiative may
therefore be due to the initial charge being multiple times higher than the
maximum willingness to pay for a plastic bag (ibid). On the other hand,
Frater (2011a) found 38% of Welsh consumers were willing to pay more
than 5 pence for a bag, compared to 29% willing to pay 5 pence, and 30%
between 0 and 4 pence. A stated preference study conducted among
shoppers before the introduction of the Chinese charge (He, 2010) found
that the proportion of shoppers indicating that they would stop using plastic
bags was 27%, 35% and 64% at 0.3 (£0.03), 0.5 (£0.05) and 1 (£0.10)
yuan respectively. While the actual total bag consumption was different to
the predicted total bag consumption under the 0.3 yuan case, they were
essentially the same under the 0.5 yuan case, suggesting that consumers
can predict their future bag use reasonably well (ibid). Dunn (2014) used
data from an online survey of shoppers to determine the WTP for continued
plastic bag use, as well as the willingness to accept (WTA) switching to
reusable grocery bags. In line with the empirical findings of Homonoff
(2013), he found that shoppers have a greater aversion to paying for plastic
bags than an affinity for a subsidy on re-usable bags.
There is however no strong evidence that higher charges are more effective 2.71
than lower charges. Experiences from other countries show that even a
relatively small charge can produce a substantial reduction in plastic bag
use (Hasson et al., 2007; Homonoff, 2012; WRAP, 2012). The Welsh
7 The economist Pigou’s (1960) seminal work on environmental taxation argued that marginal external costs should be identified in order to determine the optimal level of tax. A Pigouvian tax is then one where the marginal social cost determines the tax rate.

106
charge (£0.05) was significantly lower than the initial Irish charge (€0.15 =
£0.12), but still achieved a substantial reduction in supermarket plastic bag
use (WRAP, 2012). Similarly, the initial South African charge of 0.46 Rand
(about £0.03) led to a ‘dramatic’ 80% reduction in SUCB sales, although
that effect was diluted when the charge was lowered significantly a few
months later (Hasson et al., 2007). In the UK, retailer WHSmith report that
their £0.01 charge (donated to an environmental charity), accompanied by
cashier prompts, was sufficient to produce a 53% drop in plastic bag use
(BRC, 2011). While Homonoff (2013) also found that a small tax of 5 dollar
cents (£0.03) imposed in the Washington Metropolitan area reduced the
number of customers using a disposable bag from 8% to 45% (with the
number of customers using a reusable bag increasing from 16% to 49%), a
policy that offered customers a five-cent bonus for reusable bags had
virtually no effect. The strength of Homonoff’s (2013) study is that it made a
before-and-after comparison in a number of counties with different charging
policies (i.e., ‘always charging’; only charging in the post-period; and never
charging). Within the different counties there were a number grocery chains
that offered a bonus program and a number that did not. The study was
therefore able to compare the effects of different conditions. The results of
this study are not in line with conventional economic theory, and suggest
that a charge should not only be understood as an economic instrument,
but also as a ‘habit disruptor’ that forces shoppers to make a conscious
decision as to whether or not they want to use a plastic bag (Poortinga et
al., 2013). There are, however, indications that price is important in
maintaining the reduction in the long term, and that any drop in charges
may lead to rebound in SUCB consumption, as discussed earlier (‘Long-
term effectiveness’ section).
Understanding the relationship between the size of the charge and 2.72
consumer demand is not only important for determining the initial charge
but also for estimating the impacts of inflation (Sherrington et al., 2012).
Price elasticity studies suggest that plastic bag demand is relatively price
inelastic (Hasson et al., 2007), and that a small tax (under $0.05, i.e.,
£0.03) can have a significant impact on SUCB consumption (Dunn 2012).
Economic analysis commissioned by the Irish Government (AP EnvEcon
Limited, 2008) argued for the levy to increase over five years from €0.22 to
up to €0.40 (£0.37 at that time) per bag, both to sustain a gap in price of
single-use bags and bags-for-life and to account for the diminishing value of
the levy in real terms due to inflation.

107
Impacts of carrier bag charging schemes on businesses 2.73
Retailer profits
Various measures, including phased implementation, exemptions, allowing 2.74
for variable charging of reusable bags, and cooperatives for small
businesses to buy reusable bags in bulk, have been shown to facilitate
business compliance with single-use bag bans in the US (Cascadia, 2011;
Pape et al., 2011). Other US analysis points to staff training costs
associated with implementing a ban/charge, but also shows that most fee-
based policies adopted in the US direct a proportion of the fee to the retailer
to cover these costs (City of Fort Collins, 2012). Analysis of the Irish charge
shows costs saved in bag purchasing by retailers offset administrative (and
shop-lifting) costs (Convery et al., 2007), thus leading to retailer acceptance
despite initial resistance (Jones, 2012; Pape et al., 2011). Other research
suggests retailers are more resistant to supplier levies, which was expected
to damage business and have no impact on consumer habits, than to
consumer charging (GHK, 2007).
Analysis of the District of Columbia disposable plastic bag tax (Taylor, 2.75
2013) found that worker productivity (e.g., number of items scanned per 10-
minutes) fell 5% during the first few weeks of the tax, but recovered to pre-
tax levels within twelve months as workers adapted and learnt (including
often by learning from co-workers).
Within Wales, research in Cardiff city centre and in rural SE Wales with 2.76
retailers found business responses to the charge were largely neutral or
positive (Frater, 2011b; Jones, 2012). For example, in rural SE Wales, 65%
of retailers reported ‘no effect’ on their business. In terms of economic
impact, most felt there was no impact, while 25% stating their costs had
decreased; similarly, most (66%) felt there was no administrative impact.
However, some sectors (e.g., takeaways, clothing) reported problems, such
as customer annoyance (particularly near the English border), loss of
advertising opportunities (i.e., branded bags), undermining the ‘full service’
experience of expensive clothing or jewellery stores, and concerns about
injury when handing over hot food order (Jones, 2012); some initially also
complained about lack of information from WG (Frater, 2011b). This is
consistent with research from Japan that found supermarkets were more
positive about bag charging that other retailers (Shukuya et al., 2011). As
previously discussed, this highlights the need for further work to examine
differences in perceptions and consumer behaviour across different retailer
types.
Overall, however, it seems most retailers are positive about the charge in 2.77
Wales and indeed the proposed charge in England, provided there are no
exemptions for certain shop or bags (e.g., BRC, 2013; The Grocer, 2014).

108
For example, the Association of Convenience Stores (ACS, 2013) reports
that 62% of British convenience store owners, rising to 82% of Welsh
retailers, support a carrier bag levy. Industry bodies, while largely
welcoming carrier bag charging, have also argued that carrier bag use is a
marginal issue and that attention should be paid to broader issues around
waste, resource efficiency, and the circular economy (BRC, 2014; CIWM,
2013).
Bag manufacturing, wholesale and distribution
The South African, Maltese, and Chinese policies have led to a loss of jobs 2.78
related to single-use carrier bags (Fourie, 2004; O’Loughlin, 2010;
Schembri, 2006). For example, several wholesalers and producers of ultra-
thin plastic bags and containers closed down in China, including the largest
plastic bag manufacturer (Suiping Huaqiang Plastic) with a loss of 20,000
jobs. However, with few, if any, manufacturers in the UK, such effects
would be unlikely here. Indeed, in the UK, there is evidence that new start-
ups have exploited the economic opportunities afforded by SUCB charging
(e.g., Bag Re: Born). Further work could explore these economic
implications further.
Lower demand for SUCBs will have implications on total financial and 2.79
carbon costs of manufacture. The Akullian et al. (2006) study estimated that
the monetised cost of a disposable plastic bag was 10.52¢ / bag (6.53p/
bag). This was made up of CO2 emissions from production: 0.20¢ / bag
(0.12p/ bag); litter: 5.20¢ / bag (3.23p/ bag); landfill: 2.92¢ / bag (1.81p/
bag); and improper recycling: 2.20¢ / bag (1.36/ bag).
Small-basket shops
There is largely only indirect evidence of the impact of carrier bag charging 2.80
on small-basket shops (e.g., Zen et al., 2013). Zero Waste Scotland and
Welsh Government (2012) do note that shoppers buying few items are
more likely than those buying more (e.g., weekly supermarket shop) to use
new SUCBs: 30% of Welsh shoppers deliberately do not use bags-for-life
for ‘small, ad hoc or unplanned’ shops. Similarly, 35% say they do not use
bags-for-life when non-food/clothes shopping (ibid; cf. Jones, 2012).
Distribution of proceeds
Bag charges where funds are donated to charities are more attractive than 2.81
taxes to the public and are associated with lower administration costs for
government than taxes (Scottish Government, 2013). In the first five years
of the Irish levy (2002-2007), over €85m (£67m) had been raised
(McDonnell et al., 2008). By 2012, this had risen to €196m (£154m) in
revenue, although this was only one-tenth that expected due to the
unexpected success of the charge (IEEP, 2014). Money raised covers
administrative costs and supports an environmental fund. In the UK, the

109
voluntary £0.05 food bag charge implemented by Marks & Spencer in 2007
has raised over £4m for environmental charities (Marks & Spencer, 2013).
In a small-scale rural SE Wales survey of retailers, 83% claimed to direct 2.82
proceeds from the charge towards charities (especially local ones), while
10% stated they went towards shop takings. It seems that national retailers
have directed levy funds more towards environmental than other charities,
although fully 17% did not confirm they sent bag sale proceeds to charity
(Vincent Wildlife Trust, 2012, cited in Jones, 2012; cf. The Grocer, 2012).
Impacts of carrier bag charging schemes on government
Costs associated with landfilling (as well as environmental externalities) 2.83
have been assessed in a number of studies (AP EnvEcon Limited, 2008;
IEEP, 2014), as have the savings made from reduced landfill levies (and
associated interest) following the introduction of charges (McDonnell et al.,
2008).
Costs associated with implementing the Irish charge were modest: one-off 2.84
costs for IT and advertising of around €1.5m (£1.2m) and 3% of revenues
(IEEP, 2014).
Convery and McDonnell (2003) reported that the costs of implementing the 2.85
plastax in Ireland were modest and were more than offset by the savings
resulting from not having to provide plastic bags free of charge.
A discussion was held with the Policy Officer (Regulatory Services) at the 2.86
WLGA, as well as a member of the Trading Standards team from Rhondda
Cynon Taf County Borough Council (RCT) regarding the use of the civil
sanctioning powers available to local authorities under the SUCB
Regulations. In particular the discussion concentrated on how Councils
were administering any non-compliance penalties or enforcement costs
recovery. The following points were made by the WLGA:
Trading Standards Officers consider that the legislation is complex with 2.87
regards to enforcement.
An intelligence led approach is used by Trading Standards, so that if few 2.88
complaints or intelligence are received regarding the SUCB charge then it
is unlikely that Trading Standards would seek out retailers that are not
complying with the requirements of the SUCB charge;
The time for enforcement activity is lessened given the 30% austerity cuts 2.89
in Wales in trading standards provision, which will inevitably reduce the
effort on low risk activities such as the SUCB charge;
The approach used by Trading Standards is to use a proportionate, 2.90
prioritised and transparent approach to enforcement. Hence, every
opportunity will be given to retailers to respond to their advice to achieve
compliance. It is only when advice and information is ignored or repeated

110
mistakes are made, that an escalated use of the enforcement tools
available would be used.
Limited data can be made available from Trading Standards on 2.91
enforcement activity related to the carrier bag charge, related to the number
of complaints, requests for advice, and enforcement activities. However,
these data cannot easily be assessed due to the nature of the data
recording by Trading Standards Departments (WLGA, 2014).
Many of these points are also echoed in the views from a Trading 2.92
Standards Officer from RCT. The enforcement mechanism introduced by
the SUCB charge is considered bureaucratic and impractical, and the
charge was introduced without providing any additional resource to Trading
Standards to deal with the charge. Therefore, other enforcement functions
will take priority, and in addition Trading Standards would not be able to
check whether sales of carrier bags are being recorded, and how the
proceeds are being spent (RCT, 2014).
Environmental impacts
Environmental impacts from bag use fall into the following categories: 2.93
Impacts associated with bag manufacture
Impacts associated with bag disposal through the regulated waste system
Impacts associated with improper disposal (e.g., via littering)
The impacts associated with the first two categories have been addressed through a series of LCA studies carried out in different countries.
A typical list of the impact categories considered in the LCAs is as follows: 2.94
Consumption of non-renewable primary energy
Consumption of water
Climate change (emission of greenhouse gases)
Acid rain (atmospheric acidification)
Air quality (ground level ozone formation)
Eutrophication of water bodies
Solid waste production
Risk of litter
The following conclusions were reached from these sources and from a 2.95
screening assessment performed specifically for the Welsh work. A general
concern arising from the review of bag LCAs was that the study had been
commissioned by particular bag manufacturers, with some potential for
bias.

111
Most LCAs that specifically compared paper and plastic bags (Franklin, 2.96
Carrefour/AEAT, Boustead Consulting and Schwarzwalder et al) were
consistent in showing that paper bags perform worse than plastic against
most burden categories. On this basis, a proposal for a charge that left
scope for an increase in paper bag use would appear to have potential for
significant adverse consequences. Indeed, WRAP’s response to the
Scottish Environmental Levy Bill (WRAP 2004) stated a levy that
substituted plastic bags with free paper bags would be a step in the wrong
direction.
A review of additional LCA data, particularly from Ecoinvent and 2.97
BUWAL250, suggested that the differences between paper and plastic may
not be as large for some impact categories, notably global warming and
fossil fuel use, as suggested by these comparative analyses. Significant
variation in the environmental performance of paper manufacture was
observed between different assessments, reflecting factors such as the
availability of water and renewable sources of energy (water and
wood/biomass). However, whilst there seems scope to question the extent
of differences previously reported between the choice of paper or plastic,
no firm rationale has been identified for preferring “average” paper
manufacture to plastic. On this basis the concern was considered valid that
there could be adverse environmental consequences of a charge that
applied only to lightweight plastic bags and not to paper carrier bags. The
Billerud study challenged this view, in concluding that paper bags have a
lower impact on global warming (the only impact category assessed in the
study) than plastic bags. However, Billerud considers only one (Swedish)
manufacturer and makes some assumptions that are unfavourable to
plastic bags.
Studies comparing single use bags with heavyweight bags available from 2.98
supermarkets tend to show that the heavier bags outperform the lighter
ones if used about four times more. Factoring bin liner usage into the
analysis, as in the work done by AEA Technology for the Scottish Executive
(AEA Technology, 2005), did not have a significant negative impact on the
overall results. The extent to which lightweight plastic bags may continue to
substitute for bin liners was questioned in the light of changing systems for
municipal waste collection by local authorities across the UK, particularly in
relation to the separate collection of food waste (also see Section 2
‘Substitution Effects’). This may lead to increased use of cornstarch bags,
but not bags made from HDPE and other non-bio plastics. The AEA
Technology study also demonstrated that exempting some businesses
(SMEs and charity shops) would have a small negative impact on the
results, which was of course to be expected.

112
A further question concerns whether recycled or biodegradable bags offer 2.99
advantage over HDPE single use carrier bags. It was concluded that they
do not for the following reasons:
Lightweight bags of any material are equally as likely to cause 2.100
problems through littering.
Degradable bags can take a substantial amount of time to degrade, in 2.101
the order of months or years. They therefore have the potential to persist as
litter in the environment. Rapid degradation is only ensured when they are
sent to composting plants that operate at optimised conditions (i.e.
environmental parameters such as temperature, moisture content and
residence time), otherwise degradation may not occur.
Once degradable bags start to fragment they become more difficult to 2.102
collect and fragments may be more easily ingested by animals.
The LCA by Boustead Consulting raised questions about the broader 2.103
lifecycle impacts of biodegradable bags.
A mixture of non-degradable and degradable bags in the waste stream 2.104
would be problematic for attempts to recycle bags, as degradable plastics
can contaminate and results in non-degradable plastic not being suitable for
use.
Recycling is lower in the waste hierarchy set out in the EU Waste 2.105
Framework Directive than waste reduction.
This does not rule out the use of degradable bags in some applications, for 2.106
example the use of corn starch bags to line bins in areas where food waste
is collected separately for composting (indeed, these are provided by some
local authorities in Wales for this purpose).
Overall, it was concluded that long-life bags outperform single use bags 2.107
and that plastic outperforms paper. No comparison with other bags (e.g.,
those made from cotton or canvas) was been made as these had not been
included in the LCAs reviewed.
A major contribution to the literature since the 2009 study was carried out 2.108
for the Welsh Government was commissioned by the Environment Agency
and published in 2011. This considered the following types of bag available
on the market in 2006:
a conventional, lightweight carrier made from high-density polyethylene (HDPE);
a lightweight HDPE carrier with a prodegradant additive designed to break the down the plastic into smaller pieces;
a biodegradable carrier made from a starch-polyester (biopolymer) blend;

113
a paper carrier;
a ‘bag-for-life’ made from low-density polyethylene (LDPE);
a heavier more durable bag, often with stiffening inserts made from non woven polypropylene (PP); and
a cotton bag.
The following impact categories were considered: 2.109
Resource depletion
Acidification
Eutrophication
Human toxicity
Fresh water and marine aquatic ecotoxicity
Terrestrial ecotoxicity
Photochemical oxidation (ozone formation)
The main conclusions of the research were as follows: 2.110
The environmental impact of all types of carrier bag is dominated by 2.111
resource use and production stages. Transport, secondary packaging and
end-of-life management generally have a minimal influence on their
performance.
Whatever type of bag is used, the key to reducing impacts is to reuse it as 2.112
many times as possible and where reuse for shopping is not practicable,
other reuse, e.g., to replace bin liners, is beneficial.
Starch-polyester blend bags have a higher global warming potential and 2.113
abiotic depletion than conventional polymer bags, due both to the increased
weight of material in a bag and higher material production impacts.
The paper, LDPE, non-woven PP and cotton bags should be reused at 2.114
least 3, 4, 11 and 131 times respectively to ensure that they have lower
global warming potential than conventional HDPE carrier bags that are not
reused.
Recycling or composting generally produces only a small reduction in 2.115
global warming potential and abiotic depletion.
The conclusions in the Environment Agency’s newer LCA work therefore 2.116
support the conclusions reached in the original study for Welsh
Government, that all types of bag should be considered. This is particularly
interesting given the position proposed for England, where paper and
biodegradable bags would be exempted from a charging scheme.

114
A Life Cycle Analysis (LCA) study, conducted by Imperial College London 2.117
on behalf of the National Non-Food Crops Centre (NNFCC), compared the
environmental impacts of four single use bags; a lightweight HDPE bag, a
starch polyester biopolymer bag (under brand name Mater-bi), a
PLA/Ecofoil biopolymer bag (Octopus) and an oxo-degradable HDPE bag
(Murphy et al, as reported by Environment Agency, 2011). These relate to
monetised damages as per the DECC’s carbon values, as outlined in Table
4. The performance of each type of bag, accounting also for different waste
management options (energy from waste (EfW) (i.e. incineration with
energy recovery), landfill and recycling) is shown in Table 3, relative to the
HDPE/EfW case. As is often the case in LCA work, results are mixed, with
no option performing best against all parameters (highlighted by the
HDPE/EfW option having the worst performance against global warming,
but the best against acidification). Results in the original report are provided
in terms of mass emission or material use, and can be used in part at least
for appraisal of the environmental impacts of introducing the charge.
Table 3: Life Cycle Assessment (LCA) of different single use bag options,
accounting for alternative waste management routes. All figures relative to
the HDPE/EfW case
Bag type End of life
processing
Global
warming
(kg CO2
eq)
Abiotic
depletion
(kg Sb
eq)
Acidification
(kg SO2 eq)
Eutrophication
(kg PO4 eq)
HDPE
EfW 1.00 1.00 1.00 1.00
Landfill 0.72 1.09 1.18 1.05
Recycling 0.60 0.68 1.16 0.73
Oxo-
degradable
EfW 0.82 0.27 1.03 0.41
Landfill 0.57 0.35 1.18 0.45
Mater-bi
EfW 0.67 0.69 1.05 2.05
Landfill 0.43 3.08 1.17 3.40
Recycling 0.77 0.76 1.17 2.08
Octopus
EfW 0.73 0.92 1.86 4.03
Landfill 0.43 1.00 2.03 5.84
Recycling 0.86 1.02 2.02 4.05
Source: Murphy et al 2008 featured in Environment Agency, 20118
8 EfW = Energy from Waste

115
Table 4: DECC’s updated short-term traded sector carbon values for
policy appraisal in real 2013 terms, £/tCO2e
The RIA carried out by the Welsh Government before introducing the SUCB 2.118
charge quantified costs associated with the greenhouse gas burden of
different types of bag. It said that the analysis performed in the RIA would
be reviewed and adjusted as required to account for alternative data and
assumptions on the number of bags used. Further contact with WRAP will
be necessary to consider whether further data than the information so far
published on line (WRAP, 2014a; 2014b) will be made available. Costs
linked to GHG emissions will then be quantified using HM Treasury Green
Book Supplementary Guidance (DECC, 2013).
Impacts of carrier bag charging schemes on litter and littering
behaviour
There are good reasons to believe that a carrier bag charging scheme can 2.119
reduce the amount of urban, rural and marine litter. The risk of littering
plastic bags is substantially reduced where fewer of them are given out,
even if plastic bags only account for a small proportion of litter (PAFA,
2014). However, analyses to determine the impacts of carrier bag schemes
on litter are difficult to ascertain, as there often already is a stock of littered
items in the environment (Sherrington et al., 2012). Furthermore, littering
rates may differ per country, making it difficult to extrapolate findings from
one country to another (Lyons, 2013).
While there is little systematic evidence regarding the impacts of a plastic 2.120
bag charge on the prevalence of littering, Ireland’s Litter Monitoring Body
(2003, 2005) has shown that the proportion of plastic-bag litter fell from 5%
prior to the introduction of the plastic bag levy to 0.32% in 2002, 0.25% in

116
2003 and 0.22% in 2004. At the same time, a series of litter surveys
conducted by An Taisce (National Trust of Ireland) and Irish Business
Against Litter (IBAL) found that the number of ‘clear’ areas (i.e., areas in
which there is no evidence of plastic bag litter) increased by 21% between
January 2002 and April 2003, while the number of areas without traces
increased by 56% over the same period (Convery et al., 2007). This is also
supported by Keep Wales Tidy based on feedback from Tidy Towns
Officers across Wales, which stated that they have observed a significant
reduction in the number of carrier bags littered since the introduction of the
SUCB charge (Keep Wales Tidy, 2014).
The impacts of other carrier bag charging schemes on litter and littering 2.121
behaviours have not been studied systematically. Keep Wales Tidy only
observed a marginal decrease in littered carrier bags following the
introduction of the Welsh SUCB charge, using their annual Local
Environmental Audit and Management System (LEAMS) survey. They
found that the number of local authority streets with carrier bag litter
dropped from 1.1% the year before to 0.9% the year after the introduction
of the charge. These street-data are likely to understate the extent of carrier
bags litter. Carrier bags are easily dispersed due to their physical properties
of being lightweight and ‘aerodynamic’, and are therefore easily blown away
into trees and river banks (Keep Wales Tidy, 2013; Godman, 2013).
The impacts on marine litter may therefore be more pronounced. Indeed, 2.122
plastic, including carrier bags, make up a great part of marine litter. This is
an increasing problem around the world, with plastic bags accounting for
approximately 9% of all litter found on the coastline (MCS, 2013). There are
some indications that carrier bag charging schemes may help to reduce
marine litter. Coastal survey data collected by Coastwatch
(Coastwatch.org) showed a reduction in plastic bag litter from 10 to 5
plastic bags per 500 meters of beach in the year following the introduction
of the Irish plastic bag levy. The mean number of plastic bags per 100
meters of surveyed beach is also consistently higher in the UK than in
Ireland, which may reflect fewer plastic bags being given out in Ireland as
compared to the UK (Doyle & O’Hagan, 2013).
The high number of plastic bags being found on UK beaches was 2.123
confirmed by the Beachwatch surveys carried out by Marine Conservation
Society (MCS): in the 2012 survey 4,092 plastic bags were found on 238
beaches around the UK, which equates to 45 bags for every kilometre of
coastline surveyed (MCS, 2013). It is currently not know if the Welsh SUCB
charge has led to less carrier bag litter on Welsh beaches. Here it also has
to be noted that it may be difficult to attribute changes to any particular
policy, such as the Irish and Welsh charges. Plastic bags do not necessarily
wash up on beaches in country in which they were issued. Bags found on a

117
beach may have originated from abroad (Sherrington et al., 2012), although
it could be assumed that the changes will be the greatest in the areas in
which the reduction has taken place.
Health impacts
There have been press reports raising concerns over the potential for bag 2.124
re-use to increase rates of infection from E.coli, Campylobacter, Salmonella
and other organisms9. The same is unlikely to apply to an SUCB provided
that it is only used once and manufactured, transported and stored under
clean conditions. These reports mainly reference analysis by Klick and
Wright (2012) who assessed data for San Francisco County, the first major
US jurisdiction to enact a ban on plastic grocery bags. The ban,
implemented in 2007 for larger stores, banned single use non-compostable
bags and required a charge to be levied for the supply of other bags. From
their analysis, Klick and Wright concluded that: “there is evidence that
reusable grocery bags … contain potentially harmful bacteria. We examine
emergency room (ER) admissions related to these bacteria in the wake of
the San Francisco ban. We find that ER visits spiked when the ban went
into effect. Relative to other counties, ER admissions increase by at least
one fourth, and deaths exhibit a similar increase”10.
2.125
Figure 5 shows data for data for 2.5 years before and after the ban was 2.126
introduced to San Francisco (each period = 1 quarter). Results show a
discontinuity at the time that the ban was introduced with results averaging
40 admissions per quarter before the ban and increasing to around 60 per
quarter 2.5 years after it was introduced.
Figure 6 shows the trend in neighbouring counties where the ban was not in 2.127
place over the same period, indicating no increase in emergency room
visits. We note that the lack of variability after the introduction of the ban
looks strange. Klick and Wright report similar findings for Campylobacter
and Salmonella, but not Toxoplasmosis. Turning to mortality, the authors
report an additional 5 deaths per year amongst the residents of San
Francisco County after the introduction of the ban.
9 See, for example, http://www.dailymail.co.uk/health/article-2478235/How-bag-life-POISON-Expert-warns-reusable-carriers-contaminated-E-coli.html. 10 The quoted text is from a version of the Klick and Wright report dated November 2012. In an earlier version, dated August 2012, conclusions are stronger: the San Francisco bag ban led to a 50-100% increase in deaths and emergency room visits due to foodborne illness (e.g., E-coli) associated with reusable bags. Preference is here given to the later version.
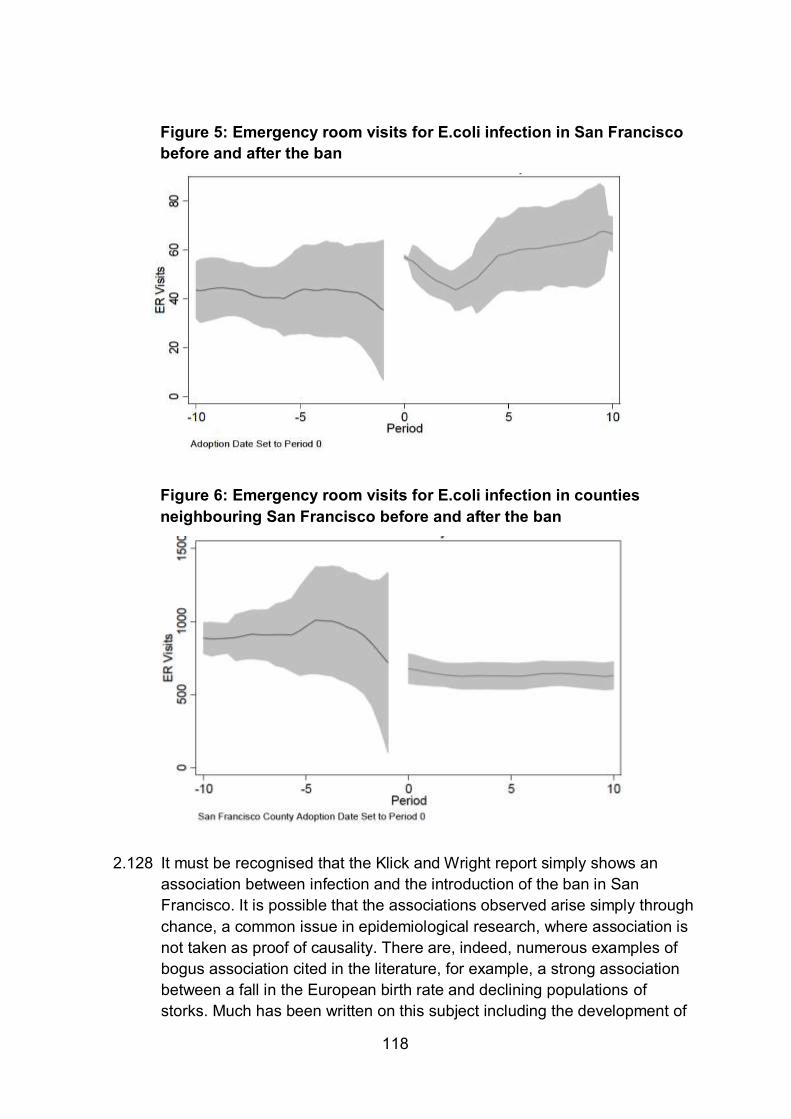
118
Figure 5: Emergency room visits for E.coli infection in San Francisco
before and after the ban
Figure 6: Emergency room visits for E.coli infection in counties
neighbouring San Francisco before and after the ban
It must be recognised that the Klick and Wright report simply shows an 2.128
association between infection and the introduction of the ban in San
Francisco. It is possible that the associations observed arise simply through
chance, a common issue in epidemiological research, where association is
not taken as proof of causality. There are, indeed, numerous examples of
bogus association cited in the literature, for example, a strong association
between a fall in the European birth rate and declining populations of
storks. Much has been written on this subject including the development of

119
the Bradford Hill criteria / Hill’s criteria for causation, published in 1965 (Hill,
1965) that provide a strategy for evaluating evidence of association. A
search on Pub Med using the terms [plastic, bag, coli, campylobacter,
salmonella, shopping] in various combinations identified no studies in the
peer reviewed literature. This in itself is not a reason for disregarding the
Klick and Wright analysis, as it is quite possible that no-one else has
investigated the problem. Recognising that their findings suggest a
significant effect on public health, we now consider whether there are
alternative explanations for the observed association, whether a possible
link in San Francisco may not apply in Wales, and what available data on
infection rates from the UK might indicate on this matter.
The Klick and Wright paper does not consider alternative explanations for 2.129
their association. It also does not assess whether other changes occurred
at the same time as the bag ban. These could include, for example, a
change in the regulatory regime for restaurants (e.g. reduced inspections of
food establishments following budget cuts), to a change in the sourcing of
food. Further to this, the paper does not consider how individuals were
infected, whether from the purchase of raw food or from eating in
restaurants.
There are a number of reasons why results in Wales may be different. The 2.130
San Francisco ban is specifically on plastic bags, but this does not rule out
other single use bags, for example made of paper. It is, however, difficult to
see how the use of Kraft paper bags (commonly used in the USA) would
promote the spread of infection if used only once. Weather conditions
relative to temperature and humidity may be a factor, as may differences in
shopping behaviour, restaurant cuisine and the inspection regime for food
suppliers. There may be differences in the sale of root vegetables in
relation to the amount of earth left on at point of sale. In any event, the
increase in risk associated with bag re-use by Klick and Wright seems very
large.
The question then arises of how incidence rates for infection with 2.131
Salmonella, E. coli and Campylobacter have changed in Wales after the
introduction of the charge. Available data from the public health authorities
are not supportive of the trend observed in San Francisco (Error!
Reference source not found. for Salmonella, Error! Reference source
not found. for Campylobacter based on information from Public Health
England, 2014). The Public Health England data for Salmonella showed a
large difference between rates for Wales and England. However,
recalculation of incidence rate per 100,000 population based on total
incidence reported by Public Health England together with population data
for the regions, showed broadly comparable rates between England and
Wales (Error! Reference source not found.). The English data are useful

120
as an indication of trends in the absence of the SUCB charge. Results for
Salmonella show a long-term decline in both England and Wales. Rates
increase in 2013 for Wales, but only slightly. Comparing the lines for
England and for Wales for the final years shown, when the bag charge
applied in Wales shows the two lines coming together. There is a slight
increase in the rate for Wales, but it is slight and certainly within the
variability observed between years.
Figure 7: Trends in Salmonella incidence rates in Wales and England
over time
Source: Rates taken directly from Public Health England, 2014

121
Figure 8: Trends in Campylobacter incidence rates in Wales over time,
Source: Rates taken directly from Public Health England, 2014
Clearly the most relevant data in Figure 8 concern the final years, with the 2.132
introduction of the SUCB charge. A longer time series is useful, however, to
enable assessment of typical fluctuations in data. Results for
Campylobacter show more variability than for Salmonella, with an increase
of about 50% since 2003. Rates in England also increase by a broadly
similar rate over this period (Public Health England, 2012: differences in
presentation between Public Health Wales and Public Health England
prevent the two datasets being plotted on the same figure for the present).
The increased rate in Wales continues into the period after the bag charge
was introduced, but the rate of increase is no greater than for the years
immediately before.
Overall, the data currently available suggest that the conclusion of Klick and 2.133
Wright from San Francisco, that reusing bags leads to a major increase in
severe illness from exposure to food-borne pathogens, does not apply to
Wales. However, this issue needs to be kept under review in the coming
years. It is interesting that there is no mention of this risk on the website of
the Environment Department of the City and County of San Francisco.

122
In this literature review international evidence was collated on the 3.1
effectiveness of carrier bag charging schemes to reduce the consumption
of SUCBs, considering their impacts on consumers, businesses and
government. Although various factors (e.g., income, culture, nature of
policy) make comparisons across countries difficult, there are nevertheless
various lessons that can be drawn for decision-making about the Welsh
SUCB charge.
The literature search has shown that a range of approaches have been 3.2
used to minimise SUCB usage, and the evidence shows that carrier bag
charges are generally popular amongst the general public, with popularity
tending to increase once they are implemented and their benefits (e.g.,
reduced litter) are observed. The popularity of charging schemes is also
associated with the proceeds being donated to charity rather than kept by
retailers or government, highlighting the importance of communicating
these schemes’ details and benefits.
The available evidence on the effectiveness of carrier bag charging 3.3
schemes suggests that a reduction of 50 to 95% can be achieved in the
short term, depending on the size of the charge, details of the design, and
the quality of the communication accompanying the introduction. The Irish
‘plastax’ levy appears to be one of the most successful schemes to date,
initially producing a 94% reduction in plastic bag use but started to increase
slightly again later. Less is known about the long-term effectiveness of
plastic bag charging, although there is some evidence from Ireland and
South Africa. In both cases, and after initial dramatic declines, small rises in
SUCB use were observed, which have been attributed to the diminishing
value of a charge in real terms as a result of inflation and an absolute
reduction in the charge, respectively. The evidence suggests that a plastic
bag charge should not be reduced, and may even need to be increased
after a number of years in order to retain its effectiveness. The latest Welsh
figures (from supermarkets) indicate that the initial decline of over 70% in
SUCBs has been sustained, albeit with a small increase in 2013.
In terms of behavioural adaptations, bag re-use, abstention from using bags 3.4
and bag optimisation have been observed in a number of studies. So far,
there is no concrete evidence of positive spillover from bag charges to other
waste or pro-environmental behaviours, although charging interventions
and policies have not typically been designed to produce such spillover
effects or to encourage consumers to make any connection between the
charge and broader consumption behaviours.
In terms of substitution effects from SUCB charging, evidence suggests 3.5
there has been only a small increase in bin liner sales as compared to the
overall reduction in SUCB use, while there have been large increase in

123
bag-for-life sales. While most shoppers re-use bags-for-life several times,
there is evidence that more heavy-duty plastic bags end up to landfill as a
result of a SUCB charge.
The impacts of carrier bag charging schemes on litter are difficult to 3.6
ascertain with little systematic evidence. Evidence from the Irish levy
suggests reductions from 5% to 0.22% in urban litter after several years,
while Welsh data to date indicate much smaller reductions. Reductions in
marine litter are likely to be more pronounced, as plastic bags are easily
blown into waterways and washed out to sea. Indeed, evidence from
coastal surveys shows that fewer plastic bags have washed up on shores
following the introduction of the Irish levy. In respect of the impacts of
carrier bag charging schemes on shoplifting, evidence suggests little or no
increase. Where small increases in (perceived) shoplifting were observed
(e.g., in Ireland), this was temporary and greatly outweighed by retailers’
savings associated with purchasing fewer bags and related storage costs.
Limited research has been conducted on the relative effectiveness of 3.7
different policy instruments to reduce the consumption of SUCBs.
Comparisons of the economic, social and environmental impacts of
coercive (bans), market-based (charges), or voluntary (non-regulatory)
measures to reduce plastic bags highlight the various strengths and
weaknesses of each approach, but tend to favour charging schemes in
terms of offering a balance of environmental benefits, consumer
choice/equity, and business/administrative costs. Furthermore,
comparisons of the efficacy of these three types of measure where they
have been rolled out by national governments shows charges to be slightly
more effective (73% reduction in plastic bags) than bans (68% reduction),
and considerably more effective than voluntary measures (31% reduction) –
although there is considerable variation within each of these categories due
to various contextual factors relating to implementation, acceptance, and so
on. However, even simple, low-cost interventions, such as removing plastic
bags from sight or cashiers asking shoppers if they want a bag, rather than
staying silent, can produce some modest reductions in SUCBs.
There is conflicting evidence about the level at which a tax or charge needs 3.8
to be set to be effective. It is not necessarily the case that higher charges
are more effective than lower charges. Rather, a charge could also be
understood as a ‘habit disruptor’ that forces shoppers to make a conscious
decision as to whether they want to use a plastic bag or not. Currently very
little known about the influence of retailer behaviour on the effectiveness of
carrier bag charging schemes. It is possible that the ease at which plastic
bags can be obtained (e.g., at self-service check outs) may have a
substantial impact on the number of SUCBs given out.

124
There is only limited evidence of differential impacts of bag charging on 3.9
different consumer groups. Pre-existing differences in bag re-use appear to
endure once a charge is implemented: women and older age groups are
most likely to take their own bags shopping. There is also some evidence
that higher income groups and those with less positive attitudes towards
bag reuse appear to be less likely to reuse bags.
Broadly speaking, retailers have expressed positive opinions about bag 3.10
charging, particularly once initial fears (e.g., about shoplifting) are not
realised and benefits (reduced costs, etc.) are experienced. Indeed, the
responses from the British Retail Consortium and Association of
Convenience Stores to the Environment Audit Committee expressed
disappointment that their members were to be exempted from charging
under the proposed scheme for England. However, there seem to be
differences between retailer categories, with some (e.g., takeaways,
clothing stores) experiencing more difficulties. Negative impacts on bag
manufacturing, with associated job losses, have also been recorded;
although this is unlikely to affect Wales where bags are typically imported.
Charity donations raised by charging are significant, although a small
proportion of retailers may be keeping funds raised. However, the
approaches used vary, for example in Northern Ireland, the money raised is
paid into a central fund, compared to the Welsh approach of retailers being
responsible for the dissemination of the money raised.
The initial work for the Welsh Government prior to the introduction of the 3.11
charge identified environmental benefits from applying the charge to all
types of bag. This conclusion is supported by the more recent LCA work
carried out for the Environment Agency, even if it has not been followed in
the English proposals for a bag charging scheme.
There has been no noticeable increase in Wales in illnesses associated 3.12
with food hygiene (e.g., Salmonella, Campylobacter), despite research from
the USA that found a link between illness and a non-compostable carrier
bag ban.
Overall, changes in bag sales clearly show that carrier bag policies can 3.13
have a positive impact on bag usage. However, further assessment is
needed on the wider impacts of such policies, including littering, impacts on
consumer behaviour (e.g., substitution, spillover), and economic impacts, to
gain a more holistic view on the impacts of such policies. The quality of the
evidence from much of the existing research on wider impacts is not high.
Very few studies use nationally representative samples or control groups,
and many rely on self-reported behaviours (which tend to under-estimate
SUCB use, for example) rather than behavioural observations or other
objective measures. Furthermore, more evidence exists about the impacts
of bag charging in the food chain context than in the context of other retailer

125
types, despite indications that there are wide variations in retailer
experiences and consumer practices with respect to bag charging across
the retail sector.

126
Introduction
To evaluate the impact of the SUCB charge in Wales, a range of impacts 4.1
will need to be considered in the following areas:
SUCB manufacturers, wholesalers and distributors
Retailers
Public/ consumers
National and local government
Charitable donations, i.e. distribution of proceeds
Waste management
Other environmental impacts
Health impacts
Impacts in each of these areas will be considered and data availability and 4.2
robustness considered.
Those data sources discussed within the literature review as well as wider 4.3
sources of data that could potentially be used within the policy evaluation
stage of the project are discussed within this section of the report. The data
available within the literature review was analysed to understand what
additional primary research would be required to undertake the evaluation.
Data Availability
Manufacturers, distributors and wholesalers
No data have been identified on the impact of the SUCB charge on 4.4
manufacturers, distributors and wholesalers in the UK. Sherrington et al
(2012) reported that based on the engagement with industry stakeholders,
between 90 and 98% of HDPE and PP bags were imported from the Far
East, and that it was likely that most cotton bags are also produced in this
way.
The impact on manufacturers has been identified elsewhere, with other 4.5
countries reporting job losses as discussed in Section 2. These countries
include South Africa, Malta and China (Fourie, 2004; O’Loughlin, 2010;
Schembri, 2006).
This limited data suggests that the impact of the SUCB charge on the 4.6
manufacturing of SUCBs in the UK is likely to be limited; however the
impact on wholesalers and distributors of SUCBs in Wales may have a
larger impact. Data collation should also consider those manufacturers,
wholesalers and distributors producing bags-for-life. This is an aspect for
which data will need to be collated for inclusion in the evaluation.
Retailers

127
The key contributory impacts to retailers are likely to include: 4.7
Bag sales
Administrative burden
Shoplifting
Small basket effects
WRAP publish data on an annual basis on the sales of single use carrier 4.8
bags across the UK from seven of the UK’s leading supermarkets, which
provides a regional breakdown for Wales. This is a key data source for use
in the evaluation of the SUCB charge. However, data from other sectors are
limited. Companies with greater than 10 employees are required to record
the number of SUCBs sold, and this provides scope that the data may be
available if companies are contacted for this data.
Limited data have been found on the cost to retailers of administering the 4.9
SUCB charge in Wales. As discussed in Section 2, a small survey in Cardiff
and SE Wales suggested that 66% of those surveyed (n=93) did not
consider that the SUCB charge was an administrative burden to their
business. Data available from the US and Ireland suggest that the
administrative costs are offset by the costs saved in bag purchasing
(Cascadia, 2011; Pape et al., 2011; Convery et al., 2007).
Limited data are available on the impact of the SUCB charge on shoplifting. 4.10
Overall, retailers in the UK have reported a decline in shoplifting (ACS,
2014). Data from retailers in Ireland suggest that shoplifting rose initially but
returned to their pre-charge levels within a year of its introduction (data
based on retailer perception rather than shoplifting statistics).
No data has been found on the impact of SUCB charges on small basket 4.11
shops.
Public/ Consumers
A number of studies have been undertaken to assess public response to 4.12
the SUCB charge in Wales and elsewhere, which were discussed in
Section 2. However, data are limited on the public attitudes and behaviours
to the charge in different sectors in Wales. It would be beneficial to gain an
understanding public attitudes and behaviours to the charge in various
sectors, circumstances (e.g. differences between adhoc and planned
shopping trips), as well as the impact on other pro-environmental
behaviours.
A key aspect to consider is the potential impact of claimed and actual 4.13
behaviour on public response to the charge.
National and local government
128
No data are available on the impact of the SUCB charge on the 4.14
administration at both national and local government level. Discussions
held with Trading Standards representatives from WLGA and RCT (see
Section 2) suggest that obtaining data on their effort in relation to the SUCB
charge would be difficult due to the manner in which their data are collated
and recorded. Therefore, any data would be limited to qualitative feedback
discussed in this report, or potentially from wider engagement with local
authorities in Wales. However, it is anticipated that data may be available
from Welsh Government related to its policy activities.
Charitable donations
As the net proceeds of the charge are distributed directly by the retailer, 4.15
data on the donations made as a result of the charge are limited. However,
a desktop study of large retailers has enabled some data to be collated
from a range of sectors, including supermarkets, department stores, and
clothes stores. However, this data set is limited.
Waste management and other environmental impacts
A number of LCA studies have been conducted on the relative impacts of a 4.16
range of bag types as discussed in Section 2, and these data are available
for use within the next stage of this project to evaluate the impact of the
SUCB policy in Wales.
It is not possible to identify from audited data sets (WasteDataFlow and 4.17
Natural Resources Wales quarterly returns submissions) the management
of different bag types as they do not have a unique European Waste
Catalogue code, and thus they will be mixed with other plastic types. For
example, plastic carrier bags would be mixed in with other plastic films.
A range of published data sources are available to enable the costs 4.18
associated with waste management costs to be identified. These includes
the annual WRAP Gate Fees Reports11, as well as the income associated
with the sale of a range of a number of material types to reprocessors from
a number of websites including:
www.letsrecycle.com
www.mrw.co.uk
There is not a robust data set relating to litter. However there is a limited 4.19
data set available from Keep Wales Tidy regarding the prevalence of carrier
bags in litter. Keep Wales Tidy has provided a breakdown of the LEAMS
survey results related to carrier bags present in litter samples from each of
the local authorities in Wales (discussed further in Section 2). These data
do provide a number of carrier bags found within the sample areas in each
local authority. However, further discussion is needed with Keep Wales
11
Available from: www.wrap.org.uk

129
Tidy to discuss these data, in terms of the definitions used for carrier bags,
i.e. do the data relate to plastic carrier bags only. There are also some
additional data available on marine/ coastal litter which were also discussed
in Section 2, including that from the Marine Conservation Society and
Coastwatch (MCS, 2013).
Health impacts
As discussed in Section 2, there have been press reports raising concerns 4.20
over the potential for bag re-use to increase rates of infection from E.coli,
Campylobacter, Salmonella and other organisms. The same is unlikely to
apply to an SUCB provided that it is only used once and manufactured,
transported and stored under clean conditions. However, the data to
support this are limited, as the reports mainly cite analysis by Klick and
Wright (2012). A high level analysis was conducted on data from Public
Health England which suggested that the trends observed in San Francisco
do not apply to Wales. However, this is an area which should be kept under
review as more research and data become available.
Table 5 summarises data availability for the policy evaluation stage of the 4.21
project.

130
Table 5: Data Review Matrix
Input data required Data in
existing
literature
review
Are data
available
for Wales
Year for
which data
are
available
Impacts to manufacturing industry
Revenue (after SUCB charge) No - -
Revenue (before SUCB charge) No - -
Response to loss of Welsh market for manufacturing
SUCBs No - -
Impacts on retailers
Cost per bag purchased (excl VAT), before and after
charge introduced Yes No
Prices
available
online
Carrier bags sold after SUCB charge
Partial –
supermarkets
only
Yes
Data
available from
2010
Carrier bags sold before SUCB charge
Partial –
supermarkets
only
Yes
Data
available from
2010.
% retailer revenue reduced as a result of "small
basket effects" whereby SUCB charge puts off
"small basket" customers from shopping.
No - -
Other impacts to retailers arising from the need to
buy and store fewer bags. No - -
% revenue reduced by shoplifting Limited data Limited 2012
Change in demand for heavy duty plastic bags
(quantitative) Limited data Yes 2012
Change in demand for bin liners (quantitative) Limited data Yes 2012

131
Input data required Data in
existing
literature
review
Is data
available
for Wales
Year for
which data
is available
Charitable donations
Charitable contribution per bag sold Limited data
For some
retailers in
Wales
2013/14
Change in other charitable contributions after SUCB
charge Limited data
For some
retailers in
Wales
2013/14
Type of charity to which donations were made Limited data
For some
retailers in
Wales
2013/14
Costs to national and local government
Administrative costs for implementation/
enforcement for WG No - -
Administrative costs for implementation/
enforcement for local government No - -
Waste stream impacts
Weight per bag Yes, quantitative - Various
sources
% of SUCBs reused Limited data Yes 2012
% of SUCBs recycled Limited data Yes 2012
% of SUCBs to landfill Limited data Yes 2012
Quantity of additional bags bought by the public to
replace carrier bags previously used for holding
sports kits, sandwiches, various wastes, etc.
Limited data Yes 2012
Costs for waste management
Recycling cost per bag - recyclate revenue per bag Yes No – UK wide
Current
prices
available
Landfill cost per tonne
Landfill tax rates,
currently
£80/tonne for
bag waste
Yes 2014/15
Cost for clearing up bag litter No
Environmental and health impacts
CO2 per bag Yes N/A Various
Shadow price of carbon Yes N/A 2013
Change in behaviour relating to other natural
resource use (not SUCB) (qualitative) Limited data Yes 2012
Littering of carrier bags Limited data Yes 2013/14
Health impacts
Admissions due to E. Coli, salmonella and
campylobacter bacteria related to bag reuse
(qualitative)
Yes, quantitative Yes 2013

132
References
ACS (2013). Environmental Audit Committee Inquiry into Plastic Bags. Evidence
from ACS (the Association of Convenience Stores) [Online]. Available from:
www.acs.org.uk/filemanager/root/site_assets/submissions/2013/environmental_audit
_committee_inquiry_into_plastic_bags.pdf
ACS (2014). Voice of Local Shops - Survey 9 (February 2014) [Online]. Available
from:
www.acs.org.uk/filemanager/root/site_assets/research/vols_ix/vols_9_print_amende
d_.pdf
Adane, L., & Muleta, D. (2011). Survey on the usage of plastic bags, their disposal
and adverse impacts on environment: A case study in Jimma City, Southwestern
Ethiopia. Journal of Toxicology and Environmental Health Sciences, 3(8), 234-248.
AEA Technology (2005) Proposed Plastic Bag Levy - Extended Impact Assessment:
Volume 1: Main Report. Produced for the Scottish Government [Online]. Available
from: http://www.scotland.gov.uk/Publications/2005/08/1993154/31553
AEA Technology (2009) Welsh Assembly Government, Single Use Bag Study.
Report to the Welsh Assembly Government
AP EnvEcon Limited (2008). Regulatory Impact Analysis on Proposed Legislation to
Increase Levies on Plastic Shopping Bags and Certain Waste Facilities. A Report for
the Department of the Environment, Heritage and Local Government November 2008
Austin, A., Cox, J., Barnett, J. & Thomas, C. (2011). Exploring catalyst behaviours.
London: Brook Lyndhurst.
Ayalon, O., Goldrath, T., Rosenthal, G., & Grossman, M. (2009). Reduction of plastic
carrier bag use: An analysis of alternatives in Israel. Waste Management, 29(7),
2025-2032.

133
Baker, A. (2010). Fees on Plastic Bags: Altering Consumer Behavior by Taxing
Environmentally Damaging Choices
Billerud, 2009, Executive summary for Billerud Carbon Footprint – overview
documentation [Online]. Available from:
http://www.korsnas.com/Documents/Carbonfootprint_study.pdf
Boustead Consulting, 2007, Life Cycle Assessment for Three Types of Grocery Bags
- Recyclable Plastic; Compostable, Biodegradable Plastic; and Recycled, Recyclable
Paper [Online]. Available from:
http://heartland.org/sites/default/files/threetypeofgrocerybags.pdf
BRC (2011). A Better Retailing Climate Progress Report 2011. British Retail
Consortium [Online]. Available from:
www.brc.org.uk/ePublications/ABRC2011/files/assets/basic-html/page20.html
BRC (2013). A Better Retailing Climate: Driving Resource Efficiency. British Retail
Consortium [Online]. Available from:
www.brc.org.uk/ePublications/ABRC_Driving_Resource_Efficiency/index.html#/1/zoo
med
Cascadia (2011) Single-Use Carryout Bags Study. Report to the City of Milipas, CA
Cherrier H. (2006). Consumer identity and moral obligations in non-plastic bag
consumption: a dialectical perspective. International Journal of Consumer Studies 30
5 515-523
City of Fort Collins (2012) Triple bottom line consideration of plastic bag policy
options. Report prepared by Brendle Group.
CIWM (2013). Carrier bag charge is a positive move but there are still bigger issues,
says CIWM. Chartered Institution of Waste Management, 16/09/13 [Online].
Available from:

134
www.ciwm.co.uk/CIWM/MediaCentre/Current_pressreleases/Press_Releases_2013/
ciwm_news_160913.aspx
Clapp, J., & Swanston, L. (2009). Doing away with plastic shopping bags:
international patterns of norm emergence and policy implementation. Environmental
Politics, 18, 315-332.
Clarke, J. (2014). Plastic Bags - The Irish Experience. Presentation at the Berlin
Workshop, 24 February 2014.
Convery, F., & McDonnell, S. (2003). Applying Environmental Product Taxes and
Levies- Lessons from the Experience with the Irish Plastic Bags Levy. Environmental
Studies Research Series (ESRS) Working Paper 03/01, Department of
Environmental Studies, University College Dublin
Convery, F., McDonnell, S., & Ferreira, S. (2007). The most popular tax in Europe?
Lessons from the Irish plastic bags levy. Environment and Resource Economics, 38,
1-11
Corral-Verdugo, V. (1997). Dual ‘realities’ of conservation behavior: Self-reports vs.
observations of reuse and recycling behavior. Journal of Environmental Psychology,
17, 135–145.
Dai, Lai-Man (1998). A review of the use less plastic bags campaign. Unpublished
Doctoral dissertation, The University of Hong Kong (Pokfulam, Hong Kong).
Dasgupta, S., Huq, M., Wheeler, D. and Zhang, C. (1996) Water Pollution Abatement
by Chinese Industry: Cost estimate and policy implications, volume 1. Research
working paper; no. WPS 1630 World Bank. [Online]. Available from:
http://econ.worldbank.org/external/default/main?pagePK=64165259&piPK=6416542
1&theSitePK=469372&menuPK=64216926&entityID=000009265_3961214131504

135
De Groot, J.I.M., Abrahamse, W., & Jones, K. (2013). Persuasive normative
messages: The influence of injunctive and personal norms on using free plastic bags.
Sustainability, 5, 1829-1844.
DECC (2013) Valuation of energy use and greenhouse gas (GHG) emissions:
Supplementary guidance to the HM Treasury Green Book on Appraisal and
Evaluation in Central Government. Department for Energy and Climate Change,
September 2013 [Online]. Available from:
https://www.gov.uk/government/uploads/system/uploads/attachment_data/file/25408
3/2013_main_appraisal_guidance.pdf
Defra (2013). Single-Use Plastic Bag Charge for England; Call for Evidence.
November 2013 [Online]. Available from: https://consult.defra.gov.uk/resource-
atmosphere-and-sustainability/call-for-evidence-plastic-bag-charge-for-
england/supporting_documents/131125%20SUPB%20Call%20for%20Evidence.pdf
Dikgang, J., & Visser, M. (2012). Behavioural response to plastic bag legislation in
Botswana. South African Journal of Economics, 80, 123-33
Dikgang, J., Leiman, A., & Visser, M. (2012a). Analysis of the plastic-bag levy in
South Africa. Resources, Conservation and Recycling, 6, 59-65.
Dikgang, J., Leiman, A., & Visser, M. (2012b). Elasticity of demand, price and time:
lessons from South Africa's plastic-bag levy. Applied Economics, 44(26), 3339-3342.
DoENI (2012). Carrier Bag Levy Regulatory Impact Assessment. Department of the
Environment Northern Ireland [Online]. Available from:
www.doeni.gov.uk/partial_ria_single_use_carrier_bags_regulations.pdf
Doyle, T. K. and O’Hagan A-M (2013) The Irish ‘Plastic Bag Levy’: A mechanism to
reduce marine litter? Presentation at the Marine Litter Conference in Berlin April 10-
12 2013.

136
Drury Research (2000). Attitudes and Actions: a National Survey on the
Environment. Dublin: Department of Environment and Local Government.
Drury Research, 2003. Attitudes and Actions: a National Survey on the Environment.
Dublin: Department of Environment and Local Government.
Dunn, J. (2012). Estimating willingness to pay for continued use of plastic grocery
bags and willingness to accept for switching completely to reusable bags (Doctoral
dissertation, Utah State University).
Ecobilan, 2004. Évaluation des Impacts Environnementaux des Sacs de Caisse
Carrefour: analyse du cycle de vie de sacs de caisse en plastique, papier et matériau
biodégradable. Report prepared for Carrefour. ECOBILAN PwC, Paris, France.
Environment Agency (2011). Life cycle assessment of supermarket carrier bags: a
review of the bags available in 2006 [Online]. Available from:
www.gov.uk/government/uploads/system/uploads/attachment_data/file/291023/scho
0711buan-e-e.pdf
Environmental Audit Committee (2014) Plastic bags [Online]. Available from:
http://www.publications.parliament.uk/pa/cm201314/cmselect/cmenvaud/861/86102.
htm
EU Committee of the Regions (2014). Europe's local governments call for 80%
reduction and ban of free plastic bags. 04/04/14 [Online]. Available from:
http://cor.europa.eu/en/news/Pages/eu-local-governments-ban-free-plastic-
bags.aspx
EuroCommerce, 2004. The Use of LCAs on Plastic Bags in an IPP Context.
EuroCommerce a.i.b.s., Brussels, Belgium.
Fourie A. (2004). Balancing environmental and social considerations in a developing
country – the great South African plastic bag debate. Waste Management 24 6 531

137
Fenton, R., 1991 The Winnipeg Packaging Project: Comparison of Grocery Bags.
Department of Economics, University of Winnipeg, Manitoba, Canada.
Franklin Associates, 1990. Resource and Environmental Profile Analysis of
Polyethylene and Unbleached Paper Grocery Sacks. Franklin Associates Ltd,
Kansas, USA.
Frater L. (2011a). Introduction of Single Use Carrier Bag Charge, Wales: Awareness
of and Acceptance by Shoppers in Cardiff. ESRC Centre for Business Relationships,
Accountability, Sustainability and Society.
Frater L. (2011b). Introduction of Single Use Carrier Bag Charge, Wales: The
Retailer Experience Phase II report. ESRC Centre for Business Relationships,
Accountability, Sustainability and Society.
Frey, B.S. & Jegen, R. (2001). Motivation Crowding Theory Journal of Economic
Surveys 15(5): 589–611.
FRIDGE. Socio-economic Impact Assessment of the Proposed Plastic Bag
Regulations. Report for the National Economic Development and Labour Council.
Bentley West Management Consultants, Johannesburg, South Africa.
Friends of the Earth (HK) (2010) Opinion Survey on Levy Scheme on Plastic
Shopping Bags
GHK (2007). Assessment of Benefits and Effects of the Plastic Shopping Bag
Charging Scheme. GHK (Hong Kong) Ltd
Godman, G. D. (2013). Countering Single-Use Bag Consumption with State
Legislation: The Old Dominion Considers a New Trend.
Gooi, B. S. (2010). Ban On Plastic Bags Usage: Is It A Right Move? An Empirical
Study On Consumer Perception And Practice (Masters dissertation, Universiti Sains
Malaysia).

138
Gupta, K. & Somonathan, R. (2011). Consumer Responses to Incentives to Reduce
Plastic Bag Use: Evidence from a Field Experiment in Urban India.
Gupta, K. (2011). Consumer Responses to Incentives to Reduce Plastic Bag Use:
Evidence from a Field Experiment in Urban India. South Asian Network for
Development and Environmental Economics (SANSEE) Working Paper 65-11
Hartman, Raymond; Wheeler, David; Singh, Manjula. 1994. The cost of air pollution
abatement. Policy, Research working paper; no. WPS 1398. Washington, DC: World
Bank [Online]. Avaiilable from:
http://documents.worldbank.org/curated/en/1994/12/697847/cost-air-pollution-
abatement
Hasson, R., Leiman, A., & Visser, M. (2007). The economics of plastic bag legislation
in South Africa. South African Journal of Economics, 75, 66-83.
Hawkins G. 2001. Plastic bags: living with rubbish. International Journal of Cultural
Studies. 4 5-23
He, H. (2010). Can Stated Preference Methods Accurately Predict Responses to
Environmental Policies? The Case of a Plastic Bag Regulation in China. Working
Papers in Economics, No 444. Gothenburg: School of Business, Economics and
Law, University of Gothenburg
He, H. (2010). The effects of an environmental policy on consumers: lessons from
the Chinese plastic bag regulation. Working Papers in Economics, No 453.
Gothenburg: School of Business, Economics and Law, University of Gothenburg
He, H. (2012). Effects of environmental policy on consumption: lessons from the
Chinese plastic bag regulation. Environment and Development Economics, 17(04),
407-431.
Hill, Austin Bradford (1965). "The Environment and Disease: Association or
Causation?". Proceedings of the Royal Society of Medicine 58 (5): 295–300.

139
HM Treasury (2003), Green Book – Appraisal and Evaluation in Central Government,
[Online]. Available from: Error! Hyperlink reference not valid.
Hogg, D., Sherrington, C., Vergunst, T. (2011). A Comparative Study on Economic
Instruments Promoting Waste Prevention. Report to Bruxelles Environnement,
Eunomia Research & Consulting. United Kingdom
Homonoff, T. (2013). Can small incentives have large effects? The impact of taxes
versus bonuses on disposable bag use. Working Paper 575. Princeton: Department
of Economics, Princeton University
Homonoff, T. A. (2013). Essays in behavioral economics and public policy (Doctoral
dissertation, PRINCETON UNIVERSITY).
House of Commons Environmental Audit Committee (2014). Plastic bags. Eleventh
Report of Session 2013-14 Report, together with formal minutes relating to the
report, 29 January 2014
House of Lords Select Committee on Science & Technology (2011). Second Report
of Session 2010-12. Behaviour Change Report. London: The Stationery Office
[Online]. Available from: http://www.publications.parliament.uk
IEEP (2014). Environmental tax reform in Europe Opportunities for the future.
Institute for European Environmental Policy.
Jayaraman K., Haron H., Sung G.B., Lin S.K. 2011. Consumer reflections on the use
of plastic bags to parcel hot edible items: an empirical study in Malaysia. Journal of
Cleaner Production 19 13 1527-1535
Johansson, K. (2014). Reducing Plastic Marine Debris through Policy: A Comparison
of Melbourne and San Francisco. Engaged Learning Collection. Paper 44, Southern
Methodist University [Online]. Available from:
http://digitalrepository.smu.edu/upjournal_research/44

140
Jones, H. (2012).The Welsh Government‘s Single Use Carrier Bag policy: A case
study from South East Wales. (Doctoral dissertation, Swansea Metropolitan
University).
KDV (2014) Pilot ‘Mag het een tasje minder zijn?’ Kwantitatieve resultaten &
kwalitatieve evaluatie door deelnemende bedrijven. Knowledge Institute of
Sustainable Packaging' (KDV)
Keep Britain Tidy (2013). Written evidence on the sustainability of measures to
reduce the use of plastic shopping bags submitted to the House of Commons
Environmental Audit Committee.
Keep Wales Tidy (2014). Anecdotal evidence with regard to the reduction in SUCB
litter, from Staff working with communities. Unpublished.
Keep Wales Tidy (2013). Written evidence on the sustainability of measures to
reduce the use of plastic shopping bags submitted to the House of Commons
Environmental Audit Committee.
Kennisinstituut Duurzaam Verpakken (2014). Mag het een tasje minder zijn?
Kwantoitative resultaten & kwalitative evaluatie door deelnemende bedrijven. Den
Haag: Kennisinstituut Duurzaam Verpakken
Killian, S. (2005) Revenue Services and Environmental Taxes: A Comparative Study
of the Irish and South African Approaches to a Levy on Plastic Bags. Critical Issues
in Environmental Taxation, 26, 491-207
Klick, J., & Wright, J. D. (2012). Grocery Bag Bans and Foodborne Illness. University
of Pennsylvania Institute for Law & Economics, Philadelphia.
Kurisu, K. H., & Bortoleto, A. P. (2011). Comparison of waste prevention behaviors
among three Japanese megacity regions in the context of local measures and socio-
demographics. Waste Management, 31(7), 1441-1449.

141
Kwong, K. L. (2014). Investigation of policies, environmental impacts, consumption
and fate of plastic bags. The Plymouth Student Scientist, 7(1), 100-139.
Laakso, A. (2013). Building Sustainability through Social Marketing: Encouraging
Reusable Shopping Bag Use at Stadium Thriftway in Tacoma, WA–A Case Study
(Doctoral dissertation, University of Washington).
Lam, S.P. & Cheng, S. (2003) A comparison of variables affecting three kinds of
environmental intention held by members of environmental groups in Taiwan, 1-143.
Litter Monitoring Body (2003). The National Litter Pollution Monitoring System.
System Results. Report - May 2003. Dublin: The Department of Environment.
Litter Monitoring Body (2005). The National Litter Pollution Monitoring System.
System Results, August 2005. Dublin: The Department of the Environment, Heritage.
Luis, I. P., & Spinola, H. (2010). The influence of a voluntary fee in the consumption
of plastic bags on supermarkets from Madeira Island (Portugal).Journal of
Environmental Planning and Management, 53(7), 883-889.
Lyons, L. (2013). DYNAMIX policy mix evaluation - Reducing plastic bag use in the
UK and Ireland
Marks & Spencer (2013). M&S Volunteer Army To Clean Britain's Beaches And
Canals. Press release, 13/09/13 [Online]. Available from:
http://corporate.marksandspencer.com/page.aspx?pointerid=83560e57139d4809a60
f57a94ff7c8ef
Marks & Spencer (2014). Marks & Spencer Plan A Report 2014 [Online]. Available
from: http://planareport.marksandspencer.com/downloads/M&S-PlanA-2014.pdf

142
Marine Conservation Society (2013). Written evidence on the sustainability of
measures to reduce the use of plastic shopping bags submitted to the House of
Commons Environmental Audit Committee.
McDonnell, S., Convery, F. and Ferreira, S. (2008) The Irish Plastic Bag Levy – A
Review of its Performance 5 Years on. Conference Proceedings: 16th Conference of
Environmental and Resource Economists, 2008.
Miller, R. (2012). Plastic Shopping Bags: An Analysis of Policy Instruments for Plastic
Bag Reduction. (Masters dissertation, University of Utrecht, the Netherlands).
Musa, H. M., Hayes, C., Bradley, M. J., Clayson, A., & Gillibrand, G. Measures
Aimed at Reducing Plastic Carrier Bag Use: A Consumer Behaviour Focused Study.
Natural Environment, 1(1), 17-23
Nash, N., Ellis Jones, C., Whitmarsh, L., Poortinga, W., Young, E. & Darnton, A.
(2012). Developing Narratives for a Sustainable Wales: Focus Group Synthesis
Report. Report to Welsh Government, June 2012.
Nilsen, A. (2010). An Economic Evaluation of Plastic Bag Regulation. (Masters
dissertation, University of Oslo)
Nolan-ITU, RMIT Centre for Design, Eunomia Research and Consulting (2002),
Plastic Shopping Bags - Analysis of Levies and Environmental Impacts: Final Report,
Report for Environment Australia, Department of the Environment and Heritage
December 2002 [Online]. Available from:
http://www.environment.gov.au/archive/settlements/publications/waste/plastic-
bags/pubs/analysis.pdf.
Ohtomo, S., & Ohnuma, S. (2014). Psychological interventional approach for reduce
resource consumption: Reducing plastic bag usage at supermarkets. Resources,
Conservation and Recycling, 84, 57-65.

143
O'Loughlin, M. (2010). BYOB (Bring Your Own Bag): A Comprehensive Assessment
of China's Plastic Bag Policy. Buff. Envtl. LJ, 18, 295.
PAFA (2014). Response to Scottish Government on the draft of The Single Use
Carrier bags charge regulations 2014. Packaging and Films Association [Online].
Available from:
www.pafa.org.uk/attachments/article/38/PAFA%20response%20to%20Scottish%20g
overnment%20on%20carrier%20bag%20tax.doc
Pape, J., Rau, H., Fahy, F., & Davies, A. (2011). Developing policies and instruments
for sustainable household consumption: Irish experiences and futures. Journal of
Consumer Policy, 34(1), 25-42.
Pigou AC (1960). The economics of welfare, 4th edition. MacMillan, London.
Poortinga, W. (2013). Written evidence on the sustainability of measures to reduce
the use of plastic shopping bags submitted to the House of Commons Environmental
Audit Committee.
Poortinga, W., Whitmarsh, L., & Suffolk, C. (2012). Evaluation of the introduction of
the single-use carrier bag charge in Wales: attitudes change and behavioural
spillover. Report to the Welsh Government, June 2012.
Pre-Waste (2011). Levy on plastic bags in Ireland [Online]. Available from:
www.prewaste.eu/index.php?option=com_k2&view=item&task=download&id=435&It
emid=94
Public Health England (2012) Laboratory reports of Campylobacter sp infections by
year and region, England and Wales, 2000-2011 [Online]. Available from:
http://www.hpa.org.uk/Topics/InfectiousDiseases/InfectionsAZ/Campylobacter/Epide
miologicalData/campyDataEwRegion19892009/

144
Public Health England (2014) PHE Gastrointestinal Infections Data: Summary of
Salmonella surveillance, 2013 [Online]. Available from:
https://www.gov.uk/government/uploads/system/uploads/attachment_data/file/33764
7/Salmonella_surveillance_tables.pdf.
Public Health Wales (2013) Campylobacter [Online]. Available from:
http://www.wales.nhs.uk/sites3/page.cfm?orgId=457&pid=25441.
Qunfang Z. (2011). An Appraisal and Analysis of the Law of Plastic Bag Ban. Energy
Procedia 5 2516-2521
RCT (2014) Personal Communication: David Jones, Head of Community Protection,
Rhondda Cynon Taf County Borough Council.
Ritch, E., Brennan, C., & MacLeod, C. (2009). Plastic bag politics: modifying
consumer behaviour for sustainable development. International Journal of Consumer
Studies, 33(2), 168-174.
Schembri M. (2006). Malta Experience: the effects of tax on Plastic Bags. AIS
Environmental Ltd at 13th European Packaging Law Conference, Brussels, March
2006 [Online]. Available from: http://www.repak.ie/files/Mario%20Schembri.pdf
Schwarzwalder B., Estermann, R. and Marini, L. (undated) The part of life-cycle
assessment for biodegradable products: bags and loose fills [Online]. Available from:
http://www.composto.ch/publikationen/xmedia/BDMLCA.pdf.
Scottish Government (2013). Partial Business and Regulatory Impact Assessment
Carrier Bag Charge. Abstract: A consultation on the proposed programme, expanded
to cover efficient use of material [Online]. Available from:
www.scotland.gov.uk/Resource/0042/00429421.pdf
Sharp, A., Høj, S., & Wheeler, M. (2010). Proscription and its impact on anti-
consumption behaviour and attitudes: the case of plastic bags. Journal of Consumer
Behaviour, 9, 470-484.

145
Sherrington, C., Hogg, D., Jones, P., Doswell, B., Cullen, C., & Cole, G. (2012).
Assistance to the Commission to Complement an Assessment of the Socio-
economic Costs and Benefits of Options to Reduce the Use of Single-use Plastic.
Carrier Bags in the EU. Final Report for the European Commission DG Environment
under Framework Contract No ENV.C.2/FRA/2011/0020 Bristol: Eunomia.
Shukuya, S., Toshiki, K., & Kunikane, S. (2011). An Analysis of the Impact of
Charging for Plastic Shopping Bags to Retailers in Japan. Journal of Environmental
Science and Engineering, 5 (2011) 260-271
Sugii, T. (2008). Plastic Bag Reduction: Policies to Reduce Environmental Impact
(Masters dissertation, Tufts University).
Sunstein, C.R. & Reisch, L.A. (2013). Automatically green: Behavioral economics
and environmental protection. Harvard Environmental Law Review, 38(1), Fall 2013
Taylor, B. (2013) Paper or Plastic… or Reusable?” An Analysis of the D.C.
Disposable Bag Tax on Worker Productivity & Learning. University of Berkeley
The Grocer (2012). Iceland reports 77% cut for bags in Wales. 09/06/12 [Online].
Available from: http://m.thegrocer.co.uk/companies/discounters/iceland/iceland-
reports-77-cut-for-bags-in-wales/229831.article
The Grocer (2014). Bagging Order. 06/02/14 [Online]. Available from:
http://www.thegrocer.co.uk/opinion/the-grocer-blog-daily-bread/bagging-
order/354328.blog
Tough, R. (2007) Plastic Shopping Bags: Environmental Impacts And Policy Options.
Environmental Studies, 212, 21-48
ULS (2008) Review of life cycle data relating to disposable, compostable,
biodegradable and reusable grocery bags.

146
Verplanken, B., & Wood, W. (2006). Interventions to break and create consumer
habits. Journal of Public Policy & Marketing, 25, 90-103.
Welsh Assembly Government (2010) Proposal for the Introduction of a Charge on
Single-Use Carrier Bags through the Draft Single-Use Carrier Bag Charge (Wales)
Regulations 2010 [Online]. Available from:
http://wales.gov.uk/docs/desh/publications/100604carrier-bag-charge-regulatory-
impact-assessment-en.pdf
WLGA (2014) Personal Communication: Simon Wilkinson, Policy Officer Regulatory
Services, WLGA.
WRAP (2005) Carrier Bag Usage And Attitudes: Benchmark and Target Market
Study, Banbury: WRAP.
WRAP (2009). New figures show single use carrier bags cut by 48% [Online].
Available from: http://www.wrap.org.uk/content/new-figures-show-single-use-carrier-
bags-cut-48
WRAP (2012). UK Supermarket Retailers Voluntary Carrier Bag Agreement: 2011
Carrier Bag Use [Online]. Available from:
http://www.wrap.org.uk/sites/files/wrap/Carrier%20Bag%20Results.pdf
WRAP (2013a). Effect of charging for carrier bags on bin-bag sales in Wales.
Banbury: Waste and Resources Action Plan
WRAP (2013b). UK Voluntary Carrier Bag Monitoring - 2013. Banbury: Waste and
Resources Action Plan.
WRAP (2013c). Leading UK supermarket retailers report carrier bag data [Online].
Available from: http://www.wrap.org.uk/content/carrier-bags-reducing-their-
environmental-impact

147
WRAP (2013d). Written evidence submitted by WRAP (the Waste & Resources
Action Programme) to the UK Environmental Audit Committee Inquiry into Plastic
Bags. Banbury: Waste and Resources Action Plan.
WRAP (2014a). WRAP publishes new carrier bag use figures. Press release, 15th
July 2014 [Online]. Available from: http://www.wrap.org.uk/content/wrap-publishes-
new-carrier-bag-use-figures-0
WRAP (2014b) UK Voluntary Carrier Bag Monitoring – 2013 data [Online]. Available
from: http://www.wrap.org.uk/sites/files/wrap/Carrier%20Bag%20results%202013.pdf
Yeow, P., Dean, A., & Tucker, D. (2013). Bags-for-life: The embedding of ethical
consumerism. Journal of Business Ethics, 1-13.
Zen, I. S., Ahamad, R., & Omar, W. (2013). No plastic bag campaign day in Malaysia
and the policy implication. Environment, Development and Sustainability, 15(5),
1259-1269.
Zero Waste Scotland and Welsh Government (2013). Consumer behavioural study
on the use and re-use of carrier bags 2012. Document prepared by Exodus
Research. Cardiff: Local Environmental Quality Branch, Welsh Government.

148
Appendix 2 – Retailer Survey Questionnaire
Single use carrier bags: retailer survey
INTERVIEWER: YOU MAY CONDUCT THE INTERVIEW WITH THE OWNER,
MANAGING DIRECTOR (MD), PROPRIETOR, CEO, OR OTHER DIRECTOR.
CHECK RESPONDENT IS MOST APPROPRIATE PERSON TO SPEAK TO AT
THE ORGANISATRION REGARDING CARRIER BAG USE. IF NOT COLLECT
APPROPRIATE CONTACT DETAILS / ARRANGE APPOINTMENT.
Eligibility and quota questions
QR1 Can you tell me how many full time equivalent employees the
business has in Wales, including yourself? SINGLE CODE. DO NOT
READ OUT
PROMPT IF NECESSARY: An estimate is fine.
PROMPT II IF NECESSARY: it would be fine to tell us how many
employees the business has in total in Wales – including both full time
and part time staff, and including yourself.
One, just myself 1
2-4 2
5 3
6-9 4
10-24 5
25-49 6
50-99 7
100–149 8
150-199 9
200-250 10
251+ 11
Don’t know 12

149
QR2 Does the business ever provide single-use carrier bags (plastic or
paper) to your customers in Wales?
IF REQUIRED: By single-use carrier bag, I mean any bag used to carry
goods which are sold, regardless of what they are made from - plastic,
paper, degradable plastics or natural starch, regardless of whether or
not they have handles and which are subject to the single use carrier
bags charge in Wales. A single use carrier bag is any bag which,
although it may be used more than once, is not specifically designed for
multiple re-use and is not replaced for free by the retailer when worn out
SINGLE CODE
Yes 1 CONTINUE
No 2
CLOSE &
THANK
Bags: type, quantity and charge
Q1 Which of the following types of bags do you offer to your customers in
Wales? READ OUT. MULTI-CODE
Single use – plastic 1
Single use – paper 2
Single use – biodegradable/starch 3
Re-usable thick plastic ‘bag for life’ that is
replaced for free of charge by the retailer and
normally retails between 5 – 10 pence
4
Re-useable bag (made from fabric such as
canvas, woven synthetic fibres, or a thick
plastic) that is more durable than disposable
plastic bags, allowing multiple use
5
Another kind of bag (write in then type of bag –
Multi-code ok) 6
FOR EACH TYPE OF BAG THEY PROVIDE
Q2 Can you tell me how much you charge for a [ADD BAG TYPE] in Wales?
Enter amount in pence 1 IF ENTERED AMOUNT GREATER THAN
50 PENCE, SOFT CHECK You’ve said
[add amount], can I just check this is
correct?
Don’t know 2
Refused 3
FOR EACH TYPE OF BAG THEY PROVIDE (APART FROM CODE 6 AT Q1)

150
Q3 Across all of its stores/outlets in Wales, about how many [ADD BAG
TYPE] would you say the business provides to customers in an average
week?
INTERVIEWER NOTE: IF RESPONDENT KNOWS THE EXACT NUMBER,
WRITE IN ;
IF EXACT FIGURE NOT KNOWN, PROMPT: An estimate of the broad
number would be fine. READ OUT BANDS IF NECESSARY. SINGLE CODE
EXACT NUMBER - WRITE IN 1
ESTIMATE CODE
BELOW
Fewer than 10 2
10-24 3
25-49 4
50-74 5
75-99 6
100-249 7
250-499 8
500-749 9
750-999 10
1000-1499 11
1500-1999 12
2000+ 13
Don’t know 14
FOR EACH TYPE OF BAG THEY PROVIDE (APART FROM CODE 6 AT Q1)
Q4 How has the amount of [ADD BAG TYPE] that your business provides to
customers in Wales changed since the introduction of the charge in
2011? Would you say it has…? READ OUT. SINGLE CODE
Increased a lot 1
Increased a little 2
Stayed the same 3
Decreased a little 4
Decreased a lot 5
Only started offering it after the charge came in 6
Don’t know 7
ASK IF CODES 1-2 AT Q4 (I.E. THE AMOUNT OF BAGS HAS INCREASED SINCE
CHARGE)
Q5a Would you be able to provide an estimate of how much of an increase
you have seen in the number of these bags that you have provided to
customers (since the charge was introduced)? SINGLE CODE. READ
OUT ANSWER RANGES IF NECESSARY

151
1-20% 1
21-40% 2
41-60% 3
61-80% 4
81-100% 5
More than 100% (i.e. more than doubled) 6
Don’t know 7
ASK IF CODES 4-5 AT Q4 (I.E. THE AMOUNT OF BAGS HAS DECREASED
SINCE CHARGE)
Q5b Would you be able to provide an estimate of how much of a decrease
you have seen in the number of these bags that you have provided to
customers (since the charge was introduced)? SINGLE CODE. READ
OUT ANSWER RANGES IF NECESSARY
1-20% 1
21-40% 2
41-60% 3
61-80% 4
81-100% 5
Don’t know 6
FOR EACH TYPE OF BAG THEY PROVIDE (APART FROM CODE 6 AT Q1)
Q6 About how much would you say the business spends on [ADD TYPE OF
BAG] to supply to customers in Wales, per month? An estimate is fine
Write in £ 1
Don’t know 2
Refused 3
ASK ALL
Q7 As part of the research we are also looking to interview some of the main
bag manufacturers and suppliers, to find out their views of the charge.
Can I just ask which supplier or suppliers the business gets its bags
from, just so we can be sure that we’re covering all the suppliers that are
operating in Wales? WRITE IN. MULTICODE OK.
Open-ended, write in 1
2
3
Don’t know 4
Refused 5

152
Donations
Q10 Ignoring VAT and focusing just on the net proceeds from the charge, what
proportion of the charge would you say the business sets aside for
charitable donations and what proportion for general
administration/business costs? A broad estimate is fine. READ OUT. MULTI-
CODE
(a)
Charity
(b)
Admin
0% (i.e. none of it) 1 1
100% (i.e. all of it) 2 2
Write in exact estimate if between 1-99% 3 3
Don’t know 4 4
Refused 5 5
ASK IF >0% AT Q10B
Q11 You said the business uses some of the net proceeds to cover general
administration and business costs. What sorts of admin/business costs
would this include? DO NOT READ OUT, MULTICODE OK
Cost of bags 1
Reporting 2
Staff training 3
Communicating the charge to customers 4
Other (write in) 5
Don’t know 6
Refused 7
ASK IF >0% AT Q10A
Q12 Thinking about the proceeds that you donate to charity, how many
different organisations does the business make charitable donations to?
DO NOT READ OUT, MULTICODE OK
1 1
2 2
3 3
4 4
5+ 5
Don’t know 6
ASK IF >0% AT Q10A
Q13 Which of the following best describes the charity or charities that your
business donates to (using proceeds raised through the bag charge)?
READ OUT. MULTICODE OK

153
Environmental 1
Local Community Groups 2
Homelessness 3
Health and disability 4
Opportunities for young people 5
Own in-house foundation/charity 6
Other (write in) 7
Don’t know 8
ASK IF >0% AT Q10A
Q14 What would you say were the main reasons why the business chose to
donate to this charity/these charities? DO NOT READ OUT. MULTI-CODE
OK
Pre-existing relationship/given to them before 1
Was approached by a charity 2
Heard of the charity through networks/peers 3
Talked to employees/chose charity with
employees 4
Talked to customers/chose charity with customers 5
Did a general search to find a good cause you
believe in 6
Other (write in) 7
Don’t know 8
ASK IF >0% AT Q10A
Q15 Would you say that the charitable donation that the business makes as
part of the bag charge is…? READ OUT. SINGLE CODE
…in addition to your existing donations to
good causes 1
…in place of other donations to good causes
that you have made in the past 2
…the only donation that you make to good
causes 3
Don’t know 4

154
Attitudes to the charge and its impacts
We would now like to ask you some questions on the impact of the charge from the
business’ perspective, for example any disadvantages and disadvantages
associated with the scheme.
ASK ALL
Q16 First of all, and taking everything into account, which of the following
would you say best describes the impact on the business of charging for
all single use carrier bags? READ OUT. SINGLE CODE
It has had a positive impact on the business 1
It has had a negative impact on the business 2
It has had a neutral impact – neither positive
nor negative 3
Don’t know 4
Q17 In what ways, if any, would you say the charge has benefited the
business? DO NOT READ OUT. MULTI-CODE. PROBE: Anything else?
Saves us money on bag purchases 1
Less waste 2
More convenient/less hassle 3
Money for charity 4
Less litter 5
Increase revenue/makes us money 6
Good for the environment 7
Good for the business’s environmental policies /
commitments 8
Other (write in) 9
None 10
Don’t know 11
Q18 In what ways, if any, would you say the charge has been a disadvantage
to your business? DO NOT READ OUT. MULTICODE. PROBE: Anything
else?
Customers unhappy/complain 1
Lost sales/customers 2
Inconvenient/more hassle 3
More shoplifting 4
More litter 5
Customers refuse to pay/aggressive 6
Embarrassing/uncomfortable to ask customer 7
Other (write in) 8
None 9
Don’t know 10

155
Q19 We would like to focus specifically on some particular issues, now, such as
shop lifting, littering and customer satisfaction.
Thinking about the impact that the introduction of the bag charge in 2011
has had, would you say it caused an increase, decrease or has had no
impact on …. READ OUT. ROTATE ORDER OF ISSUES. SINGLE CODE FOR
EACH
Increased
a lot
Increased
a bit
No
change
Decreased
a bit
Decreased
a lot DK NA
A Shoplifting 1 2 3 4 5 6 -
B Customer
satisfaction
with the
business
1 2 3 4 5 6 -
C Costs to
the
business of
supplying
bags
1 2 3 4 5 6 -
D Amount of
litter
around the
premises
1 2 3 4 5 6 7
E Any costs
that the
business
has to pay
to clean up
litter
around the
premises -
if this does
not apply
to your
business,
say ‘Not
Applicable’
1 2 3 4 5 6 7
ASK FOR ANY ISSUES THAT CODES 1-2 AT Q19 (I.E. INCREASED)

156
Q20a For those issues where you’ve identified an increase as a result of the bag
charge, would you be able to provide an estimate of how much it has
increased? SINGLE CODE FOR EACH. READ OUT SCALE IF NECESSARY
INTERVIEWER INSTRUCTION – CODE ‘OTHER SPECIFY’ FOR ANY
SUBJECTIVE RESPONSES THAT DO NOT FIT A NUMERICAL RESPONSE
(E.G. “We never had any shoplifting before and now we do”).
1-
20%
21-
40%
41-
60%
61-
80%
81-
100%
More
than
100%
(i.e.
more
than
doubled)
Other
specify
Not
possibly
to
specify /
DK
A Shoplifting 1 2 3 4 5 6 7 8
B Customer
satisfaction 1 2 3 4 5 6 7 8
C Costs of
supplying
bags
1 2 3 4 5 6 7 8
D Amount of
litter 1 2 3 4 5 6 7 8
E Costs to
clean up
litter
1 2 3 4 5 6 7 8
ASK FOR ANY ISSUES THAT CODES 4-5 AT Q19 (I.E. DECREASED)
Q20b For those issues where you’ve identified a decrease as a result of the bag
charge, would you be able to provide an estimate of how much it has
decreased? SINGLE CODE FOR EACH. READ OUT SCALE IF NECESSARY
INTERVIEWER INSTRUCTION – CODE ‘OTHER SPECIFY’ FOR ANY
SUBJECTIVE RESPONSES THAT DO NOT FIT A NUMERICAL RESPONSE
(E.G. “customers don’t seem as happy as before”).
1-
20%
21-
40%
41-
60%
61-
80%
81-
100%
Other
specify
Not
possibly
to specify
/ DK
A Shoplifting 1 2 3 4 5 6 7
B Customer
satisfaction 1 2 3 4 5 6 7
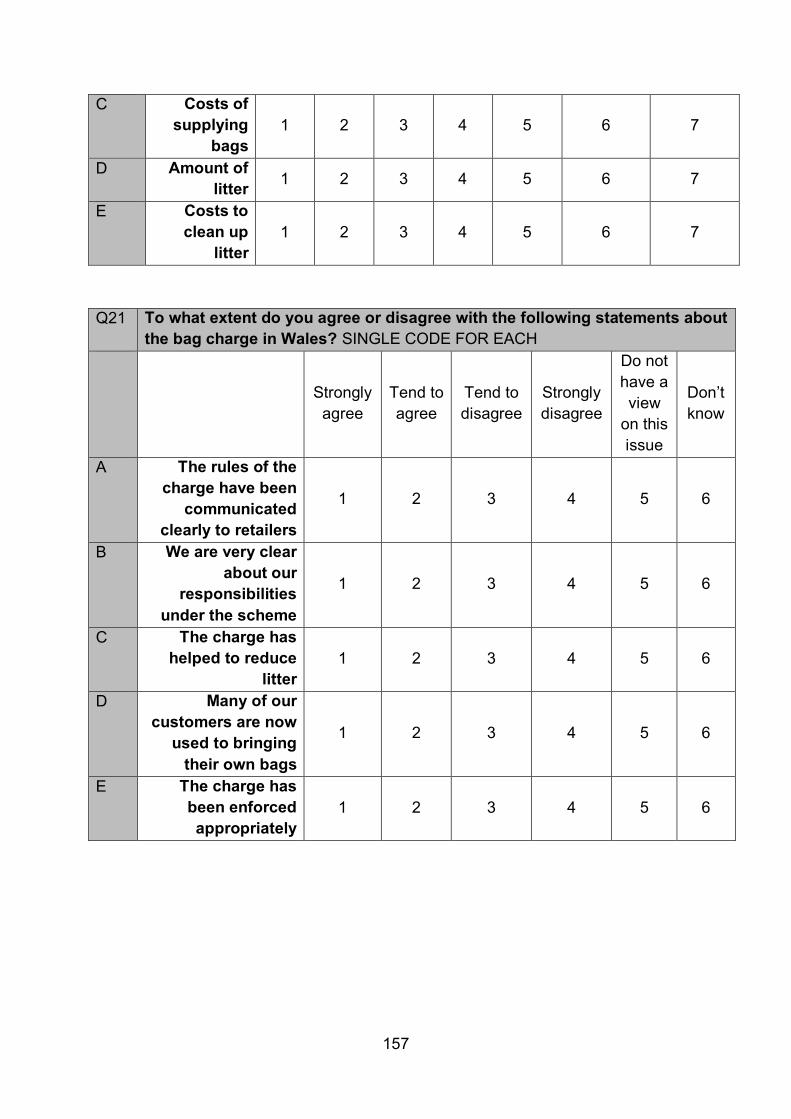
157
C Costs of
supplying
bags
1 2 3 4 5 6 7
D Amount of
litter 1 2 3 4 5 6 7
E Costs to
clean up
litter
1 2 3 4 5 6 7
Q21 To what extent do you agree or disagree with the following statements about
the bag charge in Wales? SINGLE CODE FOR EACH
Strongly
agree
Tend to
agree
Tend to
disagree
Strongly
disagree
Do not
have a
view
on this
issue
Don’t
know
A The rules of the
charge have been
communicated
clearly to retailers
1 2 3 4 5 6
B We are very clear
about our
responsibilities
under the scheme
1 2 3 4 5 6
C The charge has
helped to reduce
litter
1 2 3 4 5 6
D Many of our
customers are now
used to bringing
their own bags
1 2 3 4 5 6
E The charge has
been enforced
appropriately
1 2 3 4 5 6

158
Administration
We are interested to know how much administration time is associated with
implementing the charge for your business - for example, the amount of time it takes
to monitoring/report, arrange donations to charity, etc.
Q22 Thinking about the past year, how many staff days – roughly speaking –
would you say your business spent administering the charge? SINGLE
CODE. DO NOT READ OUT
0 days 1
More than zero but less than 0.5 days 2
0.5 days 3
1 day 4
2-3 days 5
4-5 days 6
6-10 days 7
11-19 days 8
20+ days 9
Don’t know 10
The charge moving forward
Q23 Thinking about the charge going forward, which of the following
statements is closest to your view? READ OUT. SINGLE CODE
We are happy to see the charge continue as it is 1
We are happy for the charge to continue, but we
would like to see some changes 2
We think the charge should be removed 3
Something else (write in) 4
We don’t have a view 5
ASK IF CODE 2 AT Q23
Q24 What changes would your business like to see? DO NOT READ OUT.
MULTICODE. PROMPT: anything else?
Reduce the charge 1
Increase the charge 2
Allow exemptions for certain types of companies 3
Only charge for certain types of bags (e.g. plastic) 4
More information/support for companies 5
More information for consumers 6
More enforcement (e.g. for companies that are
ignoring the charge) 7
Other (write in) 8
Don’t know 9

159
Finally…
QR3 How many stores do you have in Wales? SINGLE CODE
1 1
2 2
3 3
4 4
5 5
6 6
7 7
8 8
9 9
10+ 10
QR4 Could you please tell me the approximate turnover (or total sales revenue)
of the business in your last financial year? Please answer in relation to the
business in Wales only (if the business operates across multiple
countries)? SINGLE CODE. READ OUT CATEGORIES IF NECESSARY
Under £50k 1
£50k-£100k 2
£101k-£200k 3
£201k-£300k 4
£301k-£500k 5
£501k-£750k 6
£750k-£1 million 7
£1.1 million - £5 million 8
£5.1 million - £10 million 9
Over £10 million 10
Refused 11
Don’t know 12
QR5 In which local authority area is your business based? MULTICODE
Anglesey
1
Blaenau Gwent 2
Bridgend 3
Caerphilly 4
Cardiff 5
Carmarthen 6
Ceredigion 7

160
Conwy 8
Denbighshire 9
Flintshire 10
Gwynedd 11
Merthyr Tydfil 12
Monmouthshire 13
Neath and Port Talbot 14
Newport 15
Pembrokeshire 16
Powys 17
Rhondda Cynon Taff 18
Swansea 19
Torfaen 20
Vale of Glamorgan 21
Wrexham 22
Refused 23
Don’t know 24

161
Appendix 3 – Consumer Survey Questionnaire
Single use carrier bags: consumer survey
Quota Questions
D1 How old are you? SINGLE CODE
16-24 1
25-34 2
35-44 3
45-54 4
55-64 5
65+ 6
D2 INTERVIEWER CODE MALE/FEMALE. ASK IF NECESSARY: Are you…?
READ OUT. SINGLE CODE
Male 1
Female 2
D3 Which of the following best describes your work status? READ OUT.
SINGLE CODE
Employed full time 1
Employed part time 2
Self-employed (full or part-time) 3
Unemployed 4
Retired 5
Homemaker 6
Student 7
Other 8
D4 – local authority (for region quota) – from sample (also derived from postcode for
analysis)
Q1 In the last month, how many times have you personally done each of the
following shopping activities? READ OUT AND CODE NUMBER (
A A large food shop in-store at a
supermarket [__]
GO TO SUPERMARKET
LOOP
B A large food shop online [__]
GO TO ONLINE SHOP
LOOP
C A smaller ‘top-up’ shop in-store for food
items [__]
GO TO TOP UP SHOP
LOOP
D Bought non-food items on the high-street [__] GO TO NON-FOOD

162
E Bought non-food items at a retail park/out
of town shopping centre [__]
LOOP
F Collected food from a take-away /
restaurant [__]
GO TO TAKEAWAY
LOOP
[SCRIPTER: ‘Can’t remember’ for each as button]
IF THEY SAY ZERO FOR EACH OF A-F THEN CLOSE
SUPERMARKET LOOP
ASK IF Q1A >0
Q2a Thinking about the last time you went to the supermarket to do a large
food shop, what type of bags did you bring the shopping home in?
DO NOT READ OUT. MULTICODE
PROBE TO DISTINGUISH BETWEEN SINGLE USE CARRIER PLASTIC
BAGS (e.g. is that a single use plastic carrier bag or a plastic bag for
life?)
ALSO PROBE TO CLARIFY THE TYPE OF BAG FOR LIFE (i.e. Is the bag
for life plastic or made from another material, such as canvas, jute or
cloth?).
Plastic carrier bag(s) 1
Paper carrier bag(s) 2
Bag(s) for life – thick plastic 3
Bag(s) for life – canvas, jute, cloth, e.g. have
fabric handles etc. 4
Cardboard/Plastic box(es) 5
Another kind of bag e.g. backpack, holdall etc. 6
Just left it loose / carried it without a bag 7
Something else (write in) 8
Q2b & c TO BE ASKED FOR EACH OF BAG TYPES 1-6 MENTIONED AT Q2a
Q2b How many [BAG TYPE] did you use on the last occasion, roughly
speaking? IF UNSURE PLEASE ASK FOR AN ESTIMATE
Plastic carrier bag(s) [__]
Paper carrier bag(s) [__]
Bag(s) for life – thick plastic [__]
Bag(s) for life – canvas, jute, cloth, e.g. have
fabric handles etc. [__]
Cardboard/Plastic box(es) [__]
Another kind of bag e.g. backpack, holdall etc. [__]
[SCRIPTER: ‘Can’t remember’ for each as button]
PART ‘c’ ONLY ASKED FOR EACH OF BAG TYPES 1-4 MENTIONED AT Q2a

163
Q2c And did you bring those bags with you, buy them at the supermarket or
was it a mixture of the two? DO NOT READ OUT AND CODE AS
APPROPRIATE (CLARIFY IF NECESSARY)
i)
Plastic
carriers
ii)
Paper
carriers
iii)
BFL
-
thick
iv)
BFL
–
perm.
Brought them from home 1 1 1 1
Bought them at the checkout 2 2 2 2
Brought some from home but had to buy
extra at the checkout 3 3 3 3
ASK THOSE NOT CODING 3-4 AT Q2A
Q2d Do you have any bags for life, either made from plastic, cotton or
something else? SINGLE CODE
Yes 1
No 2
ASK THOSE CODING 1 AT Q2d
Q2e Thinking about when you go to the supermarket to do a large food shop,
which of the following statements would you say best applies to your
use of bags for life? READ OUT. SINGLE CODE
I often forget to bring them 1
I sometimes forget to bring them 2
I only forget to bring them on a few occasions 3
I don’t use bags for life for this type of shop 4
TOP UP SHOP LOOP
ASK IF Q1C >0
Q3a Thinking about the last time you did a smaller ‘top-up’ shop for food
items, what type of bags did you bring the shopping home in?
DO NOT READ OUT. MULTICODE
PROBE TO DISTINGUISH BETWEEN SINGLE USE CARRIER PLASTIC
BAGS (e.g. is that a single use plastic carrier bag or a plastic bag for
life?)
ALSO PROBE TO CLARIFY THE TYPE OF BAG FOR LIFE (i.e. Is the bag
for life plastic or made from another material, such as canvas, jute or
cloth?).
Plastic carrier bag(s) 1
Paper carrier bag(s) 2
Bag(s) for life – thick plastic 3
Bag(s) for life – canvas, jute, cloth, e.g. have
fabric handles etc. 4

164
Cardboard/Plastic box(es) 5
Another bag e.g. backpack, holdall etc. 6
Just left it loose / carried it without a bag 7
Something else (write in) 8
Q3b & c TO BE ASKED FOR EACH OF BAG TYPES 1-6 MENTIONED AT Q3a
Q3b How many [BAG TYPE] did you use on the last occasion, roughly
speaking?
IF UNSURE PLEASE ASK FOR BEST ESTIMATE
Plastic carrier bag(s) [__]
Paper carrier bag(s) [__]
Bag(s) for life – thick plastic [__]
Bag(s) for life – canvas, jute, cloth, e.g. have fabric
handles etc. [__]
Cardboard/Plastic box(es) [__]
Another bag e.g. backpack, holdall etc. [__]
[SCRIPTER: ‘Can’t remember’ for each as button]
PART ‘c’ ONLY ASKED FOR EACH OF BAG TYPES 1-4 MENTIONED AT Q2a
Q3c Did you bring those bags with you or did you buy them at the shop? DO
NOT READ OUT AND CODE AS APPROPRIATE (CLARIFY IF
NECESSARY)
i)
Plastic
carriers
ii)
Paper
carriers
iii)
BFL -
thick
iv)
BFL –
perm.
Brought them from home 1 1 1 1
Bought them at the checkout 2 2 2 2
Brought some from home but had to buy
extra at the checkout 3 3 3 3
ASK THOSE NOT CODING 3-4 AT Q3A, BUT NOT IF BEEN ASKED Q2D
Q3d Do you have any bags for life at home; either made from plastic, cotton
or something else? SINGLE CODE
Yes 1
No 2

165
ASK: (THOSE CODING 1 AT Q3D) OR (ANYONE CODING 1 AT Q2D, BUT NOT 3-
4 AT Q3A)
Q3e Thinking about when you do a smaller ‘top-up’ shop for food items,
which of the following would you say best applies to your use of bags
for life? READ OUT. SINGLE CODE
I often forget to bring them 1
I sometimes forget to bring them 2
I only forget to bring them on a few occasions 3
I don’t use bags for life for this type of shop 4
NON-FOOD LOOP (HIGH STREET AND RETAIL PARK COMBINED)
ASK IF Q1D >0 AND/OR IF Q1E >0
Q4a Think about the last time you went shopping for things other than food,
either on the high street or at an out of town shopping centre. Which of
the following best describes how you brought your shopping home?
READ OUT. SINGLE CODE
Everything went in bags/boxes that I got from
the shops 1
Everything went in bags/boxes that I had
brought with me 2
A mixture of the two 3
I carried it without any bags/boxes 4
ASK THOSE CODING 2-3 AT Q4a
Q4b Which types of bag had you brought with you?
DO NOT READ OUT. MULTICODE
PROBE TO DISTINGUISH BETWEEN SINGLE USE CARRIER PLASTIC
BAGS (e.g. is that a single use plastic carrier bag or a plastic bag for
life?)
ALSO PROBE TO CLARIFY THE TYPE OF BAG FOR LIFE (i.e. Is the bag
for life plastic or made from another material, such as canvas, jute or
cloth?).
Plastic carrier bag(s) 1
Paper carrier bag(s) 2
Bag(s) for life – thick plastic 3
Bag(s) for life – canvas, jute, cloth, e.g. have fabric
handles etc. 4
Cardboard/Plastic box(es) 5
Another bag e.g. backpack, holdall etc. 6
Something else (write in) 7
ASK THOSE CODING 1 AT Q4A, BUT NOT IF BEEN ASKED Q2D OR Q3D

166
Q4c Do you have any bags for life at home; either made from plastic, cotton
or something else? SINGLE CODE
Yes 1
No 2
ASK: (THOSE CODING 1 AT Q4C) OR (CODING 1 AT Q2D OR Q3D AND 1 AT
Q4A)
Q4d Thinking about when you go shopping for non-food items which of the
following would you say best applies to your use of bags for life? READ
OUT. SINGLE
I often forget to bring them 1
I sometimes forget to bring them 2
I only forget to bring them on a few occasions 3
I don’t use bags for life for this type of shop 4
TAKEAWAY LOOP
ASK IF Q1F >0
Q5 Thinking about the last time you collected food from a take-away /
restaurant, what type of bags did you bring your order home in?
DO NOT READ OUT. MULTICODE
PROBE TO DISTINGUISH BETWEEN SINGLE USE CARRIER PLASTIC
BAGS (e.g. is that a single use plastic carrier bag or a plastic bag for life?)
ALSO PROBE TO CLARIFY THE TYPE OF BAG FOR LIFE (i.e. Is the bag
for life plastic or made from another material, such as canvas, jute or
cloth?).
PROBE TO CLARIFY IF PROVIDED BY THE TAKEAWY OR IF THEY
BROUGH A BAG WITH THEM (i.e. did the take-away provide the bag, or
had you brought it with you?)
Bag(s) provided by takeaway
Plastic carrier bag(s) 1
Paper carrier bag(s) 2
Something else (write in) 3
Bag(s) they had brought with them
Plastic carrier bag(s) 4
Paper carrier bag(s) 5
Bag(s) for life – thick plastic 6
Bag(s) for life – canvas, jute, cloth, e.g. have fabric
handles etc. 7
Cardboard/Plastic box(es) 8
Another bag e.g. backpack, holdall etc. 9
Just left it loose / carried it without a bag 10
Something else (write in) 11

167
ONLINE GROCERY LOOP
ASK IF Q1B >0
Q6a Thinking about the last time that you had your food shop delivered to
your home, was the food delivered with or without carrier bags? SINGLE
CODE
With carrier bags 1
Without carrier bags 2
Can’t remember/not sure 3
Q6b And were you given the option, when placing your order online, to have
the food delivered with or without carrier bags? SINGLE CODE
Yes 1
No 2
Can’t remember/not sure 3
BAGS FOR LIFE SECTION
I would now like to ask you a few questions about bags for life. They are often made
from fabric such as canvas, woven synthetic fibres, or they can be a thick plastic bag
that is more durable than disposable plastic bags and which is usually replaced free
of charge by the seller when worn out, allowing for multiple use.
Q7 How many times do you typically re-use the following types of bag for life
before they are disposed of? If you never use one of these types of bag for life,
you can just tell me that you never use them. DO NOT READ OUT RESPONSE
CATEGORIES. SINGLE CODE FOR EACH.
USE ‘OTHER SPECIFY’ FOR QUALITATIVE RESPONSES, E.G. OFTEN FORGET
TO USE THEM / LEAVE IN A DRAWER/CUPBOARD/CAR; OR I’VE NEVER HAD
ONE WEAR OUT YET
0 1 2-5
times
6-10
times
11-20
times
20-49
times
50+
times
Other
(specif
y)
DK Never
use
A Thick plastic
‘bag for life’
(that normally
cost between 5
– 10 pence)
1 2 3 4 5 6 7 8 9 10
B Canvas, jute or
cloth bags for
life
1 2 3 4 5 6 7 8 9 10
DON’T ASK A / B IF THEY CODE 9-10 AT Q7A/B

168
Q8 When a [BAG TYPE] wears out or gets old, what do you do with it? READ OUT
TYPES OF BAG BUT NOT ANSWER OPTIONS – CODE ACCORDINGLY,
CLARIFY IF NECESSARY
Throw it
away /
bin
Recycle it Return to the retailer/
swap for a new one
Something
else (write
in)
A Thick plastic bags for life 1 2 3 4
B Canvas, jute or cloth bags
for life 1 2 3 4
SUCB SECTION
I would now like to ask you a few questions about single use carrier bags. These are
bags provided at the till of stores and shops which are made wholly or mainly of
paper or plastic film and are not specifically manufactured for multiple use.
Q9 How many times do you typically re-use the following types of bags before
they are disposed of? If you never use one of these types of bag, you can just
tell me that you never use them. DO NOT READ OUT RESPONSE
CATEGORIES. SINGLE CODE FOR EACH.
USE ‘OTHER SPECIFY’ FOR QUALITATIVE RESPONSES, E.G. OFTEN FORGET
TO USE THEM / LEAVE IN A DRAWER/CUPBOARD/CAR
0 Once 2-3
times
4-5
times
6-10
times
11+
times
Other
(specif
y)
DK Neve
r use
A Paper carrier bags 1 2 3 4 5 6 7 8 9
B Plastic carrier bags 1 2 3 4 5 6 7 8 9
DON’T ASK A and / or B IF THEY CODE 8-9 AT Q9A OR Q9B
Q10 What do you do with [BAG TYPE] when you dispose of it? READ OUT TYPES
OF BAG BUT NOT ANSWER OPTIONS – CODE ACCORDINGLY, CLARIFY IF
NECESSARY
Put it in the
general
rubbish bin
Recycle it Something else
(write in)
A Paper carrier bags 1 2 3
B Plastic carrier bags 1 2 3

169
ASK ALL
Q11 Since 2011, shops in Wales have been required to charge 5p per bag to
customers that want or need a single use carrier bag. Thinking about your
main food shopping, how has the number of single use carrier bags that you
take from the supermarket changed as a result? Do you… READ OUT
CODES 1 TO 6. SINGLE CODE
Take a lot more 1
Take a few more 2
Take about the same number 3
Take a few less 4
Take a lot less 5
Or have you stopped taking carrier bags
altogether 6
Didn’t use carrier bags before the charge [AS
BUTTON] 7
Q12a Since the charge for carrier bags was introduced, have you found yourself
buying, or buying more, of any other types of bags? SINGLE CODE
Yes 1
No 2
Don’t know 3
ASK IF CODE 1 AT Q12a
Q12b Which bags do you buy more of since the introduction of the carrier
bag charge? DO NOT READ OUT, MULTICODE OK
Bags for life – thick plastic 1
Bags for life – canvas, jute or cloth 2
Large bin liners (e.g. for kitchen bin) 3
Small bin liners (e.g. for bathroom / bedroom bins) 4
Bags for dog / animal mess 5
Other (write in) 6
Q13a
Q13b
Thinking back to before the 5p charge was introduced, to what extent
would you say that you supported or opposed it? Would you say that
you…? READ OUT. SINGLE CODE
Using the same scale, how do you feel about it now? SINGLE CODE
A ) Then B) Now
Strongly support(ed) it 1 1
Tend(ed) to support it 2 2
Tend(ed) to oppose it 3 3
Strongly oppose(d) it 4 4
I didn’t/don’t have a view either way 5 5

170
Q14 To what extent would you say you agree or disagree with the following
statements?
READ OUT – SINGLE CODE FOR EACH. RANDOMISE STATEMENTS
Strongly
agree Agree Disagree
Strongly
disagree
Don’t
know
A The charge for single use
bags discourages me from
using them
1 2 3 4 5
B I feel guilty if I take new
single use carrier bags at
the till for my shopping
purchases
1 2 3 4 5
C I’m happy to pay 5p per bag
if it means I don’t have to
carry bags for life with me
when I’m shopping
1 2 3 4 5
D The rules for when you can
have a free bag are
confusing
1 2 3 4 5
E The charge has helped to
reduce littering in my local
authority area
1 2 3 4 5
ASK THOSE CODING 1-5 at Q11. SPLIT SAMPLE INTO 2 LOTS, WITH EACH LOT
SEEING A DIFFERENT MONETARY AMOUNT: A) 10p and B) 20p
Q15a We are interested in finding out what kind of impact it would have on
the amount of single use carrier bags people would buy if the charge
was increased.
If the carrier bag charge was increased to __, would you be likely to
buy more, fewer or about the same amount of bags when you do your
main food shop? SINGLE CODE
Buy a lot more 1
Buy a few more 2
Buy about the same number 3
Buy a few less 4
Buy a lot less 5
Stop buying carrier bags altogether 6
ASK IF CODE 1-2 OR 4-5 AT Q15a

171
Q15b
You said you would be likely to buy [MORE/FEWER] single use carrier
bags. Could you estimate how many [MORE/FEWER] you would take per
shop, roughly speaking? An estimate is fine. DO NOT READ OUT. SINGLE
CODE
Write in […]
Don’t know 2
ASK ALL
Q16 Over the last year, do you remember visiting any shops in Wales where
you were given a carrier bag but were not charged for it? This could be
any type of shop, including supermarkets, high street shops, market or
festival stalls, takeaways and food outlets. SINGLE CODE (WITH PROBE
TO CLARIFY SINGLE OR MULTIPLE TIMES)
Yes, multiple times 1
Yes, once 2
No, I’ve always been charged 3
Can’t remember 4
ASK THOSE CODING 1 OR 2 AT Q16
Q17a Was it any of the following types of shop(s), or another type? READ
OUT. MULTICODE
Supermarket 1
Corner shop, local greengrocer, fishmonger or
butcher 2
Take away or food outlet 3
Clothing/shoes store 4
Electrical/Homeware/Furniture or DIY store 5
Market or festival stall 6
Another type of store (write in) 7
Can’t remember [single code] 8
ASK THOSE CODING 1 OR 2 AT Q16
Q17b Did you contact anyone to report this or not? SINGLE CODE
Yes 1
No 2
ASK THOSE CODING 1 AT Q17b
Q17c Who did you report it to?
DO NOT READ OUT. MULTICODE.
PROBE IF THEY SAY ‘COUNCIL’ Was that to a specific department of
the council, or generally?
Local council (general) 1
Trading standards department at local council 2

172
Other department at the council (write in) 3
Welsh Government 4
The retailer itself 5
Local councillor/MP 6
Local paper 7
Police 8
Other (write in) 9
ASK THOSE CODING 2-4 AT Q16
Q17d As far as you know, who is in charge of enforcing the bag charge?
DO NOT READ OUT. SINGLE CODE.
PROBE IF THEY SAY ‘COUNCIL’ Is there a specific department of the
council responsible for this, or do you mean the council in generally?
Local council (general) 1
Trading standards department at local council 2
Other department at the council (write in) 3
Welsh Government 4
The retailer itself 5
Police 6
Other (write in) 7
No-one – there is no enforcement 8
Don’t know / not sure 9
ASK ALL
Q18 As far as you are aware, what happens to the money that businesses
charge for single use carrier bags? DO NOT READ OUT. MULTICODE OK
They donate it to charity 1
They pay it to the local authority 2
They pay it to Welsh Government 3
They keep it themselves 4
Something else (write in) 5
Don’t know 6

173
And finally I’d just like to ask you a few more questions to make sure that we speak
to a range of people. Once again I would like to reassure you that all of your
responses are confidential and anonymous.
ASK ALL
D5 Which of these best describes your living situation? READ OUT. SINGLE
CODE
Own the home outright 1
Own the home on a mortgage 2
Rent - from a private landlord 3
Rent - from the council or a Housing
Association 4
Live with parents 5
University accommodation 6
Other 7
D6 What is your post code?
Collect and then use to determine WIMD
and urban / rural from index 1
Refused 2

174
Appendix 4 – Economic evaluation – assumptions and uncertainty
analysis
1 Model structure and details
To evaluate the economic costs and benefits of the 5p charge, a bespoke 1.1
model was developed as part of this study. The model is set up to quantify
the economic impacts of four policy scenarios of changes in carrier bag
usage in Wales in relation to a ‘no-intervention’ baseline. The starting point
for the model is the estimation of changes in demand for different types of
bag under different levels of charge. The types of bags included in the
model are: standard single use carrier bags made of thin plastic, paper
carrier bags, two grades of bag for life and cotton bags for life.
Economic impacts are considered in the following categories, each of 1.2
which is then discussed in further detail:
Administrative and enforcement costs
Costs to business
Charitable donations
Waste management
Environmental impacts
Consumer impacts
Number of bags of different types in circulation
Data are taken from the surveys of bag numbers in circulation. There are 1.3
three dimensions to uncertainty in this parameter and how it changes over
time:
The total number of bags in circulation;
The relative numbers of bags of different types in circulation; and
The number of times that bags of each type are re-used.
Based on the results of the surveys comparison to data collected from 1.4
other sources (e.g. WRAP), it is considered that associated uncertainties
regarding the number of bags issued each year are likely to be low.
The surveys found that there was little increase in sales of bags for non-1.5
shopping purposes in response to the 5p charge, such as for use as bin
liners. It is therefore assumed that any displacement which occurs
generates negligible environmental and other impacts and has been
omitted from the analysis.

175
Administrative and enforcement costs
This element is calculated as the sum of the administrative costs and legal 1.6
or enforcement costs associated with implementation.
The source of information used for both costs is the 2010 Welsh SUCB 1.7
charge RIA document. This suggests that enforcement costs are more
significant. It is assumed that the administrative costs are known to a
reasonable level of accuracy, based on employment of 2 Full Time
Equivalent staff at Welsh Government. Enforcement or legal costs were
estimated at £1 million per year in the initial RIA, though to date it is
understood that there has been no formal legal action brought. There
were, however, some costs of administration and enforcement in relation to
152 requests for advice and 127 enforcement contacts reported during the
first 18 months after the charge was introduced. Accepting the figure of £1
million per year for associated costs implies a cost per case for the 279
requests for information and enforcement contacts combined of £5,430, a
figure that is clearly too high as each case will not require something in
excess of 1 person-month of effort. Assuming each case takes one day to
deal with (accepting that some will involve a trivial amount of work, and
others more, with repeat visits) implies a total cost (assuming 225 working
days per year and costs per worker similar to those in Welsh Government)
of £49,250 per year. This lower figure is used as part of this sensitivity
analysis.
Costs to business
Costs to business arise at a series of levels through the supply chain: 1.8
Changes in revenue and costs for manufacturers: Those dealing 1.9
exclusively with SUCBs and paper carrier bags would see a loss of trade
(but also a reduction in manufacturing cost), whilst those dealing
exclusively in bags for life made of plastic or cotton would see trade
increase (with increasing revenue and production costs).
Changes in revenue and costs for wholesalers: These are likely to be less 1.10
sensitive than the cashflow of manufacturers as wholesalers will naturally
stock a wider range of products which will help to mitigate larger swings in
revenue and costs.
Changes in revenue and costs for retailers: Some of these will be positive 1.11
as a typical retailer will need to purchase and store a smaller stock of bags.
There will be some additional administrative costs associated with record
keeping and donations to charities.
Many of the changes in cashflow experienced by manufacturers, 1.12
wholesalers and retailers will be offset by an opposite effect for a different
economic operator in the supply chain. For example, a cost saving for

176
retailers will be cancelled out by a reduction in revenues for manufacturers
and wholesalers. These private benefits within the supply chain act as
transfer payments redistributing money between economic operators
without generating additional value to the economy. Given the economic
evaluation considers the net impact of the policy from the perspective of
society as a whole, these transfers net out and hence are not considered
as an additional impact in the analysis.
That said there may be impacts which are overlooked by this society-wide 1.13
perspective. There may be some impact on employment by bag
manufacturers, but this will be offset through job opportunities elsewhere,
as money saved through reduced bag purchases will be spent elsewhere.
There are some distributional issues, for example whether some
companies are affected more than others and where affected businesses
are located, but the evidence from the surveys suggests that such effects
are limited.
Added administrative costs to business represent a real and additional cost 1.14
of the policy. The costs estimated in this evaluation are based on
information from the surveys, with most retailers considering that the total
time spent on administration of the charge is less than one day per year.
Donations to good causes
Donations to good causes are calculated as the sum of bag sales under the 1.15
implementation scenarios categorised as SUCBs, multiplied by the 5p
charge and 87% which is considered to be the proportion of charge actually
donated to good causes. Donations from sale of other bags are assumed to
be zero. Although the donations to good causes themselves will represent
a direct transfer of funds from consumers to good causes, the additional
action and activities undertaken by good causes funded by these donations
will deliver additional social benefits which are important to capture within
this evaluation.
The figure of 87% has been drawn from the retailer survey data with all 1.16
three sectors responding on average that 87% of the charge was donated
to good causes. Variation around this data point are considered low as the
consensus from the retailers survey suggests the proportion of donations
that are actually donated to good causes in the UK is relatively consistent.
If any variation were to occur it is believed (based on retailer survey data)
that the proportion of charge donated would be higher rather than lower
resulting in an increase in the level of donation to good causes.
Waste management
The costs of waste management are calculated as the sum of: 1.17
Recycling and waste management costs for each type of bag.

177
These are calculated as: 1.18
Number of bags of each type multiplied by the proportion going to recycling or waste disposal through landfill or incineration, multiplied by the cost per bag for each waste management route
The consumer survey provides the percentage going to recycling or waste 1.19
management. The amount going to litter is calculated as the residual
quantity and is estimated to be high at 13%. The figure may be high as a
result of rounding in the estimates of the amount sent for recycling and
disposal. A more appropriate figure may be around 0.5%, calculated as the
residual number of bags from a Eunomia report to the European
Commission1, which estimates that 99.5% of SUCBs in the UK end up go
to landfill or incineration.
The figures going for recycling also appear questionable. Consumers may 1.20
put plastic bags in recycling, but the bags may not be recycled as most
recycling facilities do not accept plastic film. As noted, the Eunomia report
to the European Commission estimates that 99.5% of bags are landfilled or
incinerated in the UK, leaving very little for recycling or littering.
The estimates of cost per bag are based on the median estimates from the 1.21
WRAP Gate fees report. For recycling this is quantified as the weight of a
bag divided by the MRF figures per tonne for recycling. For waste
management the weight of a bag is divided by the non-hazardous landfill
charge. This could generate misleading results for recycling given that the
cost range for recycling ranges through zero, and the cost per tonne will be
highly variable across different materials sent for recycling. However it is
assumed that SUCBs will be part of a mixed recycling stream (i.e. collected
mixed with other recyclable materials) so this value for mixed waste arriving
at the MRF is considered a reasonable proxy value. The WRAP figures
exclude landfill tax and haulage.
Environmental impact
Environmental impact is calculated as the sum of: 1.22
CO2 impact + air pollution + water pollution + litter collection costs
These effects are mainly associated with the manufacture of bags. Water 1.23
pollution impacts are set to zero, as manufacturing facilities within the EU
will be linked to water services and associated liquid effluents will be
processed, for example at sewage treatment works, to prevailing standards
prior to release to the environment. Any added pollutant load from any
source could increase the effort needed to clean the water, but should not
lead to differences in the quality of water in the receiving body when
released.
1 http://ec.europa.eu/environment/waste/packaging/pdf/study_options.pdf

178
Air pollution impacts are expressed in terms of SO2 emissions, and valued 1.24
using data on damage cost per tonne emission from Defra. Alternative
estimates of damage cost per tonne emission are available from the
European Environment Agency2: these values would generate higher cost
estimates per bag because they account for impacts over a greater area
(Europe, rather than just the UK) and include a wider range of effects. The
Defra damage costs follow the recommendations of the Committee on the
Medical Effects of Air Pollutants (COMEAP)3, which is more conservative
than the sources used by EEA. Using the EEA data would increase
pollutant damage costs from the £1,633 per tonne assumed by Defra to
£12,448 per tonne.
GHG emission impacts are valued at a cost of £4/tonne of CO2 equivalent, 1.25
the cost for traded emissions recommended by DECC’s UK government
appraisal guidance. This assumes that bag producers are covered by the
EU ETS.
Potential health impacts associated with bag re-use through the transfer of 1.26
micro-organisms are not quantified specifically. Available evidence on
infection rates that has been considered in the course of this study has
found no evidence for an increase in the level of infections associated with
greater re-use of bags following the introduction of the charge.
The litter collection costs are problematic as they do not take specific 1.27
account of the characteristics of plastic bags in litter, in particular their
dispersive qualities through being light and easily captured by the wind or
water. As a result (together with their bright colours) plastic bags are highly
visible in the environment and are often found in places that other litter is
not (e.g. in trees and bushes). Collection costs for ‘litter’ do not take this
into account, leading to underestimation. Results will be driven by the
number of bags that go to littering, and as noted above, when considering
the costs of waste management, this quantity may be overestimated
significantly. No account is taken of the environmental impacts of bag litter,
for example through effects on marine organisms or visual blight.
Consumer impact
The costs and benefits to consumers are calculated using the same 1.28
approach as in the RIA document provided at the time that the charge was
introduced. Benefits to consumers are derived assuming that, in
transferring consumption from SUCBs to reusable bags there are
significant private gains that arise from the use of 1 bag for life in the place
of 14 (calculated as the differential reuse between SUCB’s and Bags for
2 http://www.eea.europa.eu/publications/european-union-greenhouse-gas-inventory-2014
3 http://www.environmental-protection.org.uk/committees/air-quality/about-air-pollution/air-pollution-
and-health/
179
life) SUCBs. This is drawn from the survey data which demonstrated that
on average bags for life where re-used 14 times more than single use
varieties. From this it is inferred that 1 bag for life replaces the need to
buy/consume 14 SUCBs. As a result of this there is an incentive to transfer
demand to reusable bag types result in a net financial gain of up to £0.43
(calculated as the difference between the cost of bags for life and 14
SUCBs at 5p) per additional reusable bag bought. Therefore as the
baseline and sensitivity demand profiles widen there is anticipated to be an
increase in consumer benefits from the greater use of reusable bags.
Costs to consumers are calculated on the basis that consumers willingness
to pay for SUCBs is exhibited through the number of consumers who
choose to forego SUCBs in a shift to reusable bag types. Therefore the
loss of utility resulting from the reduced convenience factor of SUCBs can
be estimated as the lost utility (reduced SUCB consumption multiplied by
charge 5p) divided by two to represent the lost consumer surplus (an
estimate of the areas under the demand curve). This reflects therefore an
estimate of the monetised convenience lost by consumers in having to
remember and carry bags for life with them to all shopping activities.
Utility is a concept in economics which represents the inherent and often 1.29
intangible value that consumers place on the products they consume. In
this case for example, consumers use bags as they provide a convenient
means of transporting products, which consumers place a value on.
Further, the utility associated with bags will differ between bag type
depending on the different characteristics of each bag, such as strength of
the bag, comfort in use and attractiveness. Utility is separate to the price
paid for a bag: in fact, the utility or value a consumer derives from using a
bag, less the price, represents the net benefit that a consumer gains from
using a bag. Where price becomes greater than the utility gained from
using a bag, the consumer may no longer choose to use the bag type in
question as the costs (i.e. the price) outweigh the perceived benefit.
The net effect of the policy is the sum of all the individual changes in utility 1.30
for each consumer. In this case, a change in utility will only occur where a
consumer switches bag type. Where a consumer continues to use a SUCB
following the introduction of the charge, there is no change in utility as they
continue to consume the bag (taking a simplifying assumption that
consumers’ preferences with respect to bags remain constant over time).
Where consumers switch to re-useable bags, the consumer will lose the
utility associated with the SUCB, but gain the utility associated with using
the re-useable bag.
It should be recognised first and foremost that estimating the value or utility 1.31
that consumers place on using a particular type of bag is difficult. As noted
above, the value attached to a particular bag will be influenced by a range

180
of factors, including convenience and comfort. This value will vary by
consumer (as different people value characteristics differently), and by the
situation (e.g. amount of shopping, distance to travel, etc).
Monetary values for utility and preferences are estimated in economics 1.32
through a range of methodologies. A common technique is using
‘willingness-to-pay’ surveys, where consumers are asked directly to place a
monetary value on the benefits they derive from different types of bags.
However, in the absence of such studies, this evaluation uses a technique
known as ‘revealed preference’ (i.e. deriving a value from observed
behaviour) to place a monetary value on the utility associated with different
bags. This is a similar methodology to that used in the original RIA which
aids comparison of results with this study.
The logic to derive utility values from revealed preference is as follows. We 1.33
assume that consumers exhibit perfectly rational behaviour (i.e. they are
fully aware of the price and utility they place on different bag types and use
this information in their bag purchasing decisions). Thereby, after the
charge is implemented, those consumers who choose to forego SUCBs
and shift to using reusable bag types can be assumed to place a value on
SUCBs equal to or less than the charge. This is because with the
implementation of the charge, the net benefit these consumers derive from
SUCBs turns negative, and instead they choose to consume re-useable
bags. Likewise it is assumed that consumers place a value on re-useable
bags equal to or greater than their price, otherwise they would not switch.
When a consumer switches between bag types, they will lose the utility 1.34
associated with the SUCB, but will gain the value placed on the re-useable
bag. The net effect for society will be the sum of these net effects for each
individual consumer. This in part will reflect therefore an estimate of the
monetised convenience lost by consumers in having to remember and
carry bags for life with them to all shopping activities.
This proxy for the utility value of bags for consumers which was developed 1.35
in line with that deployed in the original RIA should be considered as an
estimate only of the consumer impacts for this relatively small change in
charge rate. If increasing charge rates are to be considered then the
uncertainty around using this proxy to estimate utility impacts increases4.
In this case more robust analysis should be conducted to estimate the
benefits to consumers, based on their willingness to pay for the
convenience of SUCBs versus the use of a bag for life.
4 Here we assume a value of 5p attached to SUCBs, but in fact the utility of an individual consumer could range between 0p to 5p. Where we consider a charge of 10p for example, this range could increase to between 0p and 10p, increasing the range of uncertainty.

181
Uncertainty analysis
Uncertainty analysis focusses on whether alternative assumptions, 1.36
alternative data sources, or variability in data could influence the main
conclusion reached in the analysis, that:
The introduction of the SUCB charge in Wales has generated significant benefits to society.
Each parameter is considered, with recommendations given for treatment 1.37
within the uncertainty analysis.
Table A5.1: Recommendations for uncertainty analysis
Cost element Parameter Position
Number of bags of each type
Assumed that uncertainty in the number of bags overall, and the number of bags of each type in circulation, is low because data is sourced from the consumer surveys, WRAP5, etc. Uncertainty accounted
for using the low-high ranges
Administrative and enforcement costs
Administrative costs Uncertainty low as data are from Welsh Government directly.
Enforcement costs Investigate sensitivity with enforcement costs set to £49,250/year.
Costs to business
Costs to manufacturers
Assumed to cancel out against reduced costs to retailers
Costs to wholesalers Assumed to cancel out against reduced costs to retailers
Costs to retailers Assumed to cancel out against reduced revenues to manufacturers and wholesalers
Charitable donations
Alternative estimate of fraction of costs donated to charity based on information from retailers (95%), though effect on overall results will be small.
Waste management costs
% bags going to waste management, recycling and litter
Using data from the consumer surveys may introduce error, where bags are put by consumers in recycling, but bags are not recyclable. % of SUCBs estimated as going into litter is high (13%), possibly through rounding errors. For sensitivity analysis assume 99% are sent to landfill or incineration and 0.5% each to litter and recycling. This will demonstrate
5 http://www.wrap.org.uk/content/carrier-bags-reducing-their-environmental-impact
182
Cost element Parameter Position
sensitivity of final conclusions to these estimates
Cost of waste management options per bag
The sensitivity analysis assuming only 0.5% of bags are recycled largely takes out concern over the recycling costs for SUCBs. However, it does not address uncertainty in the costs of cleaning up SUCBs as litter, particularly when they become removed from other litter and become hard to collect (e.g. when in trees or rivers).
Environmental costs
Climate costs Analysis adopts UK government figure (DECC) of £4 per tonne for carbon.
Air pollution costs For sensitivity analysis adopt a figure of £12,448 per tonne SO2.
Water pollution costs
These costs are assumed to be zero, on the grounds that emissions to water from manufacturing should be subject to water treatment which will treat water to a common standard.
Environmental costs associated with litter
These costs cannot currently be quantified. Should be noted as a bias to the analysis. Sensitivity for collection costs accounted for partially against sensitivity analysis that assumes a very high proportion of bags go to landfill or incineration.
Consumer impact
Sensitivity analysis accounting for costs of bags before the introduction of the charge being factored into shopping prices.
Sensitivity analysis conducted
In developing the evaluation model a number of key assumptions were 1.38
made in relation to the input values utilised. Although the majority of these
values were driven by the best available data sets and new data collated as
part of survey conducted, it is still important to understand the sensitivity of
the model outputs if some of these input variables were to change.
These sensitivity tests have been undertaken on the best estimate scenario 1.39
in order to assess the overall impact that they could have on the overall net
impact of the charging scheme.

183
As identified key areas where sensitivity analysis was to be conducted 1.40
include:
Enforcement costs
Environmental costs (Utilising a higher cost of carbon)
Consumer impacts (Using a higher average cost for bags for life)
Enforcement costs
The evaluation model assumes constant annual costs of enforcement at £1 1.41
million (adjusted for inflation). However feedback from the survey would
suggest that consumers at least have found no cause for concern in being
charged for carrier bags with no examples where respondents reported
instances of no charge to local authorities. Therefore it is likely that
enforcement costs could in fact have reduced significantly since this first
estimate was made in 2010/2011.
Over the appraisal period (3.years) this cost is equal to £3.5 million in 1.42
enforcement actions. As stated above it is highly unlikely that these costs
have increased and therefore this level of costs is considered worst case
scenario for local authorities and trading standards.
Two sensitivities have been run below, one where enforcement costs are 1.43
considered to be zero throughout the appraisal period (yielding additional
benefit of £3.5 million) and a second where enforcement costs are lower at
£49,250 per annum.
As can be seen from the additional sensitivity reducing the enforcement 1.44
costs assumed will only have the effect of increasing net benefit of the
policy implemented. The lower estimates provided under sensitivity
analysis provide additional benefits of between £3.3 and £3.5 million across
the timeframe.

184
Table A5.2: Outputs from sensitivity for alternate (Lower) enforcement costs
Option
Net benefit of Best
estimate (constant £1million)
Net benefit of Best estimate (Annual costs
of £49,250)
Net benefit of Best estimate (No
enforcement costs)
Net impact (£m) £30.30 £33.60 £33.80
Administration and enforcement (£m)
-£3.70 -£0.40 -£0.30
Charitable donations (£m)
£30.40 £30.40 £30.40
Waste management (£m)
£0.10 £0.10 £0.10
Environmental impact (£m)
£1.00 £1.00 £1.00
Consumer benefit (£m)
£3.10 £3.10 £3.10
Retailer costs (£m)
-£0.60 -£0.60 -£0.60
Charitable donations
The evaluation model assumes that 87% of charges go to good causes. As 1.45
stated feedback from retailers would suggest that the potential variation in
quantity donated would be positive in that more than 87% was being
donated. A 95% value has been tested below resulting in additional net
benefit of £2.8 million.

185
Table A5.3: Outputs from sensitivity for higher donation rate at 95%
Option Net benefit of Best estimate
Net benefit of Best estimate (Increase to 95% donations)
Net impact (£m) £30.30 £33.10
Administration and enforcement (£m)
-£3.70 -£3.70
Charitable donations (£m)
£30.40 £33.20
Waste management (£m)
£0.10 £0.10
Environmental impact (£m)
£1.00 £1.00
Consumer benefit (£m) £3.10 £3.10
Retailer costs (£m) -£0.60 -£0.60
Waste management costs
The evaluation model assumes that 44% of SUCBs are recycled, whilst 1.46
43% are disposed of to landfill with the remainder disposed of as litter.
Sensitivity analysis has been undertaken that assumes 99.5% are disposed
of at landfill with 0.5% caught as litter. The net effect of this results in a shift
in waste management costs which is negligible, but a larger shift in the
environmental costs, where clean-up costs of litter are accounted for. Litter
of SUCBs is considered the most costly element of their environmental
burden. Reducing the benefits accrued over the baseline in eradicating this
potential benefit, by assuming minimal littering means that the shift to
otherwise more environmentally degrading bag types results in net
environmental cost. This is based on the impact categories included within
this model. The net effect overall is a reduction in net benefit of £1.4
million.

186
Table A5.4: Outputs from sensitivity for higher rate of SUCB landfill disposal
Option Net benefit of Best estimate
Net benefit of Best estimate (99.5% Disposal)
Net impact (£m) £30.30 £28.90
Administration and enforcement (£m)
-£3.70 -£3.70
Charitable donations (£m) £30.40 £30.40
Waste management (£m) £0.10 £0.20
Environmental impact (£m) £1.00 -£0.40
Consumer benefit (£m) £3.10 £3.10
Retailer costs (£m) -£0.60 -£0.60
Environmental costs
Unit cost per tonne of SOx pollutant were set at £1,633 per tonne in the 1.47
evaluation model. If this figure were escalated to the European damage
cost estimate of SOx then it could be that the environmental costs are
significantly higher than initial estimates suggest. Sensitivity tests were run
using new input factors detailed in Table A5.5.
Table A5.5: Updated unit values for carrier bags with higher SOx value
SOx (g/
reference flow)
Bags per RF6
SOx grams per bag
£ per tonne (CE)7
£ per bag
SUCB 11.4 82.14 0.14 £12,448 £0.0017
Paper bag
34.5 64.98 0.53 £12,448 £0.0066
Plastic bag for life
29.3 60.68 0.48 £12,448 £0.0060
36p bag for life
101.3 66.13 1.53 £12,448 £0.0191
Cotton bag
2787.7 45.59 61.15 £12,448 £0.7612
6 Reference flow 7 Central Estimate from EEA: http://www.eea.europa.eu/publications/european-union-greenhouse-
gas-inventory-2014

187
Using the updated higher value provides the new outputs for higher SOx 1.48
below. These values would represent a reduction in net benefit by £2.7
million caused by a shift in environmental burdens resulting from the
greater proportion of higher polluting bags being produced and in
circulation.
Table A5.6: Outputs from sensitivity for higher SOx valuation
Option Net benefit of Best estimate
Net benefit of Best estimate (Higher SOX valuation)
Net impact (£m) £30.30 £27.60
Administration and enforcement (£m)
-£3.70 -£3.70
Charitable donations (£m)
£30.40 £30.40
Waste management (£m)
£0.10 £0.10
Environmental impact (£m)
£1.00 -£1.70
Consumer benefit (£m) £3.10 £3.10
Retailer costs (£m) -£0.60 -£0.60
Consumer impact
Although an alternate methodology has not been adopted for this report, 1.49
the table below suggests the scale of net benefits if the consumer impact
category were to be left out of the aggregation process. As a result of this,
net benefits are reduced by £3.1 million for the timeframe. Additional
analysis does provide evidence that suggests that based on bag demand
profiles for 2014 consumers now could be paying in total £17 million for
carrier bags per annum (with £6 million to charity) versus a no charge cost
of approximately £4.5 million. A shift of £12.5 million. Therefore consumers
would have to value the benefits of reusable bags at least £12.5 million in
order for the net impact to be positive.

188
Table A5.7: Outputs from sensitivity for consumer impact
Option Net benefit of Best estimate
Net benefit of Best estimate (No Consumer impacts)
Net impact (£m) £30.30 £27.20
Administration and enforcement (£m)
-£3.70 -£3.70
Charitable donations (£m) £30.40 £30.40
Waste management (£m) £0.10 £0.10
Environmental impact (£m) £1.00 £1.00
Consumer benefit (£m) £3.10 £0.00
Retailer costs (£m) -£0.60 -£0.60

189
Appendix 5 - Bag demand profile data tables
As noted in Chapter 4, to assess changes in bag demand between October 2011
and January 2015, retailers were asked the extent to which the number of bags
issued had increased or decreased since the charge was introduced. Retailers were
asked to estimate the magnitude of the change against a set of pre-coded ranges.
The highest and lowest values for the ranges were used to develop scenarios of bag
demand ranging from high to low plus a medium ‘best estimate’ figure. Scenarios
reflecting high, medium, and low estimates of bag demand (based on modelling
separate scenarios reflecting the upper and lower ranges for the variables used in
the calculation), and the counterfactual (business as usual (BAU)) scenario are
presented in Figure A5.1, below.
Table A5.1 Estimated Demand Profiles, Trends from 2011 and 2015 by Bag Type
2011
2012
2013
2014
2015
SUCB’s- Plastic
Low
303,845
78,416
89,151
92,382
95,047
Central
323,824
84,126
95,540
98,975
101,809
High
374,461
97,158
110,363
114,337
117,615
BAU(counterfactual)
402,774
407,607
415,759
433,637
448,380
SUCB’s- Paper
Low
16,645
16,215
15,519
13,759
12,614
Central
26,693
25,807
24,300
20,796
18,388
High
34,368
32,985
30,633
25,578
21,737
BAU(counterfactual)
26,760
27,081
27,622
28,810
29,790
Bags for Life- High
Density Plastic
Low
21,944
30,067
34,535
36,008
37,223
Central
21,985
30,114
34,584
36,058
37,273
High
22,334
30,473
34,949
36,424
37,641
BAU(counterfactual)
13,827
13,993
14,273
14,886
15,392
Bags for Life-
Canvas Low
2,234
3,060
3,514
3,663
3,787
Central
2,259
3,091
3,548
3,699
3,823
High
2,318
3,165
3,631
3,784
3,911
BAU(counterfactual) 1,434 1,452 1,481 1,544 1,597