post-fire runoff and erosion from simulated rainfall on ... runoff and erosion from simulated...
TRANSCRIPT

HYDROLOGICAL PROCESSESHydrol. Process. 15, 2931-2952 (2001)DOl: 10.1002/hyp.383
Post-fire runoff and erosion from simulated rainfall on
small plots, Colorado Front Range
Juan Benavides-Solorio and Lee H MacDonald*
Department of Earth Resources, Colorado State University, Fort Collins, CO 80523-1482, USA'f
Abstract:
Wildfires in the Colorado Front Range can trigger dramatic increases in runoff and erosion. A better understanding ofthe causes of these increases is needed to predict the effects of future wildfires, estimate runoff and erosion risks fromprescribed fires, and design effective post-/ire rehabilitation treatments. The objective of this project was to determinewhether runoff and sediment yields were significantly related to the site variables of burn'severity, percent cover,soil water repellency, soil moisture, time since burning, and slope. To eliminate the variability due to natural rainfallevents, we applied an artificial storm of approximately 80 mm h-1 on 26 I m2 plots in the summer and fall of 2000.The plots were distributed among a June 2000 wildfire, a November 1999 prescribed fire, and a July 1994 wildfire.
For 23 of the 26 plots the ratio of runoff to rainfall exceeded 50%. Nearly all sites exhibited strong natural orfire-induced water repellency, so the runoff ratios were only 15-30% larger for the high-severity plots in the twomore recent fires than for the unburned or low-severity plots. The two high-severity plots in the 1994 wildfire hadvery low runoff ratios, and this probably was due to the high soil moisture conditions at the time of the simulatedrainfall and the resulting reduction in the natural water repellency. Sediment yields from the high-severity sites in thetwo more recent fires were 10-26 times greater than the unburned and low-severity plots. The plots burned at highseverity in 1994 yielded only slightly more sediment than the unburned plots. Percent ground cover explained 81 %of the variability in sediment yields, and the sediment yieids from the plots in the 1994 wildfire are consistent withthe observed recovery in percent ground cover. Copyright @ 2001 John Wiley & Sons, Ltd.
KEY WORDS fire; rainfall simulator; runoff; erosion; pine forests; Colorado Front Range
~
f
INTRODUCTION
Under undisturbed conditions forested lands are notable for their high infiltration rates, lack of overland flow,and low erosion rates (DeBano, 1981, 200Ga; Hewlett, 1982). Since forests typically grow in wetter areas,forest lands are the primary source of high-quality water in many regions, including Colorado (Dissmeyer,
2000).Fire is a common disturbance in forest lands. High-severity wildfires are of particular concern because they
can trigger dramatic changes in runoff and erosion processes that adversely affect water resources. Numerousstudies have shown that runoff and erosion rates after wildfires can increase by as much as one to three ordersof magnitude (e.g. Helvey, 1980; Morris and Moses, 1987; DeBano et al., 1996; DeBano 200Gb; Robichaudet al., 2000).
The effects of fire on runoff and erosion are a major concern in the Front Range of Colorado becausethe increasing forest density poses a greater risk of wildfire, the proximity of fire-prone ponderosa (Pinusponderosa) and lodgepole (Pinus contorta) pine forests to urban areas, and the potential for severe post-fire flooding and erosion (Agnew et al., 1997). The 1996 Buffalo Creek fire was particularly noteworthy, inthat high-intensity thunderstorms caused peak flows from small basins to increase from less than 2 m3 s-lto around 60 m3 S-l (R. Jarrett, USGS, personal communication, 2000). Rainsplash, sheetwash, rilling, and
*Correspondence to: L. H. MacDonald, Department of Earth Resources, Colorado State University, Fort Collins, CO 80523-1482, USA.E-mail: [email protected]
Received I April 2001
Accepted 9 July 2001Copyright @ 2001 John Wi1ey & Sons, Ltd.

2932 J. D. BENAVillES-SOLORIO AND L. H. MacDONALD
channel incision generated tremendous amounts of sediment, and the downstream transport of this sedimenttemporarily dammed the South Platte River and reduced the capacity of the Strontia Springs Reservoir byapproximately one-third. The fire-induced changes in runoff and erosion killed two people and repeatedlydestroyed a major highway. The high concentrations of ash and sediment in the runoff have caused severeproblems for the water-treatment plants that serve the city of Denver (Agnew et al., 1997).
The greater forest density in the Colorado Front Range relative to pre-settlement periods (Veblen andLorenz, 1991; Mast, 1993) means that similar wildfires will almost certainly occur in the future. Efforts tomitigate the post-fire increases in runoff and erosion are well meaning, but there is a lack of process-basedunderstanding to design effective emergency rehabilitation treatments (Robichaud et al., 2000). Prescribedfires are being used to reduce the risk of wildfires, but there are few quantitative data on the effects of wildand prescribed fires on runoff and surface erosion rates in the Colorado Front Range.
The large increases in runoff after wildfires are commonly ascribed to the development of a water-repellentlayer at or near the soil surface that restricts infiltration and induces overland flow (DeBano et al., 1970;Shahlaee et al., 1991; Scott and Van Wyk, 1990; Prosser and Williams, 1998; Inbar et al., 1998). The strengthof the water-repellent layer is generally believed to increase with increasing fire intensity due to the greatersoil heating and consumption of the litter and soil organic matter (Tiedeman et al., 1979; DeBano, 2000b ).Though many forest soils are naturally water repellent (DeBano, 1981; Barret and Slaymaker, 1989; Burchet al., 1989), the hydrophobic compounds are not sufficiently concentrated to restrict infiltration over entire
hill slopes.The change from subsurface to overland flow after wildfires can also be facilitated by the loss of the
protective litter layer and the potential for rainsplash to cause soil sealing (DeBano, 2000b ). In high-severitywildfires the organic matter in the soil surface can be consumed, and the resultant loss of aggregate stabilitycan reduce the number of large pores and further reduce the infiltration rate.
The loss of the protective litter layer and the changes in the soil surface can lead to very large increases insoil erosion. After a high-severity fire the mineral soil surface is exposed to rainsplash erosion (Inbar et al.,1998), and the reduction in infiltration rates can lead to large amounts of sheetwash and rill erosion.
In the case of the Colorado Front Range, Delp (1968) observed relatively low erosion rates aft~r a wildfire,and he emphasized the need for more data on soil erosion rates from high-intensity rainstorms. Morris andMoses ( 1987) found sediment flux rates on hill slopes to increase by as much as three orders of magnitudeafter wildfires in ponderosa pine. They attributed this increase to the reduced forest canopy and ground cover,as well as to the formation of a water-repellent layer near the soil surface. After the Buffalo Creek fireAgnew et al. (1997) noted that the lack of data and understanding made it difficult to assess the potential forcatastrophic flooding and erosion. MacDonald et al. (2000) developed a spatially-explicit model to predictpost-fire erosion in central and western Colorado, but the reliability of this model is limited by the lack ofdata for calibration and validation. More generally, DeBano et al. (1996) noted the limited amount of data onthe effects of fire in ponderosa pine forests on runoff and water quality.
The effect of wild and prescribed fires on downstream water resources will also depend on the rate atwhich sites return to pre-disturbance conditions (MacDonald, 2000). Most studies have shown that the greatestincreases in runoff and erosion occur within the first lor 2 years after burning (Helvey, 1980; Robichaud andWaldrup, 1994; Inbar et al., 1998), although this general pattern will be affected by the timing of high-intensityrainfall events (Helvey, 1980). Nearly all studies have shown that soil erosion rates return to background (i.e.pre-disturbance) levels within 3 to 9 years after burning (Robichaud et al., 2000). In the Colorado FrontRange, several studies have shown that soil erosion rates are similar to undisturbed values 3 to 4 years afterburning (Morris and Moses, 1987; Martin and Moody, 2001), but there are few data on the post-fire erosion
rates immediately after burning.Another licnitation to measuring the changes in runoff and erosion after a wildfire is the temporal and spatial
variability in natural precipitation events. In the Colorado Front Range, high-intensity summer convectivestorms generate the largest flows and the highest erosion rates (Morris and Moses, 1987), and these storms
also have the greatest spatial variability.
Hydrol. Process. 15,2931-2952 (2001):opyril(ht @ 2001 John Wi1ey & Sons, Ltd.
2933POST -FIRE RUNOFF AND EROSION FROM SIMULATED RAINFALL
The use of rainfall simulators can largely obviate the problems of measuring rainfall and comparing sitesthat are subject to different storm events (Meyer, 1988). By applying consistent amounts of rainfall one candirectly compare runoff and erosion from plots with different site characteristics, and statistically evaluatethe effect of these site characteristics on runoff and sediment yields. Although the extrapolation of rainfallsimulations to larger areas and natural rainstorms is difficult, rainfall simulations are the most predictable andcost-effective means to compare runoff and sediment yields between sites (Meyer, 1988).
Given this background, the objectives of this project were to: ( 1) compare runoff rates and sediment yieldsfrom burned plots in the Colorado Front Range; (2) relate the dependent variables of runoff and sedimentyield to the independent site variables of burn severity, percent cover, soil water repellency, soil moisture,time since burning, and slope. A rainfall simulator was used to standardize the storm events on each plot.The overall goal was to measure and understand the effects of tires-both prescribed and wild-on runoffand erosion in the ponderosa and lodgepole pine forests in the Colorado Front Range. This information isurgently needed to predict tire-induced changes in runoff and erosion, assign priorities for fuel treatments,and design effective post-tire rehabilitation programs.
METHODS
Study sites
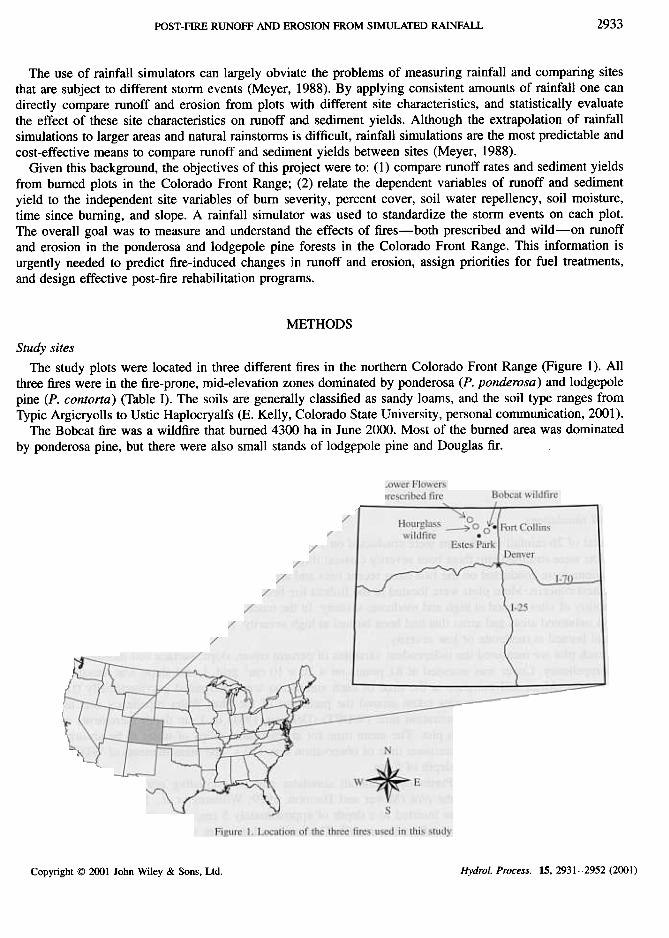
The study plots were located in three different fires in the northern Colorado Front Range (Figure 1 ). Allthree fires were in the fire-prone, mid-elevation zones dominated by ponderosa (P. ponderosa) and lodgepolepine (P. contorta) (Table I). The soils are generally classified as sandy loams, and the soil type ranges fromTypic Argicryolls to Ustic Haplocryalfs (E. Kelly, Colorado State University, personal communication, 2001).
The Bobcat fire was a wildfire that burned 4300 ha in June 2000. Most of the burned area was dominatedby ponderosa pine, but there were also small stands of lod~pole pine and Douglas fir.
Hydrol. Process. 15, 2931-2952 (2001)Copyright @ 2001 John Wi1ey & Sons, Ltd.

2934 J. Do BENAvmES-SOLORIO AND L. Ho MacDONALD
Table Characteristics of each fire and number of simulations by fire and burn severity
Number of simulations TotalsType Date burned Area
(ha)
Primary
vegetation
type
Elevation
range (m)'ire
Highseverity
Moderate
severity
Low severityor unburned
7 5 4 16Wildfire June 2000 4289Bobcat
2 2 2 6Lower Prescribed November 1999Flowers bum
Hourglass Wildfire July 1994
200
2 4516
Ponderosa 2000-3230
pine
Ponderosa 2530-2940
pine
Lodgepole 2590-2930
pine
2 0
7 8 2611Totals
The Lower Flowers fire was a 200 ha prescribed burn that occurred in November 1999 (Table I). Theburned area was dominated by ponderosa pine with small portions of lodgepole pine. Most of the area wasburned at moderate to low severity , although there were some patches of high severity .
The Hourglass fire was the third study site, and this was a wildfire that occurred in July 1994 at a slightlyhigher elevation where lodgepole pine was dominant (Table I). This fire burned 516 ha, and most of the
burned area was classified as high severity (Omi, 1994).The study plots within each fire were stratified by burn severity because this is a primary control on post-fire
runoff and erosion (DeBano et al., 1996). Burn severity was classified according to the criteria developed byWells et al. (1979) and applied by the USDA Forest Service (1995). In high-severity sites the entire organiclayer is consumed and there is visible alteration of the structure and colour of the surface layer of the mineralsoil. In moderate-severity sites the entire litter and duff layer is either consumed or charred, but the underlyingmineral soil is not visibly altered. In low-severity sites the surface litter and duff can be scorched or partlyburned, but there is no visible effect on the underlying mineral soil.
Rainfall simulations
A total of 26 rainfall simulations were conducted on 1 m2 plots in densely forested areas (Tables I and II).The plots were stratified into three burn severity classes: (high, moderate, and low severity or unburned. Moresimulations were conducted on the two more recent fires and areas burned at high severity because these areof greatest concern. More plots were located in the Bobcat fire because it had better road access and a greateravailability of sites burned at high and moderate severity. In the much older Hourglass fire plots were locatedonly in unburned areas and areas that had been burned at high severity, as we could not reliably identify sites
that had burned at moderate or low severity.At each plot we measured the independent variables of percent cover, slope, surface soil moisture, and soil
water repellency. Cover was assessed at 81 points on a 10 x 10 cm2 grid. Local slope was measured witha clinometer. Mean soil moisture at the time of each simulation was determined gravimetrically (Gardner,1986) from three 0-5 cm samples taken around the perimeter of the plot. Water repellency was assessedby measuring the water drop penetration time (WDPT) (DeBano, 1981) in 1 cm depth increments in threepits around the perimeter of each plot. The mean time for at least three drops of water to be absorbed wasdetermined for each depth; the maximum time of observation was 120 s. The measurements of WDPT beganat the surface and extended to a depth of 5 cm.
Rainfall was applied with a Purdue-type rainfall simulator and an oscillating nozzle that was usually2.8-3.0 m above the centre of the plot (Meyer and Harmon, 1979; Williams et al., 1995) (Figure 2). Foreach plot a 1 m2 metal frame was inserted to a depth of approximately 5 cm, and a metal collection trenchwas installed at the lower end to collect the runoff. The inside edges were sealed with native soil mixed
Hydrol. Process. 15, 2931-2952 (2001)Copyright @ 2001 John Wi1ey & Sons, Ltd.

2935POST-FIRE RUNOFF AND EROSION FROM SIMULATED RAINFALL
Table n. Plot characteristics, date of rainfall simulation, and soil moisture at the time of the simulation by fire and burn
severity
Slope
(%)
Fire Plot number Date of simulation Ground cover
(%)
Soil moisture(%)
Burn severity
June 23July 20July 21July 24July 25Aug. 15Oct. 31
92a11108
17156
23
798895909088
9910098
10099
915
669179
100100100
7910090
loo100100
2425223845254031
322324211623
2122232322
263028
251922
181517
303633
212825
1.01.01.01.01.01.59.42.3
1.71.51.61.11.71.5
1.41.61.21.81.5
1.09.55.3
9.05.47.2
19.110.114.6
20.727.424.1
3.38.35.8
HighHighHighHighHighHighHigh
BobcatBobcatBobcatBobcatBobcatBobcatBobcat
Mean
BobcatBobcatBobcatBobcatBobcat
Mean
BobcatBobcatBobcatBobcat
Mean
Lower FlowersLower Flowers
Mean
Lower FlowersLower Flowers
Mean
Lower FlowersLower Flowers
Mean
HourglassHourglass
Mean
HourglassHourglass
Mean
2345
1516
ModerateModerateModerateModerateModerate
Aug. 02Aug. 03Aug. 04Aug. 07Aug. 14
6789
14
Aug. 09Aug. 11Aug. 08Aug. 10
11131012
Low
Low
Unbw
Unbw
High
High
12
Aug. 16Aug. 18
36
Aug. 26
Oct. 19
ModerateModerate
45
UnburnedUnburned
act. 14
act. 17
High
High
Sep. 02Sep. 02
12
34
Unburned
Unburned
Sep. 19Oct. 03
aMost of the ground cover was ash
with a small amount of water and bentonite. Plots were shielded during the simulation to minimize windeffects.
Each simulation consisted of a single 60 min application of rainfall at a constant intensity .The plotswere not wetted prior to the simulation because the storm events of greatest concern are the summerconvective storms that typically occur when the soil surface is dry .The mean intensity of the appliedrainfall was 79 mm h-1, although the range was from 66 to 94 mm h-1 (Table II). The mean rainfallrate of approximately 80 mm h-1 was selected because this is comparable to the maximum I h intensitiesthat have been observed in the Front Range. The rate and distribution of rainfall in each simulation wasinitially assessed from seven rain gauges placed in and around each plot. For most of the simulationsa more accurate rainfall rate was determined by covering the plot with a plastic sheet after runoff
Hvdrol. Process. 15, 2931-2952 (2001):oDvright @ 2001 John Wilev & Sons. Ltd.
medmed

2936 J. D. BENAVIDES-SOLORIO AND L. H. MacDONALD
Figure 2. Photograph of the rainfall simulator and runoff plot on a high-severity site in the Bobcat fire
had ceased, and then measuring the runoff rate while the rainfall simulator was run for an additional
10 min.Runoff rates were measured every minute during the simulation by collecting the runoff for 20- 30 s
and transferring it to a graduated cylinder. We also recorded the time when runoff began and whenrunoff ceased after the end of the simulation. For each simulation we determined the percent changein the runoff rate over the main part of the runoff hydrograph. Every second runoff sample was col-lected in a 500 or 1000 mi plastic bottle, weighed and filtered through a pre-weighed 5 ~ paper filter.The filters and sediment were dried for 24 hat 105 °C and weighed to determine the mass of sed-iment in each water sample. Any sediment remaining in the runoff trough after the simulation wasalso collected, dried, and weighed. This mass was added to the sum of the filtered samples to obtainthe total sediment yield for each plot. Each plot was excavated after the simulation to observe thedepth and extent of infiltration. The dependent variables derived from these data included the time torunoff, equilibrium runoff rate, runoff/rainfall ratio, duration of runoff after the simulation stopped, per-cent change in runoff over the main part of the hydrograph, mean sediment concentration, and total sediment
yield.
Statistical analysis
Analysis of variance was used to detennine whether there were significant differences in the dependentvariables between fires and burn severity classes within fires. If there was a significant difference at p ~ 0.05,multiple comparisons (LSMeans) were used to detennine which means were significantly different (SASInstitute, Inc., 1999). Simple linear regression was used to assess the relationship between each independent
variable and the primary dependent variables.
Hydrol. Process. 15, 2931-2952 (2001)Copyright @ 2001 John Wiley & Sons, Ltd.

2937POST -FIRE RUNOFF AND EROSION FROM SIMULATED RAINFALL
RESULTS
Plot characteristics
Most of the rainfall simulations were done in July and August 2000 under very dry conditions (Table II).Surface soil moisture values were less than 2% for all but one of the 16 simulations on the Bobcat fire.Antecedent moisture conditions were more variable in the other two fires because most of these simulationswere done later in the year after natural rains or transient snowmelt. Soil moisture values were less than 10%for the four simulations in high- and moderate-severity sites in the Lower Flowers fire, and between 10 and20% for the two simulations in unburned areas. In the case of the Hourglass fire, the surface soil moisturevalues were greater than 20% for the two simulations in high-severity sites, but less than 10% for the two
simulations in unburned sites (Table II).Percent ground cover was inversely related to burn severity for the study sites in the two recent fires
(Bobcat and Lower Flowers) (Table II). The high-severity plots in these two fires had less than 20% groundcover, except for the first simulation in the Bobcat fire (plot 1). This simulation was done only 3 days afterthe fire had been controlled, and the plot was in a small depression where ash had accumulated. The othersimulations in the Bobcat fire were conducted at least a month after the fire, by which time most of the ashhad been removed by wind. The moderate-severity plots in these two fires generally had at least 80% cover,whereas the low-severity and unburned plots had nearly 100% cover (Table II). In the older Hourglass fireone of the high-severity plots had 79% cover, and the other three plots all had 100% ground cover.
The mean slope of all plots was 26%, and the range was from 15 to 45% (Table II). There was a significanttendency for percent bare soil to increase with percent slope (R2 = 0.28; p = 0.005), and this is probably
because fire intensity tends to increase as afire burns up slope.Ponderosa pine dominated the overstory for the plots in both the Bobcat and Lower Flowers fires, whereas
the plots in the Hourglass fire were in lodgepole pine. This difference in vegetation is not believed to have asignificant effect on runoff and erosion, as Huffman et al. (2001) found no significant differences in naturalor fire-induced soil hydrophobicity between these two vegetation types.
The following section will first present the runoff data from the plots in the Bobcat fire, as this fire hadthe largest sample size and the most consistent site conditions. Runoff from the other two fires will then becompared with the results from the Bobcat fire, and the effect of the independent variables will be analysed
using the pooled data from all fires.
RunoffThe observed runoff hydrographs were surprisingly consistent in temlS of their overall shape and equilibrium
runoff rates (Figure 3). For the high-severity sites in the Bobcat fire, runoff generally began within 4 minafter the beginning of the simulated rainfall (Table III), and equilibrium runoff was reached within 5 min (e.g.Figure 3a). There was little change in the runoff rate over the remaining 55 min of the simulated rainfall, andrunoff at the high-severity sites ceased within 4 min after the end of the simulated rainfall (Table 111). Forthe seven high-severity plots the mean runoff-to-rainfall ratio was 66%, with a standard deviation of 8%. Thehigh-severity plot with high ash cover had a runoff ratio of 79%, and this value is substantially higher than
any of the other plots (Table 111).The five moderate-severity plots in the Bobcat fire produced less runoff than the high-severity plots
(Figure 4), and the hydrographs from the moderate-severity plots also had significantly longer rising andrecession limbs (Figure 3a and b; Table 111). When compared with the high-severity plots, the mean runoffratio was 58% versus 66%, the mean time to the initiation of runoff was 4.2 minutes versus 2.4 minutes, andthe duration of runoff after the end of the simulated rainfall was 8.8 minutes versus 3.5 minutes. All of thesedifferences were significant at p < 0.05.
The four simulations in the Bobcat fire on low-severity and unburned sites yielded runoff hydrographs thatwere not significantly different from the plots burn~d at moderate severity (Table 111; Figure 3b and c ). Themain difference was that the rate of runoff in some of the low-severity and unburned sites tended to increase
Hydrol. Process. 15, 2931-2952 (2001):opyright @ 2001 John Wiley & Sons, Ltd.

I. D. BENAVIDES-SOLORIO AND L. H. MacDONALD2938
Lower Flowers Prescribed fireBobcat Gulch Fire
High SeverityLower Flowers, Plot 2
18 Aug. 2000d)a)
SOT~I..~ee'-'
~==
~
0 6 121824303642485460 6672
Time (minutes)
Moderate SeverityLower Flowers, Plot 3
26 Aug. 2000,-- ti
0 6 12 18243036424854606672
Time (minutes)
Moderate SeverityBobcat, Plot 602 Aug. 2000
~ ~..~,. 0.
b) e)
80
60
40
20
0
:;'I...ce!~==
~
80
~
I.. 60.=
e
!40
~= 20
~
0
~
~
0 6 121824 3036424854606672
Time (minutes)
Low SeverityBobcat, Plot 1109 Aug. 2000
I)
0 6 121824303642485460 6672
Time (minutes)
UnburnedLower Flowers, Plot 5
17 Oct. 2000c)
80
,:'I.. 60.c
e
540
80
60
40
20
~1,--=
!
~§~
/"""~ ~
I 20
0 ,. ~ I 0 ~ I0 6 12 1824 303642485460 66 72 0 6 12 1824 303642485460 66 72
Time(minutes) Time(minutes)
Figure 3. Typical runoff hydrographs from the Bobcat wildfire (a)-(c) and Lower Flowers prescribed fire (d)-(t) for different severities.Rainfall was applied fromtime 0 to 60 Ir'- n. n ~.~ of 66-94 mm h-l
slowly over the course of the simulation (Figure 3c), but the percent change in the rate of runoff did not vary
significantly with burn severity.The runoff hydrographs from the two high-severity plots in the Lowers Flowers fire were very similar to
the hydrographs from the high-severity plots in the Bobcat fire (Table III; Figure 3a and d). At both sites therewas a very rapid response to rainfall and relatively constant runoff ratio over the course of the simulation. Therecession limbs at Lower Flowers were slightly longer and the runoff ratios slightly less than for the high-severity sites in the Bobcat fire, but only the duration of the falling limb was significantly different (p = 0.002).
Hydro[. Process. 15, 2931-2952 (2001)Convri!!hl @ 2001 John Wilev & Sons. Lid.
r

2939POST -FIRE RUNOFF AND EROSION FROM SIMULATED RAINFAL
Table III. Runoff data for each plot by fire and burn severity
Runoff/rainfallratio
(%)
Time to initialrunoff
(min:sec)
Duration (after rair.
(r.nin:
Plot
number
Bum
severity
Equilibrium
runoff
(mm h-i)
Fire Applicationrate
(mm h-i)
2:503:252:051:551:464:054:002:26
4:354:552:574:034:304:12
3:002:436:002:503:38
2:251:301:57
3:002:522:56
3:262:523:09
1:405:153:27
3:202:483:04
2:50
3:45
2:30
3:20
3:15
4:30
4:00
3:27
7:53
10:00
9:25
8:35
8:13
8:49
8:10
9:30
13:10
8;40
9:52
8:26
5:30
6:58
12:48
8:30
10:39
7:30
7:35
7:32
5:00
4:20
4:40
12:03
8:00
10:01
9385848286769486
768078737977
8079747878
788582
807577
776671
758077
638072
8060605554506661
445552395248
5144484447
505352
275039
424845
342429
424644
7966706461546866
556362506158
5850585255
626061
326348
596261
432836
645459
12345
1516
High
High
High
High
High
High
High
BobcatBobcatBobcatBobcatBobcatBobcatBobcat
Mean
BobcatBobcatBobcatBobcatBobcat
Mean
BobcatBobcatBobcatBobcat
Mean
Lower FlowersLower Flowers
Mean
Lower FlowersLower Flowers
Mean
Lower FlowersLower Flowers
Mean
HourglassHourglass
Mean
HourglassHourglass
Mean
ModerateModerateModerateModerateModerate
6789
14
II
13
10
12
LowLowUnbUlUnbUl
12
HighHigh
36
ModerateModerate
45
UnburnedUnburned
HighHigh2
34
UnburnedUnburned
The two simulations in Lower Flowers on moderate-severity sites yielded very different results. Plot 6 hada runoff ratio of 63% and a correspondingly rapid hydrograph rise and fall, whereas the other moderate-severity plot (plot 3) yielded the lowest runoff ratio (32% ) and the longest recession limb (12.8 mill) of all26 simulations (Table III; Figure 3e). The low runoff from plot 3 was surprising, since it had 66% groundcover compared with 91% for plot 6, and the surface soil moisture was only slightly higher than plot 6 (9.0%versus 5.4% ). Excavation of plot 3 after the simulated rainfall showed that infiltration was occurring overabout 90% of the plot. Although the moderate-severity plots in Lower Flowers did have lower runoff ratios,longer times to runoff, and longer recession limbs than the high-severity plots, the small sample size and highvariability meant that none of these differences was significant at p S 0.05.
The hydrographs from the two unburned plots in Lower Flowers were comparable to the two high-severityplots (Table III; Figure 3d and 0. For both sets of plots the mean runoff ratio was 61 %. The time to runoff
Hydrol. Process. 15,2931-2952 (2001)Copyright @ 2001 John Wi1ey & Sons, Ltd.
Jf runoff
I ended
sec)
rnedrned

2940 I. D. BENAVIDES-SOLORIO AND L. H. MacDONALD
~ Moderate severity [:1 Low severity/Unburned.High severity
Lower Flowers (1999) Hourglass (1994)
Fires
Figure 4. Mean runoff/rainfall ratios by fire and bum severity
Bobcat (2000)
and duration of the recession limbs for the unburned plots were slightly longer than for the high-severityplots, but none of the runoff characteristics from the unburned plots were significantly different from eitherthe high-severity or moderate-severity plots.
The two simulations on high-severity plots in the 6-year-old Hourglass fire yielded a mean runoff ratio ofonly 36% and a mean falling limb duration of 4.7 min (Table rn). In contrast, the two simulations in unburnedareas yielded mean runoff ratios of 59% and a mean falling limb duration of 10 min. The low runoff ratiosfrom the high-severity sites are not surprising, since the percent ground cover on these two plots was 79 and100% (Table II). As discussed later, the low runoff ratios for the high-severity plots may be due to the highantecedent soil moisture.
There were no significant differences in the runoff ratios between the Bobcat and Lower Flowers fires whenthe data were stratified by burn severity (Figure 4). There were also no significant differences in the runoffcharacteristics between the three fires for the unburned and low-severity plots. The high-severity plots in thetwo more recent fires did have a significantly higher runoff ratio than the high-severity plots in the Hourglassfire (Figure 4).
Effect of the site variables on runoff
There were relatively few differences in soil water repellency with burn severity for either the Bobcat orthe Lower Flowers fires (Figure Sa and b ). The soils were generally most water repellent at 1- 2 cm below thesurface, and the water repellency declined relatively rapidly below about 3 cm. These results are consistentwith a much more detailed study of soil hydrophobicity in the same areas (Huffman et al., 2001).
In the older Hourglass fire, the sites bummed at high severity showed no evidence of water repellency,whereas there was a moderate to weak water repellency at all depths in the unburned sites (Figure Sc). Theseresults are confounded by the fact that water repellency in the high-severity sites was assessed later in the fallafter a series of storm had increased the ambient soil moisture to 20% or more (Table ll). Other studies (e.g.Doerr and Thomas, 2000; Huffman et al., 2001) have shown that soils lose their water repellency at thesehigher soil moisture values.
The runoff ratio for all sites increased with increasing water repellency, as indicated by the WDPT at2 cm (R2 = 0.38; p = 0.0008) (Figure 6a). If only the high-severity sites are considered, the R2 betweenWDPT and runoff ratios increases from 38% to 81 %. There was also a highly significant decline in the runoffratio with increasing soil moisture for the high-severity sites (R2 = 0.71 ; p = 0.00 I ), but this relationship
was largely due to the two Hourglass plots with high soil moistures and low runoff ratios (Figure 6b ).
Hydrol. Process. 15, 2931-2952 (2001)Copyright @ 2001 John Wi1ey & Sons. Ltd.

2941POST -FIRE RUNOFF AND EROSION FROM SIMULATED RAINFALL
a) 140
120
100,-.,~
~
80
60
40
20
00 2 3
Depth (cm)
b) 140
120
[)()
3
~
80
60
40
20
0
0 3 4 5
Depth (cm)
c) 140
120
100---"'
'-'
t
~
80
60
4!>
20
Q0 1 2 3 4 5
Depth (cm)
Figure 5. Water repellency from the soil surface to a depth of 5 cm as indicated by the water drop penetration test for the (a) Bobcat fire,(b) Lower Flowers prescribed fire, and (c) 1994 Hourglass wildfire. Zero depth represents the surface of the soil or litter if present. The
persistence of several water drops at each depth was measured for a maximum of 120 s
The runoff ratio in the moderate-severity plots also declined with increasing soil moisture, but this wassignificant only at p = 0.09 (Figure 6b ). Soil moisture had little effect on runoff ratios for the unburned
plots.There was a tendency for the WDPT to increase with decreasing soil moisture (R2 = 0.026; p = 0.009).
Runoff ratios were not significantly related to either percent slope or percent bare soil.
Hydrol. Process. 15, 2931-2952 (2001)Copyright @ 2001 John Wi1ey & Sons, Ltd.

2942 J. D. BENAVIDES-SOLORIO AND L. H. MacDONALD
12020 40 60
WDPT (8)
.Moderate severity
80 1000
0 Low severity/Unburned.High severity
b) 1.00
0.90
.9 0.80
e 0.70
;] 0.60~
.a 0.50~~ 0.40
§ 0.30~ 0.20
0.10.:0.00 -
.
.
R2 = 0.09
, p = 0.49
0~ ----~ () R2=0.47 A
p = 0.09
R2=0.71
p=O.001
.
0 5 10 15 20 25 :
Soil moisture (%).High severity ..Moderate severity 0 Low severity/Unburned
l;iigure 6. Relationship between the runoff/rainfall ratio and (a) mean WDPT at 2 cm, (b) percent soil moistu
10
Sediment yield
The overall pattern of the sedigraphs was surprisingly consistent, as in nearly all cases there was an initialsharp rise in sediment concentrations shortly after the onset of runoff (Figure 7). Sediment concentrationsusually fell sharply after this initial peak, and sediment concentrations were flat or slowly declining over theremaining 50 rnin of the simulated rainfall (Figure 7). In the high-severity plots peak sediment concentrationsranged up to 90 9 1-1, and the final sediment concentrations were at least 30 9 1-1. In the low-severity andunburned plots the peak sediment concentrations were less than 10 9 1-1 and the concentrations over the restof the simulation were less than 5 9 1-1 (Figure 7c and f).
The mean sediment yield for the high-severity plots in the Bobcat fire was 430 g, or nearly five timesthe mean sediment yield of 89 9 for the plots burned at moderate severity (Table IV ; Figure 8), andthis difference was highly significant (p < 0.0001). The mean sediment yield for the low-severity andunburned plots was only 43 g, or half the measured value from the moderate-severity plots, but thisdifference was not statistically significant (p = 0.36). The observed differences in sediment yields wereslightly greater than the differences in sediment concentrations because the high-severity plots had anequilibrium runoff rate that averaged 27% more than the moderate-severity plots (Table ill). The high-severity plot in the Bobcat fire that had the highest runoff ratio and a high ash cover (Bobcat I)yielded 27% less sediment than the mean from the other six high-severity plots, and this suggests thatsediment yields are not a simple function of runoff rate. The first three simulations listed in Table IV have
Hydrol. Process. 15,2931-2952 (2001)Copyright @ 2001 John Wi1ev & Sons, Ltd.

2943POST -FIRE RUNOFF AND EROSION FROM SIMULATED RAINFALL
Bobcat Gulch Fire
High SeverityBobcat, Plot 525 July 2000
~ 100 TJ..
Moderate SeverityBobcat, Plot 602 Aug. 2000
~]J..
,E!J
:5Q;
~-=Q;
e
:0Q;
C/)
~I
0 6 12 18 24 30 36 42 48 54 60
Time (minutes)
UnburnedBobcat, Plot 10
08 Aug.2000 ","'7' 100 'I 100--~80 ~80"0 "0"Q! 60 "Q! 60~ ~-40 -40= =e 20 e 20~ 0 ~ 0 I"" 0 6 12 1824303642485460 "" 0 6 12 18 24303642485460
Time (minutes) Time (minutes)
7. Typical sedigraphs from the Bobcat wildfire (a)-(c) and Lower Flowers prescribed fire (d)-(f) for different severities. Rainfallwas applied from time 0 to 60 min at a rate of 66-94 mm h-t
f)c)Unburned
Lower Flowers, Plot 517 Oct. 2000
Figure
substantially lower sediment concentrations because more of the eroded sediment was deposited in the runoff
trough.The overall pattern of sediment yields from the plots in the Lower Flowers fire were very similar to the
Bobcat fire (Table IV; Figure 8). The mean sediment yield for the two high-severity plots was 342 g, andthe mean sediment yield for the plots burned at moderate severity was 76 g. The two unburned plots yieldedonly 13 9 of sediment, or 4% of the mean sediment yield from the high-severity plots. As in the case ofthe Bobcat fire, the difference in sediment yields between the high- and moderate-severity plots was stronglysignificant (p = 0.0075), but the difference in sediment yields between the moderate-severity and unburned
plots was not significant.Sediment yields from all four simulations in the Hourglass fire were generally similar to the sediment yields
from the low-severity and unburned plots in the Bobcat and Lower Flowers fires (Table IV; Figure 8). The
Hydrol. Process. 15,2931-2952 (2001)Copyright @ 2001 John Wi1ey &Sons, Ltd.
~'C
~60~e 20
i 0('J 0 6 12 1824303642485460
Time (minutes)
:r60
:J

2944 I. D. BENAVIDES-SOLORIO AND H. MacDONALD
Table IV. Sediment yields and sediment concentrations for each plot by fire and burn severity
Plot number Total sediment
(g)
Sediment concentration(g L -I)
Fir" Burn severity
11.019.317.632.330.125.528.623.5
5.45.63.62.42.84.0
1.52.61.42.01.9
12.321.917.1
5.11.93.5
0.40.80.6
2.60.91.7
0.50.50.5
327549574439423317368428
14712551507589
3965214743
294389342
936076
91813
477
27
121413
HighHighHighHighHighHighHigh
BobcatBobcatBobcatBobcatBobcatBobcatBobcat
Mean
BobcatBobcatBobcatBobcatBobcat
Mean
BobcatBobcatBobcatBobcat
Mean
Lower FlowersLower Flowers
Mean
Lower FlowersLower Flowers
Mean
Lower FlowersLower Flowers
Mean
HourglassHourglass
Mean
HourglassHourglass
Mean
2345
1516
6789
14
ModerateModerateModerateModerateModerate
13111210
LowLowUnbUlUnbu:
HighHigh2
36
ModerateModerate
45
UnburnedUnburned
HighHigh
12
34
UnburnedUnburned
average sediment yield for the two plots burned at high severity was 27 g, but the plot with 79% groundcover and a higher runoff ratio produced almost seven times as much sediment as the plot with 100% groundcover and a lower runoff ratio. The two unburned plots in the Hourglass fire produced only 12 and 14 g ofsediment. Although the mean sediment yield for the two high-severity plots in the Hourglass fire was twicethe mean value for the two unburned plots, this difference was not significant owing to the small sample size
and variability in sediment yields from the high-severity plots.The comparisons of sediment yields between fires showed no statistical differences in sediment yields
between the Bobcat and Lower Flowers fires when stratified by burn severity (Figure 8). However, sedimentyields from the high-severity sites in these two fires were significantly greater than the sediment yields fromthe high-severity sites in the Hourglass fire. There were no significant differences in sediment yields between
the three fires for the low-severity and unburned sites.
Hydrol. Process. 15,2931-2952 (2001)Copyright @ 2001 John Wi1ey & Sons, Ltd.
rned
rned

2945POST -FIRE RUNOFF AND EROSION FROM SIMULATED RAINFALL
Bobcat (2000) Lower Flowers (1999)
Fires
Figure 8. Mean sediment yields by fire and bum severity
Effect of site variables on sediment yields
Water repellency was strongly correlated with increasing sediment yields for the plots bummed at high severity(R2 = 0.70; p = 0.001) (Figure 9a). The other two burn-severity classes did not have a significant relationship
between water repellency and sediment yields. Similarly, soil moisture was inversely related to sediment yieldsfor the plots bummed at high severity (R2 = 0.70; p = 0.001), whereas there was no significant relationshipbetween soil moisture and sediment yields for either of the other two bum-severity classes (Figure 9b ). Thestrong correlations for the high severity plots are largely due to the fact that the two high severity plots in theHourglass fire had very low sediment yields, high antecedent soil moisture values, and no water repellency.
Percent bare soil was strongly correlated with increasing sediment yields when all the data were pooled(R2 = 0.81; p < 0.0001), and this relationship is largely due to the high-severity sites having little cover and
high sediment yields (Figure 9c).lncreasing slope was significantly associated with increasing sediment yieldswhen all the data were pooled, but slope explained only 20% of the variation in sediment yields. As notedearlier, the steeper plots were more likely to be classified as high severity. Since slope was not significantlycorrelated with sediment yield when the data were stratified by bum severity, the relationship between burnseverity and slope is largely responsible for the significant increase in sediment yields with increasing slope.
DISCUSSION
Runoff rates
Higher fire severities are generally believed to induce stronger hydrophobic layers (DeBano, 1981), so areasburned at high severity should have lower infiltration rates than areas burned at moderate or low severities.Although few studies have evaluated soil water repellency, infiltration, and runoff rates in ponderosa orlodgepole pine forests after burning, infiltration rates were reduced by 62% in ponderosa pine sites in Arizonathat had been burned at high severity (Campbell et at., 1977). Zwolinski (1971) found that ponderosa pinesites burned at high and low severity had much lower infiltration rates than unburned sites in the first summerafter burning.
In contrast, our results showed only small differences in the runoff/rainfall ratio after stratifying by burnseverity. The mean runoff ratios for the high-severity plots in the Bobcat fire were only about 13% greaterthan the mean runoff ratio for the plots burned at moderate severity, and 20% greater than the mean runoff
Copyright @ 2001 John Wiley & Sons, Ltd. Hvdrol. Process. 15.2931-2952 (2001)

2946 I. D. BENAVillES-SOLORIO AND L. H. MacDONALD
R2 =0.70p = 0.0013
I
.
:.
a) 700
:§600:s 500Q)~400E 300Q).§ 200] 100 ..VJ o~ ..., .n ..0 °~ ,0 ~
0 20 40 60 80 100 120
WDPT (sec).High severity 4 Moderate severity o Low severity/Unburned
R2 = 0.70p = 0.0012
.
,:.
b) 700
§600;g 5000)~400E 3000).§ 200"1=' .~ 100 ~ ..
00 5 10 15 20 30
Soil moisture (%).High severity. Moderate severity o Low severity/Unbumed
c),-..~-0~~~
s
]VJ
0 20 40 60 80 100
Bare soil (% )
.High severity. Moderate severity o Low severity/Unburned
d)
§
"0
"G)
~
t:
8
:00)
(/)
0 10 20 30 40 50
Slope (%).High severity. Moderate severity o Low severity/Unburned
Figure 9. Relationship between sediment yields for each plot and (a) mean WDPf at 2 cm, (b) percent soil moisture, (c) percent bare soil,and (d) slope. The regression lines and statistics in (a) and (b) are only for the high severity plots
Copyright @ 2001 John Wi1ey & Sons, Ltd. Hydro[. Process. 15, 2931-2952 (2001)

2.947POST-FIRE RUNOFF AND EROSION FROM SIMULATED RAINFALL
ratio for the unburned plots and plots burned at low severity (Figure 4). The differences in runoff with burnseverity were less consistent for the other two fires.
One possible reason for the small differences in runoff rates with burn severity is the relatively high intensityof the simulated rainfall. The mean rainfall intensity was 79 mm h -1, and in 23 of the 26 plots the runoffaccounted for more than 50% of the applied rainfall. Even in the unburned plots the mean runoff ratio was58%. If evaporation and interception losses are assumed to be negligible, the equilibrium infiltration rate fromthe unburned plots is only around 20-35 mm h-1. If the unburned plots have a runoff ratio in excess of 50%when they are subjected to a high-intensity simulatedrainfa1l, it is not possible to see a dramatic increase inrunoff ratios from the burned plots.
The small differences in runoff observed in our study are in contrast to the results of other rainfall simulatorstudies in burned areas. Simanton et al. (1990) applied rainfall at 65 mm h-1 and collected four times asmuch runoff from sagebrush sites burned at high severity than unburned sites or sites burned at low severity.Robichaud and Waldrup (1994) applied loo mm h-1 to forested sites in the southern USA and generated tentimes as much runoff from high-severity sites as from sites burned at low severity. It seems that the smalldifferences in runoff with burn severity in our study are due primarily to the high runoff rates from ourunburned and low-severity sites relative to other researchers (e.g. Shahlaee et al., 1991).
Both our field observations and the water drop penetration data suggest that water repellency-both naturaland fire induced-may be one cause of the high runoff rates. Figure 5a and b indicates that the soils werewater repellent at 1-3 cm below the surface in all sites in the Bobcat and Lower Flowers fires, regardlessof burn severity .Robichaud and Hungerford (2000) also found that forest soils were water repellent underdry conditions in unburned areas as well as after burning. In southeastern Australia the runoff increased by5-15% under dry conditions in eucalyptus forests due to natural soil water repellency (Burch et al., 1989),and Pierson et al. (2001) found that unburned intercanopy areas in shrublands generated more runoff thanintercanopy areas that had been burned.
In the case of the Hourglass fire, the unburned sites had weak water repellency to a depth of at least 5 cm,whereas there was no water repellency in the sites burned at high severity (Figure 5c ). The lack of any waterrepellency in the high-severity sites in the Hourglass fire can be attributed to the fact that the antecedentsoil moisture content was more than 20% (Table II). Other studies have shown that natural and fire-inducedhydrophobicity is not present at such high soil moisture levels, making the soils much more wettable thanunder dry conditions (Shahlaee et al., 1991; Doerr and Thomas, 2000; Huffman et al., 2001). The high soilmoisture content and corresponding lack of water repellency is probably why the two high-severity plots inthe Hourglass fire had a mean runoff ratio of only 36% (Table 111). Our excavation of these plots after thesimulations confirmed that the wetting front had penetrated several centimetres in approximately 90% of theplot area.
The shape of the hydrographs observed in our study also suggest a relatively strong water-repellent layerunder dry conditions in both the burned and unburned plots. If the soils are not water repellent the infiltrationrate should decrease and the runoff rate should increase due to the progressively smaller role of capillary forces(Hillel, 1998). On the other hand, an increase in infiltration and a decrease in runoff during the simulationwould suggest a progressive wetting and breakdown of a water-repellent layer. Since most of the simulationsshowed nearly constant runoff after the first 5-10 min, this suggests that the natural or fire-induced waterrepellency remained effective throughout the simulated rainfall event. Our excavation of the plots after eachsimulation also showed that in nearly all cases the soils were dry immediately below the surface, and in mostplots the wetting front had penetrated more than a few centimetres in only a few locations. These observationsalso show that most sites had a relatively strong water-repellent layer at or near the surface. Since there wasno consistent relationship between percent cover and the runoff ratio, soil sealing does not appear to be animportant process, except in the case of the first plot on the Bobcat fire where there was a high ash cover .The implication is that water repellency and antecedent soil moisture are the primary controls on the amountof runoff from our simulated rainfall.
Copyright @ 2001 John Wiley & Sons, Ltd. Hydrol. Process. 15, 2931-2952 (2001)

2948 I. D. BENAVIDES-SOLORIO AND H. MacDONALD
Effect of bum severity and water repellency on sediment yields
The differences in sediment yields with burn severity were much larger than the differences in runoff,and the measured sediment yields were generally more consistent than the runoff ratios when stratified byfire and burn severity (Table IV; Figure 8). Mean sediment yields from the high-severity plots in the Bobcatand Lower Flowers fires were respectively 4.8 and 4.5 times greater than the sediment yields from the plotsbummed at moderate severity .The mean sediment yields from the moderate-severity plots in these two fireswere two and six times greater than the mean sediment yields from the low-severity and unburned plots(Table IV). This means that the high-severity plots in the Bobcat fire produced ten times as much sediment asthe low-severity and unburned plots, and the high-severity sites in the Lower Flowers fire produced 26 timesas much sediment as the unburned plots.
The mean sediment yield of 410 g m-2 from the nine recently bummed, high-severity plots in this studyis higher than the values reported in other studies. In the southeastern USA, simulated rainfall rates of130 mm h-1 produced 65 g m-2 from small plots (Shahlaee et al., 1991), and Robichaud and Waldrup (1994)measured sediment yields of 139 g m-2 as a result of applying 100 mm h-1 of simulated rainfall for 30 rninon plots burned at high severity. Given the shorter simulation period used by Robichaud and Waldrup (1994),the latter value is actually quite comparable to our measured sediment yields. In sagebrush communities,Simanton et al. (1990) found that high-severity sites produced five times as much sediment as unburned sites.Prosser (1990) and Inbar et al. (1998) found erosion rates under natural rainstorms to increase by two to threeorders of magnitude in high severity sites relative to unburned conditions.
The la:-ge increase in erosion rates with increasing burn severity is most commonly ascribed to the lossof ground cover and the increase in runoff due to soil hydrophobicity (Osboro, 1954; Morris and Moses,1987; Inbar et al. 1998). In our study, percent ground cover accounted for 81% of the observed variabilityin sediment yields (Figure 9c ). Comparable plots that produced less runoff but had less percent cover stillproduced more sediment (e.g. Lower Flowers plot 3 versus plot 6). Since burn severity had a large andsignificant effect on sediment yields but only a small effect on runoff ratios, the large differences in sedimentyields with burn severity should be attributed primarily to the differences in ground cover rather than thedifferences in runoff, water repellency, or antecedent soil moisture.
Erosion recovery rates
Our results suggest that the recovery of ground cover is the most important factor in reducing post-fireerosion rates over time, at least for the plot scale addressed in this study. The two high-severity plots in theHourglass fire had burned 6 years prior to our rainfall simulations, and the percent ground cover on thesetwo plots was 79 and 100%. The high-severity plot in the Hourglass fire with 79% ground cover producednearly seven times as much sediment and 50% more runoff than the plot with 100% ground cover. The meansediment yield from these two plots was only 6.6% of the mean sediment yield from the high severity plotsin the more recent Bobcat and Lower Flowers fires; the percent ground cover in the high-severity plots inthese two fires was less than 20% in all but one plot (Table II). These comparisons indicate that the lowersediment yields from the high severity sites in the Hourglass fire are due to the increase in ground coverover the 6 years since burning. Preliminary results from a study of emergency rehabilitation treatments onthe Bobcat fire show that mulched sites produce much less sediment than unmulched sites, and this againemphasizes the importance of surface cover on erosion rates.
The observed reduction in erosion rates over time is consistent with most other studies. Erosion rates fromhigh severity sites in the nearby Buffalo Creek fire declined to background levels within 3 years (Martinand Moody, 2001). Studies in other areas have also shown that erosion rates decline to background levelswithin 3 to 9 years after burning (Martin and Moody, 2001). In the case of the Hourglass fire, the meansediment yield from the two high-severity plots was still twice the sediment yield from the unburned plots(Table IV). Since the simulations on these two plots were conducted under wet antecedent conditions thatmay have depressed the runoff rate and there was a substantial difference in sediment yields between the two
Hydrol. Process. 15, 2931-2952 (2001):opyright @ 2001 John Wiley & Sons, Ltd.

2949POST -FIRE RUNOFF AND EROSION FROM SIMULATED RAINFALL
high-severity plots, we cannot conclusively state whether erosion rates in the Hourglass fire have completelyrecovered to background levels.
Representativeness and scale effects
The plot-scale data show a 10- to 25-fold increase in erosion from the recently burned, high-severity plotsrelative to the low-severity or unburned plots. In absolute terms, the erosion rate from the high-severity plotsaveraged 400 9 m-2 or 4 Mg ha-l. This erosion rate is slightly larger than the reported values for most otherstudies in ponderosa pine in the first year after burning [see review in Robichaud et al. (2000)], but it is muchlower than the post-fire erosion rates reported for mixed conifer forests in Arizona (Hendricks and Johnson,1944) and ponderosa pine and Douglas-fir stands in Idaho (Megahan and Molitor, 1975).
The sediment yields from our plots may be somewhat low in absolute terms because the plots used forthe rainfall simulation were only 1 m long, so rainsplash and sheetwash were the primary erosion processes(Mutchler et al., 1988). In the high-severity plots the plot edges and rain gauges were coated with soilparticles to a height of at least 15 cm at the end of the simulations. During the simulations most of the plotwas generating runoff as sheetflow and there was little evidence of rill erosion.
Both field studies and process-based models suggest that plots must be at least several metres long beforerill erosion becomes an important erosion process (Mutchler et al., 1988). The research underlying the WEPPmodel suggests that rill erosion is the dominant process at the hill slope scale (Nearing et al., 1989). Theabsence of rill erosion in our study plots indicates that our sediment yields per unit area would probablyincrease if the same rainfall event were to be applied on longer plots. The increasing importance of rillerosion at larger scales might also affect the relative importance of the different site factors; slope, forexample, might become a more significant factor than is currently suggested by our plot-scale data.
The representativeness of our erosion rates are also affected by the amount and intensity of the simulatedrainfall. The mean simulated rainfall rate of 79 mm h-l is larger than the estimated 100 year, 1 h storm of56 mm (Miller et al., 1973), but comparable to the largest storm events that have been observed in the area.In 1976, for example, 75 mm h-l fell for approximately 3 h in the same general area as the Bobcat fire, andin 1997 89 mm of rain fell in 1 h in Fort Collins. On 16 August 2000 a convective storm over the Bobcatfire dropped 61 mm of rainfall with a peak 1 h intensity of 29 mm. After the Buffalo Creek fire in 1996a summer convective storm produced 63 mm of rain in 2 h, and this triggered severe flooding and erosion(Agnew et al., 1997). These data indicate that our simulated storm event has a high recurrence interval but isnot unrealistic for the northern Colorado Front Range.
The mean rainfall erosivity from our simulations is approximately 1790 MJ mm ha-l h-l, which isapproximately five times the estimated average annual rainfall erosivity of 340 MJ mm ha-l h-l (Renardet al., 1997). The rainfall energy from a 10 year storm event in the area of the Bobcat Fire is nearly700 MI mm ha-l h-l, or close to 40% of the rainfall erosivity used in our simulations. These calculatederosivities assume that our simulated rainfall has akinetic energy that is similar to natural rainstorms withthe same intensity, and this assumption is supported by the work of Meyer and Harmon (1979). Since boththe rainfall rate and our calculated rainfall erosivities show that our simulations represent relatively extremestorm events, one might expect correspondingly high erosion rates per unit area. The severely burned plotsdid generate 10-25 times more sediment than the unburned plots, but the measured erosion rate of 400 g m-2is lower than might be expected from an extreme storm event, and this is probably due to the absence of rillerosion.
Any effort to extrapolate our results to a larger scale will require an explicit consideration of the shift inerosion processes from rainsplash and sheet erosion at the plot scale to rill erosion at the hill slope scale. Theproblems of identifying a representative storm event and changing erosion processes with increasing spatialscale mean that the measured erosion rates should be regarded as more of an index of relative differencesthan absolute values that can be extrapolated to entire hill slopes or drainage basins. Larger-scale simulationsand repeated measurements over time are needed to help determine the extent to which these results can beused to predict the effects of future fires and to design effective post-fire rehabilitation treatments.
Hydrol. Pro~ss. 15, 2931-2952 (2001)Copyright @ 2001 John Wi1ey & Sons, Ltd.
2950 I. D. BENAVIDES-SOLORIO AND L. H. MacDONALD
CONCLUSIONS
Runoff rates from simulated rainfall on plots that had been recently burned at high severity were only slightlygreater than from plots burned at moderate severity. Runoff rates from moderate-severity sites were notsignificantly different from plots burned at low severity or unburned plots. Both natural and fire-inducedwater repellency were present 1- 3 cm below the surface in the Bobcat and Lower Flowers fires, and this,together with the high intensity of the applied rainfall, may explain the small differences in runoff with burnseverity. The two high-severity plots in the Hourglass fire produced the least runoff, and this is probably dueto the wet antecedent conditions and corresponding suppression of any soil water repellency. Percent groundcover and slope had little influence on runoff rates.
Burn severity had a very large effect on sediment yields in the two recent fires. The high-severity plotsin the Bobcat and Lower Flowers fires produced almost five times as much sediment as the plots burned atmoderate severity, and 10- 26 times as much sediment as the plots burned at low severity and the unburnedplots. The mean sediment yield from the two plots burned at high severity in the Hourglass fire was only twicethe sediment yield from the unburned plots, and this suggests that erosion rates decline to near-backgroundlevels within 6 years after burning. Sediment yields were most strongly correlated with percent bare soil(R2 = 0.81), and only weakly correlated with the amount of runoff or percent slope. The mean sediment yieldfrom plots recently burned at high severity was approximately 0.4 kg m-2. This lower than expected valueis probably due to the fact that the 1 m plot length was too short to generate rill erosion.
Rainsplash and sheetwash were the dominant erosion processes at the scale of our rainfall simulations. Thestrong relationship between percent ground cover and sediment yields suggests that the decline in erosionrates to pre-burn conditions is due primarily to the increase in ground cover. Since runoff and erosion ratesdepended more on burn severity than the type of fire, fire managers should minimize the area burned athigh severity in prescribed fires. Post-fire rehabilitation techniques should focus on maximizing the amountof ground cover. Studies at the hillslope- and catchment-scale are needed to evaluate the changes in erosionrates and processes with increasing scale.
ACKNOWLEDGMENTS
The authors are grateful to the many people who contributed to this research. Dr Jim Dobrowolski provided therainfall simulator and useful guidance. Dave Gloss and Carl Chambers from the US Forest Service facilitatedour work and provided information about the fires and field sites. Dr Pete Robichaud generously shared hisknowledge and experience. Jason Ingenthron was a great help in both the field and the laboratory, along withEdward Huffman, Carlos Ramos, and Joe Wagenbrenner. We are very grateful to Dwight Atkinson and DonBrady of the US Environmental Protection Agency, and Dr Neil Berg of the USDA Forest Service for helpingto fund this research through Grant No. PSW -99-0008CA. We also thank two agencies of the governmentof Mexico-the Consejo Nacional de Ciencia y Tecnologia (CONACYT) and INIFAP-for supporting thesenior author's stay at Colorado State University.
REFERENCES
Agnew W, Labn RE, Harding MY. 1997. Buffalo Creek, Colorado, fire and flood of 1996. Land and Water 41: 27-29.Barret G, Slaymaker 0. 1989. Identification, characterization, and hydrological implications of water repellency in mountain soils, Southern
British Columbia. Catena 16: 477-489.Burch GI, Moore ID, Burns I. 1989. Soil hydrophobic effects on infiltration and catchment runoff. Hydrological Processes 3: 21 1-222.Campbell RE, Baker Ir MB, Ffolliot PF, Larson FR, Avery CC. 1977. Wildfire effects on a ponderosa pine ecosystem: an Arizona case study.
USDA For. Serv. Resp. Pap. RM-191. Rocky Mountain Forest and Range Experiment Station, Fort Collins: CO; 12.DeBano LF. 1981. Water repellent soils: a state-of-the-art. Gen. Tech. Rep. PSW-46, Pacific Southwest Forest and Range Experiment Station,
Forest Service, US Dept. Agriculture, Berkeley, CA; 21.DeBano LF. 2000a. Water repellency in soils: a historical overview. Journal of Hydrology 231-232: 4-32.
Copyright @ 2001 John Wi1ey & Sons, Ltd. Hydrol. Process. 15,2931-2952 (2001)

2951POST -FIRE RUNOFF AND EROSION FROM SIMULATED RAINFALL
DeBano LF. 2000b. The role of fire and soil heating on water repellency in wildland environments: a review. Journal of Hydrology 231-232:195-206.
DeBano LF, Mann LD, Hamilton DA. 1970. Translocation of hydrophobic substances into soil by burning organic litter. Soil Science Societyof America Proceedings 34: 130-133.
DeBano LF, Ffolliot vr, Baker Jr MB. 1996. Fire severity effects on water resources. In Effects of Fire on Madrean Province Ecosystems;a Symposium Proceedings, Ffolliot PF, et al. (coords.) USDA. Forest Service Gen. Tech. Report RM-GTR-289. Rocky Mountain Forestand Range Experiment Station. Coronado National Forest. Tucson, AZ; 77-84.
Delp PO. 1968. Soil movement following an intense bum. MS thesis, Department of Recreation and Watershed Resources, Colorado StateUniversity: Fort Collins CO; 91.
Dissmeyer GE (ed.). 2000. Drinking water from forests and grasslands: a synthesis of the scientific literature. Gen. Tech. Rep. SRS-39. USDepartment of Agriculture, Forest Service, Southern Research Station. Asheville, NC; 246.
Doerr SH, Thomas AD. 2000. The role of soil moisture in controlling water repellency: new evidence from forest soils in Portugal. JournalofHydrology 231-232: 134-147.
Gardner WH. 1986. Water content. In Methods of Soil Analysis: Part 1, Klute A (ed.). American Society of Agronomy: Madison, Wl;493-507.
Hendricks BA, Johnson JM. 1944. Effects of fire on steep mountain slopes in central Arizona. Journal of Forestry 42: 568-571.Helvey ID. 1980. Effects of a north central Washington wildfire on runoff and sediment production. Water Resources Bulletin 16: 627-634.Hewlett ID. 1982. Principles of Forest Hydrology. The University of Georgia Press: Athens, GA; 183.Hillel D. 1998. Environmental Soil Physics. Academic Press: San Diego; 771.Huffman EL, MacDonald LH, Stednick ID. 2001. Strength and persistence of fire-induced soil hydrophobicity under ponderosa and lodgepole
pine, Colorado Front Range. Hydrological Processes 15: 2877-2892.Inbar M, Tarnir M, Wittenberg L. 1998. Runoff and erosion processes after a forest fire in Mount Carmel, a Mediterranean area.
Geomorphology 24: 17-33.MacDonald LH. 2000. Evaluating and managing cumulative effects: process and constraints. Environmental Management 26: 299-315.MacDonald LH, Sampson R, Brady D, Juarros L, Martin D. 2000. Predicting post-fire erosion and sedimentation risk on a landscape scale:
a case study from Colorado. In Mapping Wildfire Hazards and Risks , Sampson RN, Atkinson RD, Lewis JW (eds). Haworth Press: New
York; 57-87.Martin DA, Moody JA. 2001. The flux and particle size distribution of sediment collected in hill slope traps after a Colorado wildfire. In
Proceedings of the Seventh Federal Interagency Sedimentation Conference, Reno, NV; m-40-m-47.Mast IN. 1993. Climatic and disturbance factors influenc!ng Pinus ponderosa stand structure near the forest/grassland ecotone in the Colorado
Front Range. PhD dissertation. University of Colorado at Boulder. Boulder CO.Megahan WF, Molitor DC. 1975. Erosion effects of wildfire and logging in Idaho. In Watershed Management Symposium, August, 1975,
Logan, UT. American Society of Civil Engineers Irrigation and Drainage Division: New York; 423-444.Meyer LD. 1988. Rainfall simulators for soil conservation research. In Soil Erosion Research Methods, Lal L (ed.). Soil and Water
Conservation Society: Iowa; 75-95.Meyer LD, Harmon WC. 1979. Multiple-intensity rainfall simulator for erosion research on row sideslopes. Transactions of the American
Society of Agricultural Engineers 22: 100-103.Miller IF, Frederick RH, Tracey RJ. 1973. Precipitation-frequency atlas of the 'Westem United States, vol. Ill-Colorado. National Oceanic
and Atmospheric Administration, US Department of Commerce: Silver Spring, MD; 67.Morris SE, Moses TA. 1987. Forest fire and the natural soil erosion regime in the Colorado Front Range. Annals of the Association of
American Geographers 77: 245-254.Mutchler CK, Murphree CE, McGregor KC. 1988. Laboratory and field plots for soil erosion studies. In Soil Erosion Research Methods,
Lal L (ed.). Soil and Water Conservation Society: Iowa; 9-36.Nearing MA, Foster GR, Lane U, Finkner SC. 1989. A process-based soil erosion model for USDA-Water Erosion Prediction Project
technology. Transactions of the American Society of Agricultural Engineers 32: 1587-1593.Orni P. 1994. Hourglass Fire. Pingree Park Vicinity, July I-July 7, 1994. WESTFIRE, Department of Forest Sciences, Colorado State
University , http:llwww .cnr .colostate.edu/fslwestfire/hourglass.htmlOsborn B. 1954. Effectiveness of cover in reducing soil splash by raindrop impact. Journal of Soil and Water Conservation 9: 70- 76.Pierson Jr PO, Spaeth KF, Carlson DH. 2001. Fire effects on sediment and runoff in steep rangeland watersheds. In Proceedings of the
Seventh Federal Interagency Sedimentation Conference, Reno, NV; X-33-X-40.Prosser IP. 1990. Fire, humans and denudation at Wangrah Creek, southern Tablelands, N.S.W. Australian Geographical Studies 28: 77-95.Prosser IP , Williams L. 1998. The effect of wildfire on runoff and erosion in native Eucalyptus forest. Hydrological Processes 12: 251- 265.Renard KG, Foster GR, Weesies GA, McCooi DK, Yoder DC (coords). 1997. Predicting Soil Erosion by Water: a Guide to Conservation
Planning with the Revised Universal Soil Loss Equation (RUSLE). US Department of Agriculture, Agriculture Handbook No.703; 404.Robichaud PR, Hungerford RD. 2000. Water repellency by laboratory burning of four northern Rocky Mountain forest soils. Journal of
Hydrology 231-232: 207-219.Robichaud PR, Waldrop TA. 1994. A comparison of surface runoff and sediment yields from low-and-high severity site preparation burns.
Water Resources Bulletin 30: 27-34.Robichaud PR, Beyers JL, Neary DG. 2000. Evaluating the effectiveness ofpostfire rehabilitation treatments. Gen. Tech. Rep. RMRS-GTR-
63. USDA Forest Service, Rocky Mountain Research Station, Fort Collins CO; 85.SAS Institute, Inc. 1999. The SAS systemfor Windows, release 8.01. SAS: Cary, NC.Scott DF. 1993. The hydrological effects of fire in South African mountain catchments. Journal of Hydrology 150: 409-432.Scott DF, Van Wyk DB. 1990. The effects of wildfire on soil wettability and hydrological behaviour of an afforested catchment. Journal of
Hydrology 121: 239-256.
Hydrol. Process. 15, 2931-2952 (2001):opyright @ 2001 John Wi1ey & Sons, Ltd.
2952 D. BENAvmES-SOLORIO AND L. H. MacDONALD
J\
Shahlaee AK, Nutter WL, Burroughs Jr ER, Morris LA. 1991. Runoff and sediment production from burned forest sites in the GeorgiaPiedmont. Water Resources Bulletin 27: 485-493.
Simanton JR, Wingate GD, Weltz MA. 1990. Runoff and sediment from a burned sagebrush community. In Effects of Fire Management ofSouthwestern Natural Resources, Proceedings of the Symposium, November 14-17, 1988, Tucson, AZ, Kramrnes JS (coord.). Gen. Tech.Rep. RM-191. US Department of Agriculture, Forest Service, Rocky Mountain Forest and Range Experiment Station: Fort Collins CO;180-185.
Tiedemann AR, Conrad CE, Dieterich JH, Hombeck JW, Megahan WF. 1979. Effects offire on water. A state-of-knowledge review. USDAForest Service, General Technical Report WO-10: Washington, DC; 28.
USDA Forest Service. 1995. Burned-Area Emergency Rehabilitation Handbook. FSH 2509.13-95-6. Washington, DC; Chapter 20,8.USDA Forest Service. 2000. Bobcat Fire Burn Area Emergency Rehabilitation Assessment. Arapaho and Roosevelt National Forest: Fort
Collins CO; 16.Veblen TT, Lorenz DC. 1991. The Colorado Front Range: a Century of Ecological Change. University of Utah Press: Salt Lake City, UT;
186.Wells CG, Campbell RE, DeBano LF, Lewis CE, Fredriksen RL, Franklin EC, Froelich RC, Dunn PH. 1979. Effects of fire on soil. A
state-of-knowledge review. Gen. Tech. Rep. WO-7. Forest Serv., US Department of Agriculture: Washington, DC; 34.Williams JD, Dobrowolski JP, West NE. 1995. Microphytic crust influence on interrill erosion and infiltration capacity. Transactions of the
American Society of Agricultural Engineers 38: 139-146.Zwolinski MJ. 1971. Effects of fire on water infiltration rates at ponderosa pine stand. In Hydrology and Water Resources in Arizona and the
Southwest, Proceedings of the 1971 Meetings of the Arizona Section, American Water Resources Association, and the Hydrology Section.Arizona Academy of Science: Tempe, AZ; I: 107 -112.
r
~
Copyright @ 2001 John Wiley & Sons, Ltd. Hydrol. Process. 15, 2931-2952 (2001)

131ERRATA
Hydrological Processes Volume 15 Issue 15 'Post-fire Runoff and Erosion from simulated Rainfall on SmallPlots, Colorado Front Range' by I. Benavides-Solorio and L. H. MacDonald, pages 2391-2412,2001.
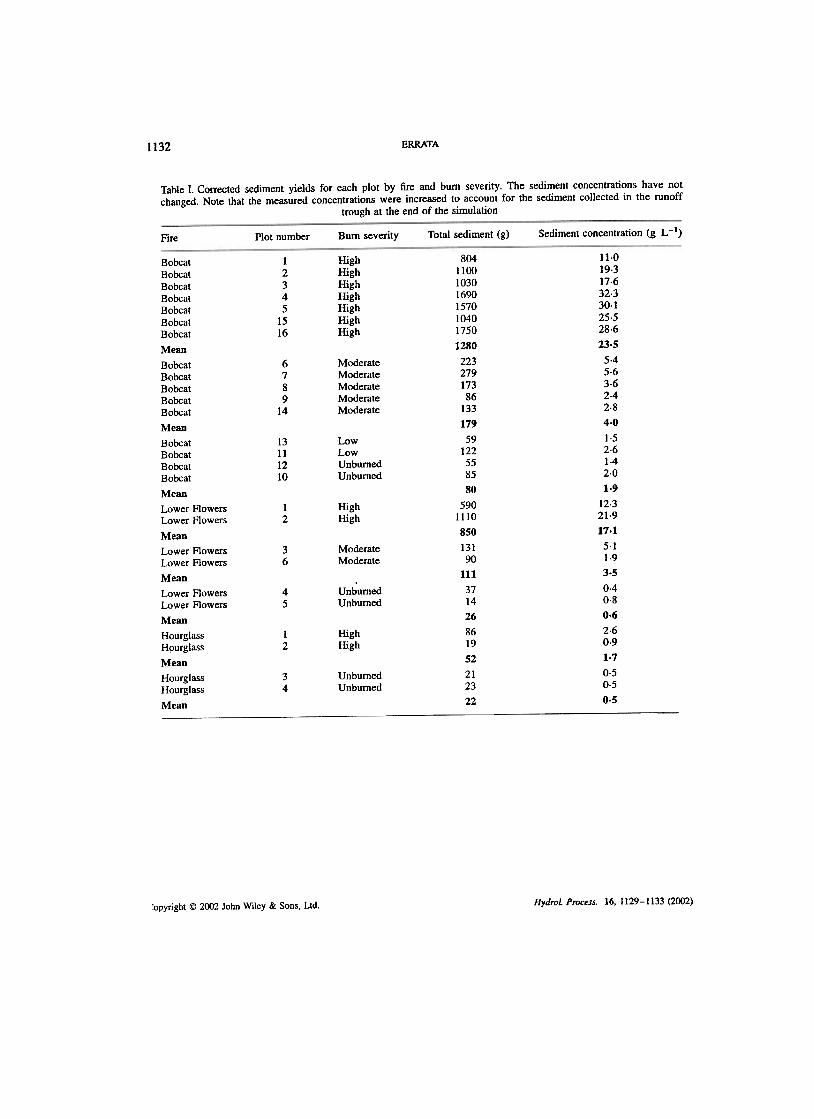
A procedural error in our calculations shows that the plot-scale sediment yields should be 2-3 timeshigher than the values reported in Table IV in Benavides-Solorio and MacDonald (2001). The revised valuesfor each of the 26 plots are shown in Table I. Since the errors were relatively consistent between plots,there are no changes in the significant differences between burn severities and between fires. However, themean sediment yields for the plots bummed at high severity are now 1.3 kg m-2 for the Bobcat wildfire and0.85 kg m-2 for the Lower Flowers prescribed fire (Table 1). In each case these values are more than 7times the mean value for the plots burned at moderate severity. Mean sediment yields from the high-severityplots in the Bobcat and Lower Flowers fires are respectively 16 and 32 times the mean sediment yields fromthe unburned plots and plots burned at low severity. The calculation error means that the plots burned athigh severity now exhibit slightly more variability than originally reported. Sediment concentrations were not
changed.The revised sediment yields have not altered the significance of the relationships between sediment yields
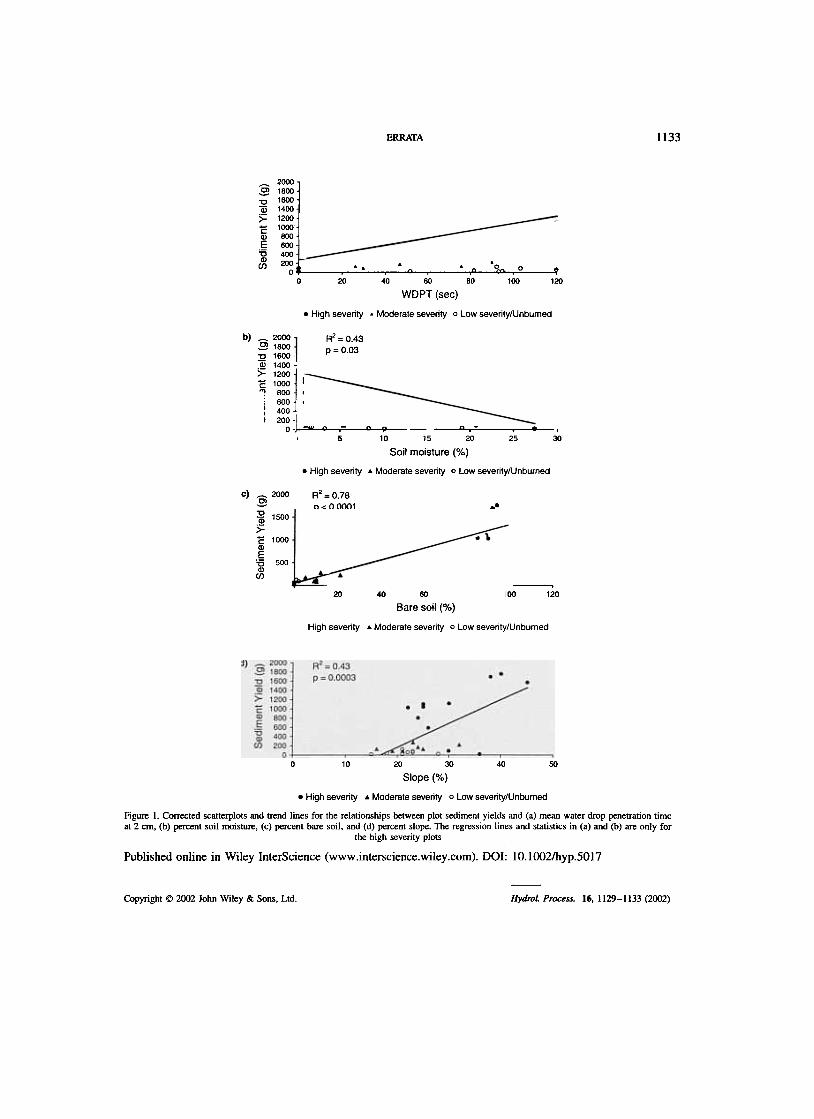
and the four site factors of soil hydrophobicity, percent bare soil, soil moisture, and slope shown in Figure9 in Benavides-Solorio and MacDonald (2001). However, there have been some changes in the coefficientsof determination. Soil hydrophobicity-as indicated by the water drop penetration time-now explains only43% of the variability in sediment yields for the plots bummed at high severity (p = 0-03) (Figure la). Percentsoil moisture also is less strongly correlated for the high-severity plots (R2 = 0-43; p = 0.03) (Figure Ib).Percent slope can explain 43% of the variability in sediment yields from all plots (p = 0-003), and this isdue to the tendency for the more severely-burned plots with higher sediment yields to be on steeper slopes(Figure Id). The most important variable is still percent bare soil, as this explains 79% of the variability insediment yields from the 26 plots (p < 0.001) (Figure lc).
The corrected sediment yields for the nine recently-burned, high-severity plots average 1.2 kg m-2. Theselarger values are more consistent with the hill slope and catchment-scale sediment yields that we have beenmeasuring on the Bobcat Fire. The relatively large magnitude of these values confirm the potential seriousnessof post-fire erosion rates in the Colorado Front Range.
REFERENCES
Benavides-Solorio J, MacDonald LH. 2001. Post-/ire runoff and erosion from simulated rainfall on small plots, Colorado Front Range.Hydrological Processes 15: 2931-2952.
Hydrol. Process. 16, 1129-1133 (2002)Copyright @ 2002 John Wiley & Sons, LId.
ERRATA1132
Table 1. ColTected sediment yields for each plot by fire and bum severity. The sediment concentrations have notchanged. Note that the measured concentrations were increased to account for the sediment collected in the runoff
trough at the end of the simulation
Sediment concentration (g L -I)Bum severity Total sediment (g)Plot numberFire
11.0
19.3
17.6
32.330.1
25.5
28.6
23.5
5.4
5.6
3.6
2.4
2.8
4.0
1.5
2.6
1.4
2.0
1.9
12.321.9
17.1
5.11.9
3.5
0.40.8
0.6
2.6
0.9
1.7
0.5
0.5
0.5
804110010301690157010401750
1280
22327917386
133
179
591225585
80
5901110
850
13190
111
3714
26
8619
52
2123
22
HighHighHighHighHighHighHigh
12345
1516
Moderate
Moderate
Moderate
Moderate
Moderate
6789
14
13
II
12
10
LowLowUnburnedUnburned
HighHigh
12
ModerateModerate
36
UnburnedUnburned
4
5
BobcatBobcatBobcatBobcatBobcatBobcatBobcat
Mean
BobcatBobcatBobcatBobcatBobcat
Mean
BobcatBobcatBobcatBobcat
Mean
Lower RowersLower Rowers
Mean
Lower RowersLower Rowers
Mean
Lower RowersLower Rowers
Mean
HourglassHourglass
Mean
HourglassHourglass
Mean
HighHigh
12
34
UnburnedUnburned
Hydrol. Process. 16, 1129-1133 (2002):opyrighl @ 2002 John Wiley & Sons, LId.
1133ERRATA
R' = 0.43p = 0.03
~ 2000C) 1800
:;- 1600""a5 1400~ 1200-1000~ 800E 600
'5 400Q)200 ..
C/) O O0
0 20 40 60 80 100 120
WDPT (sec)
.High severily .Moderate severily o Low severily/Unbumed
R" = 0.43p = 0.03
b) ~ 2000
2! 1800 .
"0 1600
I-a; 1400 ~ 1200 "E 1 000
"! 800
: 600
, 400
,
, 200
0
I~.
4 o .~ o~ ~ r-
5 10 15 20 25
Soil moisture (%)
.High severity .Moderate severity o Low severity/Unbumed
R2=0.78
p<O.OOO1 .
n ,. , .,30
c) ~E?"0"Q)~cQ)E'5Q)
(/)
,.
., ..
20 , 60 80 1
Bare soil (%)
High severity .Moderate severity o Low severity/Unbumed
r-
10
, .100 120
0 10 20 30 40 50
Slope (%)
.High severity .Moderate severity o Low severity/Unburned
Figure I. Corrected scatterplots and trend lines for the relationships between plot sediment yields and (a) mean water drop penetration timeat 2 cm, (b) percent soil moisture, (c) percent bare soil, and (d) percent slope. The regression lines and statistics in (a) and (b) are only for
the high severity plots
Published online in Wiley InterScience (www.interscience.wiley.com). DOl: IO.IOO2/hyp.5017
Copyright @ 2002 John Wiley & Sons. Ltd.
-
HydroL Process. 16, 1129-1133 (2002)
2000
1500
1000
500