post falls cafr 2007
TRANSCRIPT

C I T Y O F

Compiled By: Shelly Enderud City Finance Director/Treasurer
COVER: Historic photo of construction on the dam Historical photos courtesy of the Post Falls Historical Society
ABOVE: Early photo of the dam at Post Falls

City of Post Falls, IdahoComprehensive Annual Financial Report
For the Fiscal Year Ended September 30, 2007Table Of Contents
Exhibit No. Page No.
INTRODUCTORY SECTIONTransmittal Letter 1Certificate of Achievement 10Organizational Chart 11City of Post Falls Elected and Appointed Officials 12
FINANCIAL SECTIONIndependent Auditor’s Report 13Management's Discussion and Analysis 15Basic Financial Statements
Government-wide Financial Statements Statement of Net Assets 1 27Statement of Activities 2 28
Fund Financial StatementsBalance Sheet – Governmental Funds 3 29Statement of Revenues, Expenditures, and Changes in Fund Balances-
Governmental Funds 4 30Reconciliation of the Statement of Revenues, Expenditures, and Changes in
Fund Balance of Governmental Funds to the Statement of Activities 5 31Statement of Net Assets – Proprietary Funds 6 32Statement of Revenue, Expenses, and Changes in Fund Net Assets –
Proprietary Funds 7 33Statement of Cash Flows – Proprietary Funds 8 34Notes To General Purpose Financial Statements 35
Required Supplementary InformationSchedules of Revenues, Expenditures, and Changes in Fund Balances – Budget and Actual
(GAAP Budgetary Basis) - General Fund - Legal Appropriation Level A-1 59Combining and Individual Fund Statements and Schedules
Combining Balance Sheet – Nonmajor Governmental Funds B-1 60Combining Statement of Revenues, Expenditures and
Changes in Fund Balances - Nonmajor Governmental Funds B-2 61Schedules of Revenues, Expenditures and Changes in Fund Balances - Budget and Actual:
(Non-GAAP Budgetary Basis) - Legal Appropriation LevelLID 2004-1 Debt Service Fund C-1 62Capital Fund C-2 63Cemetery Perpetual Care Special Revenue Fund C-3 64
HUD Loan Special Revenue Fund C-4 65Falls Park Signs Special Revenue Fund C-5 66Special Events Special Revenue Fund C-6 67
Street Lights Special Revenue Fund C-7 68911 Support Special Revenue Fund C-8 69Drug Seizure Special Revenue Fund C-9 70LID 99-1 Debt Service Fund C-10 71LID 96-1 Debt Service Fund C-11 72LID 91-1 Debt Service Fund C-12 73
CLID #2 Debt Service Fund C-13 74LID 89-1 Debt Service Fund C-14 75LID Guarantee Debt Service Fund C-15 76
i

City of Post Falls, IdahoComprehensive Annual Financial Report
For the Fiscal Year Ended September 30, 2007Table Of Contents - continued
Exhibit No. Page No.
STATISTICAL SECTION
Table 1 - Net Assets By Components - Last Five Years 77Table 2 - Change in Net Assets - Last Five Years 78Table 3 - Governmental Activities Tax Revenues By Source - Last Five Years 80Table 4 - Changes in Fund Balances, Governmental Funds - Last Ten Years 81Table 5 - Changes in Fund Balances of Governmental Funds - Last Ten Years 82Table 6 - General Government Tax Revenues By Source - Last Five Years 83Table 7 - Assessed Value and Estimated Actual Values of Taxable Property - Last Ten Years 84Table 8 - Property Tax Rates - Direct and Overlapping Governments 85Table 9 - Principal Property Taxpayers 86Table 10 - Property Tax Levies and Collections 87Table 11 - Ratio of Outstanding Debt by Type - Last Ten Years 88Table 12 - Ratio of General Bonded Debt Outstanding - Last Ten Years 89Table 13 - Direct and Overlapping Governmental Activities Debt 90Table 14 - Legal Debt Margin Information - Last Ten Years 91Table 15 - Pledged-Revenue Bond Coverage - Sewer Fund - Last Ten Years 92Table 16 - Pledged-Revenue Bond Coverage - Water Fund - Last Ten Years 93Table 17 - Pledged-Revenue Bond Coverage - Special Assessments - Last Ten Years 94Table 18 – Demographic and Economic Statistics - Last Ten Years 95Table 19 – Principal Employers 96Table 20 – Full-Time Equivalent Town Government Employees By Function - Last Ten Years 97Table 21 – Operating Indicators By Function - Last Ten Years 98Table 22 – Capital Asset Statistics By Function - Last Ten Years 99Table 23 – Statistical Information - Water Fund 100Table 24 – Statistical Information - Sewer Fund 101Table 25 - Insurance Schedule 102
REPORT BY AUDITORSIndependent Auditor’s Report on Internal Control Over Financial Reporting and On Compliance
and Other Matters Based On An Audit Of Financial Statements Performed In Accordance With Government Auditing Standards 103
ii

ABOVE: Early photo of the falls where the Avista Dam is today

1

2
3

4

5

6

7

8

9

10

City of Post FallsOrganizational Chart
MayorClay Larkin
CouncilorRon Jacobson
CouncilorScott Grant
CouncilorJoe Bodman
CouncilorKerri Thoerson
Park & Recreation
Commission
Planning & Zoning
CommissionCity Administrator Urban Forestry
CommissionPublic SafetyCommission
Administrative Assistant
Debra Raymer
Human Resources
Teresa Benner
Communications SpecialistKit Hoffer
Legal Services City AttorneyJerry Mason
Community Development
DirectorAlex Ikefuna
City ClerkChris Pappas
Parks, Recreation & Cemetery
DirectorDave Fair
Police ChiefCliff Hayes
Finance DirectorShelly Enderud
Public Works Director
Terry Werner
CouncilorSkip Hissong
CouncilorLinda Wilhelm
11

12
NAME OFFICE
Eric Keck City Administrator
Shelly Enderud Finance Director/Treasurer
Cliff Hayes Chief of Police
David Fair Parks & Recreation Director
Alex Ikefuna Community Development Director
Christene Pappas City Clerk
Terry Werner Public Works Director
NAME OFFICE OCCUPATION TERM EXPIRES
Clay Larkin Mayor Retired 2009
Scott Grant Council President Supervisor Probation/Parole Officer 2007
Joe Bodman Council Member Spokane Deputy Sheriff 2009
Ron Jacobson Council Member Senior VP—Inland Northwest Bank 2009
Dick Harris Council Member Retired 2007
APPOINTED OFFICIALS
ELECTED OFFICIALS
CITY OF POST FALLS, IDAHO Listing of City Officials
As of September 30, 2007

ABOVE: Early photo of “” businesses on Spokane Street

INDEPENDENT AUDITORS’ REPORT
Mayor and City CouncilCity of Post FallsPost Falls, ID 83854
We have audited the accompanying financial statements of the governmental activities, the business-type activities, the aggregate discretely presented component units, each major fund, and the aggregate remaining fund information of the City of Post Falls, Idaho as of and for the year ended September 30, 2007, which collectively comprise the City’s basic financial statements as listed in the table of contents. These financial statements are the responsibility of the City of Post Falls, Idaho’s management. Our responsibility is to express opinions on these financial statements based on our audit.
We conducted our audit in accordance with auditing standards generally accepted in the United States of America and the standards applicable to financial audits contained in Government Auditing Standards, issued by the Comptroller General of the United States. Those standards require that we plan and perform the audit to obtain reasonable assurance about whether the financial statements are free of material misstatement. An audit includes examining, on a test basis, evidence supporting the amounts and disclosures in the financial statements. An audit also includes assessing the accounting principlesused and significant estimates made by management, as well as evaluating the overall financial statement presentation. We believe that our audit provides a reasonable basis for our opinions.
In our opinion, the financial statements referred to above present fairly, in all material respects, the respective financial position of the governmental activities, the business-type activities, the aggregate discretely presented component units, each major fund, and the aggregate remaining fund information of the City of Post Falls, Idaho as of September 30, 2007, and the respective changes in changes in financial position and, where applicable, cash flows thereof for the year then ended in conformity with accounting principles generally accepted in the United States of America.
In accordance with Government Auditing Standards, we have also issued our report dated March 21, 2008 on our consideration of the City of Post Falls, Idaho’s internal control over financial reporting and on our tests of its compliance with certain provisions of laws, regulations, contracts, grant agreements and other matters. The purpose of that report is to describe the scope of our testing of internal control over financial reporting and compliance and the results of that testing, and not to provide an opinion on the internal control over financial reporting or on compliance. That report is an integral part of an audit performed in accordance with Government Auditing Standards and should be considered in assessing the results of our audit.
The management’s discussion and analysis and budgetary comparison information, as listed in the table of contents, are not a required part of the basic financial statements but are supplementary information required by accounting principles generally accepted in the United States of America. We have applied certain limited procedures, which consist principally of inquiries of management regarding the methods of measurement and presentation of the required supplementary information. However, we did not audit the information and express no opinion on it.
13

INDEPENDENT AUDITORS’ REPORT (CONCLUDED)
Our audit was conducted for the purpose of forming opinions on the financial statements that collectively comprise the City of Post Falls, Idaho’s basic financial statements. The introductory section, combiningand individual nonmajor fund financial statements, and statistical section are presented for purposes of additional analysis and are not a required part of the basic financial statements. The combining and individual fund financial statements and schedules have been subjected to the auditing procedures applied in the audit of the basic financial statements and, in our opinion, are fairly stated in all material respects in relation to the basic financial statements taken as a whole. The introductory section and statistical sections have not been subjected to the auditing procedures applied in the audit of the basic financial statement and, accordingly, we express no opinion on them.
March 21, 2008
14

City of Post Falls, ID
Management’s Discussion and Analysis As management of the City of Post Falls, we offer readers of the City of Post Falls’ financial statements this narrative overview and analysis of the financial activities for the fiscal year ended September 30, 2007. We encourage readers to consider the information presented here in conjunction with additional information that we have furnished in our letter of transmittal. Financial Highlights
• The assets of the City of Post Falls exceeded its liabilities at the close of the most recent fiscal year by $133,598,070 (net assets).
• At the end of the current fiscal year, undesignated fund balance for the general fund was $4,643,329, or 35.2 percent of total general fund expenditures.
• The governments net assets increased by $18,311,049. Approximately half of this increase is attributed to one-time infusions of resources from capital contributions.
• In the City’s business-type activities, operating revenues increased by $428,701 (5.8 percent) and operating expenses increased by $8,203 (less than one percent).
• The City began construction of a new city hall in April 2007. During FY 07 the city expended $3,500,000 on this project. It will be completed in FY 08.
Overview of the Financial Statements This discussion and analysis is intended to serve as an introduction to the City of Post Falls’ basic financial statements. The City of Post Falls’ basic financial statements are comprised of three components: 1) government-wide financial statements, 2) fund financial statements, and 3) notes to the financial statements. This report also contains other supplementary information in addition to the basic financial statements themselves. Government-wide financial statements. The government-wide financial statements are designed to provide readers with a broad overview of the City of Post Falls’ finances, in a manner similar to a private-sector business. The statement of net assets presents information on all the City of Post Falls’ assets and liabilities, with the difference between the two reported as net assets. Over time, increases or decreases in net assets may serve as a useful indicator of whether the financial position of the City of Post Falls is improving or deteriorating. The statement of activities presents information showing how the City’s net assets changed during the most recent fiscal year. All changes in net assets are reported as soon as the underlying event giving rise to the change occurs, regardless of the timing of related cash flows. Thus, revenues and expenses are reported in this statement for some items that will only result in cash flows in future fiscal periods (e.g., uncollected taxes and earned but unused vacation leave).
15

Both of the government-wide financial statements distinguish functions of the City of Post Falls that are principally supported by taxes and intergovernmental revenues (governmental activities) from other functions that are intended to recover all or a significant portion of their cost through user fees and charges (business-type activities). The governmental activities of the City of Post Falls include general government, public safety, streets, parks and recreation. The business-type activities of the City of Post Falls include water, wastewater, and sanitation. The government-wide financial statements include not only the City of Post Falls itself (known as primary government), but also a legally separate urban renewal district for which the City of Post Falls is not financially accountable. Financial information for this component unit is reported separately from the financial information presented for the primary government itself. The government-wide financial statements can be found on pages 27 to 28 of this report. Fund financial statements. A fund is a grouping of related accounts that is used to maintain control over resources that have been segregated for specific activities or objectives. The City of Post Falls, like other state and local governments, uses fund accounting to ensure and demonstrate compliance with finance-related legal requirements. All of the funds of the City of Post Falls can be divided into two categories: governmental funds and proprietary funds.
Governmental Funds. Governmental funds are used to account for essentially the same functions reported as governmental activities in the government-wide financial statements. However, unlike the government-wide financial statements, governmental fund financial statements focus on near-term inflows and outflows of spendable resources, as well as on balances of spendable resources available at the end of the fiscal year. Such information may be useful in evaluating a government’s near-term financing requirements.
Because the focus of governmental funds is narrower than that of the government-wide financial statements, it is useful to compare the information presented for governmental funds with similar information presented for governmental activities in the government-wide financial statements. By doing so, readers may better understand the long-term impact of the government’s near-term financing decisions. Both the governmental funds balance sheet and the governmental funds statement of revenues, expenditures, and changes in fund balances provide a reconciliation to facilitate this comparison between governmental funds and governmental activities.
The City of Post Falls maintains sixteen individual governmental funds. Information is presented separately in the governmental funds balance sheet and in the governmental funds statement of revenues, expenditures, and changes in fund balances for the general fund, LID 2004-1, and the capital fund, all of which are considered to be major funds. Data from the other thirteen governmental funds are combined into a single, aggregated presentation. Individual fund data for each of these nonmajor governmental funds is provided in the form of combining statements elsewhere in this report.
16

The City of Post Falls adopts an annual appropriated budget for its general fund. A budgetary comparison statement has been provided for the general fund to demonstrate compliance with this budget. The basic governmental fund financial statements may be found on pages 29 to 31 of this report. Proprietary funds. The City of Post Falls maintains three different types of proprietary funds. Enterprise funds are used to report the same functions presented as business-type activities in the government-wide financial statements. The City of Post Falls uses enterprise funds to account for its Water, Sewer and Sanitation operations. Proprietary funds provide the same type of information as the government-wide financial statements, only in more detail. The proprietary fund financial statements provide separate information for the Water, Sewer and Sanitation operations, all of which are considered to be major funds of the City of Post Falls. The basic proprietary fund financial statements may be found on pages 32 to 34 of this report. Notes to the financial statements. The notes provide additional information that is essential to a full understanding of the data provided in the government-wide and fund financial statements. The notes to the financial statements may be found on pages 35 to 58 of this report. Other information. The combining statements referred to earlier in connection with nonmajor governmental funds may be found on pages 60 to 61 of this report. Combining and individual fund statements and schedules can be found on pages of this report.
Government-wide Financial Analysis As noted earlier, net assets may serve over time as a useful indicator of a government’s financial position. In the case of the City of Post Falls, assets exceeded liabilities by $133,598,070 at the close of the most recent fiscal year. By far the largest portion of the City of Post Falls’ net assets (66 percent) reflects its investment in capital assets (e.g., land, buildings, machinery, equipment, other improvements, infrastructure, and construction in progress); less any related debt used to acquire those assets that are still outstanding. The City of Post Falls uses these assets to provide services to citizens; consequently, these assets are not available for future spending. Although the City of Post Falls’ investment in capital assets is reported net of related debt, it should be noted that the resources needed to repay this debt must be provided from other sources, since the capital assets themselves cannot be used to liquidate these liabilities.
17

Below is a summary of the City of Post Falls’ Net Assets statement. City of Post Falls’ Net Assets
Governmental Activities Business-Type Activities Total 2007 2006 2007 2006 2007 2006 ASSETS Current and other assets $22,004,131 $17,234,662 $30,637,015 $28,153,716 $52,641,146 $45,388,378 Capital assets 44,037,275 34,951,809 60,948,420 56,667,772 104,985,695 91,619,581 Total assets 66,041,406 52,186,471 91,585,435 84,821,488 157,626,841 137,007,959 LIABILITIES Long-term liabilities outstanding 8,540,221 9,019,102 9,167,342 9,924,045 17,595,594 18,943,147 Other liabilities 5,759,240 2,052,604 561,968 725,187 6,433,177 2,777,791
Total liabilities 14,299,461 11,071,706 9,729,310 10,649,232 24,028,771 21,720,938 NET ASSETS Invested in capital assets, net of related Debt: 36,228,609 25,932,707 51,893,047 46,839,184 88,121,656 72,771,891 Restricted 9,482,313 6,539,791 7,657,572 5,903,678 17,139,885 12,443,469 Unrestricted 6,031,023 8,642,267 22,305,506 21,429,394 28,336,529 30,071,661
Total net assets $51,741,945 $41,114,765 $81,856,125 $74,172,256 $133,598,070 $115,287,021
An additional portion of the City of Post Falls’ net assets (13 percent) represents resources that are subject to external restrictions on how they may be used. The remaining balance of unrestricted net assets ($28,336,529) may be used to meet the government’s ongoing obligations to citizens and creditors. At the end of the current fiscal year, the City of Post Falls is able to report positive balances in all three categories of net assets, both for the government as a whole, as well as for its separate governmental and business-type activities. At the end of the current fiscal year, 73 percent of the liabilities are made up of noncurrent liabilities. This primarily represents bonds and leases discussed in Notes 6 and 7 of the notes to the financials. Governmental activities. Governmental activities’ key elements are broken down in the following charts. Governmental activities increased the net assets by $10,627,180 and business-type activities increased net assets by $7,683,869. The City’s direct charges to users of governmental services made up $4,940,214 or 21 percent of total governmental revenue. These charges are for park rentals, recreation classes, building permits and other fees related to public safety and administration.
18

Public safety which includes police, domestic violence assistance, animal control and dispatch services accounts for $4,065,252 in expenditures, or 29% of the total. Highway and public works accounts for $2,422,039 in expenditures, or 17% of the total. Culture and recreation accounts for $1,594,522 in expenditures, or 11% of the total. General government, the largest program, accounts for $5,701,979 in expenditures, or 40% of the total. Below is a summary of the City of Post Falls’ Changes in Net Assets. City of Post Falls’ Changes in Net Assets
Governmental Activities Business-Type Activities Total
2007 2006 2007 2006 2007 2006
REVENUES Program revenues: Charges for services $4,940,214 $4,867,034 $7,868,868 $7,440,167 $12,809,082 $12,307,201 Operating grants and contributions 560,896 258,756 560,896 258,756 Capital grants and contributions 6,382,770 10,280,692 5,559,972 5,020,402 11,942,742 15,301,094 General revenues: Property taxes 7,191,562 6,228,757 7,191,562 6,228,757 Other taxes 3,220,308 2,681,188 3,220,308 2,681,188 Other 1,018,119 635,206 1,220,020 854,961 2,238,139 1,490,167 Total revenues $23,313,869 $24,951,633 $14,648,860 $13,315,530 $37,962,729 $38,267,163 EXPENSES General government $5,701,979 $4,880,704 $5,701,979 $4,880,704 Public safety 4,065,252 3,593,961 4,065,252 3,593,961 Highway and public works 2,422,039 2,576,928 2,422,039 2,576,928 Culture and recreation 1,594,522 1,350,230 1,594,522 1,350,230 Interest on long-term debt 434,931 428,521 434,931 428,521 Water $1,447,266 $1,412,346 1,447,266 1,412,346 Sewer 2,703,705 2,863,232 2,703,705 2,863,232 Sanitation 1,281,986 1,202,137 1,281,986 1,202,137 Total expenses $14,218,723 $12,830,344 $5,432,957 $5,477,715 $19,651,680 $18,308,059
INCREASE IN NET ASSETS BEFORE TRANSFERS 9,095,146 12,121,289 9,215,903 7,837,815 18,311,049 19,959,104 TRANSFERS IN (OUT) 1,532,034 957,340 (1,532,034) (957,340) INCREASE IN NET ASSETS 10,627,180 13,078,629 7,683,869 6,880,475 18,311,049 19,959,104 NET ASSETS beginning 41,114,765 28,036,136 74,172,256 67,291,781 115,287,021 95,327,917 NET ASSETS ending $51,741,945 $41,114,765 $81,856,125 $74,172,256 $133,598,070 $115,287,021
19
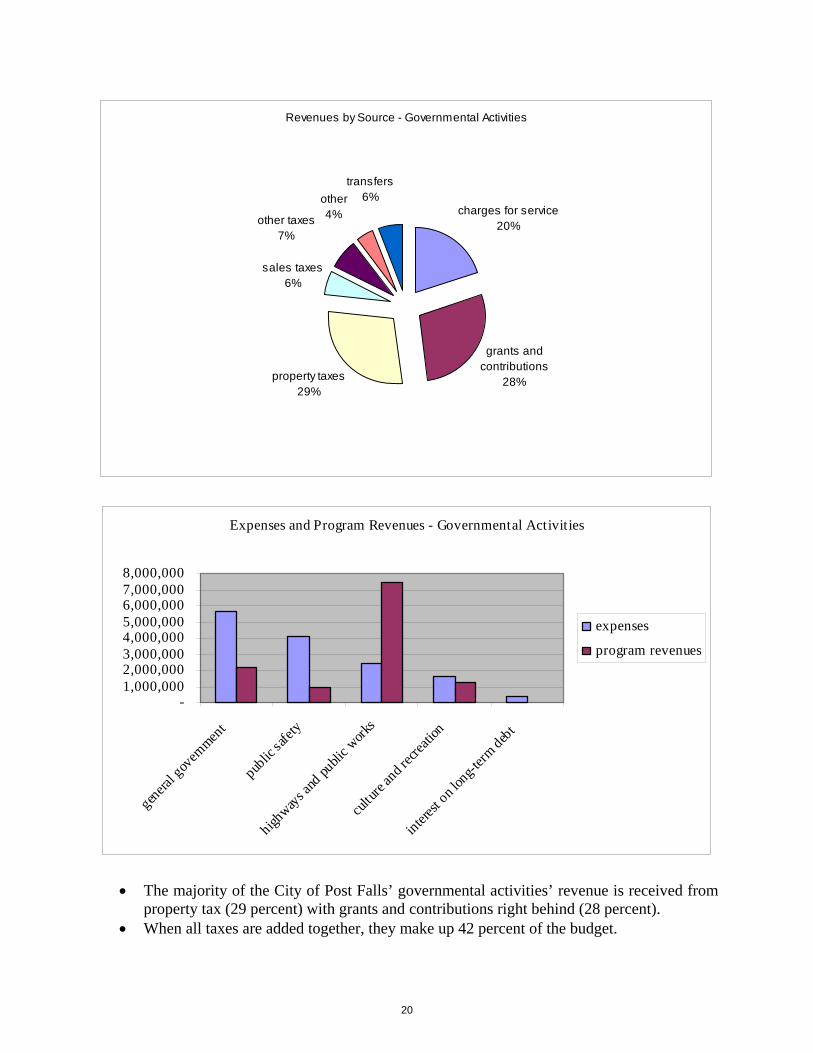
Revenues by Source - Governmental Activities
charges for service20%
grants and contributions
28%
sales taxes6%
other taxes7%
property taxes29%
other 4%
transfers6%
Expenses and Program Revenues - Governmental Activities
-1,000,0002,000,0003,000,0004,000,0005,000,0006,000,0007,000,0008,000,000
general g
overn
ment
public
safet
y
highways a
nd pu
blic w
orks
cultur
e and r
ecreat
ion
interest
on lon
g-term
debt
expenses
program revenues
• The majority of the City of Post Falls’ governmental activities’ revenue is received from property tax (29 percent) with grants and contributions right behind (28 percent).
• When all taxes are added together, they make up 42 percent of the budget.
20

• When revenues are compared to expenses, it shows that only the City of Post Falls’ highways and public works program is self supporting. This is due to donated capital assets from developers. Each program is funded by taxes or other general revenues.
• Grants and contributions are primarily received by public safety and public works. These grants normally have matching requirements by the City, but allow programs and projects that may not happen without those additional funds. The City currently runs a domestic violence program that is primarily funded through federal grants each year.
For the most part, increases in expenses closely paralleled inflation and growth in the demand for services. The only major transactions during the year were a force main extension in sewer and the ground breaking for a new city hall in the capital fund. No significant losses or revenues were received during the year and building permit revenue has remained high. Major funds in the City are general fund, LID 2004-1 and the capital fund. Significant transactions within the general fund this year mainly consisted of repayment of debt, payment of personnel (has been steadily increasing since a wage study was performed in 2001 and since health insurance has been increasing each year) and a transfer of funds to the capital fund to begin the city hall. The average wage increase in the City for the current fiscal year was 4.5 percent. No significant transactions occurred for LID 2004-1 this year. Last, in the capital fund $3,500,000 has been expended on the new city hall project. The general fund has a significant cash balance at year end. A portion of this cash balance has been designated as a contingency fund and the balance has been reallocated for expenditure in the FY 08 budget. Last, the capital fund has a large cash balance that is primarily made up of money that is being saved for future capital projects such as a completion of the new city hall and future road construction.
21

Business-type activities. Business-type activities’ key elements are broken down in the following charts.
Revenue by Source - Business-type Activities
unrestricted investment earnings
8%
other0%
charges for service
54%
capital grants and contributions
38%
Expenses and Program Revenues - Business-type Activities
-1,000,0002,000,0003,000,0004,000,0005,000,000
6,000,0007,000,0008,000,0009,000,000
10,000,000
w ater sew er sanitation
expenses
program revenues
• One of the major sources of the City of Post Falls’ business-type activities’ revenue is received from charges for services (54 percent). Currently, the City of Post Falls’ business-type activities do not use property taxes for any type of funding.
22

• The second major source of revenue is capital contributions. These contributions are received by water and sewer only. The sanitation for the City of Post Falls is contracted out, and the City has no capital investment in that program.
• When revenues are compared to expenses, it shows that all of the City of Post Falls’ programs are self supporting.
• Investment earnings are starting to show a recovery with the strengthening market and they have improved over the prior year.
Again, for the most part, increases in expenses closely paralleled inflation and growth in the demand for services. The City has been growing at a very rapid pace over the last couple of years. The City is the only sewer provider within the City limits and is one of three providers of water within the City limits. All sanitation services are provided through the City.
Financial Analysis of the Government’s Funds As noted earlier, the City of Post Falls uses fund accounting to ensure and demonstrate compliance with finance-related legal requirements. Governmental funds. The focus of the City of Post Falls governmental funds is to provide information on near-term inflows, outflow, and balances of spendable resources. Such information is useful in assessing the City of Post Falls’ financing requirement. In particular, unreserved fund balance may serve as a useful measure of a government’s net resources available for spending at the end of the fiscal year. At the end of the current fiscal year, the City of Post Falls’ reported a combined ending fund balance of $13,927,183, an increase of $1,242,482 in comparison with the prior year. This increase is primarily due to capital project savings and building permit fees. The current fund balance contains $410,450 of reserved dollars, $724,801 of designated dollars and the balance of $12,791,932 is unreserved, which is available for spending at the government’s discretion. The general fund is the chief operating fund of the City of Post Falls. At the end of the current fiscal year, unreserved fund balance of the general fund was $4,643,329, with a total fund balance of $5,423,748. As a measure of the general fund’s liquidity, it may be useful to compare both unreserved fund balance and total fund balance to total fund expenditures. Unreserved fund balance represents 35.2 percent of total general fund expenditures, while total fund balance represents 38.1 percent of that same amount. The other major funds of the City of Post Falls have the following fund balances at year-end: LID 2004-1 has an unreserved fund balance of $367,229. This balance is due to prepayments on the LID. The Capital Fund has a reserved fund balance of $354,832. This is reserve set by debt service requirements. The Capital Fund has an unreserved fund balance of $7,713,348. This fund balance will be used towards future capital projects in the City’s CIP. Proprietary funds. The City of Post Falls’ proprietary funds provide the same type of information found in the government-wide financial statements, but in more detail.
23

Unrestricted net assets of the water, sewer and sanitation funds at the end of the year amounted to $22,305,506 (water $5,092,714; sewer $16,882,267; and sanitation $330,525). Restricted net assets at the end of the year amounted to $7,657,572 (water $3,167,232 and sewer $4,490,340). General Fund Budgetary Highlights Four budget amendments were performed during the current fiscal year. These amendments increased the budget by a total of $3,325,610. General Fund revenues ended the fiscal year with a total positive variance of 7.6 percent. Expenditures ended the fiscal year with a total positive variance of 7.2 percent. The major variance in revenues was due to building permits and an improving economy. The variance in expenditures was due to a combination of numerous small savings in the general government area. Capital Asset and Debt Administration Capital assets. The City of Post Falls’ investment in capital assets for it governmental and business type activities as of September 30, 2007 amounts to $104,985,695 (net of accumulated depreciation). This investment in capital assets includes land, buildings, machinery, equipment, other improvements, and infrastructure. The total increase in the City of Post Falls’ investment in capital assets for the fiscal year was 14.6 percent (a 26 percent increase for governmental activities and a 7.6 percent increase for business-type activities). City of Post Falls’ Capital Assets (net of accumulated depreciation)
Governmental Activities Business-Type Activities Total
2007 2006 2007 2006 2007 2006
Land $4,837,936 $4,837,936 $9,427,540 $9,156,067 $14,265,476 $13,994,003 Buildings & Imp. 11,098,461 8,163,193 11,098,461 8,163,193 Machinery & Equip. 2,160,060 1,988,964 474,261 470,795 2,634,321 2,459,759 Infrastructure 25,940,818 19,961,718 25,940,818 19,961,718 Wells 588,049 635,885 588,049 635,885 Water System 16,387,192 16,409,726 16,387,192 16,409,726 Sewer System 32,304,432 29,520,530 32,304,432 29,520,530
C.I.P. 1,766,946 474,769 1,766,946 474,769
Total $44,037,275 $34,951,811 $60,948,420 $56,667,772 $104,985,695 $91,619,583
Major capital asset events during the current fiscal year included the following:
• Donated capital assets from developers as they develop commercial areas and subdivisions.
• Continued with upgrades in various parks owned by the City. • Constructed a Communications site at Blossom Mountain allowing for more wireless
communication capabilities in the City. • Various Sewer projects across the City in an effort to keep up with growth.
24

• Started construction of a new City Hall. Additional information on the City of Post Falls’ capital assets can be found in note 4 on pages 43 to 44 of this report. Long-term debt. At the end of the current fiscal year, the City of Post Falls had total bonded debt outstanding of $12,470,373. Of this amount, $980,000 is comprised of debt backed by the full faith and credit of the government and $2,435,001 is special assessment debt for which the government is liable in the event of default by the property owners subject to the assessment. The remainder of the City of Post Falls’ debt represents bonds secured solely by specified revenue sources (i.e., revenue bonds), a water loan from DEQ secured solely by specified revenue sources, leases secured by general fund, and compensated absences accrued by employees and a liability of general fund ($731,555), water ($51,118) and sewer ($60,851). Debt Type 2007 Balance 2006 Balance
General Obligation Bonds: $ 980,000 $1,115,000 Sewer Revenue Bonds: 5,907,948 6,560,559 Water – DEQ Loan 3,147,424 3,268,028
Special Assessment Bonds: 2,435,001 2,555,001 Leases 4,393,665 4,687,182 Compensated Absences 843,524 757,376 $17,707,562 $18,943,146 The State of Idaho mandates a general obligation debt limit of 2% of the assessed market value of taxable property within the City boundaries. The limit totaled $34,021,388 on September 30, 2007. The City’s general obligation bond above is subject to this limit. Therefore, $33,041,388 is available for future general obligation indebtedness. Additional information on the City of Post Falls’ long-term debt can be found in notes 6 and 7 on pages 45 to 49 of this report. Economic Factors and Next Year’s Budgets and Rates
• Unemployment in Kootenai County has continued at low levels again this year. The current rate for 2007 was 3.1% while the labor force pool increased to 71,730, up about 10,000 in the last four years.
• Even though the national economy is seeing a slow down, the local economy has continued to grow in Post Falls. Last year, the population increased by 2.5%. Since 1990, the City has increased by 242%, while the County has increased by 105% and the State has increased by 48.9%.
• Building permits issued in the City of Post Falls remain at a high level overall. In the next year, there may be a small decrease in residential permits reflecting the current national economy.
• The number of utility accounts has continued to increasing at an all time high and that growth has been included in the budget process.
25

All of these factors were considered in preparing the City of Post Falls’ budget for the 2007 reported fiscal year and the upcoming 2008 fiscal year. The City of Post Falls’ budget is adopted in a two year cycle. During the current fiscal year, undesignated fund balance in the general fund decreased to $4,643,329. A major portion of this decrease was from a transfer to the capital to help fund the construction of the new city hall. Also, the City of Post Falls has appropriated $71,165 of this amount for spending in the 2007 fiscal year budget. The remaining balance will be reserved during fiscal year 2008 as a contingency fund or designated to the appropriate area. Both water and sewer operating rates were increased by 4.5 percent in the 2008 budget year. Sanitation rates will remain constant for the next couple of years as per a new contract with an outside hauler. Water and sewer rates are set by rate studies that updated every five years. Requests for information This financial report is designed to provide a general overview of the City of Post Falls’ finances for all those with an interest in the government’s finances. Questions concerning any of the information provided in this report or requests for additional financial information should be addressed to the Office of the Finance Director, 408 N Spokane St., Post Falls, ID 83854.
26

Exhibit # 1City of Post Falls
Statement of Net AssetsSeptember 30, 2007
ComponentPrimary Government Unit
Governmental Business-Type Post Falls UrbanActivities Activities Total Renewal Agency
AssetsCash and cash equivalents 13,892,275$ 17,870,535$ 31,762,810$ 20,634$ Investments 2,414,430 2,414,430 2,398,660 Receivables
Accounts 30,894 1,081,124 1,112,018 162,898 Taxes 393,452 393,452 Miscellaneous 406,959 406,959 Special assessments 2,164,533 2,164,533
Due from other governments 1,010,807 3,394,493 4,405,300 Accrued interest 8,636 3,116 11,752 Prepaid items 660,017 660,017 Restricted cash 1,022,128 8,286,233 9,308,361 Capital assets, net of depreciation:
Land 4,837,936 9,427,540 14,265,476 Buildings 11,098,461 4,107,092 15,205,553 Machinery and equipment 2,160,060 474,261 2,634,321 Other improvements 45,172,581 45,172,581 Infrastructure 25,940,818 25,940,818 Construction in progress 1,766,946 1,766,946
Unamortized issue costs 1,514 1,514 Total Assets 66,041,406 91,585,435 157,626,841 2,582,192
LiabilitiesAccounts payable 1,492,938 263,920 1,756,858 846 Accrued payroll 211,106 21,983 233,089 Bond interest payable 87,277 129,027 216,304 3,194 Due to other funds 3,394,493 3,394,493 Restricted customer deposits 573,426 147,038 720,464 Noncurrent liabilities
Due within one year 970,088 857,040 1,827,128 712,327 Due in more than one year 7,570,133 8,310,302 15,880,435 3,004,443
Total Liabilities 14,299,461 9,729,310 24,028,771 3,720,810
Net AssetsInvested in capital assets, net of related debt 36,228,609 51,893,047 88,121,656 Restricted for:
Library and art activities 55,618 55,618 Debt service 633,714 5,660,685 6,294,399 Capital improvements 8,792,981 1,996,887 10,789,868
Unrestricted 6,031,023 22,305,506 28,336,529 (1,138,618) Total Net Assets 51,741,945$ 81,856,125$ 133,598,070$ (1,138,618)$
The notes to the financial statements are an integral part of this statement.27

Exhibit # 2City of Post Falls
Statement of ActivitiesFor the Year Ended September 30, 2007
Net (Expense) RevenueProgram Revenues and Changes in Net Assets
ComponentOperating Capital Primary Government Unit
Charges for Grants and Grants and Governmental Business-type Post Falls UrbanFunctions/Programs Expenses Services Contributions Contributions Activities Activities Total Renewal AgencyGovernmental activities:
General government 5,701,979$ 1,763,765$ 395,539$ 6,872$ (3,535,803)$ (3,535,803)$ (3,500,454)$ Public safety 4,065,252 755,149 87,429 108,869 (3,113,805) (3,113,805) Highways and public works 2,422,039 1,206,647 6,264,117 5,048,725 5,048,725 Culture and recreation 1,594,522 1,214,653 77,928 2,912 (299,029) (299,029) Interest on long-term debt 434,931 (434,931) (434,931) (19,974)
Total governmental activities 14,218,723 4,940,214 560,896 6,382,770 (2,334,843) (2,334,843) (3,520,428)
Business-type activities:Water 1,447,266 2,095,496 734,117 1,382,347$ 1,382,347 Sewer 2,703,705 4,177,428 4,825,855 6,299,578 6,299,578 Sanitation 1,281,986 1,595,944 313,958 313,958
Total business-type activities 5,432,957 7,868,868 5,559,972 7,995,883 7,995,883
Total government 19,651,680$ 12,809,082$ 560,896$ 11,942,742$ (2,334,843) 7,995,883 5,661,040 (3,520,428)
General revenues:Property taxes 7,191,562 7,191,562 1,922,763 Sales taxes 1,449,594 1,449,594 Motor fuel taxes 1,185,285 1,185,285 Alcoholic beverage taxes 585,429 585,429 Unrestricted investment earnings 1,007,266 1,218,220 2,225,486 95,971 Gains (losses) on disposal of capital assets 10,853 1,800 12,653
Transfers 1,532,034 (1,532,034) Total general revenues and transfers 12,962,023 (312,014) 12,650,009 2,018,734
Change in net assets 10,627,180 7,683,869 18,311,049 (1,501,694)
Net Assets - beginning 41,114,765 74,172,256 115,287,021 363,076
Net Assets - ending 51,741,945$ 81,856,125$ 133,598,070$ (1,138,618)$
The notes to the financial statements are an integral part of this statement.28

Exhibit # 3City of Post Falls
Balance SheetGovernmental FundsSeptember 30, 2007
TotalsDebt Service Other Government
General LID 2004-1 Capital Governmental FundsFund Fund Fund Funds 2007
Assets Cash on hand and cash equivalents 2,542,139$ 127,950$ 10,539,269$ 682,917$ 13,892,275$ Investments 2,414,430 2,414,430 Accounts receivable: Property taxes - current 181,134 181,134 - delinquent 212,318 212,318 Loans receivable 8,975 8,975 Miscellaneous 292,497 9,447 8,368 87,672 397,984 Customers 150 30,744 30,894 Due from other governments 668,545 282,733 59,529 1,010,807 Special assessments - delinquent 3,937 13,353 17,290 - deferred 2,018,266 128,977 2,147,243 Interfund receivables 113,026 113,026 Prepaid items 660,017 660,017 Accrued interest 8,636 8,636 Restricted current assets: Cash and cash equivalents 437,464 229,832 354,832 1,022,128
Total assets and other debits 6,870,339$ 2,389,432$ 11,845,219$ 1,012,167$ 22,117,157$
Liabilities and fund balances
Liabilities: Accounts payable 410,218$ 942,799$ 139,921$ 1,492,938$ Interfund payables 64,164 2,790,440 652,915 3,507,519 Accrued payroll and fringe benefits 211,106 211,106 Deferred revenue 231,477 2,022,203$ 151,305 2,404,985 Restricted customer deposits 529,626 43,800 573,426 Total liabilities 1,446,591 2,022,203 3,777,039 944,141 8,189,974
Fund balances: Reserved for: Library and art activities 55,618 55,618 Debt 354,832 354,832 Unreserved: Designated for improvements 724,801 724,801 General fund 4,643,329 4,643,329 Special Revenue funds (198,459) (198,459) Debt Service funds 367,229 266,485 633,714 Capital Fund 7,713,348 7,713,348 Total fund balances 5,423,748 367,229 8,068,180 68,026 13,927,183
Total liabilities and fund balances 6,870,339$ 2,389,432$ 11,845,219$ 1,012,167$
Amounts reported for governmental activities in the statement of net assets are different because:
Capital assets used in government activities are not financial resources and, therefore, are not reported in the funds. 44,037,275 Other long-term assets are not available to pay for current-period expenditures and, therefore, are deferred in the funds. 2,404,985 Long-term liabilities, including bonds payable, are not due and payable in the current period and, therefore, are not reported in the funds (8,627,498)
Net assets of governmental activities 51,741,945$
The notes to the financial statements are an integral part of this statement.
29

Exhibit # 4City of Post Falls
Statement of Revenues, Expenditures, and Changes in Fund BalancesGovernmental Funds
For the Year Ended September 30, 2007
TotalsDebt Service Other Government
General LID 2004-1 Capital Governmental FundsFund Fund Fund Funds 2007
Revenues: Taxes 7,544,333$ 7,544,333$ Intergovernmental 3,433,920 656,709$ 4,090,629 Charges for services 2,278,365 1,705,663 370,096$ 4,354,124 Other revenue 444,712 191,575 281,498 917,785 Special assessment revenue 164,666$ 41,251 205,917 Interest 491,495 152,296 317,336 46,139 1,007,266 Total revenues 14,192,825 316,962 2,871,283 738,984 18,120,054
Expenditures: Current: General government 5,297,590 21,850 58,465 3,700 5,381,605 Public safety 3,707,603 114,970 3,822,573 Highways and public works 1,580,557 261,250 1,841,807 Culture and recreation 1,458,543 23,054 1,481,597 Capital outlay 496,260 4,232,784 170,393 4,899,437 Debt service: Principal 400,772 45,000 68,883 75,000 589,655 Interest 233,814 101,756 53,196 45,303 434,069 Total expenditures 13,175,139 168,606 4,413,328 693,670 18,450,743
Excess (deficiency) of revenues over expenditures 1,017,686 148,356 (1,542,045) 45,314 (330,689)
Other financing sources (uses): Issuance of debt 41,138 41,138 Transfers in 1,118,033 4,251,420 40,965 5,410,418 Transfers out (3,683,420) (75,000) (119,965) (3,878,385) Total other financing sources (uses) (2,524,249) 4,176,420 (79,000) 1,573,171
Net change in fund balance (1,506,563) 148,356 2,634,375 (33,686) 1,242,482
Fund balances, Beginning 6,930,311 218,873 5,433,805 101,712 12,684,701
Fund balances, Ending 5,423,748$ 367,229$ 8,068,180$ 68,026$ 13,927,183$
The notes to the financial statements are an integral part of this statement.
30

Exhibit # 5City of Post Falls
Reconciliation of the Statement of Revenues,Expenditures, and Changes in Fund Balance of
Governmental Funds to the Statement of ActivitiesFor the Year Ended September 30, 2007
Amounts reported for governmental activities in the statement of activitiesare different because:
Net change in fund balances - total governmental funds 1,242,482$
Governmental funds report capital outlays as expenditures. However, in thestatement of activities the cost of those assets is allocated over their estimateduseful lives and reported as depreciation expense. This is the amount by whichcapital outlays exceeded depreciation in the current period. 3,712,863
The net effect of various miscellaneous transactions involving capital assets 5,372,603 (i.e., sales, trade-ins, and donations) is to increase net assets.
Revenues in the statement of activities that do not provide current financial resourcesare not reported as revenue in the funds. (178,787)
The issuance of long-term debt (e.g., bonds, leases) provides current financial resources to governmental funds, while the repayment of the principal of long-termdebt consumes the current financial resources of governmental funds. Neithertransaction, however, has any effect on net assets. Also, governmental fundsreport the effect of issuance costs, premiums, discounts, and similar items whendebt is first issued, whereas these amounts are deferred and amortized in the statement of activities. This amount is the net effect of these differences in the treatment of long-term debt and related items. 478,019
Change in Net Assets of Governmental Activities 10,627,180$
The notes to the financial statements are an integral part of this statement.31

Exhibit # 6City of Post Falls
Statement of Net AssetsProprietary Funds
September 30, 2007
Business-type Activities - Enterprise Funds
Water Water Sewer Sewer Sanitation Sanitation TotalsCurrent Year Prior Year Current Year Prior Year Current Year Prior Year Current Year
AssetsCurrent assets:
Cash 3,958,876$ 4,393,739$ 13,664,850$ 15,158,518$ 246,809$ 261,832$ 17,870,535$ Utility receivables, net 286,377 335,779 598,890 558,052 195,857 170,001 1,081,124 Restricted cash, customer deposits 147,038 165,753 147,038 Due from other funds 781,254 97,705 2,613,239 610,953 3,394,493
Total current assets 5,173,545 4,992,976 16,876,979 16,327,523 442,666 431,833 22,493,190
Non-current assets:Restricted cash 3,446,208 2,685,625 4,692,987 3,710,196 8,139,195 Restricted accrued interest 1,080 1,136 2,036 2,143 3,116 Bond issuance cost, net 1,514 2,284 1,514 Total restricted assets 3,447,288 2,686,761 4,696,537 3,714,623 8,143,825 Capital assets:
Land 54,555 54,555 9,372,985 9,101,512 9,427,540 Wells 1,367,689 1,367,689 1,367,689 Water system 19,688,325 19,309,675 19,688,325 Equipment 491,847 419,573 1,098,593 1,069,524 1,590,440 Sewer system 44,312,001 40,669,512 44,312,001 Construction in progress 197,614 1,569,332 474,769 1,766,946
Less accumulated depreciation (4,326,867) (3,810,640) (12,877,654) (11,988,397) (17,204,521) Total capital assets (net of accumulated depreciation) 17,473,163 17,340,852 43,475,257 39,326,920 60,948,420
Total non-current assets 20,920,451 20,027,613 48,171,794 43,041,543 69,092,245 Total Assets 26,093,996 25,020,589 65,048,773 59,369,066 442,666 431,833 91,585,435
LiabilitiesCurrent liabilities:
Accounts payable 95,068 51,417 56,711 250,631 112,141 100,045 263,920 Accrued payroll 8,649 7,485 13,334 11,156 21,983 Bond interest payable 59,014 61,276 70,013 77,424 129,027 Compensated absences 51,118 47,193 60,851 48,264 111,969 Customer deposits payable 147,038 165,753 147,038 Bond payable - current maturity 125,169 120,604 664,909 652,611 790,078
Total current liabilities 486,056 453,728 865,818 1,040,086 112,141 100,045 1,464,015
Noncurrent liabilities:Bonds payable 3,022,256 3,147,424 5,243,039 5,907,949 8,265,295
Total noncurrent liabilities 3,022,256 3,147,424 5,243,039 5,907,949 8,265,295 Total Liabilities 3,508,312 3,601,152 6,108,857 6,948,035 112,141 100,045 9,729,310
Net AssetsInvested in capital assets, net of related debt 14,325,738 14,072,824 37,567,309 32,766,360 51,893,047 Restricted for:
Replacement 2,077,305 1,382,908 3,583,380 2,617,760 5,660,685 Bond Retirement 1,089,927 1,036,455 906,960 866,555 1,996,887
Unrestricted 5,092,714 4,927,250 16,882,267 16,170,356 330,525 331,788 22,305,506 Total Net Assets 22,585,684$ 21,419,437$ 58,939,916$ 52,421,031$ 330,525$ 331,788$ 81,856,125$
The notes to the financial statements are an integral part of this statement.32

Exhibit # 7City of Post Falls
Statement of Revenues, Expenses, and Changes in Fund Net AssetsProprietary Funds
For the Year Ended September 30, 2007
Business-type Activities - Enterprise Funds
Water Water Sewer Sewer Sanitation Sanitation TotalsCurrent Year Prior Year Current Year Prior Year Current Year Prior Year Current Year
Operating Revenues:Charges for services 1,931,661$ 1,822,589$ 4,004,679$ 3,728,430$ 1,559,448$ 1,462,913$ 7,495,788$ Hookups and connections 24,034 50,903 24,034 Other revenues 139,801 120,971 172,749 228,203 36,496 26,158 349,046
Total operating revenues 2,095,496 1,994,463 4,177,428 3,956,633 1,595,944 1,489,071 7,868,868
Operating Expenses:Salaries and benefits 398,217 379,356 630,294 591,151 1,028,511 Administrative and supplies 411,252 378,440 936,149 1,141,040 1,281,986 1,202,137 2,629,387 Depreciation 516,227 501,359 899,549 871,988 1,415,776
Total operating expenses 1,325,696 1,259,155 2,465,992 2,604,179 1,281,986 1,202,137 5,073,674
Operating income 769,800 735,308 1,711,436 1,352,454 313,958 286,934 2,795,194
Nonoperating revenues (expenses):Intergovernmental 4,400 32,921 4,400 Investment income 352,114 239,781 855,207 607,724 10,899 7,456 1,218,220 Interest expense (121,570) (153,191) (236,943) (258,283) (358,513) Gain on sale of capital assets 1,800 1,800 Amortization of refunding costs (770) (770) (770)
Total nonoperating revenues (expenses) 234,944 119,511 619,294 348,671 10,899 7,456 865,137 Income before contributions and transfers 1,004,744 854,819 2,330,730 1,701,125 324,857 294,390 3,660,331
Capital Contributions - tap fees 729,717 559,939 4,825,855 4,427,542 5,555,572 Transfers inTransfers out (568,214) (353,035) (637,700) (418,535) (326,120) (185,770) (1,532,034) Changes in net assets 1,166,247 1,061,723 6,518,885 5,710,132 (1,263) 108,620 7,683,869
Total net assets - beginning 21,419,437 20,357,714 52,421,031 46,710,899 331,788 223,168 74,172,256
Total net assets - ending 22,585,684$ 21,419,437$ 58,939,916$ 52,421,031$ 330,525$ 331,788$ 81,856,125$
The notes to the financial statements are an integral part of this statement.33

Exhibit # 8City of Post Falls
Statement of Cash FlowsProprietary Funds
For the Year Ended September 30, 2007
Business-type Activities - Enterprise Funds
Water Water Sewer Sewer Sanitation Sanitation TotalsCurrent Year Prior Year Current Year Prior Year Current Year Prior Year Current Year
Cash Flows from Operating ActivitiesReceipts from customers 2,126,183$ 2,468,004$ 4,136,590$ 4,038,541$ 1,570,088$ 1,471,791$ 7,832,861$ Payments to suppliers (367,601) (348,827) (1,130,069) (961,141) (1,269,890) (1,204,229) (2,767,560) Payments to employees (393,128) (375,603) (615,529) (591,592) (1,008,657)
Net cash provided byoperating activities 1,365,454 1,743,574 2,390,992 2,485,808 300,198 267,562 4,056,644
Cash Flows from Non-capital FinancingActivitiesTransfer from other funds Operating subsidies and tranfers to other
funds (568,214) (353,035) (637,700) (418,535) (326,120) (185,770) (1,532,034) Advances from other funds (683,549) (97,705) (2,002,286) (610,953) (2,685,835) Subsidy from federal grant 4,400 32,921 4,400
Net cash (used) by non-capital financing activities (1,247,363) (417,819) (2,639,986) (1,029,488) (326,120) (185,770) (4,213,469)
Cash Flows from Capital and RelatedFinancing ActivitiesProceeds from capital debt System development fees 729,717 559,939 4,825,855 4,427,542 5,555,572 Proceeds from sale of capital assets 1,800 1,800 Principal payments on capital debt (120,603) (116,205) (652,612) (640,594) (773,215) Interest payments on capital debt (123,832) (125,829) (244,354) (266,447) (368,186) Purchase of capital assets (648,538) (628,960) (5,047,886) (2,339,182) (5,696,424)
Net cash provided (used) by capitaland related financing activities (163,256) (311,055) (1,117,197) 1,181,319 (1,280,453)
Cash Flows from Investing ActivitiesInterest received on investments 352,170 239,568 855,314 607,322 10,899 7,456 1,218,383
Net cash provided by investingactivities 352,170 239,568 855,314 607,322 10,899 7,456 1,218,383
Net increase (decrease) in cash and cashequivalents 307,005 1,254,268 (510,877) 3,244,961 (15,023) 89,248 (218,895)
Cash and cash equivalents, beginning 7,245,117 5,990,849 18,868,714 15,623,753 261,832 172,584 26,375,663
Cash and cash equivalents, ending 7,552,122$ 7,245,117$ 18,357,837$ 18,868,714$ 246,809$ 261,832$ 26,156,768$
Reconciliation of Operating Income to Net CashProvided by Operating Activities:Operating income 769,800$ 735,308$ 1,711,436$ 1,352,454$ 313,958$ 286,934$ 2,795,194$ Adjustments to reconcile operating income
to net cash provided by operatingactivities:Depreciation 516,227 501,359 899,549 871,988 1,415,776 Asset trade-in
Changes in assets and liabilities:Accounts receivable 49,402 477,108 (40,838) 81,908 (25,856) (17,280) (17,292) Accounts payable 43,651 29,612 (193,920) 179,899 12,096 (2,092) (138,173) Accrued payroll 5,089 3,753 14,765 (441) 19,854 Customer deposits (18,715) (3,567) (18,715)
Total adjustments 1,365,454$ 1,743,573$ 2,390,992$ 2,485,808$ 300,198$ 267,562$ 4,056,644$
The notes to the financial statements are an integral part of this statement.34

35

36

37

38

39
40

41

42

43

44

45

46

47

48

49

50

51

52

53

54

55

56

57

58

REQUIRED SUPPLEMENTARY INFORMATION Required supplementary information includes financial information and disclosures that are required by the GASB but are not considered a part of the basic financial statements. The following schedule is a budgetary comparison schedule for the General Fund. Notes to the Required Supplementary Information Budgetary Information – Budgets are adopted at a legal appropriation level while on a GAAP budgetary basis.

Schedule of Revenues, Expenditures and Changes in Fund Balances
Budget and Actual
Major Governmental Funds (required supplementary information)
General Fund

Exhibit A-1City of Post Falls
General FundSchedule of Revenues, Expenditures, and
Changes in Fund Balances-Budget and ActualFor the Year Ended September 30, 2007
Variance withFinal Budget-
Budget Amounts Actual PositiveOriginal Final Amounts (Negative)
RevenuesGeneral taxes 7,516,601$ 7,516,601$ 7,544,333$ 27,732$ Intergovernmental revenue 2,574,176 2,727,082 3,433,920 706,838 Charges for services 2,359,828 2,387,568 2,278,365 (109,203) Other revenue 291,242 314,699 444,712 130,013 Interest 234,500 239,500 491,495 251,995
Total revenues 12,976,347 13,185,450 14,192,825 1,007,375
ExpendituresCurrent:
General government 6,276,492 5,946,671 5,297,590 649,081 Public safety 3,633,855 3,767,772 3,707,603 60,169 Highways and public works 1,586,893 1,678,732 1,580,557 98,175 Culture and recreation 1,377,830 1,406,528 1,458,543 (52,015)
Capital outlay 640,957 733,513 496,260 237,253 Debt service
Principal 400,775 400,775 400,772 3 Interest 257,579 257,579 233,814 23,765
Total expenditures 14,174,381 14,191,570 13,175,139 1,016,431
Excess (deficiency) of revenues over(under) expenditures (1,198,034) (1,006,120) 1,017,686 2,023,806
Other Financing Sources (Uses)
Proceeds of capital financing 41,138 41,138 Transfers in 1,148,033 1,118,033 1,118,033 Transfers (out) (375,000) (3,683,420) (3,683,420)
Total other financing sources (uses) 773,033 (2,565,387) (2,524,249) 41,138
Excess (deficiency) of revenues and other sources over (under)expenditures and other (uses) (425,001) (3,571,507) (1,506,563) 2,064,944
Fund balances - beginning 6,930,311 6,930,311 6,930,311
Fund balances - ending 6,505,310$ 3,358,804$ 5,423,748$ 2,064,944$
59

Exhibit B-1
City of Post FallsCombining Balance Sheet
Nonmajor Government FundsSeptember 30, 2007
Special Revenue Funds Debt Service Funds
Cemetery HUD Falls Total OtherPerpetual Loan Park Special Street 911 Drug LID Governmental
Care Fund Signs Events Lights Support Seizure LID 99-1 LID 96-1 LID 91-1 CLID #2 LID 89-1 Guarantee FundsAssetsCash 80,218$ 1,262$ 1,540$ 76,837$ 158,747$ 104,811$ 6,103$ 143,535$ 43,472$ 112$ 122$ 66,158$ 682,917$ Accounts receivable: Loans receivable 8,975 8,975 Miscellaneous 71,575 14,215 1,259$ 275 348 87,672 Customers 300 30,444 30,744 Other governments 59,529 59,529 Assessments - delinquent 11,668 1,142 256 287 13,353 - deferred 87,972 40,388 395 222 128,977 Interfund receivables Accrued interest Total assets 80,518$ 10,237$ 1,540$ 76,837$ 189,191$ 164,340$ 6,103$ 303,082$ 109,743$ 2,796$ 643$ 979$ 66,158$ 1,012,167$
Liabilities and Fund balancesLiabilities: Accounts payable 540$ 21,817$ 117,564$ 139,921$ Interfund payable 578,329 71,575$ 3,011$ 652,915 Deferred revenue 8,975$ 87,972 52,056$ 1,537 256$ 509$ 151,305 Total liabilities 8,975 540 21,817 695,893 159,547 52,056 4,548 256 509 944,141
Fund balances: Undesignated 80,518$ 1,262 1,540$ 76,297 167,374 (531,553) 6,103$ 143,535 57,687 (1,752) 387 470 66,158$ 68,026 Total fund balances 80,518 1,262 1,540 76,297 167,374 (531,553) 6,103 143,535 57,687 (1,752) 387 470 66,158 68,026
Total liabilities and fund balances 80,518$ 10,237$ 1,540$ 76,837$ 189,191$ 164,340$ 6,103$ 303,082$ 109,743$ 2,796$ 643$ 979$ 66,158$ 1,012,167$
60

Exhibit B-2
City of Post FallsCombining Statement of Revenues, Expenditures and
Changes in Fund BalancesNonmajor Government Funds
For the fiscal year ended September 30, 2007
Special Revenue Funds Debt Service Funds
Cemetery HUD Falls Total OtherPerpetual Loan Park Special Street 911 Drug LID Governmental
Care Fund Signs Events Lights Support Seizure LID 99-1 LID 96-1 LID 91-1 CLID #2 LID 89-1 Guarantee FundsRevenues: Taxes Charges-services/program remittances 26,083$ 279,013$ 65,000$ 370,096$ Other revenue 37,032$ 1,680 4,870 237,916 281,498 Principal 6,207$ 4,970$ 28,318$ 1,469$ 287$ 41,251 Interest 2,612 4,301 64$ 3,145 6,284 5,733 336$ 11,756 8,406 311 452$ 121 2,618$ 46,139 Total revenues 39,644 10,508 64 30,908 290,167 308,649 336 16,726 36,724 1,780 452 408 2,618 738,984
Expenditures: Current: General government 2,250 1,250 200 3,700 Public safety 112,327 2,643 114,970 Highways and public works 261,250 261,250 Culture and recreation 23,054 23,054 Capital outlay 170,393 170,393 Debt service: Principal 15,000 40,000 20,000 75,000 Interest 26,338 10,620 6,755 1,590 45,303 Total expenditures 23,054 261,250 309,058 2,643 27,870 48,005 21,790 693,670
Excess (deficiency) of revenues over expenditures 39,644 10,508 64 7,854 28,917 (409) (2,307) (11,144) (11,281) (20,010) 452 408 2,618 45,314
Other financing sources (uses): Transfers in 19,440 21,525 40,965 Transfers out (68,000) (11,000) (19,000) (2,525) (19,440) (119,965) Total other financing sources (uses) (68,000) (11,000) 19,440 (19,000) (2,525) 2,085 (79,000)
Excess (deficiency) of revenues and other financing sources over expenditures and other financing uses 39,644 (57,492) 64 7,854 17,917 (409) (2,307) (11,144) (11,281) (570) (18,548) (2,117) 4,703 (33,686)
Fund balances, beginning 40,874 58,754 1,476 68,443 149,457 (531,144) 8,410 154,679 68,968 (1,182) 18,935 2,587 61,455 101,712
Fund balances, ending 80,518$ 1,262$ 1,540$ 76,297$ 167,374$ (531,553)$ 6,103$ 143,535$ 57,687$ (1,752)$ 387$ 470$ 66,158$ 68,026$
61

Schedule of Revenues, Expenditures and Changes in Fund Balances
Budget and Actual
Major Governmental Funds
LID 2004-1 - accounts for the accumulation of resources and payment of special assessment bond principal and interest from special assessment levies. CAPITAL FUND - accounts for money restricted for capital improvements to be made to streets, parks, public safety, and general government.

Exhibit C-1City of Post Falls
Debt Service FundLID 2004-1
Schedule of Revenues, Expenditures, andChanges in Fund Balances-Budget and Actual
For the Year Ended September 30, 2007
Variance withFinal Budget-
Budget Amounts Actual PositiveOriginal Final Amounts (Negative)
RevenuesPrincipal 120,000$ 120,000$ 164,666$ 44,666$ Interest 135,000 135,000 152,296 17,296
Total revenues 255,000 255,000 316,962 61,962
ExpendituresCurrent:
General government 21,850 21,850 21,850 Capital outlay Debt Service
Principal 45,000 45,000 45,000 Interest 101,756 101,756 101,756
Total expenditures 168,606 168,606 168,606
Excess (deficiency) of revenues overexpenditures 86,394 86,394 148,356 61,962
Other Financing Sources (Uses)
Excess (deficiency) of revenues and other sources over (under)expenditures and other (uses) 86,394 86,394 148,356 61,962
Fund balances - beginning 218,873 218,873 218,873
Fund balances - ending 305,267$ 305,267$ 367,229$ 61,962$
62

Exhibit C-2City of Post Falls
Capital FundSchedule of Revenues, Expenditures, and
Changes in Fund Balances-Budget and ActualFor the Year Ended September 30, 2007
Variance withFinal Budget-
Budget Amounts Actual PositiveOriginal Final Amounts (Negative)
RevenuesIntergovernmental revenue 927,000$ 656,709$ (270,291)$ Charges for services 1,257,000$ 1,257,000 1,705,663 448,663 Other revenue 510,591 191,575 (319,016) Interest 55,000 55,000 317,336 262,336
Total revenues 1,312,000 2,749,591 2,871,283 121,692
ExpendituresCurrent:
General government 1,515,700 2,030,700 58,465 1,972,235 Capital outlay 7,362,500 11,613,877 4,232,784 7,381,093 Debt Service
Principal 195,000 70,000 68,883 1,117 Interest 283,800 33,800 53,196 (19,396)
Total expenditures 9,357,000 13,748,377 4,413,328 9,335,049
Excess (deficiency) of revenues overexpenditures (8,045,000) (10,998,786) (1,542,045) 9,456,741
Other Financing Sources (Uses)
Proceeds of capital financing 4,367,000 Transfers in 375,000 4,251,420 4,251,420 Transfers (out) (75,000) (75,000) (75,000)
sources (uses) 4,667,000 4,176,420 4,176,420
Excess (deficiency) of revenues and other sources over (under)expenditures and other (uses) (3,378,000) (6,822,366) 2,634,375 9,456,741
Fund balances - beginning 5,433,805 5,433,805 5,433,805
Fund balances - ending 2,055,805$ (1,388,561)$ 8,068,180$ 9,456,741$
63

Schedule of Revenues, Expenditures and
Changes in Fund Balances Budget and Actual
Nonmajor Governmental Funds
Special Revenue Funds
Special revenue funds are used to account for specific revenues that are legally restricted to expenditure for particular purposes.
Cemetery Perpetual Care - accounts for revenue received from cemetery lot sales used to maintain and expand cemetery capital expenditures. HUD Loan Fund - accounts for loans made to low-income citizens requiring assistance in connecting to the City sewer systems along with other community enhancement projects. Falls Park Signs - accounts for revenues and expenditures on special Falls Park projects funded by donations. Special Events - accounts for tourism and community-oriented events that are self-supporting. Street Lights - accounts for the component of City utilities that were billed out monthly to pay for the cost of lighting the City’s streets. 911 Support - accounts for the capital investment in the City’s 911 Center with money collected by the County from each resident’s phone bill. Drug Seizure – accounts for monies acquired during drug seizure activities.
Debt Service Funds
The debt service funds are used to account for the accumulation of resources and payment of special assessment bond principal and interest from special assessment levies. LID 99-1 - accounts for the accumulation of resources and payment of special assessment bond principal and interest from special assessment levies. LID 96-1 - accounts for the accumulation of resources and payment of special assessment bond principal and interest from special assessment levies. LID 91-1 - accounts for the accumulation of resources and payment of special assessment bond principal and interest from special assessment levies. CLID #2 - accounts for the accumulation of resources and payment of special assessment bond principal and interest from special assessment levies. LID 89-1 – accounts for the accumulation of resources and payment of special assessment bond principal and interest from special assessment levies. LID Guarantee – accounts for additional security for the LID bonds. This fund is established by ordinance.

Exhibit C-3City of Post Falls
Cemetery Perpetual Care Special Revenue FundSchedule of Revenues, Expenditures and
Changes in Fund Balances-Budget and ActualFor the fiscal years ended September 30, 2007
2007Variance withFinal Budget-
Original/Final PositiveBudget Actual (Negative)
Revenues: Other revenue 15,000$ 37,032$ 22,032$ Interest 2,612 2,612 Total revenues 15,000 39,644 24,644
Expenditures:
Excess (deficiency) of revenues over expenditures 15,000 39,644 24,644
Other financing (uses): Total other financing (uses)
Excess (deficiency) of revenues over expenditures and other financing (uses) 15,000 39,644 24,644
Fund balances, beginning 40,874 40,874
Fund balances, ending 55,874$ 80,518$ 24,644$
64

Exhibit C-4City of Post Falls
HUD Loan Special Revenue FundSchedule of Revenues, Expenditures and
Changes in Fund Balances-Budget and ActualFor the fiscal years ended September 30, 2007
2007Variance withFinal Budget-
Original/Final PositiveBudget Actual (Negative)
Revenues: Principal 6,207$ 6,207$ Interest 4,301 4,301 Total revenues 10,508 10,508
Expenditures:
Excess (deficiency) of revenues over (under) expenditures 10,508 10,508
Other financing sources (uses): Operating transfers out (68,000) (68,000) Total other financing sources (uses) (68,000) (68,000)
Excess (deficiency) of revenues and other financing sources over expenditures and other financing (uses) (68,000) (57,492) 10,508
Fund balances, beginning 58,754 58,754
Fund balances, ending (9,246)$ 1,262$ 10,508$
65

Exhibit C-5City of Post Falls
Falls Park Signs Special Revenue FundSchedule of Revenues, Expenditures and
Changes in Fund Balances-Budget and ActualFor the fiscal years ended September 30, 2007
2007Variance withFinal Budget-
Original/Final PositiveBudget Actual (Negative)
Revenues: Interest 64$ 64$ Total revenues 64 64
Expenditures:
Excess (deficiency) of revenues over expenditures 64 64
Other financing (uses):
Excess (deficiency) of revenues and other financing sources over expenditures and other financing (uses) 64 64
Fund balances, beginning 1,476$ 1,476
Fund balances, ending 1,476$ 1,540$ 64$
66

Exhibit C-6City of Post Falls
Special Events Special Revenue FundSchedule of Revenues, Expenditures and
Changes in Fund Balances-Budget and ActualFor the fiscal years ended September 30, 2007
2007Variance withFinal Budget-
Original/Final PositiveBudget Actual (Negative)
Revenues: Charges-services/programs 38,709$ 26,083$ (12,626)$ Other revenue 2,878 1,680 (1,198) Interest 3,145 3,145 Total revenues 41,587 30,908 (10,679)
Expenditures: Culture and recreation 42,712 23,054 19,658 Total expenditures 42,712 23,054 19,658
Excess (deficiency) of revenues over (under) expenditures (1,125) 7,854 8,979
Other financing (uses):
Excess (deficiency) of revenues and other financing sources over (under) expenditures and other financing (uses) (1,125) 7,854 8,979
Fund balances, beginning 68,443 68,443
Fund balances, ending 67,318$ 76,297$ 8,979$
67

Exhibit C-7City of Post Falls
Street Lights Special Revenue FundSchedule of Revenues, Expenditures and
Changes in Fund Balances-Budget and ActualFor the fiscal years ended September 30, 2007
2007Variance withFinal Budget-
Original/Final PositiveBudget Actual (Negative)
Revenues: Charges-services/programs 261,000$ 279,013$ 18,013$ Other revenue 4,870 4,870 Interest 500 6,284 5,784 Total revenues 261,500 290,167 28,667
Expenditures: Highways and public works 250,500 261,250 (10,750) Total expenditures 250,500 261,250 (10,750)
Excess (deficiency) of revenues over expenditures 11,000 28,917 17,917
Other financing sources (uses): Operating transfers out (11,000) (11,000) Total other financing sources (uses) (11,000) (11,000)
Excess (deficiency) of revenues and other financing sources over (under) expenditures and other financing (uses) 17,917 17,917
Fund balances, beginning 149,457 149,457
Fund balances, ending 149,457$ 167,374$ 17,917$
68
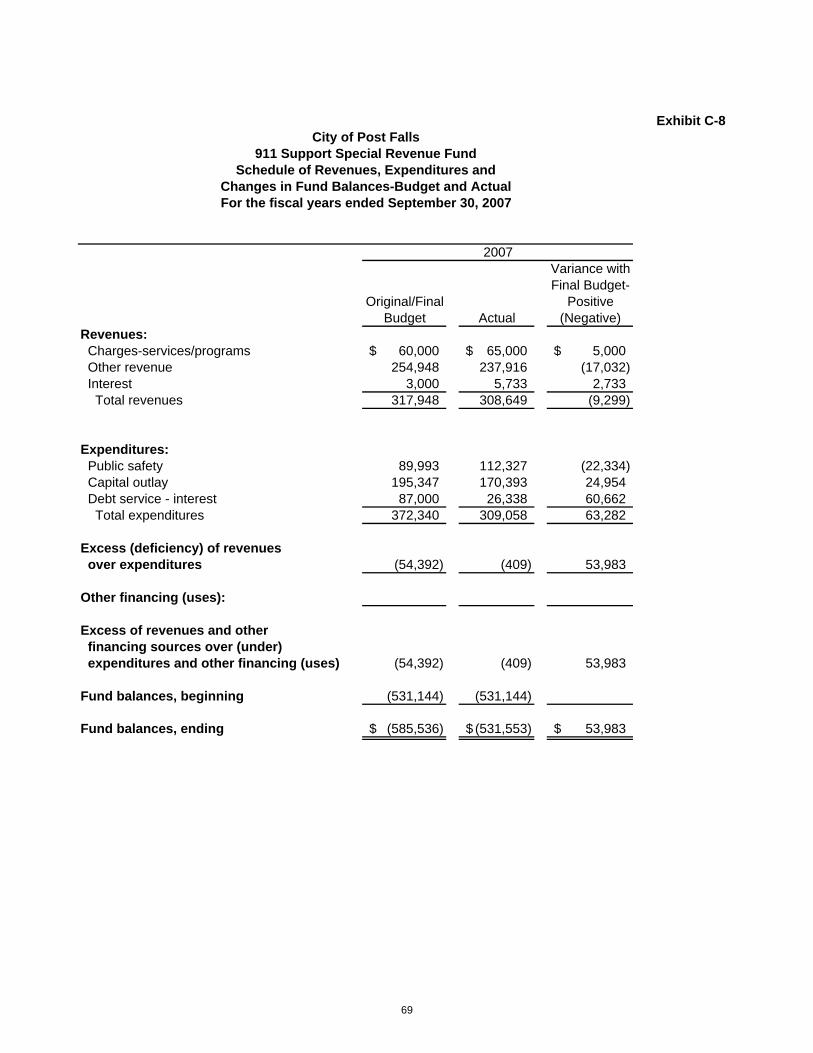
Exhibit C-8City of Post Falls
911 Support Special Revenue FundSchedule of Revenues, Expenditures and
Changes in Fund Balances-Budget and ActualFor the fiscal years ended September 30, 2007
2007Variance withFinal Budget-
Original/Final PositiveBudget Actual (Negative)
Revenues: Charges-services/programs 60,000$ 65,000$ 5,000$ Other revenue 254,948 237,916 (17,032) Interest 3,000 5,733 2,733 Total revenues 317,948 308,649 (9,299)
Expenditures: Public safety 89,993 112,327 (22,334) Capital outlay 195,347 170,393 24,954 Debt service - interest 87,000 26,338 60,662 Total expenditures 372,340 309,058 63,282
Excess (deficiency) of revenues over expenditures (54,392) (409) 53,983
Other financing (uses):
Excess of revenues and other financing sources over (under) expenditures and other financing (uses) (54,392) (409) 53,983
Fund balances, beginning (531,144) (531,144)
Fund balances, ending (585,536)$ (531,553)$ 53,983$
69

Exhibit C-9City of Post Falls
Drug Seizure Special Revenue FundSchedule of Revenues, Expenditures and
Changes in Fund Balances-Budget and ActualFor the fiscal years ended September 30, 2007
2007Variance withFinal Budget-
Original/Final PositiveBudget Actual (Negative)
Revenues: Interest 336$ 336$ Total revenues 336 336
Expenditures: Public safety 8,942$ 2,643 6,299 Total expenditures 8,942 2,643 6,299
Excess (deficiency) of revenues over expenditures (8,942) (2,307) 6,635
Other financing sources (uses):
Excess (deficiency) of revenues and other financing sources over (under) expenditures and other financing (uses) (8,942) (2,307) 6,635
Fund balances, beginning 8,410 8,410
Fund balances, ending (532)$ 6,103$ 6,635$
70

Exhibit C-10
City of Post FallsLID 99-1 Debt Service Fund
Schedule of Revenues, Expenditures andChanges in Fund Balances-Budget and ActualFor the fiscal years ended September 30, 2007
2007Variance withFinal Budget-
Original/Final PositiveBudget Actual (Negative)
Revenues: Principal 4,900$ 4,970$ 70$ Interest 5,500 11,756 6,256 Total revenues 10,400 16,726 6,326
Expenditures: General governmental 2,250 2,250 Debt service - principal 15,000 15,000 - interest 10,620 10,620 Total expenditures 27,870 27,870
Excess (deficiency) of revenues over expenditures (17,470) (11,144) 6,326
Other financing sources:
Excess (deficiency) of revenues and other financing sources over expenditures and other financing (uses) (17,470) (11,144) 6,326
Fund balances, beginning 154,679 154,679
Fund balances, ending 137,209$ 143,535$ 6,326$
71

Exhibit C-11
City of Post FallsLID 96-1 Debt Service Fund
Schedule of Revenues, Expenditures andChanges in Fund Balances-Budget and ActualFor the fiscal years ended September 30, 2007
2007Variance withFinal Budget-
Original/Final PositiveBudget Actual (Negative)
Revenues: Principal 33,000$ 28,318$ (4,682)$ Interest 5,000 8,406 3,406 Total revenues 38,000 36,724 (1,276)
Expenditures: General governmental 1,250 1,250 Debt service - principal 40,000 40,000 - interest 6,775 6,755 20 Total expenditures 48,025 48,005 20
Excess (deficiency) of revenues over expenditures (10,025) (11,281) (1,256)
Fund balances, beginning 68,968 68,968
Fund balances, ending 58,943$ 57,687$ (1,256)$
72
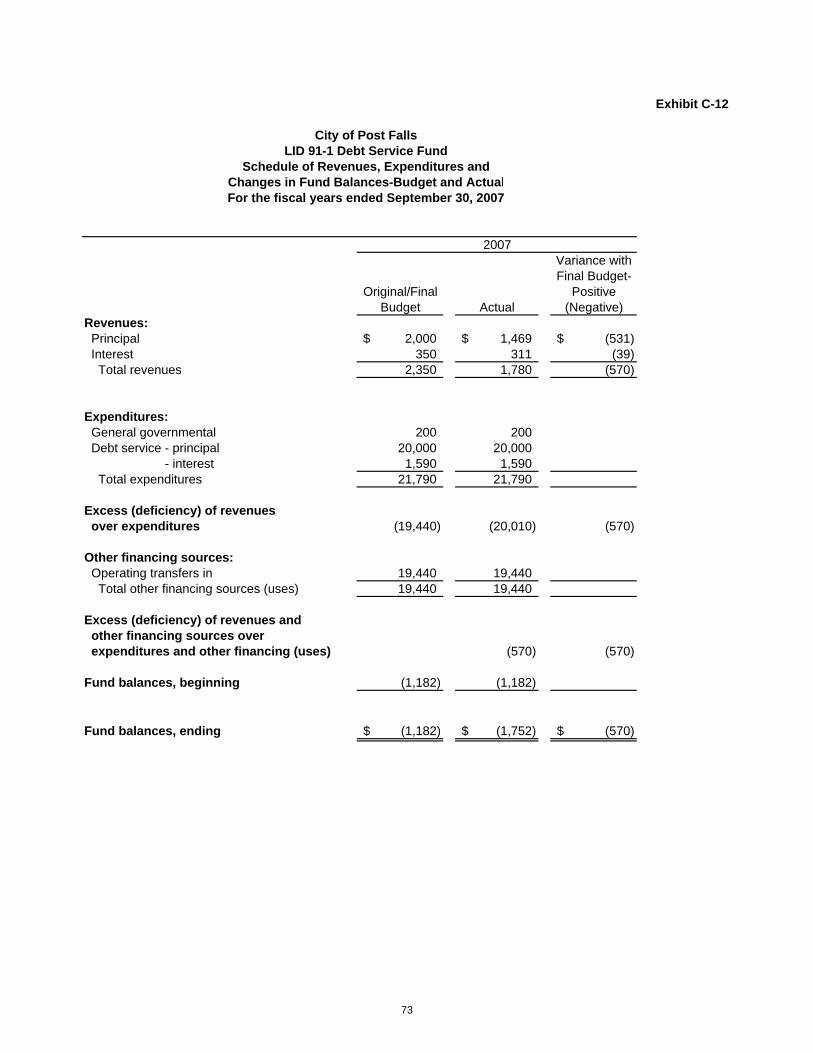
Exhibit C-12
City of Post FallsLID 91-1 Debt Service Fund
Schedule of Revenues, Expenditures andChanges in Fund Balances-Budget and ActualFor the fiscal years ended September 30, 2007
2007Variance withFinal Budget-
Original/Final PositiveBudget Actual (Negative)
Revenues: Principal 2,000$ 1,469$ (531)$ Interest 350 311 (39) Total revenues 2,350 1,780 (570)
Expenditures: General governmental 200 200 Debt service - principal 20,000 20,000 - interest 1,590 1,590 Total expenditures 21,790 21,790
Excess (deficiency) of revenues over expenditures (19,440) (20,010) (570)
Other financing sources: Operating transfers in 19,440 19,440 Total other financing sources (uses) 19,440 19,440
Excess (deficiency) of revenues and other financing sources over expenditures and other financing (uses) (570) (570)
Fund balances, beginning (1,182) (1,182)
Fund balances, ending (1,182)$ (1,752)$ (570)$
73

Exhibit C-13
City of Post FallsCLID # 2 Debt Service Fund
Schedule of Revenues, Expenditures andChanges in Fund Balances-Budget and ActualFor the fiscal years ended September 30, 2007
2007Variance withFinal Budget-
Original/Final PositiveBudget Actual (Negative)
Revenues: Interest 452$ 452$ Total revenues 452 452
Expenditures:
Excess (deficiency) of revenues over expenditures 452 452
Other financing sources: Operating transfers out (19,000)$ (19,000) Total other financing sources (uses) (19,000) (19,000)
Excess (deficiency) of revenues and other financing sources over expenditures and other financing (uses) (19,000) (18,548) 452
Fund balances, beginning 18,935 18,935
Fund balances, ending (65)$ 387$ 452$
74

Exhibit C-14
City of Post FallsLID 89-1 Debt Service Fund
Schedule of Revenues, Expenditures andChanges in Fund Balances-Budget and ActualFor the fiscal years ended September 30, 2007
2007Variance withFinal Budget-
Original/Final PositiveBudget Actual (Negative)
Revenues: Principal 250$ 287$ 37$ Interest 75 121 46 Total revenues 325 408 83
Expenditures:
Excess (deficiency) of revenues over expenditures 325 408 83
Other financing sources: Operating transfers out (2,525) (2,525) Total other financing sources (uses) (2,525) (2,525)
Excess (deficiency) of revenues and other financing sources over expenditures and other financing (uses) (2,200) (2,117) 83
Fund balances, beginning 2,587 2,587
Fund balances, ending 387$ 470$ 83$
75

Exhibit C-15
City of Post FallsLID Guarantee Debt Service Fund
Schedule of Revenues, Expenditures andChanges in Fund Balances-Budget and ActualFor the fiscal years ended September 30, 2007
2007Variance withFinal Budget-
Original/Final PositiveBudget Actual (Negative)
Revenues: Taxes Interest 1,500$ 2,618$ 1,118$ Total revenues 1,500 2,618 1,118
Expenditures: General governmental 3,585 3,585 Total expenditures 3,585 3,585
Excess (deficiency) of revenues over expenditures (2,085) 2,618 4,703
Other financing sources: Operating transfers in 21,525 21,525 Operating transfers out (19,440) (19,440) Total other financing sources (uses) 2,085 2,085
Excess (deficiency) of revenues and 4,703 4,703 other financing sources over expenditures and other financing (uses)
Fund balances, beginning 61,455 61,455
Fund balances, ending 61,455$ 66,158$ 4,703$
76

ABOVE: A visit to the mercantile to shop in the early days of Post Falls

STATISTICAL SECTION This part of the City of Post Falls, Idaho’s Comprehensive Annual Financial Report presents detailed information as a context for understanding what the information in the financial statements, note disclosures and required supplementary information says about the City’s overall financial health. Contents Page(s) Financial Trends 76-81 These schedules contain trend information to help the reader understand how the City’s financial performance and well-being have changed over time Revenue Capacity 82-86 These schedules contain information to help the reader assess the City’s most significant local revenue sources, the property tax and the room tax. Debt Capacity 87-93 These schedules present information to help the reader assess the affordability of the government’s current levels of outstanding debt and the government’s ability to issue additional debt in the future. Economic and Demographic Information 94-96 These schedules offer economic and demographic indicators to help the reader understand the environment within which the City’s financial activities take place. Operating Information 97-101 These schedules contain service and infrastructure data to help the reader understand how the information in the City’s financial report relates to the services the City provides and the activities it performs. Sources: Unless otherwise noted, the information in these schedules is derived from the Comprehensive Annual Financial Reports for the relevant year. The City implemented GASB Statement 34 in 2003 schedules presenting government-wide information include information beginning that year.

Table #1
2003 2004 2005 2006 2007Primary governmentGovernmental activities: Invested in capital assets net of related debt 9,017,852$ 13,097,421$ 12,856,812$ 21,984,148$ 36,228,609$ Restricted 833,042 734,213 872,546 6,539,791 9,482,313 Unrestricted 4,806,132 7,306,691 10,358,219 8,642,267 6,031,023 Total Governmental activities net assets 14,657,026 21,138,325 24,087,577 37,166,206 51,741,945
Business-type activities: Invested in capital assets net of related debt 36,623,300 40,559,918 44,487,590 46,839,184 51,893,047 Restricted 3,075,936 3,475,869 4,699,749 5,903,678 7,657,572 Unrestricted 11,138,123 14,994,784 18,104,442 21,429,394 22,305,506 Total business-type activities net assets 50,837,359 59,030,571 67,291,781 74,172,256 81,856,125
Total primary government net assets 65,494,385$ 80,168,896$ 91,379,358$ 111,338,462$ 133,598,070$
Note: Accrual-basis financial information for the City as a whole is available back to 2003 only, the year GASB Statement 34 was implemented.
Fiscal Year
City of Post FallsNet Assets By Components
Last Five Fiscal Years(Accrual-Basis of Accounting)
77

TABLE #10City of Post Falls
Property Tax Levies And CollectionsLast Ten Years
Delinquent Total % of Total Outstanding % ofFiscal Total Fiscal Year Tax % of Levy Tax Tax Collection Delinquent DelinquentYear Tax Levy Collections Collected Collections Collections To Levy Adjustments Taxes To Levy
1998 $2,713,597 $2,629,635 96.91% $78,489 $2,708,124 99.80% ($5,685) ($212) -0.01%
1999 $3,211,944 $3,053,838 95.08% $150,489 $3,204,327 99.76% ($8,292) ($215) -0.01%
2000 $3,368,327 $3,183,069 94.50% $175,072 $3,358,141 99.70% ($5,980) $4,206 0.13%
2001 $3,631,687 $3,504,567 96.50% $118,255 $3,622,822 99.76% ($7,464) $1,401 0.04%
2002 $3,896,692 $3,646,882 93.59% $211,788 $3,858,670 99.02% ($20,231) $17,790 0.46%
2003 $4,430,009 $4,148,223 93.64% $250,676 $4,398,899 99.30% ($18,259) $18,905 0.43%
2004 $4,835,070 $4,501,529 93.10% $303,444 $4,804,973 99.38% ($25,813) $4,284 0.09%
2005 $5,288,311 $5,173,550 97.83% $98,106 $5,271,656 99.69% ($10,673) $6,482 0.12%
2006 $6,039,753 $5,862,690 97.07% $71,858 $5,934,548 98.26% ($24,718) $47,274 0.78%
2007 $7,134,404 $6,973,680 97.75% $181,008 $7,154,688 100.28% $20,284 $181,134 2.54%
Source: Kootenai County Auditor78

Table # 11
City of Post FallsRatio of Outstanding Debt by Type
Last Ten Fiscal Years
General Special Total PercentageFiscal Obligation Assessment Capital Water Sewer Primary of Personal PerYear Bonds Bonds Leases Bonds Bonds Government Income1 Capita1
1997-98 2,000,000 1,395,308 65,798 449,310 6,374,633 10,285,049 3.18% 686
1998-99 1,910,000 1,153,042 269,870 335,590 5,650,281 9,318,783 2.88% 559
1999-00 1,815,000 990,001 177,653 220,500 4,926,739 8,129,893 2.52% 465
2000-01 1,715,000 835,001 194,399 115,090 4,200,237 7,059,727 2.18% 392
2001-02 1,605,000 665,001 4,368,900 N/A 3,476,960 10,115,861 3.13% 553
2002-03 1,490,000 485,001 4,177,590 N/A 2,389,003 8,541,594 2.64% 438
2003-04 1,370,000 595,087 4,165,460 N/A 1,745,915 7,876,462 2.44% 374
2004-05 1,245,000 3,845,001 4,852,672 3,384,234 7,201,154 20,528,061 6.35% 895
2005-06 1,115,000 2,555,001 4,687,182 3,268,028 6,560,560 18,185,771 5.63% 758
2006-07 980,000$ 2,435,001$ 4,393,665$ 3,147,425$ 5,907,948$ 16,864,039$ 5.22% 671$
Note: Details regarding the city's outstanding debt can be found in the notes to the financial statements.1See the Schedule of Demographic and Economics Statistics for personal income and population data.
Governmental Activities Business-Type Activities
Source: City of Post Falls79

Table # 12
City of Post FallsRatio of General Bonded Debt Outstanding
Last Ten Fiscal Years
Ratio of Net NetGeneral Long-Term Long-Term
Fiscal Assessed Obligation Debt to DebtYear Population Value Bonds Assessed Value Per Capita
1997-98 15,000 695,182,787 2,000,000 0.29% 133
1998-99 16,684 742,251,793 1,910,000 0.26% 114
1999-00 17,500 791,143,568 1,815,000 0.23% 104
2000-01 18,000 841,776,651 1,715,000 0.20% 95
2001-02 18,281 892,717,766 1,605,000 0.18% 88
2002-03 19,500 1,007,449,488 1,490,000 0.15% 76
2003-04 21,082 1,074,115,199 1,370,000 0.13% 65
2004-05 22,926 1,258,237,363 1,245,000 0.10% 54
2005-06 23,992 1,459,655,088 1,115,000 0.08% 46
2006-07 25,137 1,701,069,379$ 980,000$ 0.06% 39
Note: Details regarding the city's outstanding debt can be found in the notes to the financial statements.No funds are available in the Debt Service Fund to apply to General Obligation Bonds.
Source: City of Post Falls80

Table # 13
City of Post FallsDirect and Overlapping Governmental Activities Debt
September 30, 2007
Government's PercentageBond Net Market Applicable City Share
Governmental Unit Debt Value to City of Debt
City of Post Falls 15,990,374$ 1,277,868,951$ 100.0% 15,990,374$
Kootenai County 14,535,537,541
School District #273 23,605,000 2,522,770,710 50.7% 11,956,733
Post Falls Highway District 4,085,801,220 31.3%
Kootenai County Fire & Rescue 700,000 3,790,062,111 33.7% 236,014
Subtotal of overlapping debt 12,192,747$
Total direct and overlapping debt 28,183,121$
The percentage of overlapping debt applicable is estimated using taxable assessed property values. Applicablepercentages were estimated by determining the portion of the county's taxable assessed value that is within thecity's boundaries and dividing it by the county's total assessed value.
Source: Kootenai County Auditor81

Table #14
1998 1999 2000 2001 2002 2003 2004 2005 2006 2007
Debt Limit 13,903,656$ 15,351,915$ 15,822,871$ 16,835,533$ 17,854,355$ 20,148,990$ 21,482,304$ 25,164,747$ 29,193,102$ 34,021,388$
Total net debt applicable to limit 2,000,000 1,910,000 1,815,000 1,715,000 1,605,000 1,490,000 1,370,000 1,245,000 1,115,000 980,000
Legal debt margin 11,903,656$ 13,441,915$ 14,007,871$ 15,120,533$ 16,249,355$ 18,658,990$ 20,112,304$ 23,919,747$ 28,078,102$ 33,041,388$
Total net debt applicable to the limit as a percentage of debt limit 14.38% 12.44% 11.47% 10.19% 8.99% 7.39% 6.38% 4.95% 3.82% 2.88%
Legal Debt Margin Calculation for Fiscal Year 2007
Assessed value 1,277,868,951$ Add back: exempt real property 423,200,428$ Total assessed value 1,701,069,379$
Debt limit* (2% of total assessed value) 34,021,388 Debt applicable to limit: General obligation bonds 980,000 Legal debt margin 33,041,388$
Debt margin percentage available 97%
*Idaho Code 50-1019 states that general obligation debt should not exceed 2 percent of total assessed property value. There is no amount set aside to offset the general obligation debt.
Fiscal Year
City of Post FallsLegal Debt Margin Information
Last Ten Fiscal Years
82

Table # 15
City of Post FallsPledged-Revenue Bond Coverage
Sewer FundLast Ten Fiscal Years
Net Revenue Debt Service Requirements (3)Fiscal Gross Operating Available ForYear Revenues (1) Expenses (2) Debt Service Principal Interest Total Coverage
1998 2,001,493 1,092,914 908,579 482,173 238,445 720,618 1.26
1999 2,118,666 987,608 1,131,058 441,602 222,749 664,351 1.70
2000 2,360,050 933,090 1,426,960 521,918 201,524 723,442 1.97
2001 2,497,060 980,559 1,516,501 547,450 173,888 721,338 2.10
2002 2,648,989 1,081,199 1,567,790 568,205 149,641 717,846 2.18
2003 2,846,914 1,080,030 1,766,884 594,193 125,479 719,672 2.46
2004 3,238,491 1,254,731 1,983,760 663,063 118,977 782,040 2.54
2005 3,712,915 1,370,164 2,342,751 614,260 215,408 829,668 2.82
2006 4,564,357 1,732,191 2,832,166 640,595 258,283 898,878 3.15
2007 5,034,435$ 1,566,444$ 3,467,991 652,611$ 236,943$ 889,554$ 3.90
(1) Total revenues (including interest) exclusive of cap fees.(2) Total operating expenses exclusive of depreciation.(3) Includes principal and interest of revenue bonds only.
Source: City of Post Falls83

Table # 16
City of Post FallsPledged-Revenue Bond Coverage
Water FundLast Ten Fiscal Years
Net Revenue Debt Service Requirements (3)Fiscal Gross Operating Available ForYear Revenues (1) Expenses (2) Debt Service Principal Interest Total Coverage
1998 1,116,870 513,020 603,850 70,000 38,927 108,927 5.54
1999 1,184,270 507,373 676,897 80,000 31,027 111,027 6.10
2000 1,288,343 518,940 769,403 290,000 15,197 305,197 2.52
2001 1,273,899 541,972 731,927 N/A
2002 1,385,385 580,706 804,679 N/A
2003 1,520,384 656,867 863,517 N/A
2004 1,824,450 694,669 1,129,781 9,548 9,548 118.33
2005 2,214,161 775,033 1,439,128 153,912 153,912 9.35
2006 2,267,165 757,796 1,509,369 116,205 153,191 269,396 5.60
2007 2,450,410$ 809,469$ 1,640,941$ 120,604$ 121,570$ 242,174$ 6.78
(1) Total revenues (including interest) exclusive of cap fees.(2) Total operating expenses exclusive of depreciation.(3) Includes principal and interest of revenue bonds only.
Source: City of Post Falls84

Pledged-Revenue Bond CoverageSpecial Assessment Bonds
SpecialAssessmentCollections Principal Interest Total
180,959 111,589 59,478 171,067 1.06
281,519 597,189 77,577 674,766 0.42 1
176,827 163,040 64,779 227,819 0.78
175,871 155,000 56,493 211,493 0.83
143,350 170,000 48,228 218,228 0.66
196,900 180,000 38,733 218,733 0.90
100,713 140,000 46,827 186,827 0.54
287,534 152,066 30,364 182,430 1.58
90,047 3,475,000 141,858 3,616,858 0.02 2
349,319$ 120,000$ 147,059$ 267,059$ 1.31
Note: Details regarding the government's outstanding debt can be found in the notes to the financial statements.
1 During 1999 an interim LID bond in the amount of $474,600 was paid on LID 96-12 During 2006 an interim LID bond in the amount of $3,400,000 was paid on LID 2004-1
2006
2007
Coverage
Table # 17
City of Post Falls
Last Ten Fiscal Years
2002
2003
2004
Debt ServiceFiscalYear
2005
1998
1999
2000
2001
Source: City of Post Falls
85

Table # 18
PersonalIncome Per Capita Public
(amounts expressed Personal School UnemploymentPopulation1 in thousands) Income2 Enrollment3 Rate4
15,000 323,205 21,547 3,385 8.30%
16,684 366,464 21,965 3,941 8.80%
17,500 385,280 22,016 4,148 7.40%
18,000 421,848 23,436 4,416 7.60%
18,281 438,433 23,983 4,602 8.20%
19,500 471,198 24,164 4,920 6.40%
21,082 510,058 24,194 5,020 5.50%
22,926 579,959 25,297 5,289 4.10%
23,992 647,064 26,970 5,334 3.80%
25,137 711,842 28,319 5,416 3.40%
Data Sources1 City of Post Falls' records2 Bureau of Economic Analysis3 School District4 Department of Labor
2006
2007
City of Post FallsDemographic and Economic Statistics
Last Ten Fiscal Years
2002
2003
2004
FiscalYear
2005
1998
1999
2000
2001
86

Table # 19
City of Post FallsPrincipal EmployersSeptember 30, 2007
Type Of Percentatge of TotalEmployer Business Employees City Employment
Post Falls School District Education 637 6.13%
Wal-Mart Stores Retail department store/grocery 525 5.05%
Buck's Knives Manufacturer of knives 264 2.54%
The City Government 240 2.31%
Sysco Food Services Inc. Wholesale commercial equipment 200 1.92%
North Idaho Advanced Care Healthcare 180 1.73%
Flexcel Manufacturer of office furniture 130 1.25%
Century Publishing Co. Periodicals, catalogs, books 117 1.13%
Idaho Veneer Wood products 100 0.96%
Mor Manufacturing Circuits and circuit boards 93 0.89%Total 2,486 23.91%
Note: Ten year comparison information is not available for this table.
2007
Source: State Department of Commerce87

Table #2
2003 2004 2005 2006 2007ExpensesGovernmental activities: General government 3,446,537$ 3,908,589$ 4,296,656$ 4,880,704$ 5,701,979$ Public safety 2,887,150 3,171,924 3,409,806 3,593,961 4,065,252 Highways and public works 1,521,094 1,701,489 3,750,058 2,576,928 2,422,039 Cultural and recreation 983,357 1,172,659 1,233,832 1,350,230 1,594,522 Interest on long term debt 374,533 325,229 362,559 428,521 434,931 Total governmental activities expenses 9,212,671 10,279,890 13,052,911 12,830,344 14,218,723 Business-type activities: Water 914,653 995,763 1,290,046 1,412,346 1,447,266 Sewer 1,898,449 2,224,803 2,358,255 2,863,232 2,703,705 Sanitation 889,681 955,858 1,114,246 1,202,137 1,281,986 Total business-type activities expenses 3,702,783 4,176,424 4,762,547 5,477,715 5,432,957 Total primary government expenses 12,915,454$ 14,456,314$ 17,815,458$ 18,308,059$ 19,651,680$
Program RevenuesGovernmental activities:Charges for services: General government 2,081,301$ 2,591,268$ 2,753,370$ 2,141,369$ 1,763,765$ Public safety 365,513 397,946 446,423 567,520 755,149 Highways and public works 453,341 574,995 564,228 912,773 1,206,647 Cultural and recreation 601,734 730,743 789,159 1,245,372 1,214,653 Operating grants and contributions 305,083 210,574 248,978 258,756 560,896 Capital grants and contributions 620,063 3,855,708 2,082,757 10,280,692 6,382,770 Total governmental activities program revenues 4,427,035 8,361,234 6,884,915 15,406,482 11,883,880 Business-type activities:Charges for services: Water 1,448,160 1,596,599 1,773,912 1,994,463 2,095,496 Sewer 2,640,879 3,065,150 3,344,028 3,956,633 4,177,428 Sanitation 1,062,573 1,151,549 1,334,065 1,489,071 1,595,944 Capital grants and contributions 3,410,490 6,813,384 6,971,034 5,020,402 5,559,972 Total business-type activities program revenues 8,562,102 12,626,682 13,423,039 12,460,569 13,428,840 Total primary government program revenues 12,989,137$ 20,987,916$ 20,307,954$ 27,867,051$ 25,312,720$
Fiscal Year
City of Post FallsChanges In Net AssetsLast Five Fiscal Years
(Accrual-Basis of Accounting)
88

Table #2(Continued)
2003 2004 2005 2006 2007
Net (Expense)/RevenueGovernmental activities (4,785,636) (1,918,656) (6,167,996) 2,576,138 (2,334,843) Business-type activities 4,859,319 8,450,258 8,660,492 6,982,854 7,995,883 Total primary government net (expense)/revenue 73,683$ 6,531,602$ 2,492,496$ 9,558,992$ 5,661,040$
General Revenues and Other Changes in Net AssetsGovernmental activities: Property taxes 4,751,170 4,990,766 5,452,343 6,228,757 7,191,562 Other taxes and licenses 1,980,691 2,160,571 2,386,998 2,681,188 3,220,308 Unrestricted intergovernmental revenues Grants and contributions not restricted to specific programs Unrestricted investment earnings 206,303 145,760 375,469 633,704 1,007,266 Loss on sale of capital assets 29,686 1,763 2,708 1,502 10,853 Transfers 796,222 870,540 899,730 957,340 1,532,034 Total governmental activities 7,764,072 8,169,400 9,117,248 10,502,491 12,962,023 Business-type activities: Unrestricted investment earnings 280,123 241,539 416,271 854,961 1,218,220 Loss on sale of capital assets 2,100 84,177 1,800 Transfers (796,222) (870,540) (899,730) (957,340) (1,532,034) Total business-type activities (516,099) (626,901) (399,282) (102,379) (312,014) Total primary government 7,247,973$ 7,542,499$ 8,717,966$ 10,400,112$ 12,650,009$
Changes in Net AssetsGovernmental activities 2,978,436$ 6,250,744$ 2,949,252$ 13,078,629$ 10,627,180$ Business-type activities 4,343,220 7,823,357 8,261,210 6,880,475 7,683,869 Total primary government 7,321,656$ 14,074,101$ 11,210,462$ 19,959,104$ 18,311,049$
Note: Accrual-basis financial information for the City as a whole is available back to 2003 only, the year GASB Statement 34 was implemented.
Last Five Fiscal Years(Accrual-Basis of Accounting)
Fiscal Year
City of Post FallsChanges In Net Assets
89

Table #20
Function/Program 1998 1999 2000 2001 2002 2003 2004 2005 2006 2007
General government 41.12 39.57 43.08 51.14 47.14 47.73 43.53 49.95 50.75 59.85Public safety 51.44 48.64 49.44 50.43 52.88 51.88 56.27 54.14 53.89 62.08Highways and public works 8.73 12.57 14.07 13.97 13.72 13.95 12.77 15.06 15.06 19.39Cultural and Recreation 20.69 22.13 19.6 23.6 24.44 22.81 23.09 24.76 24.76 33.6Water 5.92 6.5 5.75 5.8 6.3 6 5.98 6.48 6.48 6.45Sewer 11.92 11.5 10.75 10.8 11.05 11 11.98 11.48 11.48 12.43
Total 139.82 140.91 142.69 155.74 155.53 153.37 153.62 161.87 162.42 193.8
Note: This schedule represents number of persons employed as of September 30 of each year. Vacant positions are included in the above numbers. Full time personnel work 2,080 hours per year.No Sanitation FTE number is provided since the City contracts out its sanitation services.
Full-time Equivalent Employees as of September 30
City of Post FallsFull-Time Equivalent Town Government Employees By Function
Last Ten Fiscal Years
90

Table #21
1998 1999 2000 2001 2002 2003 2004 2005 2006 2007
FunctionPolice Calls for service 17,513 16,223 16,941 17,560 15,215 21,600 24,789 26,270 25,368 27,826 Burglary 121 106 78 98 81 120 159 140 111 89 Phone harassment 72 73 47 30 39 26 40 34 24 35 Motor vehicle theft 35 29 33 32 39 32 46 46 51 50Highways and streets Street resurfacing - paving (miles) 2.60 2.60 2.01 1.40 1.89 1.86 1.37 1.65 Street resurfacing - chip seal (miles) 1.00 1.25 3.30 4.90 6.16 5.02 5.00 4.20 3.59 2.26Culture and recreation Sports leagues programs attendance 4,048 4,283 5,319 Special interest programs attendance 1,227 2,101 3,125Water New connections 360 594 112 100 850 850 390 393 193 206 Average daily consumption 3,591 3,684 3,684 3,581 3,470 4,005 4,042 4,194 4,819 4,860 (thousands of gallons)Sewer Average daily sewage treatment 2.0 2.0 2.0 2.1 2.1 2.2 2.2 2.3 2.4 2.4 (thousands of gallons)
Note: Street resurfacing - paving data not available for 1998 and 1999. Recreation programs not tracked prior to 2005.
City of Post FallsOperating Indicators By Function
Last Ten Fiscal Years
Fiscal Year
Source: Various city departments.Note: Indicators are available for the general government function.
91

Table # 22
1998 1999 2000 2001 2002 2003 2004 2005 2006 2007
FunctionPublic Safety Police Stations 1 1 1 1 1 1 1 1 1 1 Patrol Units 25 29 31 36 40 40 43 46 49 52Highways and streets Streets (miles) 98 101 103 106 111 115 129 133 143 149Culture and recreation Park acreage 245.3 245.3 250.19 273.94 328.89 354.74 382.62 395.5 408.37 421.25 Parks 19 Sports Fields 4 4 5 5 5 5 5 5 5 5 Tennis Courts 2 2 2 2 2 2 2 2 2 2Water Water mains (miles) 82 83 86 88 91 92 104 108 110 113 Fire hydrants 511 547 558 599 637 695 745 772 811 842 Maximum daily compacity 11.23 11.23 11.23 11.23 11.23 11.23 11.23 16.99 16.99 16.99 (thousands of gallons)Sewer Sanitary sewers (miles) 82 84 86 88 91 93 105 109 110 155 Storm sewers (miles) 1.53 1.53 1.53 1.53 1.53 1.53 1.53 1.53 1.53 1.53 Maximum daily treatment capacity 3.48 3.48 3.48 3.48 3.48 3.48 3.48 3.48 3.48 3.48 (thousands of gallons)
Note: The city contracts out Sanitation services.
City of Post FallsCapital Asset Statistics By Function
Last Ten Fiscal Years
Fiscal Year
Source: Various city departments.Note: No capital asset indicators are available for the general government function.
92

Table # 23
City of Post Falls Statistical Information
Water Fund September 30, 2007
Schedule of Water Revenue and Production For Residential, Commercial and Governmental Accounts
Total Revenue $2,450,410 Estimated number of active customers 9,000 Total water produced (thousands of gallons) 1,803,294,300
Schedule of Water Rates
Monthly Base Fee (by meter size)
1” or less $ 8.06 1½” $13.54 2” 20.12 3” 35.56 4” 57.50 6” 112.44
Metered water Usage 86¢ per 1,000 gallons
Source: City of Post Falls
93

Table # 24
City of Post Falls Statistical Information
Wastewater (Sewer) Fund September 30, 2007
Schedule of Treatment Volume Average Volume 2.36 million gallons per day Total Volume 862,200,000 gallons
Schedule of Monthly Sewer Rates
The residential rate is $25.58 for 94% of the City’s customers. The non-residential rate per customer is $25.58 + $4.81 per 1,000 gallons of water consumption
over 5,000 gallons. Source: City of Post Falls
94

Table # 25
City of Post Falls Insurance Schedule September 30, 2007
The City is insured through the Idaho Counties Reciprocal Management Program (ICRMP), Policy No. 26A02152100106. Coverage is as follows:
Coverage Premises $100,000 per occurrence ($5,000 per person) Auto: Liability $2,000,000 Uninsured/underinsured $500,000 Medical $100,000 per accident ($5,000 per person) Crime $500,000 Law Enforcement $3,000,000 ($2,000,000 per occurrence) General Liability $2,000,000 Errors & Omissions $2,000,000 ($2,000,000 per claim) Flood and Earthquake $50,000,000
The City is also enrolled in the Workmen’s Compensation Insurance Program through the State of Idaho. Source: City of Post Falls
95
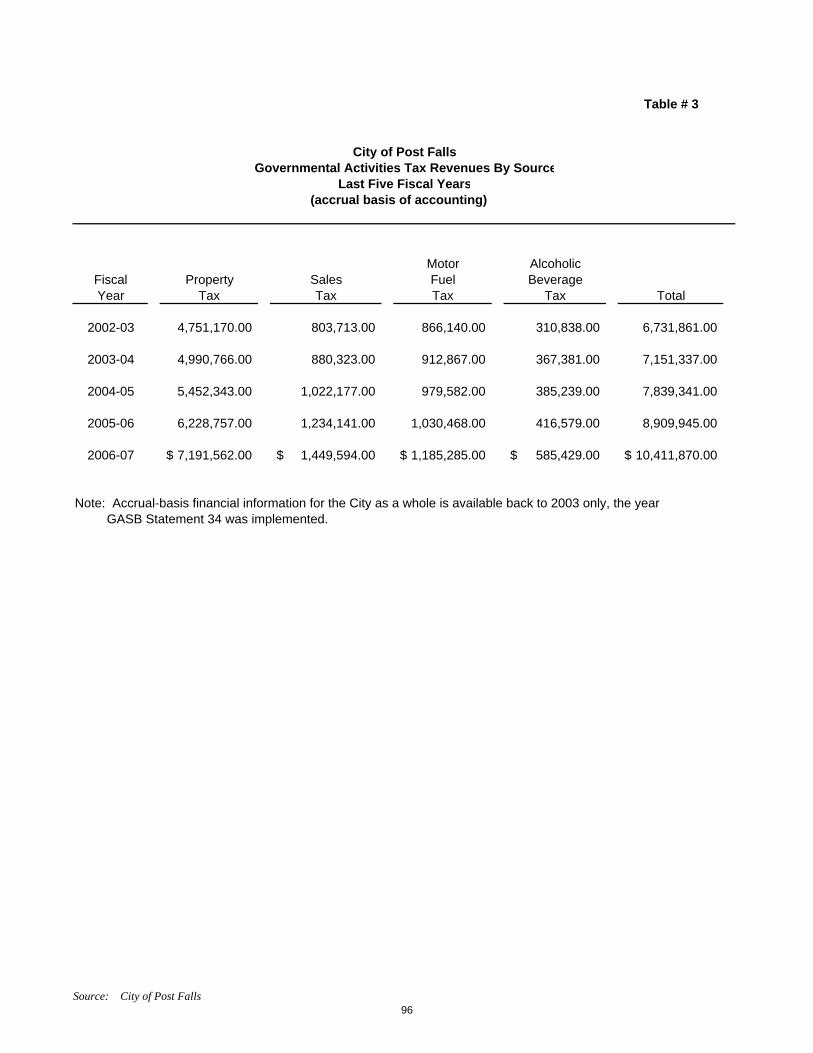
Table # 3
City of Post FallsGovernmental Activities Tax Revenues By Source
Last Five Fiscal Years(accrual basis of accounting)
Motor AlcoholicFiscal Property Sales Fuel BeverageYear Tax Tax Tax Tax Total
2002-03 4,751,170.00 803,713.00 866,140.00 310,838.00 6,731,861.00
2003-04 4,990,766.00 880,323.00 912,867.00 367,381.00 7,151,337.00
2004-05 5,452,343.00 1,022,177.00 979,582.00 385,239.00 7,839,341.00
2005-06 6,228,757.00 1,234,141.00 1,030,468.00 416,579.00 8,909,945.00
2006-07 7,191,562.00$ 1,449,594.00$ 1,185,285.00$ 585,429.00$ 10,411,870.00$
Note: Accrual-basis financial information for the City as a whole is available back to 2003 only, the year GASB Statement 34 was implemented.
Source: City of Post Falls96

Table #4
1998 1999 2000 2001 2002 2003 2004 2005 2006 2007General Fund Reserved for: Library and art activities 87,264$ 39,629$ 27,732$ 25,470$ 21,272$ 88,660$ 23,773$ 26,816$ 49,401$ 55,618$ Debt Total reserved Unreserved Designated for improvements 333,512 421,886 449,510 144,226 175,124 164,255 257,832 491,326 532,270 724,801 Undesignated 2,548,759 1,818,067 2,383,173 3,630,430 7,244,405 3,129,042 4,118,284 4,922,894 6,348,640 4,643,329
Total General Fund 2,969,535$ 2,279,582$ 2,860,415$ 3,800,126$ 7,440,801$ 3,381,957$ 4,399,889$ 5,441,036$ 6,930,311$ 5,423,748$
All Other Governmental Funds Reserved for: Debt 352,236$ 352,608$ 354,404$ 356,293$ 354,832$ Unreserved Designated for debt service 444,976$ 494,172$ 410,643$ 302,174$ 272,394$ (748,908) 194,219 1,832,764 524,315 633,714 Designated for capital projects 1,817,252 2,471,442 3,492,596 5,077,512 7,713,348 Undesignated 217,571 222,415 141,056 241,330 124,714 145,184 254,216 281,675 (203,730) (198,459)
Total all other governmental funds 662,547$ 716,587$ 551,699$ 543,504$ 397,108$ 1,565,764$ 3,272,485$ 5,961,439$ 5,754,390$ 8,503,435$
Fiscal Year
City of Post FallsChanges in Fund Balances, Governmental Funds
Last Ten Fiscal Years(Modified Accrual-Basis of Accounting)
97

Table #5
1998 1999 2000 2001 2002 2003 2004 2005 2006 2007Revenues:Taxes 2,828,014$ 3,299,035$ 3,486,218$ 3,833,894$ 4,361,376$ 4,730,516$ 5,267,092$ 6,042,106$ 6,587,395$ 7,544,333$ Intergovernmental 1,662,858 2,027,230 2,159,833 2,390,805 3,588,311 2,618,459 2,624,868 2,710,478 3,132,055 4,090,629 Charges for services 1,070,906 1,518,433 1,565,164 1,597,607 1,723,947 2,371,648 3,099,775 3,580,138 4,033,890 4,354,124 Other revenue 282,876 271,570 391,974 410,891 377,825 611,212 484,696 557,950 640,963 917,785 Special assessment revenue 127,020 245,502 123,554 125,661 107,236 162,658 686,228 282,452 547,609 205,917 Interest 248,897 235,946 274,936 345,771 211,071 165,167 145,759 375,469 633,704 1,007,266 Total Revenues 6,220,571 7,597,716 8,001,679 8,704,629 10,369,766 10,659,660 12,308,418 13,548,593 15,575,616 18,120,054
Expenditures:Current General government 1,809,227 2,116,467 2,419,524 2,571,361 2,943,384 3,283,259 3,725,937 4,069,030 4,561,224 5,381,605 Public safety 2,128,126 2,194,066 2,249,065 2,381,335 2,603,846 2,776,302 2,903,775 3,145,202 3,433,945 3,822,573 Highways and public works 1,927,708 949,289 1,048,887 1,136,381 2,487,208 2,785,694 1,555,583 3,478,417 2,252,495 1,841,807 Cultural and recreation 676,318 671,279 719,488 758,193 869,370 931,638 1,110,484 1,156,462 1,256,420 1,481,597 Debt Service Principal 199,435 714,919 356,593 348,923 372,912 500,439 453,672 498,238 3,916,445 4,899,437 Interest 69,378 208,923 168,731 149,392 134,225 374,533 321,973 313,437 438,255 589,655 Capital Outlay 806,999 2,540,527 1,219,679 1,279,537 2,449,428 3,708,335 794,978 2,367,801 1,722,900 434,069
Total Expenditures 7,617,191 9,395,470 8,181,967 8,625,122 11,860,373 14,360,200 10,866,402 15,028,587 17,581,684 18,450,743
Excess (deficiency) of revenues over (under) expenditures (1,396,620) (1,797,754) (180,288) 79,507 (1,490,607) (3,700,540) 1,442,016 (1,479,994) (2,006,068) (330,689)
Other financing sources (uses): Debt issued 2,474,600 614,325 105,385 4,250,600 14,129 181,542 4,310,365 2,330,954 41,138 Operating transfers in 660,619 760,996 745,829 727,608 745,286 1,047,971 1,310,638 2,063,901 1,606,305 5,410,418 Operating transfers out (145,944) (213,480) (119,580) (11,000) (11,000) (251,749) (440,098) (1,164,171) (648,965) (3,878,385)
Total other financing sources (uses) 2,989,275 1,161,841 626,249 821,993 4,984,886 810,351 1,052,082 5,210,095 3,288,294 1,573,171 Net change in fund balances 1,592,655$ (635,913)$ 445,961$ 901,500$ 3,494,279$ (2,890,189)$ 2,494,098$ 3,730,101$ 1,282,226$ 1,242,482$
Debt service as a percentage of noncapital expenditures 4.1% 15.0% 8.0% 7.1% 5.6% 8.6% 8.1% 6.7% 36.5% 41.8%
Fiscal Year
City of Post FallsChanges in Fund Balances of Governmental Funds
Last Ten Fiscal Years(Modified Accrual-Basis of Accounting)
98

Table # 6
City of Post FallsGeneral Government Tax Revenues By Source
Last Five Fiscal Years(modified accrual basis of accounting)
Motor AlcoholicFiscal Property Sales Fuel BeverageYear Tax Tax Tax Tax Total
2002-03 4,492,098.00 803,713.00 866,140.00 310,838.00 6,472,789.00
2003-04 4,969,999.00 880,323.00 912,867.00 367,381.00 7,130,570.00
2004-05 6,042,106.00 1,022,177.00 979,582.00 385,239.00 8,429,104.00
2005-06 6,216,994.00 1,234,141.00 1,030,468.00 416,579.00 8,898,182.00
2006-07 7,164,627.00$ 1,449,594.00$ 1,185,285.00$ 585,429.00$ 10,384,935.00$
Note: Separate tax financial information for the City as a whole is available back to 2003 only, the year GASB Statement 34 was implemented.
Source: City of Post Falls99

Table #7
City of Post FallsAssessed Value and Estimated Actual Value of Taxable Property
Last Ten Fiscal Years
Net Valuation Increase Tax RateTax Assessed Taxable Per $1,000Year Valuation Exemptions Value Amount Percentage Value
1997 695,182,787 122,678,457 572,504,350 29,956,725 5.52% 4.74
1998 742,251,793 132,469,458 609,782,335 37,277,985 6.51% 5.27
1999 791,143,568 140,866,247 650,277,321 40,494,986 6.64% 5.28
2000 841,776,651 152,996,162 688,780,489 38,503,168 5.92% 5.28
2001 892,717,766 162,554,696 730,163,070 41,382,581 6.01% 5.34
2002 1,007,449,488 177,060,965 830,388,523 100,225,453 13.73% 5.33
2003 1,074,115,199 187,101,426 887,013,773 56,625,250 6.82% 5.47
2004 1,258,237,363 222,571,578 1,035,665,785 148,652,012 16.76% 5.35
2005 1,459,655,088 268,780,754 1,190,874,334 155,208,549 14.99% 4.64
2006 1,701,069,379 423,200,428 1,277,868,951 86,994,617 7.31% 4.05
Source: Kootenai County Assessor100

Table #8City of Post Falls
Property Tax RatesDirect and Overlapping Governments
Last Ten Fiscal Years
Governmental Unit 2007 2006 2005 2004 2003 2002 2001 2000 1999 1998
City of Post Falls 3.70 4.05 4.64 5.35 5.46 5.33 5.34 5.28 5.18 5.27%CHANGE -20.17% -24.30% -13.27% -2.01% 2.44% -0.19% 1.14% 1.90% -1.70% 11.13%
North Idaho College 0.48 0.53 0.71 0.74 0.77 0.77 0.77 0.94 1.03 1.03
Kootenai County 1.84 1.84 2.47 3.48 3.65 3.14 3.43 3.92 3.73 3.32
Kootenai Hospital District 0.00 0.00 0.00 0.00 0.00 0.00 0.00 0.00 0.00 0.00
Kootenai Ambulance District 0.10 0.1 0.14 0.16 0.32 0.33 0.15 0.13 0.15 0.15
School District #273 2.23 2.23 5.61 6.28 6.43 6.18 6.08 5.85 5.95 5.29
Post Falls Highway District #1 0.36 0.36 0.47 0.57 0.57 0.6 0.65 0.66 0.67 0.68
Post Falls Fire District 1.34 1.34 1.72 2.06 1.93 1.69 1.67 1.50 1.21 1.26
Total 10.05 10.45 15.76 18.64 19.13 18.04 18.09 18.28 17.92 17.00
% CHANGE FOR TOTAL -36.21% -43.94% -15.45% -2.56% 6.04% -0.28% -1.04% 2.40% 5.41% 8.63%
Notes: (1) Tax rates are expressed as per $1,000 of net taxable market value
Source: Kootenai County Assessor101

Table # 9
City of Post FallsPrincipal Property Taxpayers
September 30, 2007
Type Of Property Percentatge of TotalTaxpayer Business Assessed Valuation Assessed Valuation
Kimball International Mkt, Inc. Manufacturing-Furniture $24,195,175 1.24%
North Idaho Surgical Hospital Bldg. LLC Medical $18,095,862 0.93%
Sysco Food Service, Inc. Food Distribution Center $14,771,299 0.76%
Puryear Family Trust Homeowner $14,619,517 0.75%
Pointe LLC Retail $13,360,375 0.68%
Wal-Mart Real Est. Bus./Stores Inc. #3472 Retail $12,614,753 0.65%
Verizon NW, Inc. Marketing $12,017,042 0.61%
Potlatch Forest Holdings Wood Products $11,124,600 0.57%
Northern Idaho Advanced Care Hospital, Inc. Medical $10,263,400 0.52%
Idaho Veneer Wood Products $9,198,255 0.47%Subtotal - Ten Of City's Largest Taxpayers $140,260,278 7.18%All Other Taxpayers $1,815,116,365 92.82%Total City Taxpayers $1,955,376,643 100.00%
Type Of Property Percentatge of TotalTaxpayer Business Assessed Valuation Assessed Valuation
Kimball International Mkt, Inc. Manufacturing-Furniture $31,991,775 4.59%
Factory Outlets Retail $11,699,250 1.68%
Potlatch Corp. Manufacturing-Wood Products $8,862,230 1.27%
Cavanaugh's Hospitality LTD Partnership Hotels/Motels/Restraurants $7,742,637 1.11%
Idaho Veneer Manufacturing-Wood Products $6,592,204 0.95%
James R. Watson Etux Commercial Business Properties $5,567,766 0.80%
Robert Coles Etux Golf Course $5,078,054 0.73%
John C Young Etal Commercial Business Properties $4,581,497 0.66%
Jacklin Land Co. Commercial Business Properties $4,580,327 0.66%
Tidyman's LLC Grocery $3,666,412 0.53%Subtotal - Ten Of City's Largest Taxpayers $90,362,152 12.98%All Other Taxpayers $606,250,221 87.02%Total City Taxpayers $696,612,373 100.00%
2007
1998
Source: Kootenai County Assessor102

ABOVE: This Red Crown service station was one of the earliest gas stations in Post Falls
103

REPORT ON INTERNAL CONTROL OVER FINANCIAL REPORTING AND ON COMPLIANCE AND OTHER MATTERS BASED ON AN AUDIT OF FINANCIAL STATEMENTS PERFORMED IN
ACCORDANCE WITH GOVERNMENT AUDITING STANDARDS
Mayor and City CouncilCity of Post FallsPost Falls, ID 83854
We have audited the financial statements of the governmental activities, the business-type activities, the aggregate discretely presented component units, each major fund, and the aggregate remaining fund information of the City of Post Falls, Idaho as of and for the year ended September 30, 2007, which collectively comprise the City of Post Falls, Idaho’s basic financial statements and have issued our report thereon dated March 21, 2008. We conducted our audit in accordance with auditing standards generally accepted in the United States of America and the standards applicable to financial audits contained in Government Auditing Standards, issued by the Comptroller General of the United States.
Internal Control Over Financial Reporting
In planning and performing our audit, we considered the City of Post Falls, Idaho’s internal control over financial reporting as a basis for designing our auditing procedures for the purpose of expressing our opinions on the financial statements, but not for the purpose of expressing an opinion on the effectiveness of the City of Post Falls, Idaho’s internal control over financial reporting.
A control deficiency exists when the design or operation of a control does not allow management or employees, in the normal course of performing their assigned functions, to prevent or detect misstatements on a timely basis. A significant deficiency is a control deficiency, or a combination of control deficiencies, that adversely affects the City of Post Falls, Idaho’s ability to initiate, authorize, record, process, or report financial data reliably in accordance with generally accepted accounting principles such that there is more than a remote likelihood that a misstatement of the City of Post Falls, Idaho’s financial statements that is more than inconsequential will not be prevented or detected by the City of Post Falls, Idaho’s internal control.
A material weakness is a significant deficiency, or combination of significant deficiencies, that results in more than a remote likelihood that a material misstatement of the financial statements will not be prevented or detected by the City of Post Falls, Idaho’s internal control.
Our consideration of internal control over financial reporting was for the limited purpose described in the first paragraph of this section and would not necessarily identify all deficiencies in internal control that might be significant deficiencies or material weaknesses. We did not identify any deficiencies in internal control over financial reporting that we consider to be material weaknesses, as defined above.
Compliance and Other Matters
As part of obtaining reasonable assurance about whether the City of Post Falls, Idaho’s financial statements are free of material misstatement, we performed tests of its compliance with certain provisions of laws, regulations, contracts, and grant agreements, noncompliance with which could have a direct and material effect on the determination of financial statement amounts. However, providing an opinion on compliance with those provisions was not an objective of our audit, and accordingly, we do not express such an opinion. The results of our tests disclosed no instances of noncompliance that are required to be reported under Government Auditing Standards.
103

REPORT ON INTERNAL CONTROL OVER FINANCIAL REPORTING AND ON COMPLIANCE AND OTTHER MATTERS BASED ON AN AUDIT OF FINANCIAL STATEMENTS PERFORMED IN ACCORDANCE WITH GOVERNMENT AUDITING STANDARDS
This report is intended solely for the information and use of management, the City Council and is not intended to be and should not be used by anyone other than these specified parties.
March 21, 2008
104

ABOVE: Painting of City founder Frederick Post