post-crisis export performance in thailand
TRANSCRIPT

Post-crisis Export Performance in Thailand
Prema-chandra Athukorala Research School of Pacific and Asian Studies
Australian National University
and’
Suphat Suphachalasai APEC Study Centre
Thammasat University
Abstract: This paper examines post-crisis export performance in Thailand against the backdrop of pre-crisis experience and ongoing changes in patterns of international production. Following a stage-setting survey of trends and patterns of export performance over the past four decades, it focuses on two key themes central to the current policy debate, namely the implications of China’s emergence as a key player in world markets in labour intensive manufactured goods and the link between the crisis-propelled real exchange rate depreciation and export performance. There is strong evidence to suggest that the ‘China fear’ is vastly exaggerated. Real exchange rate depreciation has been a significant determinant of the post-crisis export recovery. However, the growing importance in the export composition of parts and components within vertically integrated cross-border production processes has tended to weaken the nexus of real exchange rate and export growth.
JEL classification: F10, F14, F23
Key words: export performance, real exchange rate, product fragmentation Forthcoming in ASEAN Economic Bulletin, 21(1) (Special Focus Issue: Thailand)

1
Post-crisis Export Performance in Thailand∗
I Introduction
The economic boom in Thailand prior to the financial crisis in 1997 was underpinned by
rapid growth in exports, accompanied by a dramatic shift in the commodity composition of
exports away from traditional agricultural products and towards manufactured exports.
There are serious concerns in Thai policy circles that the export performance so far has failed
to regain pre-crisis dynamism. In particular, concerns have been expressed about the intensity
of world market competition following China’s entry into the WTO and the implications for
export competitiveness of tightening domestic labour market conditions as part of the
recovery process. The purpose of this paper is to inform this debate by examining post-crisis
export performance in Thailand against the backdrop of pre-crisis experience and on-going
changes in patterns of international production. In addition to examining trends and patterns
of export performance, particular attention will be placed on Thailand’s relative performance
in major markets compared to China and the impact of crisis-propelled changes in the
incentive structure on export performance.
The organisation of the paper is as follows: Section II provides an overview of
overall export trends, and changes in export composition and revealed comparative
advantage, with emphasis on the experience during the post crisis era. Section III looks at
∗ This paper is based on research undertaken for World Bank Thailand. The authors are grateful to Dr Kazi Matin, Lead Economists at World Bank Thailand for sponsoring the study, to Archanun Kohpaiboon and Juthathip Jongwanich for excellent research assistance, and to Sakulrat Montreevat for valuable comments and editorial support..

2
the possible implications of China’s emergence as a major force in world trade for Thailand’s
export performance. Section IV examines changes in the incentive structure following the
on-set of the crisis and their implications for export expansion. The key findings are
summarised in the final section.
II Trends and Patterns of Export Growth
The pre-crisis economic boom (1986-1995) in Thailand was a classic example of export-led
growth. During this period, the dollar value of total merchandise exports grew at an average
annual rate of over 23.3% compared to 13.4% during the preceding decade. Thailand’s share
in total world trade increased from 0.3 per cent in early 1970s to over 1.1 per cent by the
mid-1990s. Exports as a ratio of GDP rose from 30 per cent to over 70%, and exports
accounted for over a half of the increment in real GDP, between these time points (Table 1).
Table 1 about here
Figure 1 about here
This impressive growth record began to falter from about the third quarter of 1995,
resulting in a 3.6 per cent contraction in the dollar value of exports in 1996. This
unprecedented export downfall contributed to triggering the crisis in 1997 by damaging
investor confidence in the capacity to maintain its fixed exchange rate and provoking a large
capital outflows (Warr 2000).

3
For over a year following the on-set of the crisis, export patterns remained rather
volatile, with year-to-year growth remaining in the negative territory in most months (Figure
1). This was followed by a sharp recovery, lifting year-on-year growth to the pre-crisis
average (around 20%) in the first half of 2000. This nascent recovery shortly fell victim to
the world economic recession, pushing growth rates again into the negative territory in the
second half of 2001. The recent export recovery started in the second quarter of 2002 and has
gathered momentum in recent months.
(a) Overall Patterns and Trends
Until the late 1970s, Thailand was predominantly a primary commodity exporting country.
In the late 1970s, export composition began to change rapidly, reflecting the expansion of
processed food exports and traditional light manufactured goods, in particular garments and
footwear (Table 2). From then, further diversification of the export mix has taken place, as
Thailand became an increasingly attractive location for assembly activities within the broader
category of machinery and transport equipment (SITC 7). During 1986-95 manufactured
exports grew at an annual rate of 31.8% compared to 14% growth of primary products. By
the mid-1990s, manufactured goods contributed to over 61.8 per cent of total merchandise
exports.
Table 2 about here
During the post-crisis period, the relative importance of agricultural products has
eroded further. Within manufacturing exports of machinery and transport equipment (SITC

4
7) have expanded rapidly dwarfing the traditional ‘traditional manufacturing duo’, clothing
and footwear. In 2002, electrical machinery (SITC 72) alone accounted for more than one
fifth of total exports (or about one-third of manufacturing exports) and the combined share of
clothing and footwear had come down to a mere 7.5%. At a more disaggregated level,
computers and parts, electronic circuits, automobile parts topped the export list in that order
during 2001- 2002.1 The rapid growth of exports within the machinery and transport
equipment category reflect the increasing importance of international product fragmentation
⎯the cross-border dispersion of component production and assembly activities within
vertically integrated production processes (Jones and Kierzkowski 2001, Athukorala 2003)
What are the products in which Thailand has performed better in world markets
compared to its overall export performance? In other worlds, what are the products in which
Thailand has comparative advantage? Has the list of products which meet this criterion
expanded or shrunk over the years? A useful measure that help answer these issues is the
index of revealed comparative advantage (RCAI), which measures a country’s relative export
performance in individual product categories compared to its overall export performance in
world trade (Balassa 1965).
The RCAI for Thailand (RCAIT ) in the export of product j is defined as:
]/[]/[
WT
TT
WJ
TJT
J XXXX
RCAI =
where, 1 This observation is based on 3-digit SITC data from the UN COMTRADE database.

5
TjX Thailand’s exports of commodity j,
WjX world export of commodity j,
TTX Thailand’s total exports of all goods, and
WTX World exports of all goods.
If the value of RCAI exceeds unity for commodity j, Thailand is said to have ‘revealed’
comparative advantage in the production of that commodity. In contrast, if RCAI is below
one, Thailand is at a comparative disadvantage in the production of the commodity.
This measure must be used with some caution because domestic policy measures such
as production subsidies, or foreign trade barriers (such as voluntary export restraints, VERs)
or trade preferences (such as preferential market access under generalised system of
preference, GSP), that have nothing to do with comparative advantage, can influence its
measured value. However, this limitation is not very important in its application to
Thailand. Export production in Thailand during the period under study has taken place under
virtual free trade conditions (Warr 2000). Thai exports have also not significantly benefited,
or adversely affected by trade policies of importing countries. The only notable exception to
this is exports of wearing apparel, which have been significantly influenced by VERs under
the Multifibre Arrangement (MFA).

6
We estimated RCAI for commodities identified at the three-digit level of the Standard
International Trade Classification (SITC) over the period 1990-20012. Based on these
estimates, changes in revealed comparative advantage (competitiveness) of Thai exports
between 1990-94 and 1998-2001 are summarised in Table 3. Through a comparison of
average RCAIs between these two time periods, using the list of commodities, which, on
average, had achieved ‘RCA status’ (that is RCA>1) during 1990-94 as the benchmark, four
groups of commodities have been identified. ‘Group A’ contains commodities which
exhibited increase in RCAI between 1990-94 and 1998-2001. Group B shows products
whose RCAIs had declined during 1998-2001 compared to 1990-94 but still remained unity .
Commodities that moved from RCA status to non-RCA status(from RCAI >1 to RCAI <1)
between the two time periods are listed in ‘Group C’. Finally, products which were not in
the RCA list (that is those with RCA<1) in 1990-94 but had gained RCA status by 1998-
2001 are contained in ‘Group D’.
Table 3 about here
The first impression from our analysis is that, throughout the period under study,
Thailand’s comparative advantage in world trade remained broad-based, unlike many
developing countries whose strength in international exchange lies in one or a few products.
Thirty eight products, which are more or less evenly distributed across both primary and
manufacturing sectors, continued to remain in the ‘RCA status’ during the period under study
2 Detailed estimates for the 3-digit SITC commodities are not reported here for want of space. They are available from the authors on request.

7
(Group A + Group B). Nine new produced had achieved RCA status by 1998-2001 (Group
D).3
In general, relatively a larger number of agricultural products have exhibited decline
in the measured degree of RCA over time compared to manufacturing products (see Groups
B and C). However, Thailand’s competitiveness in world agricultural trade has continued to
remain strong. Only a few agricultural products (mostly traditional agricultural products)
have shifted from RCA status to non-RCA status between 1990-94 and 1988-2001.
Processed food products (fresh meet (SITC 011), fresh and canned fish (SITC 031 and 032),
preserved fruits (SITC 053), fresh and preserved vegetable (SITC 054 and 055), as well as
the main tradition export product, rice, have continued to maintain RCA status, despite
decline in the absolute value of RCAI. Revealed comparative advantage in processed food
is a notable strength of Thailand’s export structure, because these products are characterised
by high-income elasticity of demand and hence strong demand growth in world trade
(Athukorala and Jayasuriya 2003).
Within manufacturing, there is a clear pattern of increase in RCA of a number of
products belonging to the machinery and transport equipment category (SITC 7) (office
machines (SITC 714), electrical distribution machinery (SITC 722), telecommunication
equipment (SITC 724), and domestic electric equipment (SITC 725).and miscellaneous
electrical machinery (729)), Electrical distribution machines (STC 723) and
telecommunication equipment (SITC 724) have continued to maintain RCA status, despite
decline in the absolute value of RCAI. A similar pattern is revealed by sound recorders 3 Products in Groups A, B and D together accounted for 85% of total exports during 1998-2001.

8
(SITC 891) and Watches and Clocks (SITC 864), which are included under miscellaneous
manufacturing (SITC 8) but more or less comparable in terms of technology involved to the
products belong to SITC 7).
For the traditional labour intensive manufacturing products (which are covered in
SITC 6 and SITC 8), the overall trends in RCAI are rather mixed. RCAIs of wearing apparel
(SITC 841), toys (SITC 894) not shown in Table 3! Added, travel goods (SITC 831),
footwear (SITC 851) have declined over time but still remained above unity. In contrast,
products such as leather goods (SITC 611), rubber goods (629), textile yarns and thread
(SITC 651), cotton fabrics (652) and pottery (SITC 666) have exhibited further improvement
in RCA status.. It seems that products which are basically labour intensive but relies
significantly on Thailand’s domestic resource base have performed better than the other
labour intensive products which are generally more import dependent.
Thailand’s broad-based revealed comparative advantage in world trade depicted in
Tables 3 is consistent with her rich resource endowment, including the availability of labour
at low cost by the regional standards. However, the international development experience
over the past half-a-century has clearly demonstrated that resources alone cannot bring about
export (and development) success (Lal and Myint 1996, pp. 279-87). In Thailand the trade
and industry policy regime has generally remained conducive for exploiting the growth
potential of its resource base. Despite some policy interventions (propelled by shifts in
fashion in development thinking) from time to time, Thailand has by and large maintained an
open trade and investment policy regime, which is conducive for resource allocation in line

9
with the country’s comparative advantage.4 In particular, Thailand never relied heavily on
quantitative restrictions and other forms of non-tariff protection. This meant that the
domestic price signals were not insulated from world market conditions and that there was no
significant direct government involvement in private-sector performance through the
allocation of import quotas. Moreover, Thailand foreign investment policy has become
increasingly liberal over the past three decade. This has enabled Thailand to benefit from the
on-going process of international product fragmentation within vertically integrated high-
tech industries, which has become the dominate source of manufactured export expansion in
recent years (Athukorala 2003).
III The China Factor
Ever since China began to emerge as a major trading nation in the early 1990, there has been
a growing concern in Thailand and countries in the region that competition from China is
likely to crowd-out their export opportunities.. This pessimism has gained added impetus
from China’s recent accession to the WTO. The WTO not only provides China with most-
favoured nation (MFN) status in major markets but is also likely to enhance China’s
attractiveness to export-oriented investment by reducing the country risk of investment. The
purpose of this section is to piece together some relevant information on this debate. We first
look at new export opportunities for Thailand in the expanding Chinese economy. This is
followed by an enquiry into the implications of China competition for exports from Thailand
in third country markets.
4 In a recent comprehensive study of the patterns and chronology of trade policy reforms during the post-war era, Sachs and Warner (1995, Table 1) identify Thailand as one of the eight developing countries whose trade regimes remained open throughout the post-Second World War period.

10
(a) China as a New Export Market
Total exports from Thailand to China increased from less than $500 million (about 3% of
total Chinese imports) in the early 1990s to over $3000 million (5%) in 2002 (Figure 2 -).
Thailand’s imports from China have grown at a slower rate, from around $1000 million in
the early 1990s to $4500 million in 2002. However, the trade balance is still in China’s
favour (a deficit of about 20% of export value, from the Thai point of view). During 1997-
2002, China’s imports from Thailand increased an annual average rate of 24%, compared to a
16% growth of total imports from developing countries (Table 4). The rate of import growth
from Thailand is comparable or superior to the experiences of the other major trading nations
in the region. Imports from Vietnam and the Philippine have grown faster, but from very low
base levels.
Figure 2 about here
Electrical machinery and electronics has accounted for the lion’s share of recent
increase in Thai exports to China (Table 5). It seems that, China is becoming increasingly
involved in the intra-regional specialisation of assembly activities in these industries and
Thailand has begun to benefit from this new form of intra-regional specialisation (Athukorala
2003).
Table 4 and 5 about here

11
Interestingly, tariff cuts under the ‘early harvest products’ China -Thailand Free
Trade Agreement have so far is limited to agricultural products that come under HS- Chapter
01 to 08, and two manufacturing items which rarely traded between the two countries,
namely anthracite, and coke and semi-coke. These products have not played a significant
role in recent rapid growth of Thai exports to China.
(b) China Competition in Third-Country Markets
Data on Thailand’s relative performance in the US and Japanese markets in manufactured
goods are summarised in Table 6. China’s share in total US imports from developing
countries increased from 20.4% in 2000 to 30.3 by mid-2003. This was accompanied by
sharp decline in the combined market share of the newly industrialised economies (NIEs) in
East Asia (Taiwan, Hong Kong, Singapore and South Korea). The combined share of the
four NIEs in total US imports from developing countries in mid-2003 was 17.4, down from
21.6% in 2000. (no Singapore statistics in Table 5!!!.Sorry I have referred here to the original
table where data for the four NIEs is given separately. In this table I have given only the
total four the four countries to save space) The market share of Thailand remained virtually
unchanged around 2.6% , while Malaysia, the Philippine and Vietnam recorded some mild
market share gains. This comparative performance record is consistent with the view that
most of the growth of Chinese exports to developed-country markets have so far stemmed
from rapidly diminishing comparative advantage of the newly Industrialised Economies
(NIEs) in conventional labour intensive product lines. These product lines have rapidly
‘migrated’ to China from these countries though investment links (Lardy 2002:, pp. 160-162).

12
Table 6 about here
China’s share in total imports to Japan increased from 38.9% in 2000 to 50.7% in the
third quarter of 2003 (Table 6). As in the US market share losses have been recorded by the
Asian NIEs. Markets shares of Thailand, Indonesia, the Philippines and Vietnam have
remained virtually unchanged Disaggregated data (not reported in the Table) suggest that
Thailand’s market share in processed food continued to increase, from 14% to 17%. Strong
market links that have been developed over the years by Thai MNEs seems to have played a
role in cushioning Thailand against import competition from China (Panamond 2004).
In sum, the China competition has obviously begun to have considerable impact on
the trading environment faced by Thailand and other developing countries in the region.
However, there is clear evidence that competition from China does not necessarily imply
proportionate loss in market share for all developing countries. In general, the East Asian
NIEs have begun to experience greater market share losses than Thailand and the other
‘second-tier’ exporting countries in the region. It is also important to note that, China’s
comparative advantage is not going to remain the same. Economic theory and historical
experience tell us that China’s economic dynamism will change its international comparative
advantage. As the Chinese economy becomes more integrated into the global economy,
domestic wages will start to increase, eroding comparative advantage in labour intensive
products. In fact, a number of Thai firms in automotive and electronics industries which we
interviewed as part of this study mentioned that they have become more competitive in recent

13
years because wages in the eastern provinces of China have already begun to increase at a
much faster rate compared to Thailand.
IV Incentive Structure and Export performance
In all ‘crisis-affected’ countries in East Asia, export expansion slowed down in the lead up to
the crisis. However, Thailand was the only country among them to experience an export
contraction in 1996. There is no unanimity among economists about the causes of this
unique Thai experience, but two important factors figure prominently in various prognoses.
First, there was a massive appreciation of the real exchange rate as a result of both sharp
appreciation of the nominal exchange against the yen (under the de facto dollar-peg exchange
rate system) and domestic demand pressure arising from large foreign capital inflows.
Second, ten years of persistent economic expansion from 1986 had resulted in labour market
tightening and real wage growth, eating into export profitability (Warr 2000).
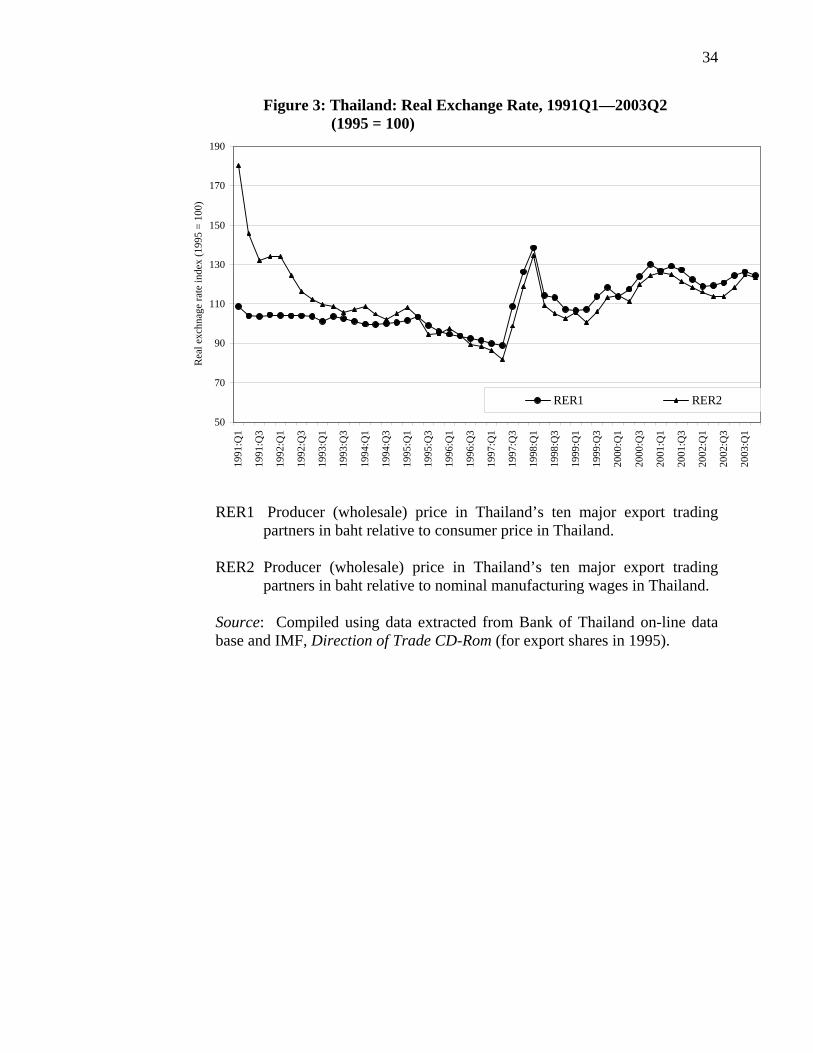
To what extent has the massive exchange rate adjustment during the crisis and the
subsequent adjustments served to restore international competitiveness of tradable production
in the Thai economy? The real exchange rate indices plotted in Figure 3 help answering this
question. Of the two series, RER1 is the ratio of the trade-weighted producer price index of
the major trading partner countries (expressed in Baht) to domestic consumer price index. It
is reasonable proxy measure of the textbook definition of the real exchange rate – the ratio of
tradable to non-tradable prices. RER2 has the same denominator, but the nominal wage
index (average monthly earning per employee) is used in place of CPI as its numerator.
Thus, it is a more appropriate indicator of change in profitability of labour intensive export

14
production. While both RER series point to a significant deterioration in international
competitiveness in the lead up to the crisis, the degree of deterioration is much sharper in
terms of RER2. This pattern is consistent with the view that export collapse in 1996 was
underpinned by a massive deterioration in the profitability of labour intensive export
products.
Figure 3 about here
There has been a notable turnaround in both indices following the onset of the crisis.
In the immediate aftermath of the crisis up to about late 1998, high domestic inflation partly
counterbalanced the effect of nominal exchange depreciation on relative profitability of
traded good production. Over the past four years, CPI inflation and nominal wage growth
has remained low and the time pattern of the two RER series have by and large been
determined by the behaviour of the nominal exchange rate.
To examine the impact of real exchange rate on export performance, we estimated the
following ‘reduced form’ export equation for total manufactured exports (SITC 5 through 8
less SITC 68) and the four sub-categories therein: chemicals (SITC5), basic (resource-based)
manufacturing (SITC 6), machinery and transport equipment (SITC7) and miscellaneous
manufacturing (SITC8.

15
QX = F(RER, WT, CU, CRD)
Where,
QX Export volume (export value deflated by the export price index)
RER Real exchange rate (measured alternatively by RER1 and RER2)
CU Capacity utilization in domestic manufacturing (to capture domestic demand
pressure on export performance).
WT World trade volume - world manufacturing export value deflated by market-
share weighted producer price index of the ten major trading nations (to
capture world market conditions on Thai export performance).
CRD A dummy variable that takes value 1 for the crisis months (June 1997 to June
1988) and zero otherwise (to capture trade disruption in the aftermaths of the
crisis)
The model was estimated using monthly data for the period from January 1995 to
November 2002.5 All data series (except CRD) were constructed as indices (1995 =100) and
used in natural logarithms in regression estimation. Pre-testing of data for time series
properties revealed that all data series but one (CU for SITC 5) were integrated process of
degree zero (Table 6).6 Therefore, the standard two-stage procedure for modelling with non-
stationary data was employed for estimating the model. Among the various techniques
available for estimating the first stage regression (co-integrating vector), the one used here is
5 All data series were compiled from the on-line data base of Bank of Thailand. 6 The test results are available from the authors on request.

16
the Phillip-Hansen modified least-square method, which is considered an appropriate choice
for working with small data samples (Inder 1993).
Ideally, we should have worked with a fully specified export model which captures
demand- and supply-side influences separately, while appropriately allowing from the
possible simultaneous integration involved in the determination of quantity and price.
Unfortunately, high-frequency data (which are essential for examination export determinants
surrounding the recent crisis episode) are not available for this purpose. At any rate, the
simultaneity issue is not a binding constraint because, as noted, the non-stationarily of the
data series permits us to use cointegrating technique for the estimation of our reduced form
equation. If the particular vector of non-stationary variables is put together on the basis of
sound economic reasoning, then a co-integration relationship among them can be interpreted
as the equilibrium (long-run) relationship (Engle and Granger 1987).
The regression estimates are reported in Table 7. Only the estimates obtained by
using RER2 are reported because the used of RER1 yielded virtually identical results. For
total manufactured exports and each product category, the first equation is the co-integration
vector that shows steady-state (long run) relationship and the second equation shows short-
run dynamics. The standard diagnostic tests for the residual whiteness of the short-run
equation are also reported. Since we have used all variables in natural logarithms, the
regression coefficients can be directly interpreted as elasticities.
Table 7 about here

17
Looking first at the estimates for total manufactured goods, the short-run and
equilibrium elasticity of exports with respect to change in the real exchange rate are 0.73 and
1.10 respectively. The results point to significant differences in the estimated degree of
elasticity across the five categories. There is no evidence of significant impact of the real
exchange rate on exports of chemicals (equation 2). For the other three categories both short
run and long run elasticity estimates are statistically significant, but the magnitudes are
different. The long-run elasticity of exports with respect to the real exchange for basic
manufacturing is the highest (1.53), and for machinery and transport equipment is the lowest
(0.65), with miscellaneous manufacturing coming in between (0.94). As one would
anticipate a priori, short run elasticities are considerably lower in magnitude in all cases.
The results on the impact of capacity utilisation on export performance rather mixed.
Statistically significant long run effect is found only for chemicals,. ( 0.75)., machinery and
transport equipment (0.20) and total manufactured goods (0.42). In all these cases the short
run effect is much greater in magnitude, reflecting the fact that the effect of capacity
utilisation on export performance is by and large a short-run phenomenon. For total
manufactured exports, chemicals and transport equipment world demand conditions (as
captured by WT) are a significant determinant export performance. In all these cases, both
short- and long-run export elasticities with respect to change in world trade volume is much
larger in magnitude compared to the elasticities with respect to the real exchange rate.
In the equation for miscellaneous export, WT had the perverse sign and its deletion
did not have any impact on the magnitude and the statistical significant of the coefficient
attached to the real exchange rate. This result is consistent with the hypothesis that the

18
standard ‘small country’ assumption holds for exports of standards labour intensive goods
from developing countries (that is, countries can expand exports without been affected by
world changes in total world demand, depending on the conduciveness of domestic supply
factors). In the case of machinery and transport equipment (Equation 4), the high elasticity
with respect to world demand and relatively low magnitude of the elasticity with respect to
the real exchange rate is consistent with our earlier observation that the ongoing process of
product fragmentation plays a key role in export expansion in this product category. This
form of international specialisation is much more dependent on the world market conditions
relative to relative incentives faced by exporters in individual countries. On the supply side,
the key prerequisites for export success through product fragmentation are open trade and
foreign investment regimes to facilitate the integration of domestic manufacturing with
global production networks of Multi-National Enterprises (MNEs) (Jones and Kierzkowski
2001).
V Conclusions
Historically, Thailand’s export structure has remained highly diversified by the typical
developing-country standards, with an increasing number of product lines enjoying revealed
comparative advantage in international trade. While the rich domestic resource endowment
has provided the setting, the key to export success was rooted in a long-standing of the Thai
government to maintaining open trade and investment regimes.
The pre-crisis export contraction in Thailand was largely an outcome of sharp erosion
in international competitiveness rooted in macroeconomic excesses during the boom years.

19
The incentives for export production, measured by the real exchange rate, have improved
significantly following the onset of the recent financial crisis. This has been the combined
outcome of significant nominal exchange rate depreciation propelled by the crisis and the
easing of the labour market pressure, reversing persistent real wage growth experienced in
the lead up to the crisis.
The results of our econometric analysis of the determinants of export growth suggest
that real exchange rate depreciation is a a significant determinant of the post-crisis export
recovery. However, the results also suggest that rapid diversification of exports away from
traditional product products (wearing apparel, footwear etc) and toward assembly/component
specialisation within global industries have tended to weaken the link between the real
exchange rate and export growth. Export success in these new product lines depends on the
long-term commitment of a country to maintain open trade and foreign investment regimes,
which facilitates the integration of domestic manufacturing with global production networks
of MNEs, rather than on short-term changes in relative incentives faced by domestic firms.
The emergence of China as a major exporter of labour intensive products has
obviously begun to have considerable impact on the trading environment faced by Thailand
and other exporting countries in the region. However, the gloomy predictions of the
implications of increased Chinese competition for Thailand may be overstated. There is clear
evidence that competition from China does not necessarily imply proportionate loss in
market share for all developing countries. So far, China’s rapid world market penetration in
labour intensive manufactured goods has occurred largely at the expense of the East

20
AsianNIEs. Moreover, rapid expansion in imports by China has opened up new market
opportunities for countries like Thailand. Of particular importance in this connection is
China’s rapid integration in regional production networks in parts and component production
in vertically integrated global industries.

21
Reference Athukorala, Prema-chandra (2003), ‘Product Fragmentation and Trade Patterns in East Asia’,
Working papers in Trade and Development No 2003/21, Division of Economics, Research School of Pacific and Asian Studies, Australian National University.
Athukorala, Prema-chandra and Sisira Jayasuriya (2003), ‘Food safety Issues, Trade and
WTO Rules: A Developing Country Perspective’, World Economy, 26(9), 613-637. Balassa, Bela (1965), ‘Trade Liberalization and ‘Revealed’ Comparative Advantage’,
Manchester School, 33(2), 99-123.. Engle, Robert F. and Clive W.J. Granger (1987), ‘Co-integration and error-correction:
Representations, Estimation and Testing’, Econometrica, 55(2), 251-76. Freenstra, Robert (1998), ‘Integration of Trade and Disintegration of production in the
Global Economy’, Journal of economic Perspectives, 14(4): 31-50. Inder, Brett (1993), “Estimating Long-run Relationships in Economics: A Comparison of
Different Approaches”, Journal of Econometrics, Vol. 57, pp. 53-68. Jones, Ronald W. and Henryk Kierzkowski (2001), ‘A Framework for Fragmentation’, in
Seven W. Arndt and Henryk Kierzkowski (eds), Fragmentation: New Production Patterns in the World Economy, New York: Oxford University Press, 17-34.
Lal, Deepak and Hla Myint (1996), The Political Economy of Poverty, Equity and Growth: A
Comparative Study, Oxford: Clarendon Press. Lardy, Nicholas R. (2002), Integrating China into the Global Economy, Washington DC:
Brookings Institution Press. Panamond, Pavida (2004), ‘Thai Multinationals After the Crisis: Trends and Prospects’,
ASEAN Economic Bulletin, this issue. Sachs, Jeffery. and Andrew Warner (1995) ‘Economic Reforms and the Process of Global
Integration’, Brookings Papers on Economic Activity, 25th Anniversary Issue: 1-95. Warr, Peter (2000), ‘Case Study: Thailand’ in Dilip K. Das (ed.), Asian Exports, Oxford:
Oxford University Press, 335-382. Prema-chandra Athukorala is Professor of Economics, Division of Economics, Research School of Pacific and Asian Studies, Australian National University. Suphat Suphachalasai is Director of APEC Study Centre, Faculty of Economic, Thammasat University, Bangkok, Thailand

22
Table 1: Thailand: Key Indicators of Export Performance
Exports, $Million
Annual growth (%)
Manufacturing share (%)
Export to GDP ratio (%)
Share in world exports (%)
1976-1985 5623 13.4 25.7 21.9 0.361986-1995 27855 23.3 61.8 34.8 0.77
1986 8786 24.5 43.7 25.6 0.431987 11629 32.4 51.6 28.9 0.481988 15902 36.7 54.1 33.0 0.581989 19976 25.6 56.3 34.9 0.671990 23002 15.2 63.1 34.1 0.68
1991 28324 23.1 65.5 36.0 0.811992 32452 14.6 66.8 37.0 0.871993 37080 14.3 71.1 38.0 1.001994 45118 21.7 72.3 38.9 1.06
1995 56282 24.7 73.1 41.8 1.111996 54284 -3.6 71.4 39.3 1.021997 57567 6.0 71.5 48.0 1.041998 53118 -7.7 74.2 58.9 0.981999 58233 9.6 74.2 58.3 1.03
2000 68746 18.1 75.6 66.9 1.082001 65103 -5.3 74.5 66.1 1.062002 68653 5.5 64.8 2003 44733 18.7
Source : World Development Indicator, World Bank, (CDROM), and International Monetary Fund, Direction of Trade Statistics, (CDROM).

23
Table 2: Export Performance by Commodity Category 1970-75 1976-85 1986-95 1996-2000 2001 2002(A) Composition (%) Primary products 77.6 66.1 36.7 25.9 23.6 23.2Food (SITC 0+1+4) 53.4 52.7 29.4 17.4 17.7 16.8 of which, Food-Processed food 14.7 19.6 18.3 13.1 15 14.1 Agricultural raw materials (SITC2-27-28) 20.3 11.4 5.9 3.8 3.4 4 Non-agricultural primary products (SITC 3+27+28) 3.9 2.0 1.4 2.5 2.4 2.4Manufacturing Products (SITC 5+6+7+8-68) 11 25.7 61.8 73.6 73.6 75.6 Clothing (SITC 84) 1.4 5 11.3 6.0 4.9 4.4 Machinery and transport equipment (7) 0.4 4.2 11.7 21.2 22.1 23.7 Electrical Machinery (SITC 72) 0.3 4.0 11.3 18.8 20.4 22.1 Automotive+ parts (SITC 73) 0 0.1 0.5 0.8 2.2 2.1 Footwear (SITC 85) 0 0.6 2.7 1.5 2.8 3.1 Jewellery (SITC 8971 and 8972) 0.2 0.6 2.3 1.6 1.3 1.1 Total Export ($ million) 1436 5622 27855 58389 65103 68653 (B) Growth rate (%) Primary products 27.6 10.2 14 0.7 4.1 3.6Food (SITC 0+1+4) 35 10.4 13.3 -1.7 16.3 -0.1 of which, Food-Processed food 53.9 12.6 19.3 -0.6 24.4 -0.7 Agricultural raw materials (SITC2-27-28) 15.5 10.3 17.7 -4.0 -1.8 22 Non-agricultural primary products (SITC 3+27+28) 26.1 16.5 17.8 42.0 -37.9 4.3Manufacturing Products (SITC 5+6+7+8-68) 65.1 25.1 31.8 5.2 -20.2 7.7 Clothing (SITC 84) 157.1 28 25.6 -2.6 -16.4 -5.4 Machinery and transport equipment 18.2 39.5 38.7 12.4 -8.2 13.8 Electrical Machinery (SITC 72) 18.1 39.3 35.9 11.8 -11.3 14.5 Automotive+ parts (SITC 73) 13.1 41.2 65.2 29.6 67.7 1.7

24
Footwear (SITC 85) 141.6 86 39.9 -12.9 133.9 18.5 Jewellery (SITC 8971 and 8972) 42.7 38.5 31.7 -0.2 -7.1 -8.1 Total Exports ($ million) 28.2 13.4 23.3 4.5 -5.3 5.5 Source: Compiled from the UN COMTRADE database.

25
Table 3: Manufacturing Exports from Thailand: Change in the Index of Resealed Comparative Advantage (RCAI) between 1990-94 and 1998-2001 (A) Increase (B) Decline but > 1 (continued) (C ) Decline and < 1 SITC 055 Preserved vegetable SITC 081 Animal feeding stuff 061 Sugar and honey 121 Tobacco, un-manufactured 099 Food preparations 075 Spices 241 Fuel wood and charcoal 264 Jute 231 Rubber crude 532 Dyes 266 Other fibre 261 Silk 691 Structures and parts 611 Leather 273 Stone 893 Articles of plastic 629 Rubber articles 612 Leather etc manufactures 899 Other manufactured goods 651 Textile yarn and thread 632 Wood manufactures 025 Eggs 652 Cotton fabrics 653 Woven textiles, non-cotton 044 Maize unmilled 666 Pottery 654 Lace 075 Spices 697 Base metal household equipment 656 Textile etc products 714 Office machines 667 Pearl (D ) New products, > 1 722 Electrical power machinery 687 Tin SITC 724 Telecommunication equipment 723 Electrical distributing machines 052 Dried fruit 725 Domestic electric equip 729 Electrical machinery 275 Natural abrasives 729 Electrical machinery, n.e.c. 821 Furniture 111 Non-alcoholic beverages (B) Decline but > 1 831 Travel good 581 Plastic material, n.e.c. 011 Meat fresh 841 Clothing, not of fur 621 Materials of rubber 031 Fish fresh 851 Footwear 693 Wire products non-electrical 032 Fish etc tinned 864 Watches and clocks 663 Non-metallic mineral manufactures 042 Rice 891 Sound recorders 692 Metal tanks 047 Meal and flour non wheat 894 Toys 733 Road vehicles (non motor) 053 Fruit preserved 893 Articles of plastic. N.e.c. 054 Fresh vegetable Note: n.e.c. Not elsewhere classified (as part of another SITC category). Source : Compiled from UN EMOTRADE database.

26
Table 4: China’s Imports from developing Countries Percentage shares of selected countries (%) and total ($ million), 1997-2002
Composition (%) Growth (%)
1997 1998 1999 2000 2001 2002 1997-2002Hong Kong 10.2 10.1 8.9 8.5 7.8 6.9 10.0Taiwan 24.0 25.3 25.3 22.9 22.8 24.4 19.1Korea, South 21.7 22.8 22.3 20.8 19.5 18.3 14.7Indonesia 3.9 3.7 4.0 3.9 3.2 2.9 12.9Malaysia 3.6 4.1 4.7 4.9 5.2 6.0 31.5Philippines 0.5 0.8 1.2 1.5 1.6 2.1 60.0Singapore 6.4 6.4 5.3 4.5 4.3 4.5 11.2Thailand 2.9 3.7 3.6 3.9 3.9 3.6 23.9Vietnam 0.5 0.3 0.5 0.8 0.8 0.7 41.0Other 26.2 22.9 24.2 28.2 30.8 30.6 All Developing countries (US$ million) 68453 65989 77103 111561 120050 156007 19.1 Source: Compiled from UN COMTRADE database

27
Table 5: Commodity Composition of Thai Exports to China, 1998-2002 (%)
HS no. 1998 2000 2002 84 Machinery 32.46 20.04 19.02 85 Electrical Machinery 8.30 14.49 14.00 27 Mineral Fuel, Oil Etc 7.30 15.36 11.74 40 Rubber 9.79 11.59 11.00 39 Plastic 5.67 7.46 8.69 29 Organic Chemicals 2.58 2.90 5.00 10 Cereals 6.86 4.22 2.93
7 Vegetables 0.89 0.15 2.90 44 Wood 0.78 0.91 2.62 72 Iron And Steel 1.11 2.10 2.39 48 Paper and Paper board 2.31 2.44 2.11 41 Hides And Skins 0.21 0.40 1.38 55 Manmade Staple Fibres 1.92 1.93 1.22 70 Glass And Glassware 0.25 0.43 1.15
8 Edible Fruit And Nuts 0.11 0.79 0.97 3 Fish And Seafood 12.31 2.87 0.97
99 Special Import Provision 1.20 0.67 0.93 90 Optical and Medal equipment 0.91 1.09 0.86 35 Albumins and starch glue 0.11 0.67 0.80 17 Sugars 1.23 0.51 0.78
Other 36.16 29.02 27.56 Total ($ million) 1766 2795 3544 Note: (1) Commodities are ranked by export performance in 2002. Source: Compiled from UN COMTRADE database.

28
Table 6: Imports of Manufactured Goods1 to USA and Japan from Developing Countries2, 1996-2003July (Percentage shares of selected countries and total imports from developing countries in $ million)
China NIEs Indonesia Malaysia Philippines Thailand Vietnam Total ($ million)
(a) USA 1996 17.5 27.7 2 5.9 2.6 3.2 0 2960381997 18.6 25.2 2.1 5.2 2.9 3.2 0 3362461998 19.4 22.8 2 5 3 3.1 0 3709031999 19.9 22.1 1.9 4.9 2.8 2.9 0.1 4222272000 20.4 21.6 1.8 4.9 2.7 2.8 0.0 5047582001 22.1 19.0 1.8 4.6 2.3 2.7 0.1 4758942002Q1 21.9 18.4 1.7 4.8 2.2 2.6 0.1 1110532002Q2 24.3 17.7 1.7 4.7 2 2.5 0.2 1257592002Q3 27.3 17.2 1.7 4.7 2.2 2.7 0.4 1362312002Q4 27.7 17.9 1.5 4.4 1.9 2.6 0.5 1327682003Q1 26.3 17.3 1.6 4.4 2 2.5 0.7 1213852003Q2 28.1 17.0 1.5 4.6 1.7 2.4 0.7 1304672003July 30.3 17.4 1.6 4.8 1.8 2.5 1 45745
(b) Japan 2000 39.8 33.2 4.6 8.2 4.3 6.5 1.5 126122001 44.3 27.9 4.4 7.7 4.8 6.5 1.5 130662002q1 45.8 26.1 4 6.9 5.4 6.5 1.5 32352002q2 46.3 27.3 4.2 6.6 5 6.6 1.4 33302002q3 49 25.3 4.3 6 4.7 6.6 1.5 33182002q3 50.3 24.4 4.2 6.2 4.6 6.5 1.4 36152003q1 49.7 24.2 4 6.1 4.6 6.9 1.6 33872003q2 50.3 24.5 4.1 5.9 4.5 6.6 1.5 35242003Q3 50.7 24.7 4 5.9 4.3 6.4 1.5 1257 Notes: 1 Manufactured goods are defined to include all products belonging to Sections 5 through 8 of the Standard International Trade Classification (SITC) net of SITC 67 and 68 (ferrous and non-ferrous metal). 2. Non-OECD countries + South Korea Source: Compiled from online databases of the United States International Trade Commissions (http://dataweb.usitc.gov/scripts/user_set.asp) and Japan Custom, Ministry of Finance (http://www.customs.go.jp/toukei/srch/indexe.htm).

29
Table 7: Determinants of manufactured Exports: Regression Results1
_____________________________________________________________________ (1) Total Exports QX = -3.33 +1.10RER -0.42CU +0.78WT +0.34CRD (2.62)* (6.40)* (3.73)* (4.15)* (7.69)* ∆QX = -0.002 - 0.73 ∆DER + 0.77∆WT + 0.02CRD -0.34ECM(-1) (0.25) (2.20)** (6.51)* (1.07) (4.82)*
2R = 0.55 F(5,87)= 23.38 SE= 0.07 LM test for serial correlation F (12,75) 0.89 RESET test for functional form F (1,86) 0.43 J-B test for normality 0.87 2χARCH test for heteroscedasticiy F (1,91) 1.73 ------------------------------------------------------------------------------------------------------- (2) Chemical (SITC5) QX = -21.41 +0.23RER -0.75CU +4.65WT +0.38CRD (5.50)* (0.51) (1.92)** (10.04)* (4.45)* ∆QX = -0.08 + 0.30∆RER - 0.09∆CU(-1) + 1.25∆WT + 0.02CRD -0.23ECM(-1) (0.08)) (0.739) (1.40) (8.37) (0.83)) (3.83)*
2R = 0.24 F(4,88)= 8.29 SE= 0.12 Diagnostic Tests LM test for serial correlation F (12,76) 0.45 RESET test for functional form F (1,87) 0.04 J-B test for normality 0.39 2χARCH test for heteroscedasticiy F (1,91) 0.14 -------------------------------------------------------------------------------------------------------- (3) Basic manufacturing (SITC6) QX = -12.52 +1.53RER -0.08CU +1.73WT +0.29CRD (8.63)* (5.34)** (0.44) (7.00)* (4.60)* ∆QX = -0.08 + 0.30∆RER - 0.09∆CU(-1) + 1.25∆WT + 0.02CRD -0.23ECM(-1) (0.08)) (0.739) (3.39) (8.37) (0.83)) (3.83)*
2R = 0.48 F(5,87)= 18.03 SE= 0.08

30
LM test for serial correlation F (12,75) 0.69 RESET test for functional form F (1,86) 2.26 J-B test for normality 1.24 2χARCH test for heteroscedasticiy F (1,91) 4.22 -------------------------------------------------------------------------------------------------------------------------- (4) Machinery and Transport Equipment (SITC7) QX = -11.94 +0.65RER -0.20CU +2.38WT +0.40CRD (8.63)* (2.64)* (1.69)*** (10.74)* (6.75)* ∆QX = -0.003 + 0.45∆RER - 0.22∆CU(-1) + 1.04∆WT + 0.02CRD -0.25ECM(-1) (0.32)) (1.17) (3.12)* (7.26)* (1.02)) (4.14)*
2R = 0.41 F(5,87)= 13.53 SE= 0.08 LM test for serial correlation F (12,75) 1.10 RESET test for functional form F (1,86) 0.57 J-B test for normality 0.83 2χARCH test for heteroscedasticiy F (1,91) 0.59 -------------------------------------------------------------------------------------------------------------------------- (5) Miscellaneous Manufactured Goods (SITC8) QX = -0.05 +0.94RER +0.39CRD (0.46)* (3.66)* (5.21)* ∆QX = -0.003 + 0.72∆RER - 0.62∆CU(-1) + 0.40∆WT + 0.03CRD -0.22ECM(-1) (0.32)) (2.00)** (3.98)* (2.41)** (1.02)) (3.93)*
2R = 0.34 F(5,87)= 10.74 SE= 0.10 LM test for serial correlation F (12,75) = 1.81 RESET test for functional form F (1,86) = 0.07 J-B test for normality = 2.21 2χARCH test for heteroscedasticiy F (1,91) = 4.45 _______________________________________________________________________ Notes: (1) Under each commodity category, the first equation shows the long-run
(steady state) relationship (co-integrating vector), and the second equation the short-run dynamics ECM is Error correction term (residual from the estimated cointegrating vector). T-ratios are given in brackets: * Significant

31
at the one-percent level, ** Significant at the five-percent level, and *** significant at the ten-percent level
Sources: Estimated using data series complied from the Bank of Thailand online database.

32
Figure 1: Growth of Merchandise Exports in Thailand, January 1994 – July 2003 (%)
(Year-on-year growth rates of current $ values)
-20
-10
0
10
20
30
40
Jan-94
Jul-94
Jan-95
Jul-95
Jan-96
Jul-96
Jan-97
Jul-97
Jan-98
Jul-98
Jan-99
Jul-99
Jan-00
Jul-00
Jan-01
Jul-01
Jan-02
Jul-02
Jan-03
Jul-03
Source: Compiled from Bank of Thailand on-line database. (to be cited in references) {put percentage on the Y-axis}

33
Figure 2: Thailand-China Trade, 1990-2002 (Exports and Imports in US$ million)
0
500
1000
1500
2000
2500
3000
3500
4000
4500
5000
1990
1991
1992
1993
1994
1995
1996
1997
1998
1999
2000
2001
2002
Expo
rt/Im
ports
(US$
mill
ion)
Export Import
Source: UN COMTRADE Database
34
Figure 3: Thailand: Real Exchange Rate, 1991Q1—2003Q2 (1995 = 100)
50
70
90
110
130
150
170
190
1991
:Q1
1991
:Q3
1992
:Q1
1992
:Q3
1993
:Q1
1993
:Q3
1994
:Q1
1994
:Q3
1995
:Q1
1995
:Q3
1996
:Q1
1996
:Q3
1997
:Q1
1997
:Q3
1998
:Q1
1998
:Q3
1999
:Q1
1999
:Q3
2000
:Q1
2000
:Q3
2001
:Q1
2001
:Q3
2002
:Q1
2002
:Q3
2003
:Q1
Rea
l exc
hnag
e ra
te in
dex
(199
5 =
100)
RER1 RER2
RER1 Producer (wholesale) price in Thailand’s ten major export trading
partners in baht relative to consumer price in Thailand.
RER2 Producer (wholesale) price in Thailand’s ten major export trading partners in baht relative to nominal manufacturing wages in Thailand.
Source: Compiled using data extracted from Bank of Thailand on-line data
base and IMF, Direction of Trade CD-Rom (for export shares in 1995).