positive and negative incentive contrasts lead to relative
TRANSCRIPT
*For correspondence:
Competing interests: The
authors declare that no
competing interests exist.
Funding: See page 17
Received: 23 January 2019
Accepted: 30 May 2019
Published: 02 July 2019
Reviewing editor: Diethard
Tautz, Max-Planck Institute for
Evolutionary Biology, Germany
Copyright Wendt et al. This
article is distributed under the
terms of the Creative Commons
Attribution License, which
permits unrestricted use and
redistribution provided that the
original author and source are
credited.
Positive and negative incentive contrastslead to relative value perception in antsStephanie Wendt1*, Kim S Strunk2, Jurgen Heinze3, Andreas Roider4,Tomer J Czaczkes1
1Animal Comparative Economics Laboratory, Institute of Zoology and EvolutionaryBiology, University of Regensburg, Regensburg, Germany; 2School of Business,Economics and Information Systems, Chair of Management, People andInformation, University of Passau, Passau, Germany; 3Institute of Zoology andEvolutionary Biology, University of Regensburg, Regensburg, Germany;4Department of Economics, University of Regensburg, Regensburg, Germany
Abstract Humans usually assess things not according to their absolute value, but relative to
reference points – a main tenant of Prospect Theory. For example, people rate a new salary relative
to previous salaries and salaries of their peers, rather than absolute income. We demonstrate a
similar effect in an insect: ants expecting to find low-quality food showed higher acceptance of
medium-quality food than ants expecting medium quality, and vice versa for high expectations.
Further experiments demonstrate that these contrast effects arise from cognitive rather than mere
sensory or pre-cognitive perceptual causes. Social information gained inside the nest can also serve
as a reference point: the quality of food received from other ants affected the perceived value of
food found later. Value judgement is a key element in decision making, and thus relative value
perception strongly influences which option is chosen and ultimately how all animals make
decisions.
DOI: https://doi.org/10.7554/eLife.45450.001
IntroductionWe all compare options when making both large and small decisions, ranging from career choices to
the choices of an evening’s entertainment. Understanding how options are compared has thus been
central to the study of behavioural economics. Theories explaining the mechanisms by which options
are compared and decisions are made have a long tradition (Vlaev et al., 2011), with Expected Util-
ity Theory (EUT) being the most widely used theory in economic models (Mankiw, 2011;
von Neumann and Morgenstern, 1944). EUT suggests that decisions are made by evaluating and
comparing the expected utility from each option. A rational decision maker then chooses the option
resulting in the best end state: the option providing the greatest utility (von Neumann and Morgen-
stern, 1944).
However, over the past decades economic research on human decision making has started to
shift away from a view of (absolute) utility maximisation towards more nuanced notions of relative
utility, such as reference-dependent evaluations. Kahneman and Tversky (1979) made a major con-
tribution to this shift by introducing Prospect Theory, suggesting that decision making is not based
on absolute outcomes, but rather on relative perceptions of gains and losses. In contrast to EUT, the
utility attributed to options being evaluated is determined relative to a reference point, such as the
status quo or former experience (Vlaev et al., 2011; Kahneman and Tversky, 1979; Parducci, 1984;
Tversky and Kahneman, 1992; Ungemach et al., 2011). Various examples of relative value percep-
tion have been described. For example, satisfaction gained from income is perceived not absolutely,
but relative to the income of others in the social reference group – such as one’s colleagues
Wendt et al. eLife 2019;8:e45450. DOI: https://doi.org/10.7554/eLife.45450 1 of 22
RESEARCH ARTICLE

(Boyce et al., 2010). Overall, Prospect Theory has enriched our understanding of human decision
making by conceptualising it as more nuanced and less rational than previously assumed
(Tversky and Kahneman, 1974; Tversky and Kahneman, 1981).
The concept of malleable value perception is not just relevant to humans. Value judgments in ani-
mals are also influenced by factors apparently independent of the absolute value of options. For
example, capuchin monkeys refuse otherwise acceptable pay (cucumber) in exchanges with a human
experimenter if they had witnessed a conspecific obtain a more attractive reward (grape) for equal
effort (Brosnan and De Waal, 2003). Rats, starlings, and ants, like humans, place greater value on
things they work harder for (Aw et al., 2011; Czaczkes et al., 2018a; Lydall et al., 2010), and star-
lings, fish and locusts demonstrate state-dependent learning, wherein they show a preference for
options experienced when they were in a poor condition (Aw et al., 2009; Pompilio et al., 2006;
Schuck-Paim et al., 2004). Roces and Nunez (Roces, 1993; Roces and Nunez, 1993) aimed to show
that in leaf cutting ants perceived value can be influenced by other ants. Ants recruited to higher
quality food sources ran faster, deposited more pheromone, but cut smaller leaf fragments, even if
the food source the recruits find is replaced by a standardised food source (Roces, 1993; Roces and
Nunez, 1993). However, in these experiments, the absolute value and nature of the reference
remains unclear, and indeed pheromone presence may have caused the observed behaviours with-
out influencing the ants’ expectations or value perception at all.
Healey and Pratt (2008) showed that colonies of the house-hunting ant species Temnothorax
curvispinosus move into a nest of mediocre quality faster when they were previously housed in a
high-quality nest compared to colonies which were previously housed in a poor-quality nest
(Healey and Pratt, 2008). In contrast, Stroeymeyt et al. (2011) showed that colonies of Temno-
thorax albipennis developed an aversion towards mediocre-quality nests available in their
eLife digest We make many decisions every day, often by comparing options and choosing the
one with the greatest profit. But how much we value something often does not depend solely on
our needs. Instead, this value may depend on our expectations or other arbitrary reference points.
For example, how satisfied you are with your income might depend on how much your colleagues or
friends earn.
Animals, including insects, also make decisions when feeding, choosing a partner, or finding a
nesting site. Sometimes animals behave in ways that look like disappointment. For example,
monkeys may reject a cucumber as a reward if they have seen another monkey get a grape for
completing the same task. But it is hard to tell if this behavior reflects a value judgment.
To investigate whether insects evaluate their options against their expectations, Wendt et al.
offered black garden ants sugar water over multiple trials. Some ants grew to expect low quality
sugar water (containing little sugar); some expected medium quality; and others expected high
quality sugar water (containing a high concentration of sugar). Ants that expected to find low quality
sugar water were more likely to accept medium quality options than ants that expected the medium
quality sugar water. Similarly, ants that expected high quality sugar water were less likely to accept
lower quality sugar water. Further experiments confirmed that the ants were not using physical cues
such as satiation to guide their behavior.
Furthermore, Wendt et al. found that ants that returned to the nest after foraging passed on
information that altered the expectations of the next group of foragers about nearby food. This
suggests that the value that ants place on food sources depends both on individual experiences and
on information gained from others.
Studies of decision making in humans can be difficult to perform and interpret, because
volunteers may try to second-guess what the experimenters want to find, and culture and education
may also influence choices. Studying ants instead could help to avoid these pitfalls, as the results
presented by Wendt et al. suggest they make decisions in similar ways to humans. Future work
building on these findings could also help researchers to predict how insects behave, particularly in
rapidly changing environments.
DOI: https://doi.org/10.7554/eLife.45450.002
Wendt et al. eLife 2019;8:e45450. DOI: https://doi.org/10.7554/eLife.45450 2 of 22
Research article Ecology Evolutionary Biology

environment when they were housed in a high-quality nest, whereas colonies housed in a low-quality
nest did not, and thus show an experience-dependent flexibility in nest choice (Stroeymeyt et al.,
2011). However, critically missing from the existing works is a systematic description of value judg-
ment relative to a reference point.
‘Value distortion by comparison’ effects have been studied for decades using the successive con-
trasts paradigm, in which animals are trained to a quality or quantity of reward which is then sud-
denly increased (positive incentive contrast) or decreased (negative incentive contrast)
(Bentosela et al., 2009; Bitterman, 1976; Couvillon and Bitterman, 1984; Crespi, 1942; Flah-
erty, 1982; Flaherty, 1999; Mustaca et al., 2000; Weinstein, 1970a). Many mammals, including
apes, monkeys, rats, and dogs (Brosnan and De Waal, 2003; Bentosela et al., 2009; Crespi, 1942;
Flaherty, 1999; Mustaca et al., 2000; Pellegrini and Mustaca, 2000; Weinstein, 1970b) have been
shown to respond to successive negative contrast by disrupting their behaviour compared to control
animals which had not experienced a change in reward. The animals display behaviour akin to disap-
pointment – slower running speeds to a reward (Bower, 1961), depressed licking behaviour
(Flaherty et al., 1985; Vogel et al., 1968), or reward rejection (Tinklepaugh, 1928).
Contrast effects were also successfully described in invertebrates (Bitterman, 1976;
Couvillon and Bitterman, 1984; Richter and Waddington, 1993). Bitterman (1976) found negative
incentive contrast effects in honey bees which were trained to a high-quality feeder and then
received a downshift to a lower quality feeder. In contrast, bees which experienced an upshift in
feeder quality did not show any feeding interruptions (Bitterman, 1976; Couvillon and Bitterman,
1984). While negative successive contrast effects – akin to disappointment – have been well
described in animals, positive successive contrast effects – akin to elation – have often proved elu-
sive (Bower, 1961; Black, 1968; Capaldi and Lynch, 1967; Dunham, 1968; Papini et al., 2001).
There are several factors which may prevent positive contrast effects from being detected. Firstly,
ceiling effects may occur when the performance of animals receiving a large reward is at or near a
physical limit. The absence of positive contrast effects may then not be due to the absence of per-
ceived positive contrast, but rather due to an artefact of experimental design (Bower, 1961;
Campbell et al., 1970). Secondly, neophobia counteracts positive contrast effects: animals may be
reluctant to eat a novel food – even if the food is of higher quality than normal (Flaherty, 1999;
Oberhauser and Czaczkes, 2018). Finally, generalisation decrement may prevent stronger
responses to positive contrast. Generalisation decrement occurs when animals are trained under one
set of stimuli and then tested under another. The strength of the tested response may decrease with
increasing differences between the training and testing stimuli (Kimble, 1961), which may then
result in weaker positive contrast effects following a reward shift. Thus, the reward change itself may
lead to a decrease in responding just as would any other change in context, such as a change in the
brightness of the runway or scent of the food (Oberhauser and Czaczkes, 2018; Capaldi, 1978;
Premack and Hillix, 1962).
Even though positive contrast effects proved to be hard to demonstrate in laboratory experi-
ments, there are good theoretical reasons for expecting both positive and negative contrast effects
to evolve (McNamara et al., 2013). Incentive contrasts have also been demonstrated for rewards
other than food. Females become more (or less) likely to accept a mate of given quality if they have
prior experience of better (or worse) mates. Such mate quality contrast effects are reported in both
vertebrates (Collins, 1995) and invertebrates (Dukas, 2005; Reid and Stamps, 1997;
Wagner et al., 2001).
In this study, we investigate positive and negative contrast effects using the successive contrasts
paradigm, and, in addition to demonstrating positive and negative contrast effects, define the first
relative value curve in an invertebrate; the ant Lasius niger. We conduct a critical control experiment
to rule out physiological or psychophysical effects which may lead to the same pattern (see experi-
ment 2) and thus provide strong evidence for a purely cognitive relative value effect in a non-human
animal. Furthermore, we demonstrate that information flowing into the nest can influence value per-
ception in outgoing foragers. This suggests that food sources are not only valued based on individ-
ual experiences, but also based on social information gained inside the nest. The perceived value of
a food source influences social information dissemination, by affecting the strength of pheromone
trails which then lead further ants to the food source. Thus, the way in which value is judged is likely
to strongly affect the foraging mechanics of a whole colony.
Wendt et al. eLife 2019;8:e45450. DOI: https://doi.org/10.7554/eLife.45450 3 of 22
Research article Ecology Evolutionary Biology
Materials and methods
Study animalsEight stock colonies of the black garden ant Lasius niger were collected on the University of Regens-
burg campus. The colonies were kept in 30 � 30 � 10 cm foraging boxes with a layer of plaster cov-
ering the bottom. Each box contained a circular plaster nest box (14 cm diameter, 2 cm height). The
colonies were queenless with around 1000–2000 workers and small amounts of brood. Queenless
colonies still forage and lay pheromone trails and are frequently used in foraging experiments
(Devigne and Detrain, 2002; Dussutour et al., 2004). The colonies were fed with ad libitum 0.5M
sucrose solution and received Drosophila fruit flies once a week. Water was available ad libitum.
One sub-colony of 500 individuals was formed from each stock colony, and these eight fixed-size
sub-colonies were used for our experiments. Sub-colonies were maintained identically to the stock
colonies, but did not receive any Drosophila fruit flies to prevent brood production, and were
starved 4 days prior to the experiments in order to achieve a uniform and high motivation for forag-
ing (Mailleux et al., 2006; Josens and Roces, 2000). During starvation, water was available ad libi-
tum. Any ants which died or were removed from the sub-colonies were replaced with ants from the
original stock colonies.
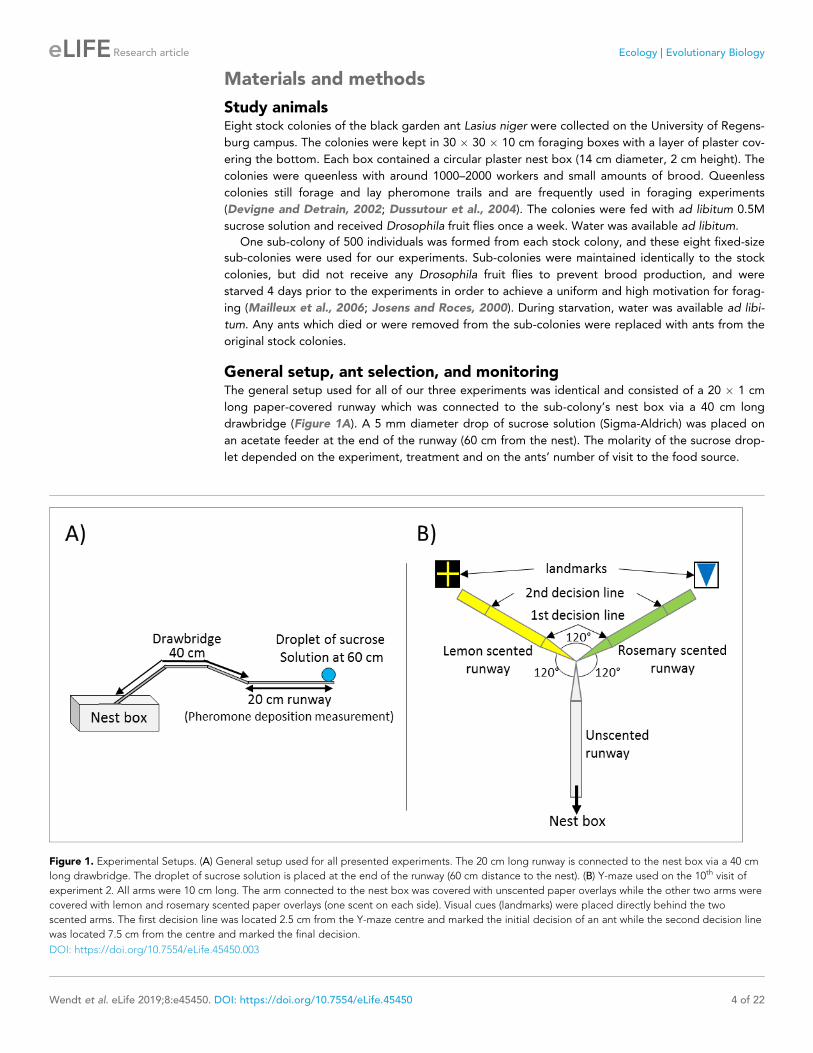
General setup, ant selection, and monitoringThe general setup used for all of our three experiments was identical and consisted of a 20 � 1 cm
long paper-covered runway which was connected to the sub-colony’s nest box via a 40 cm long
drawbridge (Figure 1A). A 5 mm diameter drop of sucrose solution (Sigma-Aldrich) was placed on
an acetate feeder at the end of the runway (60 cm from the nest). The molarity of the sucrose drop-
let depended on the experiment, treatment and on the ants’ number of visit to the food source.
Figure 1. Experimental Setups. (A) General setup used for all presented experiments. The 20 cm long runway is connected to the nest box via a 40 cm
long drawbridge. The droplet of sucrose solution is placed at the end of the runway (60 cm distance to the nest). (B) Y-maze used on the 10th visit of
experiment 2. All arms were 10 cm long. The arm connected to the nest box was covered with unscented paper overlays while the other two arms were
covered with lemon and rosemary scented paper overlays (one scent on each side). Visual cues (landmarks) were placed directly behind the two
scented arms. The first decision line was located 2.5 cm from the Y-maze centre and marked the initial decision of an ant while the second decision line
was located 7.5 cm from the centre and marked the final decision.
DOI: https://doi.org/10.7554/eLife.45450.003
Wendt et al. eLife 2019;8:e45450. DOI: https://doi.org/10.7554/eLife.45450 4 of 22
Research article Ecology Evolutionary Biology

To begin an experiment, 2–4 ants were allowed onto the runway, and the first ant to reach the
feeder was marked with a dot of acrylic paint on its gaster. This procedure may select for the more
active foragers, but does not introduce any selection bias between treatments. The marked ant was
allowed to drink to repletion at the food source, while all other ants were returned to the nest.
Food acceptance scores as a measure of perceived value were noted for each ant and visit as fol-
lows: Full acceptance (1) was scored when the ant remained in contact with the drop from the
moment of contact and did not interrupt drinking within 3 s of initial contact (see Video 1). Partial
acceptance (0.5) was scored if feeding was interrupted within 3 s after the first contact with the food
source, but the ant still filled its crop within 10 min (as can be seen by the distention of the abdomi-
nal tergites). Ants which interrupt feeding within the first seconds after contacting the food usually
show successive feeding interruptions and generally show a rather ‘impatient’ behaviour compared
to ants which show a food acceptance score of 1 (see Video 2). Lastly, rejection (0) was scored if the
ant refused to feed at the sucrose solution and either returned to the nest immediately or failed to
fill its crop within 10 min.
When the ant had filled its crop or decided not to feed at the sucrose droplet, it was allowed to
return to the nest. Inside the nest, the ant unloaded its crop to its nestmates and was then allowed
back onto the runway for another visit. The drawbridge was now used to selectively allow only the
marked ant onto the runway.
In addition to measuring food acceptance, we also measured pheromone deposition. Individual
pheromone deposition behaviour correlates with the (perceived) quality of a food source
(Beckers et al., 1993; Hangartner, 1970; Czaczkes et al., 2015). Individual ants can adapt the
strength of a pheromone trail by either depositing pheromone or not, or varying the intensity of a
pheromone trail through number of pheromone depositions (Beckers et al., 1993; Hangart-
ner, 1970). Pheromone deposition behaviour in L. niger is highly stereotypic. To deposit phero-
mone, an ant briefly interrupts running to bend its gaster and press the tip of the gaster onto the
substrate (Beckers et al., 1992). This allows the strength of a pheromone trail to be quantified by
counting the number of pheromone depositions over the 20 cm runway leading to the feeder. Pher-
omone depositions were measured each time the ant moved from the food source back to the nest
(inward trip), and each time the ant moved from the nest towards the food source (outward trip).
Because L. niger foragers almost never lay pheromone when they are not aware of a food source
(Beckers et al., 1992), we did not measure pheromone depositions for the very first outward trip
(visit 1). The presence of trail pheromone on a path depresses further pheromone deposition
(Czaczkes et al., 2013). Thus, each time an ant had passed the 20 cm runway, the paper overlay
covering the runway was replaced by a fresh one every time the ant left the runway to feed at the
feeder or returned to the nest.
All experimental runs were recorded with a Panasonic DMC-FZ1000 camera to allow for later
video analysis. Each tested ant was observed
until all experimental runs were finished and
then discarded from the colony before switching
to the next ant. If an ant did not return before
Video 1. Ant displaying food acceptance score 1. It
shows no food interruptions within the first seconds of
feeding.
DOI: https://doi.org/10.7554/eLife.45450.004
Video 2. Ant displaying food acceptance score 0.5. It
interrupts feeding within the first seconds of feeding
and repeatedly interrupts feeding, but still feeds at the
food source (an ant displaying food acceptance score 0
would refuse to feed at the sucrose solution and either
return to the nest immediately or fail to fill its crop
within 10 min).
DOI: https://doi.org/10.7554/eLife.45450.005
Wendt et al. eLife 2019;8:e45450. DOI: https://doi.org/10.7554/eLife.45450 5 of 22
Research article Ecology Evolutionary Biology
finishing all experimental runs, we waited for 15 min, then discarded it from the colony and moved
to the next ant.
Statistical analysisStatistical analyses were carried out in R v. 3.4.1 (R Development Core Team, 2016) using General-
ized Linear Mixed Models (GLMMs) in the LME4 package (Bates et al., 2014) to analyse pheromone
depositions data and Cumulative Link Mixed Models (CLMMs) in the ordinal package (Christen-
sen, 2015) to analyse food acceptance scores. CLMMs were used to analyse the acceptance data
since we used an ordered factor with three levels (1 = full acceptance, 0.5 = partial acceptance,
0 = rejection).
As multiple ants were tested per colony, colony identity was added as a random effect to each
model. GLMMs were tested for fit, dispersion and zero inflation using the DHARMa package (Har-
tig, 2017). The model predictors and interactions were defined a priori, following Forstmeier and
Schielzeth (2011). All p-values presented were corrected for multiple testing using the Benjamini–
Hochberg method (Benjamini and Hochberg, 1995). A total of 1070 ants were tested, with 829 in
experiment 1, 73 in experiment 2 and 168 in experiment 3 (Supplementary file 1). Sample sizes
were set ahead of time by deciding how much time we will invest in data collection (1 day per treat-
ment per colony).
Food acceptance dataDepending on the experiment, we either used treatment (experiment 1 and 3 = Reference Molarity;
experiment 2 = expected molarity triggered by a scented runway and the odours presented on the
runway) or an interaction between treatment and visit number, and the odours presented on the run-
way (training visits of experiment 2) or trophallaxis time (experiment 3) as fixed factors. The interac-
tion between expected molarity and visit number in the training runs of experiment 2 was added,
because experience with a food source is likely to affect the behaviour at a food source. The odours
presented on the runway were added as fixed factors to test for odour preferences regardless of
sucrose molarity. The interaction between trophallaxis time and reference molarity in experiment 3
was added because trophallaxis time may affect food acceptance through crop load and information
gained through trophallaxis (for the effects of trophallaxis time on food acceptance see Figure 5—
figure supplement 1, and Table S4 in Figure 5—source data 1). Because individual ants were
tested multiple times in experiments 1 and 2, we included AntID nested in colony as a random factor
for statistical analyses of the training visits.
We used the following general model formula (this formula varied depending on experiment as
described above):
FoodAcceptance~ treatmentþðrandom factor : colonyÞ
Pheromone deposition dataAs the pheromone deposition data is count data, they were analysed using a GLMM with a Poisson
distribution.
Depending on the experiment, we either used treatment (experiment 1 = Reference Molarity;
experiment 2 = expected molarity triggered by a scented runway and the odours presented on the
runway) or an interaction between treatment and visit number (training visits of experiment 2) as
fixed factors. The interaction between expected molarity and visit number in the training runs of
experiment 2 was added, because experience with a food source is likely to affect the behaviour at a
food source. The odours presented on the runway were added as fixed factors to test for odour
preferences regardless of sucrose molarity. Because individual ants were tested multiple times in
experiment 2, we included AntID nested in colony as a random factor for statistical analyses of the
training visits.
For statistical analysis of experiment 1, we also added a variable indicating if ants deposited
more or less pheromone compared to the average to correct for individual strength of pheromone
depositions and overdispersion. The variable was calculated as follows:
Wendt et al. eLife 2019;8:e45450. DOI: https://doi.org/10.7554/eLife.45450 6 of 22
Research article Ecology Evolutionary Biology
Difference to average¼ ððNumber Pheromone Depositions 1st visit �mean number Pheromone Depositions 1st visitÞ þ
ðNumber Pheromone Depositions 2nd visit�mean number Pheromone Depositions 2nd visitÞÞ = 2
We used the following model formulae in the model:
Experiment 1:
NumberPheromoneDepositions~ treatmentþDifference to average þðDifference to averageÞ2 þðrandom effects : colony = AntIDÞ
Experiment 2:
NumberPheromoneDepositions~ scent associated to molarityþðrandom effects : colonyÞ
Other analysesThe number of drinking interruptions was quantified via video analysis in experiment 2 (see below).
This was analysed statistically in a manner identical to number of pheromone depositions.
Trophallaxis time in seconds in experiment three were used in full seconds and treated as count
data. We performed a GLMM with Poisson distribution and Reference Molarity as a fixed effect,
while colony identity was added as a random factor:
TrophallaxisTimeseconds~ReferenceMolarityþðrandom effects : colonyÞ
Experiment 1 – Defining a relative value perception curveThe aim of this experiment was to test whether Lasius niger ants value a given absolute sucrose solu-
tion concentration relative to a reference point or based on its absolute value. We used a range of
twelve molarities as reference points in order to describe a value curve. To exclude effects of the
researcher’s expectations on the data, the data for this experiment were collected blind to treat-
ment (Holman et al., 2015).
Experiment 1 - MethodsAnts made two initial training visits to a feeder at the end of a runway in order to set their reference
point (Figure 1A). The quality of the sucrose solution was varied between ants, with each ant receiv-
ing the same quality twice successively. Twelve different molarities were used: 0.1, 0.2, 0.3, 0.4, 0.5,
0.6, 0.7, 0.8, 0.9, 1, 1.5 or 2M (also referred to as pre-shift solution or reference point). Lasius niger
workers learn the quality of a feeder within two visits (Wendt and Czaczkes, 2017). On the third visit
(test visit), the food source was replaced by a 0.5M sucrose solution droplet for all ants (also referred
to as post-shift solution). Thus, ants trained to qualities < 0.5M experienced a positive successive
contrast, ants trained to > 0.5M experienced a negative successive contrast, and the ants trained to
0.5M constituted the control (no contrast). 97% of ants successfully finished the training procedure
and participated in the test visit (third visit).
Experiment 1 - ResultsAnts seemed to value sucrose solution droplets relative to their reference point (Figure 2—figure
supplement 1). In the training visits, acceptance scores increased significantly with increasing molar-
ity of the reference quality (CLMM: estimate = 1.97, z = 9.65, p<0.001, Figure 2). However, in the
test (contrast) visit, acceptance scores decreased significantly with increasing molarity of the refer-
ence quality (CLMM: estimate = �2.59, z = �13.57, p<0.001, Figure 2). Ants which were trained to
the lowest molarity (0.1M: p<0.001) showed significantly higher acceptance of 0.5M sucrose than
control ants, while ants trained to high molarities (1.5M: p<0.001, 2M: p<0.001) showed lower
acceptance of 0.5M than the control group (see Table S1 in Figure 2—source data 1 for all pairwise
comparisons).
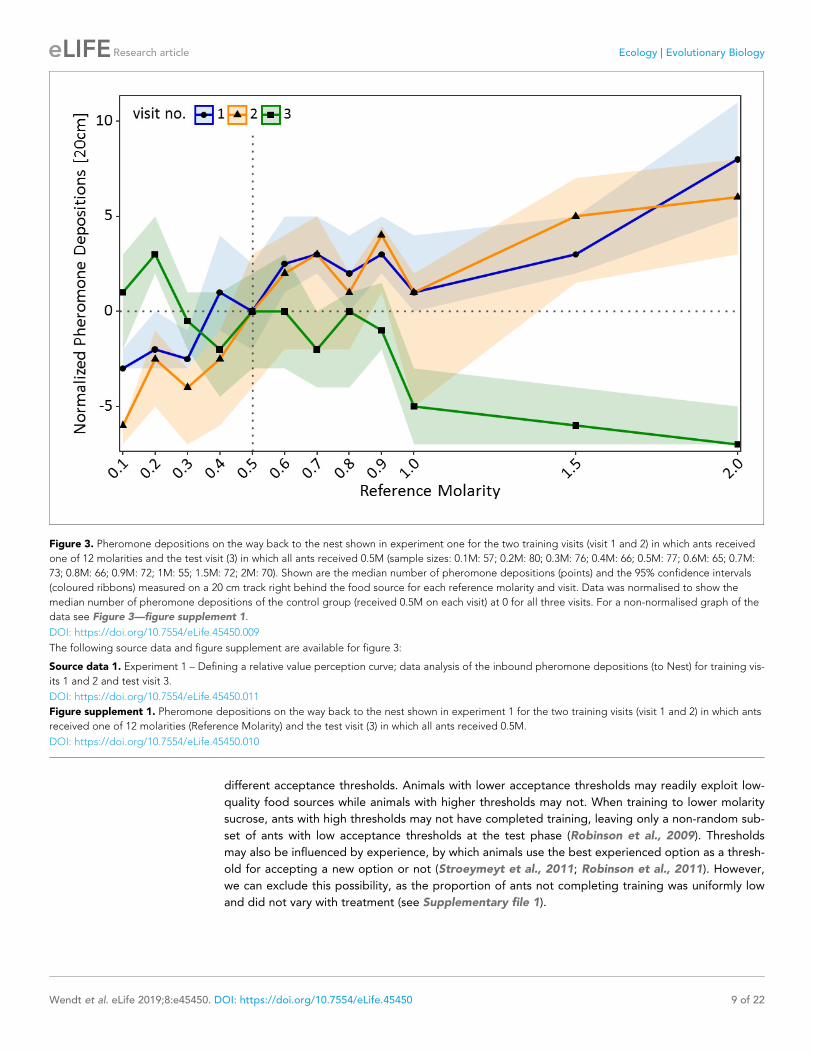
A similar pattern was found for pheromone deposition behaviour on the way back to the nest
(Figure 3). In the training visits, number of pheromone depositions increased significantly with
increasing molarity of the reference solution (GLMM: estimate = 0.86, z = 13.87, p<0.001). By con-
trast, on the test visit pheromone depositions decreased significantly with increasing molarity of the
reference solution (GLMM: estimate = �0.82, z = �9.75, p<0.001, Figure 3). Ants which deposited
Wendt et al. eLife 2019;8:e45450. DOI: https://doi.org/10.7554/eLife.45450 7 of 22
Research article Ecology Evolutionary Biology

more pheromone during the training visits generally deposited more pheromone on the test visit
compared to ants which deposited less pheromone during the training visits (GLMM: estimate = 0.16,
z = 15.99, p<0.001). Ants which were trained to a low molarity (0.2M: p<0.01) deposited significantly
more pheromone in the test visit than control ants, while ants trained to high molarities (1M:
p<0.001, 1.5M: p<0.001, 2M: p<0.001) deposited less pheromone than the control group (see Table
S2 in Figure 3—source data 1 for pairwise comparisons).
These results are consistent with relative value perception stemming from the psychological
effects of successive contrasts. We could further define a relative value perception curve similar to
that described in Prospect Theory, as well as showing positive contrast effects for both food accep-
tance and number of pheromone depositions.
However, there is another possible explanation for these results: non-random selection of individ-
uals with different acceptance thresholds. Different individuals from the same colony may have
Figure 2. Food acceptance shown in experiment one for the two training visits (visit 1 and 2) in which ants received one of 12 molarities and the test
visit (3) in which all ants received 0.5M (sample sizes: 0.1M: 57; 0.2M: 80; 0.3M: 76; 0.4M: 66; 0.5M: 77; 0.6M: 65; 0.7M: 73; 0.8M: 66; 0.9M: 72; 1M: 55;
1.5M: 72; 2M: 70). Shown are the mean food acceptance (points) and the 95% confidence intervals (coloured ribbons) for each reference molarity and
visit. Data was normalised to show the mean food acceptance of the control group (received 0.5M on each visit) at 0 for all three visits. For a non-
normalised graph of the data see Figure 2—figure supplement 1.
DOI: https://doi.org/10.7554/eLife.45450.006
The following source data and figure supplement are available for figure 2:
Source data 1. Experiment 1 – Defining a relative value perception curve; Data Analysis of the Food Acceptance scores for training visits 1 and 2 and
test visit 3.
DOI: https://doi.org/10.7554/eLife.45450.008
Figure supplement 1. Food acceptance shown in experiment one for the two training visits (visit 1 and 2) in which ants received one of 12 molarities
(Reference Molarity) and the test visit (3) in which all ants received 0.5M.
DOI: https://doi.org/10.7554/eLife.45450.007
Wendt et al. eLife 2019;8:e45450. DOI: https://doi.org/10.7554/eLife.45450 8 of 22
Research article Ecology Evolutionary Biology
different acceptance thresholds. Animals with lower acceptance thresholds may readily exploit low-
quality food sources while animals with higher thresholds may not. When training to lower molarity
sucrose, ants with high thresholds may not have completed training, leaving only a non-random sub-
set of ants with low acceptance thresholds at the test phase (Robinson et al., 2009). Thresholds
may also be influenced by experience, by which animals use the best experienced option as a thresh-
old for accepting a new option or not (Stroeymeyt et al., 2011; Robinson et al., 2011). However,
we can exclude this possibility, as the proportion of ants not completing training was uniformly low
and did not vary with treatment (see Supplementary file 1).
Figure 3. Pheromone depositions on the way back to the nest shown in experiment one for the two training visits (visit 1 and 2) in which ants received
one of 12 molarities and the test visit (3) in which all ants received 0.5M (sample sizes: 0.1M: 57; 0.2M: 80; 0.3M: 76; 0.4M: 66; 0.5M: 77; 0.6M: 65; 0.7M:
73; 0.8M: 66; 0.9M: 72; 1M: 55; 1.5M: 72; 2M: 70). Shown are the median number of pheromone depositions (points) and the 95% confidence intervals
(coloured ribbons) measured on a 20 cm track right behind the food source for each reference molarity and visit. Data was normalised to show the
median number of pheromone depositions of the control group (received 0.5M on each visit) at 0 for all three visits. For a non-normalised graph of the
data see Figure 3—figure supplement 1.
DOI: https://doi.org/10.7554/eLife.45450.009
The following source data and figure supplement are available for figure 3:
Source data 1. Experiment 1 – Defining a relative value perception curve; data analysis of the inbound pheromone depositions (to Nest) for training vis-
its 1 and 2 and test visit 3.
DOI: https://doi.org/10.7554/eLife.45450.011
Figure supplement 1. Pheromone depositions on the way back to the nest shown in experiment 1 for the two training visits (visit 1 and 2) in which ants
received one of 12 molarities (Reference Molarity) and the test visit (3) in which all ants received 0.5M.
DOI: https://doi.org/10.7554/eLife.45450.010
Wendt et al. eLife 2019;8:e45450. DOI: https://doi.org/10.7554/eLife.45450 9 of 22
Research article Ecology Evolutionary Biology
Experiment 2 – ruling out alternative explanations usingscent trainingAlternative hypotheses could also explain the results from experiment one and lead to the same
behavioural patterns observed. Five possible ‘lower-level’ mechanisms must be excluded: sensory
satiation, ingested sucrose changing haemolymph-sugar levels, psychophysical sensory contrast
effects, the fact that ants may expect pre-shift solutions to return in later visits, and non-random
selection of individuals with different food acceptance thresholds in different treatments.
Sensory satiationThis may occur in ants which were trained to higher molarity food due to the blocking of more
sweetness receptors compared to low molarity sucrose. The more sweetness receptors are blocked
by a sweet reference solution, the fewer receptors will fire when confronted with a post-shift reward,
thus making solutions taste less sweet for ants trained to high-molarity solutions, and sweeter for
ants which were trained to low molarities (Bitterman, 1976).
Haemolymph-sugar levelsAnts may not only have stored sucrose solutions in their crop while foraging, but may also have
ingested small amounts of it, leading to an increase of haemolymph-sugar levels. Higher blood-sugar
levels negatively affect sweetness perception in humans (Mayer-Gross and Walker, 1946;
Melanson et al., 1999), and a similar effect could cause a post-shift solution to taste less sweet to
animals trained on high sucrose concentrations.
Psychophysical sensory contrastsThe contrast effects shown in experiment one could also derive from simple psychophysical mecha-
nisms (Fechner, 1860; Zwislocki, 2009), and thus arise from sensory perceptual mechanisms rather
than higher level cognitive processing of value. Sensory judgements are usually made relative to ref-
erence points and through constant comparisons with former stimuli (Vlaev et al., 2011; Hel-
son, 1964). Thus, identical stimuli may be perceived differently depending on the context they are
presented within. The position of the reference point in the range of stimuli may thus bias how the
stimulus, and thus the value, of a post-shift reward is perceived (Zwislocki, 2009). For example, the
sweetness of a sucrose solution may be perceived as much stronger when the reference point to
which it is compared is low. Psychophysical sensory contrasts are physiological or low-level cognitive
phenomena, found in all animal taxa studied, and even potentially in bacteria (Akre and Johnsen,
2014; Kojadinovic et al., 2013; Mesibov et al., 1973).
Future expectationsAnimals may rationally expect the pre-shift reward to be available in the future again and therefore
rationally show lower acceptance towards the post-shift reward, because they are waiting for the
pre-shift reward to reoccur.
All these alternative factors would lead to the same behavioural patterns found in experiment
one without relative value perception necessarily being present. Experiment two was designed to
rule out these alternative explanations.
Experiment 2 - MethodsTo rule out the alternative non-psychological explanations for the contrast effects we described
above, we needed to change the expectations of the ants while exposing all ants to identical training
regimes. This would provide a reference point for testing relative value perception while keeping
sensory saturation, haemolymph-sugar levels, psychophysical effects, future expectations, and ant
subsets the same until the testing phase.
Ants were allowed to make eight training visits. The quality of the sucrose solution offered at the
end of the runway alternated each visit, always beginning with the low-quality solution. The solutions
were scented using either rosemary or lemon essential oils (0.05 ml essential oil per ml sucrose solu-
tion, rosemary: Rosmarinus officinalis; Lemon: Citrus limon, Markl GbR, Grunwald). In half the trials
the 1.5M solution was scented with lemon and the 0.25M with rosemary, and vice versa for the other
Wendt et al. eLife 2019;8:e45450. DOI: https://doi.org/10.7554/eLife.45450 10 of 22
Research article Ecology Evolutionary Biology
trials. In addition, to support learning and to allow solution quality anticipation, we also scented the
paper overlays covering the runway leading to the feeder. Paper overlays were scented by storing
them for at least 1 day in an airtight box containing a droplet of essential oil on filter paper in a pet-
ridish. Finally, in addition to odours cuing sucrose molarity, visual cues were also provided. These
consisted of printed and laminated pieces of paper (22 � 16.5 cm, displayed in Figure 1B) displayed
at the end of the runway, directly behind the sucrose droplet.
On the 9th (test) visit, the odour of the runway and the visual cue signified either 1.5M or 0.25M,
while the sucrose solution provided was unscented and of intermediate (0.5M) quality. Runway
scents in the test visit were varied systematically between ants, but each ant was confronted with
only one of the two runway scents coupled with unscented 0.5M sucrose. While the ant fed at the
sucrose droplet, the scented runway overlay was replaced with an unscented overlay in order to
eliminate possible effects of scent association on pheromone deposition behaviour. Previous work
has shown that L. niger foragers can form robust expectations of upcoming reward quality based on
runway odour after four visits to each odour/quality combination (Czaczkes et al., 2018b). Nonethe-
less, to ensure that learning had taken place, on the 10th visit, we carried out a memory probe. The
linear runway was replaced with a Y-maze (Figure 1B), with two 10 cm long arms and a 10 cm long
stem. The Y-maze stem was covered with an unscented paper overlay while one arm was covered
with the 1.5M-associated odour overlay, and the other with the 0.25M-associated odour overlay.
The matching visual cues were placed directly behind the relevant Y-maze arms. Trained ants were
allowed to walk onto the Y-maze and their arm choice was noted. We used two decision lines to
define arm choice – an initial decision line (Figure 1B, 2.5 cm after the bifurcation) and a final deci-
sion line (7.5 cm after the bifurcation). After testing on the Y-maze, the ants were permanently
removed from the colony.
97.2% of ants successfully finished the training procedure and participated in the last test visit.
Additionally to the other measures, on the 9th (test) visit of this experiment we counted the num-
ber of food interruptions made by an ant from the moment of first hitting the food source until it
had finished feeding at the sucrose droplet. The number of food interruptions are likely to reflect
and support the behaviour encoded in food acceptance scores and was thus investigated to give
stronger support for the results of this experiment.
Experiment 2 - ResultsDuring training, ants behaved as expected, showing higher acceptance and pheromone deposition
for 1.5M compared to 0.25M on all but the very first visit to 0.25M (Food acceptance: CLMM:
estimate = �7.34, z = �8.9, p<0.001; pheromone depositions outward journey: GLMM: esti-
mate = 0.23, z = 2.89, p<0.01; pheromone depositions inward journey: GLMM: estimate = �2.49,
z = �19.46, p<0.001, Figure 4A,C & E). Furthermore, food acceptance and pheromone depositions
both on the outward and inward journeys decreased with increasing experience with the 0.25M
feeder and increased with increasing experience with the 1.5M feeder (Food acceptance: CLMM:
estimate = �2.84, z = �3.63, p<0.001; pheromone depositions outward journey: GLMM:
estimate = �0.94, z = �10.00, p<0.001; pheromone depositions inward journey: GLMM:
estimate = �0.53, z = �4.41, p<0.001).
On the outward journey of the 9th (test) visit, ants walking towards the feeder while exposed to
1.5M sucrose-associated cues deposited more pheromone (median = 15, Figure 4D) compared to
ants exposed to 0.25M-associated cues (median = 2, GLMM: estimate = �1.31, z = �12.94,
p<0.001). Moreover, in the learning probe, 87% of ants chose the 1.5M associated arm. This demon-
strates that ants formed a robust expectation of food molarity based on the cues learned during
training.
Ants exposed to 1.5M-associated cues during the 9th visit showed significantly lower food accep-
tance towards the unscented 0.5M feeder than ants exposed to 0.25M-associated cues (CLMM: esti-
mate = 1.04, z = 2.049, p<0.05, Figure 4B, Supplementary file 1). Although ants exposed to high
molarity associated cues – presented through scented runways on the way to the food – showed a
significantly higher number of pheromone depositions on their return journey than ants confronted
with low molarity scent (GLMM: estimate = �1.65, z = �3.03, p<0.01, Figure 4E & F), the number
of pheromone depositions decreased drastically for both treatments compared to training visits
(median 1.5M = 0, median 0.25M = 0, Figure 4E and F, Supplementary file 1).
Wendt et al. eLife 2019;8:e45450. DOI: https://doi.org/10.7554/eLife.45450 11 of 22
Research article Ecology Evolutionary Biology

Figure 4. Food acceptance (A and B) and number of pheromone depositions towards the food source (C and D) and towards the nest (E and F) in
experiment 2. The left panels (A, C, E) show behaviour over the eight training trials, in which ants received 0.25M coupled with one scent and 1.5M
coupled with another scent on alternating visits. The right panels (B, D, F) show behaviour on the test visit, in which ants always received unscented
0.5M sucrose solution, but the runway leading towards the food source was impregnated with one of the learned scents, causing ants to expect either a
Figure 4 continued on next page
Wendt et al. eLife 2019;8:e45450. DOI: https://doi.org/10.7554/eLife.45450 12 of 22
Research article Ecology Evolutionary Biology
Even after controlling for alternative explanations, ants still show contrast effects depending on
the quality of the post shift solution. This is in spite of all ants undergoing identical training experien-
ces. The only difference between the groups was the odour of the runway on the 9th (test) visit. It is
thus unlikely that sensory saturation, increased haemolymph-sugar levels, simple psychophysical
effects or ants expecting pre-shift solutions to return can fully explain the behaviour of the ants in
our experiments. All videos were re-analysed by a naive scientific assistant and this blind analysis of
the ants behaviour confirmed the stated results (CLMM: estimate = 1.42, z = 2.35, p=0.019), and
also found that ants interrupted drinking significantly more often when expecting high rather than
low food qualities (GLMM, estimate = 0.36, z = 2.74, p=0.006, see Figure 4—figure supplement
1—source data 1 and Figure 4—figure supplement 1).
Non-random selection of individuals with different acceptance thresholds can also be excluded
for the results of this experiment as the proportion of ants not completing training was again uni-
formly low (see Supplementary file 1) and all ants had to taste both low and high molarities in order
to complete training.
Experiment 3 – expectation setting via trophallaxis: the nestas an information hubAnts receive information about available food sources, such as food odour and palatability, through
food exchanges (trophallaxis) inside the nest (Provecho and Josens, 2009; Josens et al., 2016). An
ant beginning a food scouting bout may not have direct information about the quality of the food
sources available in the environment, but nonetheless must make a value judgement on their first
visit to a food source. The aim of this experiment was to ascertain whether information about
sucrose concentrations gained through trophallaxis in the nest affected the perceived value of food
sources found outside the nest.
Figure 4 continued
high or low reward. 40 ants were induced to expect a high reward, and 32 to expect a low reward. A and B show the mean food acceptance (points)
and the 95% confidence intervals (error bars) for each visit; C – F show the median number of pheromone depositions on a 20 cm track leading to the
food source and the 75%/25% quantiles for each visit.
DOI: https://doi.org/10.7554/eLife.45450.012
The following source data and figure supplements are available for figure 4:
Source data 1. Experiment 2 – ruling out alternative explanations using scent training; data analysis of the food acceptance scores for training visits 1
to 8.
DOI: https://doi.org/10.7554/eLife.45450.015
Source data 2. Experiment 2 – ruling out alternative explanations using scent training; Data analysis of the food acceptance scores for test visit 9.
DOI: https://doi.org/10.7554/eLife.45450.016
Source data 3. Experiment 2 – ruling out alternative explanations using scent training; data analysis of the outbound pheromone depositions (to Food)
for training visits 1 to 8.
DOI: https://doi.org/10.7554/eLife.45450.017
Source data 4. Experiment 2 – ruling out alternative explanations using scent training; data analysis of the outbound pheromone depositions (to Food)
for test visit 9.
DOI: https://doi.org/10.7554/eLife.45450.018
Source data 5. Experiment 2 – ruling out alternative explanations using scent training; data analysis of the inbound pheromone depositions (to Nest)
for training visits 1 to 8.
DOI: https://doi.org/10.7554/eLife.45450.019
Source data 6. Experiment 2 – ruling out alternative explanations using scent training; data analysis of the inbound pheromone depositions (to Nest)
for test visit 9.
DOI: https://doi.org/10.7554/eLife.45450.020
Figure supplement 1. Number of food interruptions on the last (9th) visit depending on the ant’s expectations until the crop was filled.
DOI: https://doi.org/10.7554/eLife.45450.013
Figure supplement 1—source data 1. Experiment 2 – ruling out alternative explanations using scent training; data analysis of the drinking interruption
behaviour.
DOI: https://doi.org/10.7554/eLife.45450.014
Wendt et al. eLife 2019;8:e45450. DOI: https://doi.org/10.7554/eLife.45450 13 of 22
Research article Ecology Evolutionary Biology
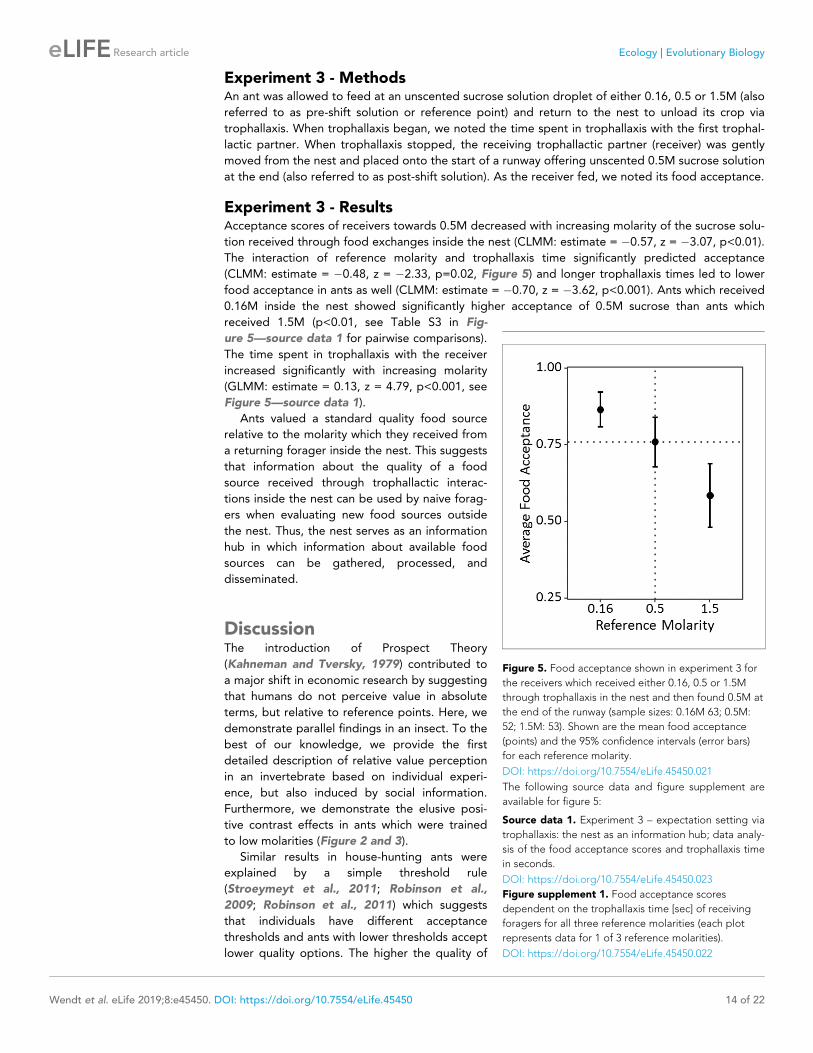
Experiment 3 - MethodsAn ant was allowed to feed at an unscented sucrose solution droplet of either 0.16, 0.5 or 1.5M (also
referred to as pre-shift solution or reference point) and return to the nest to unload its crop via
trophallaxis. When trophallaxis began, we noted the time spent in trophallaxis with the first trophal-
lactic partner. When trophallaxis stopped, the receiving trophallactic partner (receiver) was gently
moved from the nest and placed onto the start of a runway offering unscented 0.5M sucrose solution
at the end (also referred to as post-shift solution). As the receiver fed, we noted its food acceptance.
Experiment 3 - ResultsAcceptance scores of receivers towards 0.5M decreased with increasing molarity of the sucrose solu-
tion received through food exchanges inside the nest (CLMM: estimate = �0.57, z = �3.07, p<0.01).
The interaction of reference molarity and trophallaxis time significantly predicted acceptance
(CLMM: estimate = �0.48, z = �2.33, p=0.02, Figure 5) and longer trophallaxis times led to lower
food acceptance in ants as well (CLMM: estimate = �0.70, z = �3.62, p<0.001). Ants which received
0.16M inside the nest showed significantly higher acceptance of 0.5M sucrose than ants which
received 1.5M (p<0.01, see Table S3 in Fig-
ure 5—source data 1 for pairwise comparisons).
The time spent in trophallaxis with the receiver
increased significantly with increasing molarity
(GLMM: estimate = 0.13, z = 4.79, p<0.001, see
Figure 5—source data 1).
Ants valued a standard quality food source
relative to the molarity which they received from
a returning forager inside the nest. This suggests
that information about the quality of a food
source received through trophallactic interac-
tions inside the nest can be used by naive forag-
ers when evaluating new food sources outside
the nest. Thus, the nest serves as an information
hub in which information about available food
sources can be gathered, processed, and
disseminated.
DiscussionThe introduction of Prospect Theory
(Kahneman and Tversky, 1979) contributed to
a major shift in economic research by suggesting
that humans do not perceive value in absolute
terms, but relative to reference points. Here, we
demonstrate parallel findings in an insect. To the
best of our knowledge, we provide the first
detailed description of relative value perception
in an invertebrate based on individual experi-
ence, but also induced by social information.
Furthermore, we demonstrate the elusive posi-
tive contrast effects in ants which were trained
to low molarities (Figure 2 and 3).
Similar results in house-hunting ants were
explained by a simple threshold rule
(Stroeymeyt et al., 2011; Robinson et al.,
2009; Robinson et al., 2011) which suggests
that individuals have different acceptance
thresholds and ants with lower thresholds accept
lower quality options. The higher the quality of
Figure 5. Food acceptance shown in experiment 3 for
the receivers which received either 0.16, 0.5 or 1.5M
through trophallaxis in the nest and then found 0.5M at
the end of the runway (sample sizes: 0.16M 63; 0.5M:
52; 1.5M: 53). Shown are the mean food acceptance
(points) and the 95% confidence intervals (error bars)
for each reference molarity.
DOI: https://doi.org/10.7554/eLife.45450.021
The following source data and figure supplement are
available for figure 5:
Source data 1. Experiment 3 – expectation setting via
trophallaxis: the nest as an information hub; data analy-
sis of the food acceptance scores and trophallaxis time
in seconds.
DOI: https://doi.org/10.7554/eLife.45450.023
Figure supplement 1. Food acceptance scores
dependent on the trophallaxis time [sec] of receiving
foragers for all three reference molarities (each plot
represents data for 1 of 3 reference molarities).
DOI: https://doi.org/10.7554/eLife.45450.022
Wendt et al. eLife 2019;8:e45450. DOI: https://doi.org/10.7554/eLife.45450 14 of 22
Research article Ecology Evolutionary Biology
the option, the more often it exceeds the acceptance threshold of individual ants, and thus the
option is accepted more readily. This could have potentially affected our results in experiment 1, as
we would expect fewer individuals to accept very low reference points. Ants which did not accept
the low-quality sucrose would thus not be tested. Therefore, at low reference points, we would only
select individuals with very low acceptance thresholds, while no threshold selection would occur at
high reference points. When confronting ants with medium-quality food after training, the differently
selected acceptance thresholds may lead to the same pattern as we observed. However, 97% of all
ants finished both the training and the test phases and no higher proportion of cancelled training
can be seen at lower reference molarities (see Supplementary file 1). It is thus unlikely that a simple
threshold rule leads to the results shown in experiment 1 (Figure 2 and 3).
While a second major prediction of Prospect Theory, that ‘losses loom larger than gains’
(Tversky and Kahneman, 1992), is not supported by the data of our main experiment, it is also not
ruled out. We believe ants do overemphasise losses, but, due to limitations in the experimental
design and physiological limitations of the animals, we cannot make strong claims about this (Col-
lins, 1995; Dukas, 2005; Reid and Stamps, 1997). The lack of strong evidence for losses being
overemphasised may stem from the psychophysics of our study system: a basic tenant of psycho-
physics is that the Just Noticeable Difference (JNDs) between two stimuli is a function of the relative
difference between the stimuli (Fechner, 1860; Zwislocki, 2009; Stevens, 1957). Thus, ants shifted
from 0.1M to medium (0.5M) quality experience a fivefold increase in molarity, while those down-
shifted from 0.9M to 0.5M experience less than a twofold decrease, although the absolute change
was of the same magnitude. This would predict larger shift-changes, in terms of absolute molarity
change, for gains than for losses. Indeed, the fact that this is also not seen may imply that losses are
indeed – relatively speaking – looming larger than gains for the ants. Finally, it must be kept in mind
that acceptance scores are unlikely to be linear, and that pheromone deposition behaviour shows
large variation (Beckers et al., 1992), making it difficult to use either of these factors to quantita-
tively test for over- and undervaluation of gains and losses.
The results of experiment 2 allow us to exclude all but a cognitive relative value effect (Figure 4).
This cognitive effect is subjectively very familiar to humans, and its presence in an invertebrate is at
first glance surprising. However, insects have been shown to display many cognitive traits in parallel
with humans (Brosnan and De Waal, 2003; Aw et al., 2011; Premack and Hillix, 1962;
Dukas, 2005; Reid and Stamps, 1997), and contrast effects are likely selected for
(McNamara et al., 2013).
The smaller effect size in experiment two is presumably driven either by the exclusion of the addi-
tional driving factors (see experiment two description), or the additional complications involved in an
extensive training regime, or both. Specifically, the expectations leading to contrast effects in exper-
iment two were driven by differential learning of odour-quality associations, rather than a simple
one-component memory of food quality as may have been the case in experiment 1. This may have
weakened the observed effect.
Another possible explanation for smaller effect sizes may be that in experiment 2 ants had access
to two reference points (0.25M and 1.5M) to use for value judgement of the medium-quality food in
the control experiment, while in experiment 1 they only had one reference. Thus, while the odour
cue may have overemphasised the role of the associated quality as reference, the competing refer-
ence quality may have been acting as a second reference. Additional reference points are likely to
affect the scale post-shift rewards are compared to (Zwislocki, 2009). This possibility is supported
by the acceptance data collected during training in experiment 2. On the first training visit, all ants
encountered low quality food and showed a high food acceptance towards the feeder (Figure 4A).
However, as soon as ants had experienced a high-quality sucrose solution, the previously acceptable
low-quality food became unattractive, and food acceptance scores decreased from a mean of 0.99
to 0.39. This strongly suggests that the ants were valuing the training solutions in relation to each
other, and may therefore have used both reference points to judge the value of an unscented
medium-quality food source. It is possible that the ants may have calculated an average from both
reference points, and used the average as comparison to judge the value of the post-shift reward
(Flaherty, 1999), as shown in rats (Peters and McHose, 1974). However, the fact that medium qual-
ity elicited different food acceptance scores depending on the runway scent makes it unlikely that
this would be the only factor affecting acceptance scores.
Wendt et al. eLife 2019;8:e45450. DOI: https://doi.org/10.7554/eLife.45450 15 of 22
Research article Ecology Evolutionary Biology

Lastly, masking effects may also explain the smaller contrast effects of experiment 2 compared to
experiment 1: learning theory suggests that neutral cues associated to positive stimuli will elicit posi-
tive responses even when no reward is given and vice versa (Rescorla and Wagner, 1972). There-
fore, since ants were confronted with the scent associated to high-quality food, food acceptance
may have been affected by the scent itself, leading to an elevated food acceptance compared to
ants tested in experiment 1 which did not receive a positive cue, but only medium-quality food.
The reduced pheromone deposition seen in the final return in experiment 2 may be due to the
change in environment (scented runways to unscented runways) causing a disruption in recruitment
behaviour, perhaps due to generalisation decrement (Kimble, 1961; Capaldi, 1978) or neophobia
(Barnett, 1958; Johnson, 2000; Mitchell, 1976; Pliner and Loewen, 1997). Furthermore, since only
the scented paper overlays were replaced by unscented ones, but not the runways themselves, it is
possible that small portions of the odours were still present, driving the ants to deposit pheromone
according to the remaining odours, with higher deposition rates for the high-quality associated
odour. In a separate experiment, such pheromone deposition directly related to quality-associated
odours on runways was clearly demonstrated (Wendt and Czaczkes, 2019). This would explain why
pheromone depositions were higher for ants returning to the nest from a high molarity scent than in
ants returning from a low molarity scent.
Information about sucrose concentrations gained through trophallactic interactions inside the
nest can affect the way newly discovered food sources are valued outside the nest (Figure 5), as well
as providing other information (Provecho and Josens, 2009; Josens et al., 2016; LeBoeuf et al.,
2016). By taking into account information gained inside the nest, recruited workers are able to eval-
uate newly discovered food sources in relation to other food sources available in the environment.
Ants could thus forego food sources which are of lower quality than the average available food sour-
ces (Wendt and Czaczkes, 2017). Even though higher trophallaxis times led to lower acceptance
scores and trophallaxis times were higher at high reference molarities, this does not necessarily
imply that ants ingested more sucrose at higher references and were thus less hungry or motivated.
Higher sucrose solutions are more viscose and thus ants take longer to ingest the same amount of
sucrose compared to low molarities (Josens et al., 1998). If, however, more sucrose solution was
transferred between the returning forager and the recruit at longer trophallaxis times, it is likely that
information input increases and food acceptance decreases. The longer the trophallaxis time, the
more the recruit can fill its crop through trophallaxis and therefore the food acceptance may
decrease, because the recruit is less starved than an ant which showed a short trophallaxis time.
However, even if more food was transferred, the food acceptance scores are a measure of the first
assessment of ants at a food source, not the ingested volume. Thus, while some ants may have had
less space in their crop left, this may not necessarily affect the food acceptance score, while it is very
likely to affect ingested volume after trophallaxis. Additionally, if longer trophallaxis times lead to
more ingested sucrose solution, it is also more likely that a higher amount of information about the
past food quality is transferred. Thus, more transferred food during trophallaxis may have led to bet-
ter informed ants reaching the post-shift solution and thus stronger contrast effects. Since the data
shows clear effects of both trophallaxis time and reference solution on the food acceptance of 0.5M
sucrose, longer trophallaxis times cannot be the only factor driving the contrast effects found in this
experiment (see Figure 5—source data 1 and Figure 5—figure supplement 1). Even at high troph-
allaxis times, ants with a 0.16M reference showed no low food acceptance scores, unlike ants with
high reference solution after long trophallaxis times.
Ultimately, we see the nest serving as an information hub, in which information about currently
available food sources can be collected, synthesised, and fed back to outgoing foragers. Relative
value perception can therefore be expected to have strong effects not only on the individual behav-
iour of animals, but also on the collective behaviour of insect colonies. For example, colonies of
house-hunting ants developed an aversion towards mediocre nests when housed in high-quality
nests, but not when they were housed in low-quality nests. Such mediocre nests are then avoided
when colonies have to find a new nest site while newly discovered mediocre nests are readily
accepted (Stroeymeyt et al., 2011; Robinson et al., 2011). However, while in house-hunting the
reference resource is directly experienced by scouts only, we demonstrate that information brought
back to the nest can set a reference point for ants which have not directly experienced the resource
in situ.
Wendt et al. eLife 2019;8:e45450. DOI: https://doi.org/10.7554/eLife.45450 16 of 22
Research article Ecology Evolutionary Biology

A broad range of behaviours relevant to behavioural economics have been described in inverte-
brates (Czaczkes et al., 2018a; Pompilio et al., 2006; Wendt and Czaczkes, 2017; Czaczkes et al.,
2018b; Cheng et al., 2002). We propose that invertebrates make attractive models for a broader
understanding of behavioural economics in humans. The benefits of an interdisciplinary approach
will likely flow both ways. Using animal models allows researchers to avoid pitfalls associated with
studies on humans, such as cultural and educational differences (Carter and Irons, 1991;
Guiso et al., 2006), second-guessing of experimenters, and non-relevant reward sizes (Levitt and
List, 2007) as well as relaxing ethical concerns. The game-like designs of many economic experi-
ments are highly artificial and the incentive magnitudes that can be provided are limited
(Kahneman and Tversky, 1979; Levitt and List, 2007). While there has been much progress in field
studies on humans to clearly measure causal relationships (Harrison and List, 2004), the usefulness
of these new techniques is constrained by the range of questions and settings to which they can be
applied. Hence, while behavioural studies on invertebrates also have their limitations (for example,
in that inducing expectations is more of a challenge), they can be easily designed to be ecologically
meaningful, and offer rewards which are in line with the real-life budgets under which the animals
operate. Finally, due to human complexity, building economic models which accurately predict
human behaviour is challenging. Insect economic behaviours are demonstrably similar to that of
humans, but likely simpler. We therefore propose that economic models to predict invertebrate
decision making may be a complementary step on the way to predicting human behaviour.
There is a well-developed tradition of integrating economics and biology (Aw et al., 2011;
Czaczkes et al., 2018a; Lydall et al., 2010; Aw et al., 2009; Wendt and Czaczkes, 2017;
Cheng et al., 2002; Evans and Westergaard, 2006). Here we provide a systematic description of
value judgment relative to a reference point in ants, define a relative value curve as described in
Prospect Theory, and provide some of the first strong evidence for a purely cognitive element to rel-
ative value judgement. Reference points can not only be set by individual experiences but also
through social information such as pheromone trails or through trophallactic contacts inside the
nest. We feel a critical mass of evidence is now available to consider comparative behavioural eco-
nomics as a relevant discipline for both biologists and economists.
AcknowledgementsWe thank Flavio Roces for helpful comments on this work, Florian Hartig for advice concerning statis-
tical analysis of our data, and Nathalie Stroeymeyt, Stephen Pratt, and an anonymous reviewer for
comments on an earlier version of this manuscript. We also thank the DFG (Deutsche Forschungsge-
meinschaft) which funded SW and TJC with an Emmy Noether grant to TJC, grant number CZ 237/
1–1.
Additional information
Funding
Funder Grant reference number Author
Deutsche Forschungsge-meinschaft
Emmy-Noether-Grant(Grant number CZ 237/1-1)
Stephanie WendtTomer J Czaczkes
The funders had no role in study design, data collection and interpretation, or the
decision to submit the work for publication.
Author contributions
Stephanie Wendt, Conceptualization, Data curation, Formal analysis, Validation, Investigation,
Methodology, Writing—original draft, Writing—review and editing; Kim S Strunk, Andreas Roider,
Validation, Writing—review and editing; Jurgen Heinze, Resources, Validation, Writing—review and
editing; Tomer J Czaczkes, Conceptualization, Resources, Formal analysis, Supervision, Funding
acquisition, Validation, Methodology, Writing—original draft, Project administration, Writing—
review and editing
Wendt et al. eLife 2019;8:e45450. DOI: https://doi.org/10.7554/eLife.45450 17 of 22
Research article Ecology Evolutionary Biology

Author ORCIDs
Stephanie Wendt https://orcid.org/0000-0002-8950-2845
Kim S Strunk https://orcid.org/0000-0002-2896-814X
Tomer J Czaczkes https://orcid.org/0000-0002-1350-4975
Ethics
Animal experimentation: All animal treatment guidelines applicable to ants under German law have
been followed.
Decision letter and Author response
Decision letter https://doi.org/10.7554/eLife.45450.029
Author response https://doi.org/10.7554/eLife.45450.030
Additional filesSupplementary files. Supplementary file 1. Sample sizes, mean food acceptance and median pheromone depositions
(inward and outward journeys) for the test visits of each experiment and treatment.
DOI: https://doi.org/10.7554/eLife.45450.024
. Transparent reporting form
DOI: https://doi.org/10.7554/eLife.45450.025
Data availability
Raw data has been deposited on Dryad, https://doi.org/10.5061/dryad.77q6s30. Videos of food
acceptance scores and other supplementary data such as statistical analyses have been uploaded as
online supplementary files.
The following dataset was generated:
Author(s) Year Dataset title Dataset URLDatabase andIdentifier
Wendt S, StrunkKS, Heinze JPD,Roider APD,Czaczkes TJD
2019 Data from: Positive and negativeincentive contrasts lead to relativevalue perception in ants
https://dx.doi.org/10.5061/dryad.77q6s30
Dryad DigitalRepository, 10.5061/dryad.77q6s30
ReferencesAkre KL, Johnsen S. 2014. Psychophysics and the evolution of behavior. Trends in Ecology & Evolution 29:291–300. DOI: https://doi.org/10.1016/j.tree.2014.03.007, PMID: 24726346
Aw JM, Holbrook RI, Burt de Perera T, Kacelnik A. 2009. State-dependent valuation learning in fish: bandedtetras prefer stimuli associated with greater past deprivation. Behavioural Processes 81:333–336. DOI: https://doi.org/10.1016/j.beproc.2008.09.002, PMID: 18834933
Aw JM, Vasconcelos M, Kacelnik A. 2011. How costs affect preferences: experiments on state dependence,hedonic state and within-trial contrast in starlings. Animal Behaviour 81:1117–1128. DOI: https://doi.org/10.1016/j.anbehav.2011.02.015
Barnett SA. 1958. Experiments on neophobia in wild and laboratory rats. British Journal of Psychology 49:195–201. DOI: https://doi.org/10.1111/j.2044-8295.1958.tb00657.x, PMID: 13572791
Bates D, Machler M, Bolker B, Walker S. 2014. Fitting linear Mixed-Effects models using lme4. arXiv. http://arxiv.org/abs/1406.5823.
Beckers R, Deneubourg JL, Goss S. 1992. Trail laying behaviour during food recruitment in the antLasius Niger(L.). Insectes Sociaux 39:59–72. DOI: https://doi.org/10.1007/BF01240531
Beckers R, Deneubourg JL, Goss S. 1993. Modulation of trail laying in the antLasius Niger (Hymenoptera:formicidae) and its role in the collective selection of a food source. Journal of Insect Behavior 6:751–759.DOI: https://doi.org/10.1007/BF01201674
Benjamini Y, Hochberg Y. 1995. Controlling the false discovery rate: a practical and powerful approach tomultiple testing. Journal of the Royal Statistical Society: Series B 57:289–300. DOI: https://doi.org/10.1111/j.2517-6161.1995.tb02031.x
Bentosela M, Jakovcevic A, Elgier AM, Mustaca AE, Papini MR. 2009. Incentive contrast in domestic dogs (Canisfamiliaris). Journal of Comparative Psychology 123:125–130. DOI: https://doi.org/10.1037/a0013340, PMID: 19450019
Wendt et al. eLife 2019;8:e45450. DOI: https://doi.org/10.7554/eLife.45450 18 of 22
Research article Ecology Evolutionary Biology

Bitterman ME. 1976. Incentive contrast in honey bees. Science 192:380–382. DOI: https://doi.org/10.1126/science.1257773, PMID: 1257773
Black RW. 1968. Shifts in magnitude of reward and contrast effects in instrumental and selective learning: areinterpretation. Psychological Review 75:114–126. DOI: https://doi.org/10.1037/h0025563, PMID: 4870549
Bower GH. 1961. A contrast effect in differential conditioning. Journal of Experimental Psychology 62:196–199.DOI: https://doi.org/10.1037/h0048109
Boyce CJ, Brown GD, Moore SC. 2010. Money and happiness: rank of income, not income, affects lifesatisfaction. Psychological Science 21:471–475. DOI: https://doi.org/10.1177/0956797610362671,PMID: 20424085
Brosnan SF, De Waal FB. 2003. Monkeys reject unequal pay. Nature 425:297–299. DOI: https://doi.org/10.1038/nature01963, PMID: 13679918
Campbell PE, Crumbaugh CM, Knouse SB, Snodgrass ME. 1970. A test of the “;ceiling effect”; hypothesis ofpositive contrast. Psychonomic Science 20:17–18. DOI: https://doi.org/10.3758/BF03335577
Capaldi ED. 1978. Effects of changing alley color on the successive negative contrast effect. Bulletin of thePsychonomic Society 12:69–70. DOI: https://doi.org/10.3758/BF03329628
Capaldi EJ, Lynch D. 1967. Repeated shifts in reward magnitude: evidence in favor of an associational andabsolute (noncontextual) interpretation. Journal of Experimental Psychology 75:226–235. DOI: https://doi.org/10.1037/h0024986, PMID: 6062963
Carter JR, Irons MD. 1991. Are economists different, and if so, why? Journal of Economic Perspectives 5:171–177. DOI: https://doi.org/10.1257/jep.5.2.171
Cheng K, Pena J, Porter MA, Irwin JD. 2002. Self-control in honeybees. Psychonomic Bulletin & Review 9:259–263. DOI: https://doi.org/10.3758/BF03196280, PMID: 12120787
Christensen RHB. 2015. ordinal: Regression Models for Ordinal Data. R Package Version. 28. http://www.cran.r-project.org/package=ordinal/
Collins SA. 1995. The effect of recent experience on female choice in zebra finches. Animal Behaviour 49:479–486. DOI: https://doi.org/10.1006/anbe.1995.0062
Couvillon PA, Bitterman ME. 1984. The overlearning-extinction effect and succeessive contrasts in honeybees.Journal of Comparative Psychology 98:100–109. DOI: https://doi.org/10.1037//0735-7036.98.1.100
Crespi LP. 1942. Quantitative variation of incentive and performance in the white rat. The American Journal ofPsychology 55:467–517. DOI: https://doi.org/10.2307/1417120
Czaczkes TJ, Gruter C, Ellis L, Wood E, Ratnieks FL. 2013. Ant foraging on complex trails: route learning and therole of trail pheromones in Lasius Niger. The Journal of Experimental Biology 216:188–197. DOI: https://doi.org/10.1242/jeb.076570, PMID: 22972897
Czaczkes TJ, Gruter C, Ratnieks FL. 2015. Trail pheromones: an integrative view of their role in social insectcolony organization. Annual Review of Entomology 60:581–599. DOI: https://doi.org/10.1146/annurev-ento-010814-020627, PMID: 25386724
Czaczkes TJ, Brandstetter B, di Stefano I, Heinze J. 2018a. Greater effort increases perceived value in aninvertebrate. Journal of Comparative Psychology 132:200–209. DOI: https://doi.org/10.1037/com0000109,PMID: 29504773
Czaczkes TJ, Koch A, Frober K, Dreisbach G. 2018b. Voluntary switching in an invertebrate: the effect of cue andreward change. Journal of Experimental Psychology: Animal Learning and Cognition 44:247–257. DOI: https://doi.org/10.1037/xan0000171
Devigne C, Detrain C. 2002. Collective exploration and area marking in the ant lasius niger. Insectes Sociaux 49:357–362. DOI: https://doi.org/10.1007/PL00012659
Dukas R. 2005. Learning affects mate choice in female fruit flies. Behavioral Ecology 16:800–804. DOI: https://doi.org/10.1093/beheco/ari057
Dunham PJ. 1968. Contrasted conditions of reinforcement. A selective critique. Psychological Bulletin 69:295–315. DOI: https://doi.org/10.1037/h0025690, PMID: 4873054
Dussutour A, Fourcassie V, Helbing D, Deneubourg JL. 2004. Optimal traffic organization in ants under crowdedconditions. Nature 428:70–73. DOI: https://doi.org/10.1038/nature02345, PMID: 14999281
Evans TA, Westergaard GC. 2006. Self-control and tool use in tufted capuchin monkeys (Cebus apella). Journalof Comparative Psychology 120:163–166. DOI: https://doi.org/10.1037/0735-7036.120.2.163, PMID: 16719595
Fechner GT. 1860. Elemente Der Psychophysik [Elements of Psychophysics]. Leipzig, Germany: Breitkopf undHartel.
Flaherty CF. 1982. Incentive contrast: a review of behavioral changes following shifts in reward. Animal Learning& Behavior 10:409–440. DOI: https://doi.org/10.3758/BF03212282
Flaherty CF, Becker HC, Pohorecky L. 1985. Correlation of corticosterone elevation and negative contrast variesas a function of postshift day. Animal Learning & Behavior 13:309–314. DOI: https://doi.org/10.3758/BF03200025
Flaherty CF. 1999. Incentive Relativity. Cambridge University Press.Forstmeier W, Schielzeth H. 2011. Cryptic multiple hypotheses testing in linear models: overestimated effectsizes and the winner’s curse. Behavioral Ecology and Sociobiology 65:47–55. DOI: https://doi.org/10.1007/s00265-010-1038-5, PMID: 21297852
Guiso L, Sapienza P, Zingales L. 2006. Does culture affect economic outcomes? Journal of Economic Perspectives20:23–48. DOI: https://doi.org/10.1257/jep.20.2.23
Hangartner W. 1970. Control of pheromone quantity in odor trails of the ant acanthomyops interjectus MAYR.Experientia 26:664–665. DOI: https://doi.org/10.1007/BF01898753, PMID: 5424358
Wendt et al. eLife 2019;8:e45450. DOI: https://doi.org/10.7554/eLife.45450 19 of 22
Research article Ecology Evolutionary Biology

Harrison GW, List JA. 2004. Field experiments. Journal of Economic Literature 42:1009–1055. DOI: https://doi.org/10.1257/0022051043004577
Hartig F. 2017. Residual Diagnostics for Hierarchical (Multi-Level / Mixed) Regression Models. http://florianhartig.github.io/DHARMa/
Healey CIM, Pratt SC. 2008. The effect of prior experience on nest site evaluation by the ant temnothoraxcurvispinosus. Animal Behaviour 76:893–899. DOI: https://doi.org/10.1016/j.anbehav.2008.02.016
Helson H. 1964. Adaptation-Level Theory: An Experimental and Systematic Approach to Behavior. New York:Harper and Row.
Holman L, Head ML, Lanfear R, Jennions MD. 2015. Evidence of experimental bias in the life sciences: why weneed blind data recording. PLOS Biology 13:e1002190. DOI: https://doi.org/10.1371/journal.pbio.1002190,PMID: 26154287
Johnson E. 2000. Food-neophobia in semi-free ranging rhesus macaques: effects of food limitation and foodsource. American Journal of Primatology 50:25–35. DOI: https://doi.org/10.1002/(SICI)1098-2345(200001)50:1<25::AID-AJP3>3.0.CO;2-D, PMID: 10588433
Josens R, Farina WM, Josens RB. 1998. Nectar feeding by the ant camponotus mus: intake rate and crop fillingas a function of sucrose concentration. Journal of Insect Physiology 44:579–585. PMID: 12769940
Josens R, Mattiacci A, Lois-Milevicich J, Giacometti A. 2016. Food information acquired socially overridesindividual food assessment in ants. Behavioral Ecology and Sociobiology 70:2127–2138. DOI: https://doi.org/10.1007/s00265-016-2216-x
Josens RB, Roces F. 2000. Foraging in the ant camponotus mus: nectar-intake rate and crop filling depend oncolony starvation. Journal of Insect Physiology 46:1103–1110. DOI: https://doi.org/10.1016/S0022-1910(99)00220-6, PMID: 10817836
Kahneman D, Tversky A. 1979. Prospect theory: an analysis of decision under risk. Econometrica 47:263–291.DOI: https://doi.org/10.2307/1914185
Kimble GA. 1961. Hilgard and Marquis’ “Conditioning and Learning”. East Norwalk, CT US: Appleton-Century-Crofts.
Kojadinovic M, Armitage JP, Tindall MJ, Wadhams GH. 2013. Response kinetics in the complex chemotaxissignalling pathway of rhodobacter sphaeroides. Journal of the Royal Society Interface 10:20121001.DOI: https://doi.org/10.1098/rsif.2012.1001, PMID: 23365194
LeBoeuf AC, Waridel P, Brent CS, Goncalves AN, Menin L, Ortiz D, Riba-Grognuz O, Koto A, Soares ZG, PrivmanE, Miska EA, Benton R, Keller L. 2016. Oral transfer of chemical cues, growth proteins and hormones in socialinsects. eLife 5:e20375. DOI: https://doi.org/10.7554/eLife.20375, PMID: 27894417
Levitt SD, List JA. 2007. What do laboratory experiments measuring social preferences reveal about the realworld? Journal of Economic Perspectives 21:153–174. DOI: https://doi.org/10.1257/jep.21.2.153
Lydall ES, Gilmour G, Dwyer DM. 2010. Rats place greater value on rewards produced by high effort: an animalanalogue of the “effort justification” effect. Journal of Experimental Social Psychology 46:1134–1137.DOI: https://doi.org/10.1016/j.jesp.2010.05.011
Mailleux AC, Detrain C, Deneubourg JL. 2006. Starvation drives a threshold triggering communication. Journalof Experimental Biology 209:4224–4229. DOI: https://doi.org/10.1242/jeb.02461, PMID: 17050837
Mankiw NG. 2011. Principles of Economics. South-Western College Pub.Mayer-Gross W, Walker JW. 1946. Taste and selection of food in hypoglycaemia. British Journal of ExperimentalPathology 27:297–305. PMID: 20279214
McNamara JM, Fawcett TW, Houston AI. 2013. An adaptive response to uncertainty generates positive andnegative contrast effects. Science 340:1084–1086. DOI: https://doi.org/10.1126/science.1230599,PMID: 23723234
Melanson KJ, Westerterp-Plantenga MS, Campfield LA, Saris WH. 1999. Blood glucose and meal patterns intime-blinded males, after aspartame, carbohydrate, and fat consumption, in relation to sweetness perception.British Journal of Nutrition 82:437–446. DOI: https://doi.org/10.1017/S0007114599001695, PMID: 10690159
Mesibov R, Ordal GW, Adler J. 1973. The range of attractant concentrations for bacterial chemotaxis and thethreshold and size of response over this range. Weber law and related phenomena. The Journal of GeneralPhysiology 62:203–223. DOI: https://doi.org/10.1085/jgp.62.2.203, PMID: 4578974
Mitchell D. 1976. Experiments on neophobia in wild and laboratory rats: a reevaluation. Journal of Comparativeand Physiological Psychology 90:190–197. DOI: https://doi.org/10.1037/h0077196, PMID: 1249271
Mustaca AE, Bentosela M, Papini MR. 2000. Consummatory successive negative contrast in mice. Learning andMotivation 31:272–282. DOI: https://doi.org/10.1006/lmot.2000.1055
Oberhauser FB, Czaczkes TJ. 2018. Tasting the unexpected: disconfirmation of expectations leads to lowerperceived food value in an invertebrate. Biology Letters 14:20180440. DOI: https://doi.org/10.1098/rsbl.2018.0440, PMID: 30185610
Papini MR, Ludvigson HW, Huneycutt D, Boughner RL. 2001. Apparent incentive contrast effects in autoshapingwith rats. Learning and Motivation 32:434–456. DOI: https://doi.org/10.1006/lmot.2001.1088
Parducci A. 1984. Value Judgments: Toward a Relational Theory of Happiness. In: Eiser J. R (Ed). AttitudinalJudgment. New York: Springer. p. 3–21.
Pellegrini S, Mustaca A. 2000. Consummatory Successive Negative Contrast with Solid Food. Learning andMotivation 31:200–209. DOI: https://doi.org/10.1006/lmot.2000.1052
Peters DP, McHose JH. 1974. Effects of varied preshift reward magnitude on successive negative contrast effectsin rats. Journal of Comparative and Physiological Psychology 86:85–95. DOI: https://doi.org/10.1037/h0035963
Wendt et al. eLife 2019;8:e45450. DOI: https://doi.org/10.7554/eLife.45450 20 of 22
Research article Ecology Evolutionary Biology

Pliner P, Loewen ER. 1997. Temperament and food neophobia in children and their mothers. Appetite 28:239–254. DOI: https://doi.org/10.1006/appe.1996.0078, PMID: 9218097
Pompilio L, Kacelnik A, Behmer ST. 2006. State-dependent learned valuation drives choice in an invertebrate.Science 311:1613–1615. DOI: https://doi.org/10.1126/science.1123924, PMID: 16543461
Premack D, Hillix WA. 1962. Evidence for shift effects in the consummatory response. Journal of ExperimentalPsychology 63:284–288. DOI: https://doi.org/10.1037/h0039368, PMID: 14488594
Provecho Y, Josens R. 2009. Olfactory memory established during trophallaxis affects food search behaviour inants. Journal of Experimental Biology 212:3221–3227. DOI: https://doi.org/10.1242/jeb.033506, PMID: 19801426
R Development Core Team. 2016. R: A language and environment for statistical computing . Vienna, Austria: RFoundation for Statistical Computing. https://www.R-project.org
Reid ML, Stamps JA. 1997. Female mate choice tactics in a resource-based mating system: field tests ofalternative models. The American Naturalist 150:98–121. DOI: https://doi.org/10.1086/286058, PMID: 18811277
Rescorla RA, Wagner AR. 1972. A Theory of Pavlovian Conditioning: Variations in the Effectiveness ofReinforcement and Nonreinforcement. In: Black A. H, Prokasky W. F (Eds). Classical Conditioning II: CurrentResearch and Theory. New York: Appleton Century Crofts. p. 64–99.
Richter MR, Waddington KD. 1993. Past foraging experience influences honey bee dance behaviour. AnimalBehaviour 46:123–128. DOI: https://doi.org/10.1006/anbe.1993.1167
Robinson EJH, Smith FD, Sullivan KME, Franks NR. 2009. Do ants make direct comparisons? Proceedings of theRoyal Society B: Biological Sciences 276:2635–2641. DOI: https://doi.org/10.1098/rspb.2009.0350
Robinson EJ, Franks NR, Ellis S, Okuda S, Marshall JA. 2011. A simple threshold rule is sufficient to explainsophisticated collective decision-making. PLOS ONE 6:e19981. DOI: https://doi.org/10.1371/journal.pone.0019981, PMID: 21629645
Roces F. 1993. Both evaluation of resource quality and speed of recruited leaf-cutting ants (Acromyrmex lundi)depend on their motivational state. Behavioral Ecology and Sociobiology 33:183–189. DOI: https://doi.org/10.1007/BF00216599
Roces F, Nunez JA. 1993. Information about food quality influences load-size selection in recruited leaf-cuttingants. Animal Behaviour 45:135–143. DOI: https://doi.org/10.1006/anbe.1993.1012
Schuck-Paim C, Pompilio L, Kacelnik A. 2004. State-dependent decisions cause apparent violations of rationalityin animal choice. PLOS Biology 2:e402. DOI: https://doi.org/10.1371/journal.pbio.0020402, PMID: 15550984
Stevens SS. 1957. On the psychophysical law. Psychological Review 64:153–181. DOI: https://doi.org/10.1037/h0046162, PMID: 13441853
Stroeymeyt N, Robinson EJH, Hogan PM, Marshall JAR, Giurfa M, Franks NR. 2011. Experience-dependentflexibility in collective decision making by house-hunting ants. Behavioral Ecology 22:535–542. DOI: https://doi.org/10.1093/beheco/arr007
Tinklepaugh OL. 1928. An experimental study of representative factors in monkeys. Journal of ComparativePsychology 8:197–236. DOI: https://doi.org/10.1037/h0075798
Tversky A, Kahneman D. 1974. Judgment under uncertainty: heuristics and biases. Science 185:1124–1131.DOI: https://doi.org/10.1126/science.185.4157.1124, PMID: 17835457
Tversky A, Kahneman D. 1981. The framing of decisions and the psychology of choice. Science 211:453–458.DOI: https://doi.org/10.1126/science.7455683, PMID: 7455683
Tversky A, Kahneman D. 1992. Advances in prospect theory: cumulative representation of uncertainty. Journal ofRisk and Uncertainty 5:297–323. DOI: https://doi.org/10.1007/BF00122574
Ungemach C, Stewart N, Reimers S. 2011. How incidental values from the environment affect decisions aboutmoney, risk, and delay. Psychological Science 22:253–260. DOI: https://doi.org/10.1177/0956797610396225,PMID: 21228134
Vlaev I, Chater N, Stewart N, Brown GD. 2011. Does the brain calculate value? Trends in Cognitive Sciences 15:546–554. DOI: https://doi.org/10.1016/j.tics.2011.09.008, PMID: 21983149
Vogel JR, Mikulka PJ, Spear NE. 1968. Effects of shifts in sucrose and saccharine concentrations on lickingbehavior in the rat. Journal of Comparative and Physiological Psychology 66:661–666. DOI: https://doi.org/10.1037/h0026556, PMID: 5721493
von Neumann J, Morgenstern O. 1944. Theory of Games and Economic Behavior. Princeton, NJ: PrincetonUniversity Press.
Wagner WE, Smeds MR, Wiegmann DD. 2001. Experience affects female responses to male song in the variablefield cricket gryllus lineaticeps (Orthoptera, gryllidae). Ethology 107:769–776. DOI: https://doi.org/10.1046/j.1439-0310.2001.00700.x
Weinstein L. 1970a. Negative incentive contrast effects with saccharin vs sucrose and partial reinforcement.Psychonomic Science 21:276–278. DOI: https://doi.org/10.3758/BF03330713
Weinstein L. 1970b. Negative incentive contrast with sucrose. Psychonomic Science 19:13–14. DOI: https://doi.org/10.3758/BF03335483
Wendt S, Czaczkes TJ. 2017. Individual ant workers show self-control. Biology Letters 13:20170450. DOI: https://doi.org/10.1098/rsbl.2017.0450, PMID: 29021315
Wendt S, Czaczkes TJ. 2019. Labelling effect in insects: cue associations influence perceived food value in ant.bioRxiv. DOI: https://doi.org/10.1101/680959
Zwislocki JJ. 2009. Sensory Neuroscience: Four Laws of Psychophysics. United States: Springer. DOI: https://doi.org/10.1007/978-0-387-84849-5
Wendt et al. eLife 2019;8:e45450. DOI: https://doi.org/10.7554/eLife.45450 21 of 22
Research article Ecology Evolutionary Biology

Wendt et al. eLife 2019;8:e45450. DOI: https://doi.org/10.7554/eLife.45450 22 of 22
Research article Ecology Evolutionary Biology