positiv ewar or - treng oding - brown university
TRANSCRIPT

Articleshttps://doi.org/10.1038/s41562-019-0597-3
1Department of Cognitive, Linguistic, and Psychological Sciences, Brown University, Providence, RI, USA. 2Department of Neuroscience, Brown University, Providence, RI, USA. 3Robert J. and Nancy D. Carney Institute for Brain Science, Brown University, Providence, RI, USA. 4Center for Depression, Anxiety and Stress Research, McLean Hospital, Belmont, MA, USA. 5Harvard Medical School, Boston, MA, USA. 6These authors contributed equally: Anthony I. Jang, Matthew R. Nassar. *e-mail: [email protected]
Behaviours are often informed by multiple types of memory. For example, a decision about what to eat for lunch might not only rely on average preferences that have been slowly learned
over time and that aggregate over many previous experiences, but also be informed by specific, temporally precise memories (for example, ingredients seen in the fridge on the previous day). These different types of memory prioritize distinct aspects of experience. Reinforcement learning typically accumulates information across relevant experiences to form general preferences that are used to guide behaviour1, whereas episodic memories allow access to details about specific, previously experienced events with limited interference from other, similar occurrences. Work from neuroim-aging and computational modelling suggests that these two types of memory have different representational requirements and are probably subserved by anatomically distinct brain systems2–4. In particular, a broad array of evidence suggests that reinforcement learning is implemented through cortico-striatal circuitry in the prefrontal cortex and basal ganglia5–8, whereas episodic memory seems to rely on synaptic changes in temporal lobe structures, espe-cially the hippocampus9–15.
However, these two anatomical systems are not completely inde-pendent. Medial temporal areas provide direct inputs into striato-cortical regions16–18, and both sets of structures receive shared information through common intermediaries5–8,19. Furthermore, both systems receive neuromodulatory inputs that undergo con-text-dependent fluctuations that can affect synaptic plasticity and alter information processing20,21. Recent work in computational neuroscience has highlighted potential roles for neuromodulators—particularly dopamine—in implementing reinforcement learning. In particular, dopamine is thought to supply a reward prediction error (RPE) signal that gates Hebbian plasticity in the striatum, facilitating the repetition of rewarding actions5,6,22–24. In humans and untrained animals, dopamine RPE signals are observed in response to unexpected primary rewards17. But with experience, dopamine
signals become associated with the earliest cue that predicts a future reward5. Such cue-induced dopamine signals are thought to serve a motivational role25, biasing behaviour towards effortful and risky actions that are undertaken to acquire rewards26–31.
Although normative roles for dopamine have frequently been discussed in terms of their effects on reinforcement learning and motivational systems, it is also likely that such signals affect process-ing in memory systems in the medial temporal lobe32–36. For exam-ple, dopamine can enhance long-term potentiation37 and replay38 in the hippocampus, providing a mechanism to prioritize behav-iourally relevant information for longer-term storage32. More recent work using optogenetics to perturb hippocampal dopamine inputs revealed a biphasic relationship, in which low levels of dopamine suppress hippocampal information flow, but higher levels of dopa-mine facilitate it35. Given that dopamine levels are typically high-est during burst-firing of dopamine neurons39—for instance during large RPEs5—this result suggests that memory encoding in the hip-pocampus might be enhanced for unexpectedly positive events.
However, despite strong evidence that dopaminergic projections signal RPEs5,40,41 and that dopamine release in the hippocampus can facilitate memory encoding in non-human animals42, evidence for a positive effect of RPEs on memory formation in humans is scarce. Monetary incentives and reward expectation can be manipulated to improve episodic encoding, but it is not clear whether such effects are driven by RPEs rather than motivational signals or reward value per se21,33,43,44. The few studies that have closely examined the rela-tionship between RPE signalling and episodic memory have yielded conflicting results about whether positive RPEs strengthen memory encoding45–47. However, a number of technical factors could mask a relationship between RPEs and memory formation in standard par-adigms. In particular, tasks have not typically controlled for salience signals—such as surprise and uncertainty—that may be closely related to RPEs and that may exert independent effects on epi-sodic encoding through a separate noradrenergic neuromodulatory
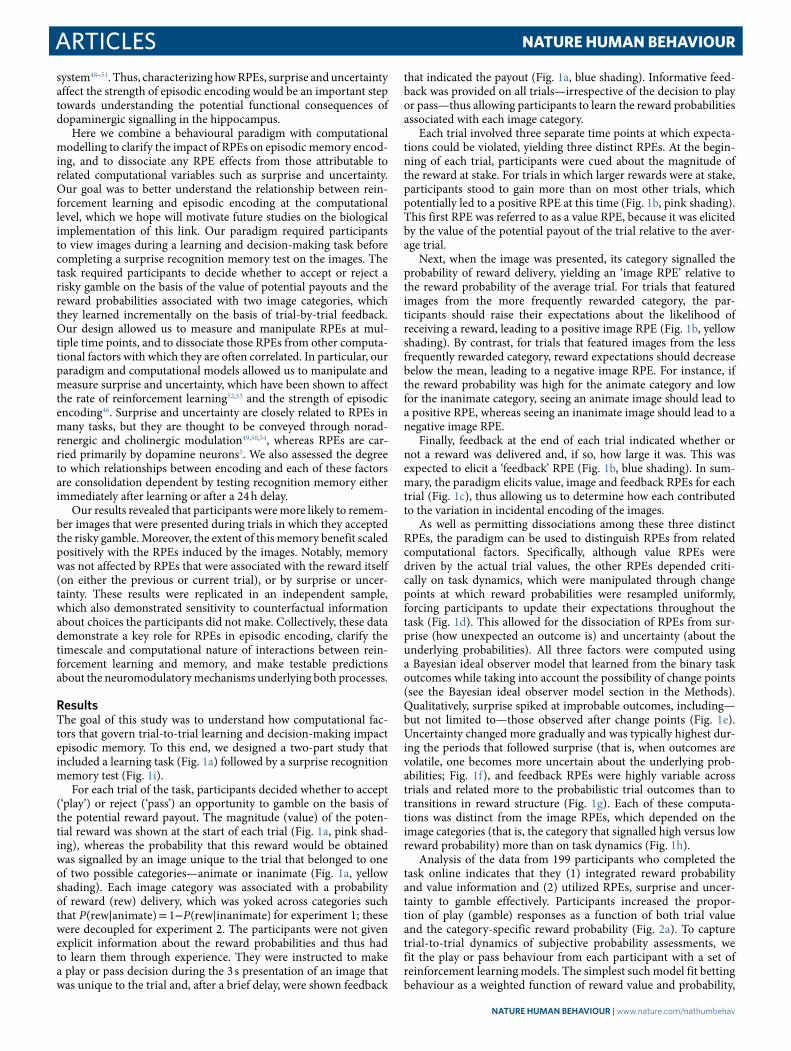
Positive reward prediction errors during decision-making strengthen memory encodingAnthony I. Jang 1,6, Matthew R. Nassar 2,3,6*, Daniel G. Dillon 4,5 and Michael J. Frank1,3
Dopamine is thought to provide reward prediction error signals to temporal lobe memory systems, but the role of these signals in episodic memory has not been fully characterized. Here we developed an incidental memory paradigm to (i) estimate the influence of reward prediction errors on the formation of episodic memories, (ii) dissociate this influence from surprise and uncertainty, (iii) characterize the role of temporal correspondence between prediction error and memoranda presentation and (iv) determine the extent to which this influence is dependent on memory consolidation. We found that people encoded inciden-tal memoranda more strongly when they gambled for potential rewards. Moreover, the degree to which gambling strengthened encoding scaled with the reward prediction error experienced when memoranda were presented (and not before or after). This encoding enhancement was detectable within minutes and did not differ substantially after 24 h, indicating that it is not depen-dent on memory consolidation. These results suggest a computationally and temporally specific role for reward prediction error signalling in memory formation.
NAtuRe HuMAN BeHAvIouR | www.nature.com/nathumbehav
Articles Nature HumaN BeHaviour
system48–51. Thus, characterizing how RPEs, surprise and uncertainty affect the strength of episodic encoding would be an important step towards understanding the potential functional consequences of dopaminergic signalling in the hippocampus.
Here we combine a behavioural paradigm with computational modelling to clarify the impact of RPEs on episodic memory encod-ing, and to dissociate any RPE effects from those attributable to related computational variables such as surprise and uncertainty. Our goal was to better understand the relationship between rein-forcement learning and episodic encoding at the computational level, which we hope will motivate future studies on the biological implementation of this link. Our paradigm required participants to view images during a learning and decision-making task before completing a surprise recognition memory test on the images. The task required participants to decide whether to accept or reject a risky gamble on the basis of the value of potential payouts and the reward probabilities associated with two image categories, which they learned incrementally on the basis of trial-by-trial feedback. Our design allowed us to measure and manipulate RPEs at mul-tiple time points, and to dissociate those RPEs from other computa-tional factors with which they are often correlated. In particular, our paradigm and computational models allowed us to manipulate and measure surprise and uncertainty, which have been shown to affect the rate of reinforcement learning52,53 and the strength of episodic encoding46. Surprise and uncertainty are closely related to RPEs in many tasks, but they are thought to be conveyed through norad-renergic and cholinergic modulation49,50,54, whereas RPEs are car-ried primarily by dopamine neurons5. We also assessed the degree to which relationships between encoding and each of these factors are consolidation dependent by testing recognition memory either immediately after learning or after a 24 h delay.
Our results revealed that participants were more likely to remem-ber images that were presented during trials in which they accepted the risky gamble. Moreover, the extent of this memory benefit scaled positively with the RPEs induced by the images. Notably, memory was not affected by RPEs that were associated with the reward itself (on either the previous or current trial), or by surprise or uncer-tainty. These results were replicated in an independent sample, which also demonstrated sensitivity to counterfactual information about choices the participants did not make. Collectively, these data demonstrate a key role for RPEs in episodic encoding, clarify the timescale and computational nature of interactions between rein-forcement learning and memory, and make testable predictions about the neuromodulatory mechanisms underlying both processes.
ResultsThe goal of this study was to understand how computational fac-tors that govern trial-to-trial learning and decision-making impact episodic memory. To this end, we designed a two-part study that included a learning task (Fig. 1a) followed by a surprise recognition memory test (Fig. 1i).
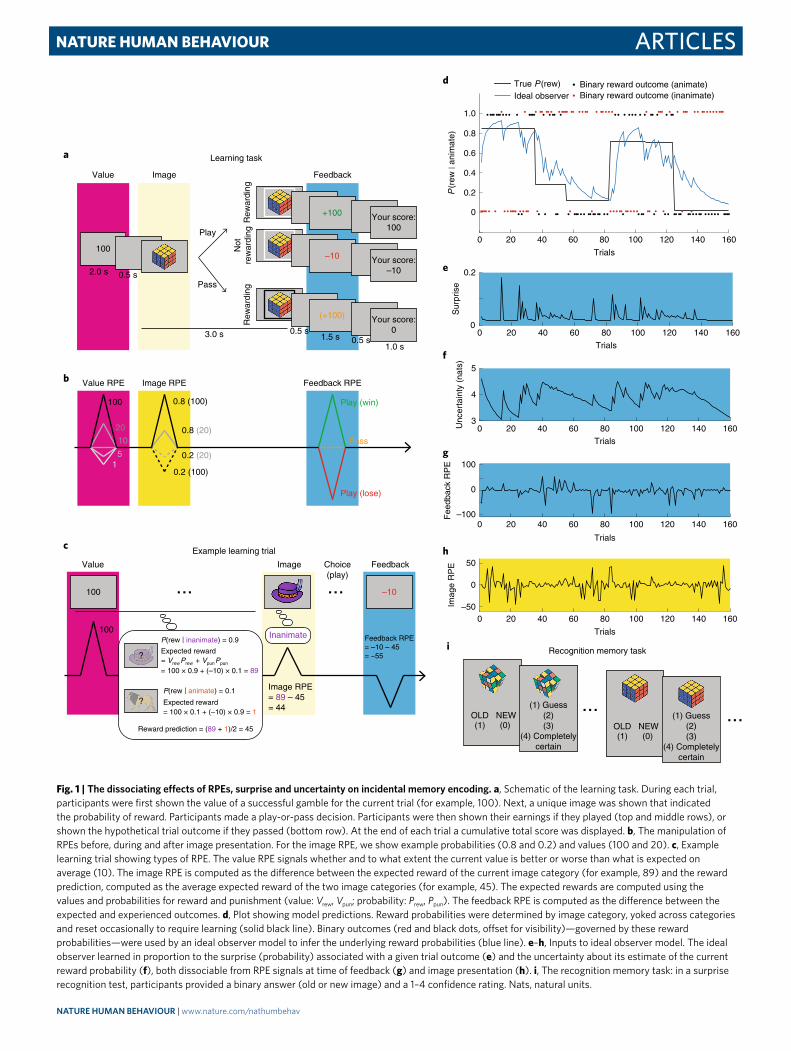
For each trial of the task, participants decided whether to accept (‘play’) or reject (‘pass’) an opportunity to gamble on the basis of the potential reward payout. The magnitude (value) of the poten-tial reward was shown at the start of each trial (Fig. 1a, pink shad-ing), whereas the probability that this reward would be obtained was signalled by an image unique to the trial that belonged to one of two possible categories—animate or inanimate (Fig. 1a, yellow shading). Each image category was associated with a probability of reward (rew) delivery, which was yoked across categories such that ∣ = − ∣P P(rew animate) 1 (rew inanimate) for experiment 1; these were decoupled for experiment 2. The participants were not given explicit information about the reward probabilities and thus had to learn them through experience. They were instructed to make a play or pass decision during the 3 s presentation of an image that was unique to the trial and, after a brief delay, were shown feedback
that indicated the payout (Fig. 1a, blue shading). Informative feed-back was provided on all trials—irrespective of the decision to play or pass—thus allowing participants to learn the reward probabilities associated with each image category.
Each trial involved three separate time points at which expecta-tions could be violated, yielding three distinct RPEs. At the begin-ning of each trial, participants were cued about the magnitude of the reward at stake. For trials in which larger rewards were at stake, participants stood to gain more than on most other trials, which potentially led to a positive RPE at this time (Fig. 1b, pink shading). This first RPE was referred to as a value RPE, because it was elicited by the value of the potential payout of the trial relative to the aver-age trial.
Next, when the image was presented, its category signalled the probability of reward delivery, yielding an ‘image RPE’ relative to the reward probability of the average trial. For trials that featured images from the more frequently rewarded category, the par-ticipants should raise their expectations about the likelihood of receiving a reward, leading to a positive image RPE (Fig. 1b, yellow shading). By contrast, for trials that featured images from the less frequently rewarded category, reward expectations should decrease below the mean, leading to a negative image RPE. For instance, if the reward probability was high for the animate category and low for the inanimate category, seeing an animate image should lead to a positive RPE, whereas seeing an inanimate image should lead to a negative image RPE.
Finally, feedback at the end of each trial indicated whether or not a reward was delivered and, if so, how large it was. This was expected to elicit a ‘feedback’ RPE (Fig. 1b, blue shading). In sum-mary, the paradigm elicits value, image and feedback RPEs for each trial (Fig. 1c), thus allowing us to determine how each contributed to the variation in incidental encoding of the images.
As well as permitting dissociations among these three distinct RPEs, the paradigm can be used to distinguish RPEs from related computational factors. Specifically, although value RPEs were driven by the actual trial values, the other RPEs depended criti-cally on task dynamics, which were manipulated through change points at which reward probabilities were resampled uniformly, forcing participants to update their expectations throughout the task (Fig. 1d). This allowed for the dissociation of RPEs from sur-prise (how unexpected an outcome is) and uncertainty (about the underlying probabilities). All three factors were computed using a Bayesian ideal observer model that learned from the binary task outcomes while taking into account the possibility of change points (see the Bayesian ideal observer model section in the Methods). Qualitatively, surprise spiked at improbable outcomes, including—but not limited to—those observed after change points (Fig. 1e). Uncertainty changed more gradually and was typically highest dur-ing the periods that followed surprise (that is, when outcomes are volatile, one becomes more uncertain about the underlying prob-abilities; Fig. 1f), and feedback RPEs were highly variable across trials and related more to the probabilistic trial outcomes than to transitions in reward structure (Fig. 1g). Each of these computa-tions was distinct from the image RPEs, which depended on the image categories (that is, the category that signalled high versus low reward probability) more than on task dynamics (Fig. 1h).
Analysis of the data from 199 participants who completed the task online indicates that they (1) integrated reward probability and value information and (2) utilized RPEs, surprise and uncer-tainty to gamble effectively. Participants increased the propor-tion of play (gamble) responses as a function of both trial value and the category-specific reward probability (Fig. 2a). To capture trial-to-trial dynamics of subjective probability assessments, we fit the play or pass behaviour from each participant with a set of reinforcement learning models. The simplest such model fit betting behaviour as a weighted function of reward value and probability,
NAtuRe HuMAN BeHAvIouR | www.nature.com/nathumbehav
ArticlesNature HumaN BeHaviour
OLD NEW(1) Guess
(2)(3)
(4) Completelycertain
... ...
Recognition memory task
+100 Your score:100
100
2.0 s 0.5 s
3.0 s 1.5 s1.0 s
Play
Pass
–10 Your score:–10
(+100) Your score:0
Rew
ardi
ngN
otre
war
ding
Rew
ardi
ng
0.5 s0.5 s
Learning taska
Value RPE Feedback RPE
100
15
10
20
Play (win)
Play (lose)
Pass
b
Image Feedback
c
0.2
3
4
5
0
Unc
erta
inty
(na
ts)
Sur
pris
e
d
g
f
e
0
0.2
0.4
0.6
0.8
1.0
P(r
ew ∣
anim
ate)
True P (rew) Binary reward outcome (animate)Binary reward outcome (inanimate)Ideal observer
–100
0
100
Fee
dbac
k R
PE
0 20 40 60 80 100 120 140 160–50
0
50
Imag
e R
PE
h
(1) (0) OLD NEW(1) Guess
(2)(3)
(4) Completelycertain
(1) (0)
i
Value
Example learning trial
Image RPE= 89 – 45= 44
Feedback RPE= –10 – 45= –55
100 –10
Image FeedbackValue
...Choice(play)
...
? Expected reward= 100 × 0.1 + (–10) × 0.9 = 1
P(rew ∣ inanimate) = 0.9
Expected reward= VrewPrew + VpunPpun
= 100 × 0.9 + (–10) × 0.1 = 89
P(rew ∣ animate) = 0.1
Reward prediction = (89 + 1)/2 = 45
?
100Inanimate
Image RPE
0.8 (100)
0.8 (20)
0.2 (20)
0.2 (100)
0 20 40 60 80 100 120 140 160
0 20 40 60 80 100 120 140 160
0 20 40 60 80 100 120 140 160
0 20 40 60 80 100 120 140 160
Trials
Trials
Trials
Trials
Trials
Fig. 1 | the dissociating effects of RPes, surprise and uncertainty on incidental memory encoding. a, Schematic of the learning task. During each trial, participants were first shown the value of a successful gamble for the current trial (for example, 100). Next, a unique image was shown that indicated the probability of reward. Participants made a play-or-pass decision. Participants were then shown their earnings if they played (top and middle rows), or shown the hypothetical trial outcome if they passed (bottom row). At the end of each trial a cumulative total score was displayed. b, The manipulation of RPEs before, during and after image presentation. For the image RPE, we show example probabilities (0.8 and 0.2) and values (100 and 20). c, Example learning trial showing types of RPE. The value RPE signals whether and to what extent the current value is better or worse than what is expected on average (10). The image RPE is computed as the difference between the expected reward of the current image category (for example, 89) and the reward prediction, computed as the average expected reward of the two image categories (for example, 45). The expected rewards are computed using the values and probabilities for reward and punishment (value: Vrew, Vpun; probability: Prew, Ppun). The feedback RPE is computed as the difference between the expected and experienced outcomes. d, Plot showing model predictions. Reward probabilities were determined by image category, yoked across categories and reset occasionally to require learning (solid black line). Binary outcomes (red and black dots, offset for visibility)—governed by these reward probabilities—were used by an ideal observer model to infer the underlying reward probabilities (blue line). e–h, Inputs to ideal observer model. The ideal observer learned in proportion to the surprise (probability) associated with a given trial outcome (e) and the uncertainty about its estimate of the current reward probability (f), both dissociable from RPE signals at time of feedback (g) and image presentation (h). i, The recognition memory task: in a surprise recognition test, participants provided a binary answer (old or new image) and a 1–4 confidence rating. Nats, natural units.
NAtuRe HuMAN BeHAvIouR | www.nature.com/nathumbehav

Articles Nature HumaN BeHaviour
with probabilities updated for each trial with a fixed learn-ing rate. More complex models (see the Reinforcement learning model fitting section in the Methods) considered the possibil-ity that this learning rate is adjusted according to other factors, such as surprise, uncertainty or choice. Consistent with previous research50,53,55,56, the best-fitting model adjusted the learning rate according to normative measures of both surprise and uncertainty (Fig. 2b). Coefficients that described the effects of surprise and uncertainty on learning rate were positive across participants (Fig. 2d; surprise: two-tailed t199 = 2.34, P = 0.020, d = 0.17, 95% confidence interval (CI) = 0.041–0.48; and uncertainty: t199 = 6.47, P < 0.001, d = 0.46, 95% CI = 0.74–1.39). In other words, in line with previous findings53, participants were more responsive to feedback that was surprising or was provided during a period of uncertainty. Thus, surprise and uncertainty scaled the extent to which feedback RPEs were used to adjust subsequent behaviour.
Participants completed a surprise memory test either 5 min (no delay, n = 109) or 24 h (24 h delay, n = 90) after the learning task. During the test, participants saw all of the ‘old’ images from the learning task along with an equal number of semantically matched ‘new’ foils that were not shown previously. Participants provided a binary response that indicated whether each image was old or new, and a confidence rating from 1 to 4 (Fig. 1i).
Participants in both delay conditions reliably identified images from the learning task with above-chance accuracy (Fig. 3a; no delay: mean ± s.e.m.; sensitivity index d′ = 0.85 ± 0.042, t108 = 20.3, P < 0.001, d = 1.94, 95% CI = 0.77–0.93; and 24 h delay: mean ± s.e.m. d′ = 0.51 ± 0.032, t90 = 15.9, P < 0.001, d = 1.94, 95% CI = 0.45–0.57). Memory accuracy was better when participants expressed higher confidence (confidence of 3 or 4) versus lower confidence (confidence of 1 or 2; no delay: t93 = 13.8, P < 0.001, d = 1.30, 95% CI = 0.64–0.86; and 24 h delay: t83 = 9.95, P < 0.001, d = 0.06, 95% CI = 0.34–0.51).
To aggregate the information that was provided by the binary reports and confidence ratings, we transformed these into a single memory score with a scale of 1–8, where 8 reflected a high confi-dence old response and 1 reflected a high confidence new response. As expected, the true proportion of old images increased with higher memory scores, in a monotonic and roughly linear manner across both delays (Fig. 3b). Thus, participants formed lasting memories of the images, and the memory scores provided a reasonable measure of subjective memory strength.
Recognition memory depended critically on the context in which the images had been presented. Memory scores were higher for images that were shown during trials in which the participants gambled (play) versus passed (Fig. 3c, Supplementary Fig. 1). Furthermore, the difference between memory scores for old versus new items was larger for play versus pass trials (t199 = 3.30, P = 0.001, d = 0.23, 95% CI = 0.049–0.20) and this did not differ across delay conditions (t198 = 0.41, P = 0.69, d = 0.058, 95% CI = −0.12–0.18; Fig. 3d). Higher memory scores were produced—at least in part—by increased memory sensitivity. Across all possible memory scores, the hit rate was higher for play versus pass trials, and the area under the receiver operating characteristic (ROC) curves was greater for play versus pass trials (Fig. 3e; t199 = 3.53, P < 0.001, d = 0.25, 95% CI = 0.0066–0.023). We found no evidence that this play versus pass effect differed across delay conditions (t198 = 0.36, P = 0.72, d = 0.051, 95% CI = −0.014–0.020).
Next, we tested whether this memory enhancement could be driven by positive image RPEs (Fig. 1h), which would motivate play decisions (Fig. 2a). Indeed, the degree of memory enhance-ment in play trials depended on the magnitude of the image RPE. Specifically, memory scores in play trials increased as a func-tion of the image RPE (Fig. 4a; t199 = 4.33, P < 0.001, d = 0.31, 95% CI = 0.0032–0.0086), with no evidence of a difference between the delay conditions (t198 = −0.11, P = 0.92, d = −0.015, 95% CI = −0.0057–0.0051). Moreover, this effect was most prominent in participants whose gambling behaviours were sensitive to trial-to-trial fluctuations in probability and value (Spearman’s ρ = 0.17, 95% CI = 0.033–0.30, P = 0.016, n = 200; see the Descriptive analysis sec-tion in the Methods).
To better understand this image RPE effect, we explored the rela-tionship between memory score and the constituent components of the image RPE signal. The image RPE depends directly on the prob-ability of reward delivery cued by the image category relative to the average reward probability. By contrast, variations in the trial value should not directly affect the image RPE, because the participant already knows the trial value when the image is displayed. In other words, the participant knows the potential payoff—the value—at the outset of the trial (‘I could win 100 points!’), but the probability information that is carried by the image can elicit either a strong positive (‘and I almost certainly will win’) or negative (‘but I prob-ably will not win’) image RPE.
Consistent with this conceptualization, subsequent memories were stronger for play trials in which the image category was associ-ated with a higher reward probability (Fig. 4c; t199 = 4.38, P < 0.001, d = 0.31, 95% CI = 0.25–0.67), but not for play trials with higher potential outcome values, which were—if anything—associated with slightly lower memory scores (Fig. 4e; t199 = −1.99, P = 0.048,
Surpr
ise, u
ncer
taint
y
Idea
l lear
ning
rate
Uncer
taint
y
Surpr
ise
Choice
–2
0
2
BIC
diff
eren
ce fr
omba
se m
odel
0
0.2
0.4
0.6
0.8
1.0
1.2
1.4
Effe
ct o
n le
arni
ng r
ate
Uncer
taint
y
Surpr
ise
dc
Model parameters
–20 0 20 40 60 80
Expected value (bin median)
00.10.20.30.40.50.60.70.80.91.0
Pla
y pr
obab
ility
ParticipantsModel
0.00–0.250.25–0.500.50–0.750.75–1.00
P(rew)a
Trial value
Pro
port
ion
of p
lay
b
1 5 10 20 1000
0.10.20.30.40.50.60.70.80.91.0
Fig. 2 | Integration of reward value and subjective reward probability estimates. a–d, The behaviour of the participants indicates an integration of reward value and subjective reward probability estimates, which were updated as a function of surprise and uncertainty; n = 199. a, The proportion of trials in which the participants chose to play, broken down by reward value and reward probability. b, Participant choice behaviour and model-predicted choice behaviour. The model with the lowest Bayesian information criterion (BIC)—which incorporated the effects of surprise and uncertainty on learning rate—was used to generate model behaviour (yellow bars in c,d). Expected rewards for all trials were divided into eight equally sized bins for both participant and model-predicted behaviour. c, Bayesian information criterion of five reinforcement learning models with different parameters that affect learning rate. d, Mean maximum likelihood estimates of surprise and uncertainty parameters of the best-fitting model (first bar in c). c,d, Data are mean ± s.e.m.
NAtuRe HuMAN BeHAvIouR | www.nature.com/nathumbehav

ArticlesNature HumaN BeHaviour
d = −0.14, 95% CI = −0.0020–0.0000). Reward probability effects were stronger in participants who displayed more sensitivity to probability and value in the gambling task (Spearman’s ρ = 0.18, 95% CI = 0.044–0.31, P = 0.010, n = 200).
To rule out the possibility that the effect of image RPE on subse-quent memory strength is driven by a change in response bias rather than an increase in stimulus-specific discriminability, we repeated the same analysis using corrected recognition scores (hit rate minus the false-alarm rate)—rather than our memory score—as the metric for recognition memory. We found a positive effect of image RPE on corrected recognition, which was consistent with the idea that posi-tive image RPEs enhanced memory accuracy rather than causing a shift in the decision criteria (t199 = 2.04, P = 0.045, d = 0.14, 95% CI = 0.0000–0.0015; Supplementary Fig. 2).
Finally, we tested for an effect of reward uncertainty on memory, noting that uncertainty about the trial outcome is greater at prob-abilities near 0.5 than for probabilities near 0 or 1. We found no effect of reward uncertainty on memory (Supplementary Fig. 3).
We found no evidence for an effect of feedback RPE, uncertainty or surprise on subsequent memory strength. There was no evidence that memory scores were systematically related to the feedback RPE experienced either for the trial preceding image presentation (Fig. 5a; t199 = −0.93, P = 0.36, d = −0.065, 95% CI = −0.0043–0.0016) or immediately after image presentation (Fig. 5b; t199 = −1.26, P = 0.21, d = −0.089, 95% CI = −0.0021–0.0005). Similarly, we found no evidence that the surprise and uncertainty associated with feed-back preceding (surprise: Fig. 5c, Supplementary Fig. 4; t199 = 0.99, P = 0.32, d = 0.070, 95% CI = −0.97–2.94; or uncertainty: Fig. 5e; t199 = −0.82, P = 0.42, d = −0.058, 95% CI = −0.17–0.071) or follow-ing (surprise: Fig. 5d; t199 = 1.53, P = 0.13, d = 0.11, 95% CI = −0.42–3.32; or uncertainty: Fig. 5f; t199 = −0.67, P = 0.51, d = −0.047, 95% CI = −0.18–0.091) image presentation were systematically related to subsequent memory scores, despite the fact that participant betting behaviour strongly depended on both factors (Fig. 2c).
To better estimate the contributions of learning-related compu-tations to subsequent memory strength, we constructed a hierarchi-cal regression model that was capable of (1) pooling information across participants and delay conditions in an appropriate manner, (2) estimating the independent contributions of each factor while simultaneously accounting for all others and (3) accounting for the differences in memory scores that were attributable to the images themselves. Using the hierarchical regression model, we attempted to predict memory scores by estimating coefficients at the level of images and participants, as well as estimating the mean parameter
value over participants and the effect of delay condition for each parameter (Fig. 6a).
Consistent with the results presented thus far, the hierarchical regression results support the notion that encoding was strength-ened by the decision to gamble (play versus pass) and by image RPEs, but not by the computational factors that controlled learning rate (surprise and uncertainty). Play trials were estimated to con-tribute positively to encoding, as indexed by uniformly positive val-ues for the posterior density on the play or pass parameter (Fig. 6b, column 2, top; mean (95% CI) play coefficient = 0.078 (0.05–0.1); Supplementary Table 1). The reward probability associated with the displayed category was positively related to subsequent memory in play trials (Fig. 6b, column 3; mean (95% CI) probability coef-ficient = 0.047 (0.01–0.08); Supplementary Table 1), as was its inter-action with value (Fig. 6b, column 5; mean (95% CI) probability × value coefficient = 0.042 (0.01–0.07); Supplementary Table 1). However, there was no reliable effect of value itself and, if anything, there was a slight trend towards stronger memories for lower trial values (Fig. 6b, column 4; mean (95% CI) value coefficient = −0.03 (−0.05–0.0001); Supplementary Table 1); this was not replicated in our second experiment (see Experiment 2 below). The direc-tion of the interaction between value and probability suggests that participants were more sensitive to image probability during trials in which there were more points at stake; this is consistent with a memory effect that scales with the image RPE (Fig. 1b, yellow shad-ing). All of the observed effects were selective for old images viewed in the learning task, as the same model fit to the new, foil images yielded coefficients near zero for every term (Supplementary Fig. 5). Consistent with our previous analysis, coefficients for the uncer-tainty and surprise terms were estimated to be near zero (Fig. 6b, columns 6 and 7; mean (95% CI) surprise and uncertainty coeffi-cients = 0.012 (−0.01–0.03) and −0.019 (−0.04–0.01), respectively; Supplementary Table 1).
The model allowed us to examine the extent to which any subse-quent memory effects required a consolidation period. In particu-lar, any effects on subsequent memory that were stronger in the 24 h delay condition versus the no delay condition might reflect an effect of post-encoding processes. Despite evidence from studies using animal models showing that dopamine can robustly affect memory consolidation42, we did not find strong support for any of our effects being consolidation dependent (note the lack of positive coefficients in the bottom row of Fig. 6b, which would indicate effects that are stronger in the 24 h condition). As might be expected, participants in the no delay condition tended to have higher memory scores
2 3 4 5 6 7 8
Pass
2
3
4
5
6
7
8
Pla
y
Memory score
Pro
port
ion
of o
ld s
timul
i
a b ed
0 0.2 0.4 0.6 0.8 1.0
False-alarm rate
0
0.2
0.4
0.6
0.8
1.0
Hit
rate
AU
C
PlayPas
sPlay
Pass
Play
Pass
0.6
0.7
c
d′
No de
lay
24 h
dela
y Diff
eren
ce in
mem
ory
scor
es
0.6
1.0
1.4
1.8
Pass
PlayPass
Play
0
0.5
1.0
1 2 3 4 5 6 7 80
0.10.20.30.40.50.60.70.80.91.0
Fig. 3 | Dependence of recognition memory strength on gambling behaviour. a, Average d′ for the two delay conditions (no delay, n = 109; 24 h delay, n = 90). b, Average proportion of image stimuli that were old (presented during the learning task) versus memory score. c, Mean memory score of old images for play versus pass trials. Each point represents a unique participant. Data for most participants lie above the diagonal dashed line, indicating better memory performance for play trials. d, Mean pairwise difference in memory score between the old images and their semantically matched foil images. e, ROC curves for play versus pass trials. The areas under the ROC curves (AUC) for play and pass trials are shown in the inset. AUC was greater for play than for pass trials, indicating better detection of old versus new images for play trials compared with pass trials. In a,b,d and the inset in e, data are mean ± s.e.m. a–e, Blue (or red) indicates no delay (or 24 h delay) between encoding and memory testing in all panels.
NAtuRe HuMAN BeHAvIouR | www.nature.com/nathumbehav

Articles Nature HumaN BeHaviour
overall (Fig. 6b, column 1, bottom; mean (95% CI) delay effect on memory score = −0.14 (−0.23 to −0.05); Supplementary Table 1); however, their memory scores also tended to change more as a function of reward probability (Fig. 6b, column 3, bottom; mean (95% CI) delay effect on probability modulation = −0.043 (−0.07 to −0.01); Supplementary Table 1) than the memory scores of equiva-lent participants in the 24 h delay condition. These results reveal the expected decay of memory over time and suggest that the image RPEs were associated with an immediate boost in memory accuracy that decays over time.
It is possible that these memory effects may have been driven—at least in part—by anticipatory attention. Specifically, participants may have entered a heightened state of attention during play trials with large image RPEs, as they may have been eagerly anticipating feedback on such trials. Although our paradigm did not include a direct measure of attention, we addressed this question by deter-mining which factors modulate the effect of feedback on trial-to-trial choice behaviour. If a change in anticipatory attention affects the degree to which images are encoded in episodic memory, this
increased attention should also lead to an increased effect of feed-back on subsequent choice behaviour. To test this hypothesis, we extended the best-fitting behavioural model such that the learning rate could be adjusted for each trial according to the choice (play versus pass) made on that trial as well as the image RPE received during play trials. The addition of these terms worsened the model fit (Supplementary Fig. 6a; t199 = −7.40, P < 0.001, d = −0.52, 95% CI = −2.28 to −1.32), providing no evidence that choices or image RPEs influence the degree to which feedback influences subsequent choice. However, parameter fits within this model revealed a ten-dency for participants to learn more from feedback during play tri-als than during pass trials (Supplementary Fig. 6b; mean β = 0.23, t199 = 2.57, P = 0.011, d = 0.18, 95% CI = 0.054–0.41), whereas it revealed no consistent effect of image RPEs on feedback-driven learning (Supplementary Fig. 6b; mean β = 0.16, t199 = 1.29, P = 0.20, d = 0.091, 95% CI = −0.84–0.40). These analyses suggest that antici-patory attention probably mediated our play or pass effects at least to some degree, but they do not provide any evidence for a role of anticipatory attention in modulating the memory benefits that are conferred by large image RPEs.
In summary, behavioural data and computational modelling revealed important roles for surprise, uncertainty and feedback RPEs during learning. However, only decisions to gamble (play) and image RPEs influenced subsequent memory. The memory ben-efits conferred by gambling and high image RPEs were consolida-tion independent. To better understand the image RPE effect, and to ensure the reliability of our findings, we conducted a second experi-ment.
Our initial findings suggested that variability in the strength of memory encoding was related to computationally derived image RPEs and the gambling behaviour that elicited them. However, the yoked reward probabilities in experiment 1 ensured that the reward probabilities associated with the presented and unpresented image categories were perfectly anti-correlated on every trial. Thus, although an image from the high-probability reward category would increase the expected value and thus elicit a positive image RPE, we could not determine whether this positive RPE was driven directly by the reward probability associated with the presented image category, the counterfactual reward probability associated with the alternate category or—as might be predicted for a true pre-diction error—their difference. To address this issue, we conducted an experiment in which expectations about reward probability were manipulated independently for each trial, allowing us to distinguish between these alternatives.
In the new learning task, the reward probabilities for the two image categories were independently manipulated. Thus, during some of the trials both image categories were associated with a high reward probability, whereas during other trials both image catego-ries were associated with a low reward probability, or one image category was associated with a high reward and the other was asso-ciated with a low reward (Fig. 7a). In this design, RPEs are relatively small when the reward probabilities are similar across image catego-ries but deviate substantially when the reward probabilities differ across the image categories (Fig. 7c). Thus, if the factor boosting subsequent memory is truly an RPE, it should depend positively on the reward probability associated with the observed image category, but negatively with the reward probability associated with the other (unobserved) category.
A total of 174 participants completed experiment 2 online (no delay: n = 93; 24 h delay: n = 81). Participants in both conditions reliably recognized images from the learning task with above-chance accuracy (Fig. 7d; no delay: mean ± s.e.m. d′ = 0.90 ± 0.058, t90 = 15.5, P < 0.001, d = 1.62, 95% CI = 0.79–1.02; and 24 h delay: d′ = 0.53 ± 0.035, t81 = 15.4, P < 0.001, d = 1.62, 95% CI = 0.46–0.60). We also observed a robust replication of the effect of gambling behaviour on memory, as recognition accuracy was significantly
Trial value
Mem
ory
scor
e
Trial value
Mem
ory
scor
e
Image RPE
Mem
ory
scor
e
PlayPass
Image RPE
PlayPass
a
c
e
b
d
f
P(rew)
Mem
ory
scor
e
P(rew)
Mem
ory
scor
e
No delay 24 h delay
Mem
ory
scor
e
–20 –10 0 10 20
–0.3
–0.2
–0.1
0
0.1
0.2
0.3
–20 –10 0 10 20
–0.3
–0.2
–0.1
0
0.1
0.2
0.3
0 0.2 0.4 0.6 0.8 1.0
–0.3
–0.2
–0.1
0
0.1
0.2
0.3
0 0.2 0.4 0.6 0.8 1.0
–0.3
–0.2
–0.1
0
0.1
0.2
0.3
1 5 10 20
–0.3
–0.2
–0.1
0
0.1
0.2
0.3
–0.3
–0.2
–0.1
0
0.1
0.2
0.3
100 1 5 10 20 100
Fig. 4 | Recognition of memory strength depends on the RPe at the time of image presentation, but not directly on trial value. a,b, Positive association between subsequent recognition memory and RPE during image presentation for no delay (a; blue) and 24 h delay (b; red) conditions (no delay, n = 109; 24 h delay, n = 90). c–f, Positive association of recognition memory with reward probability estimates (c,d), but not with the reward value (e,f) associated with the image. This suggests that the RPE that occurs during image presentation—but not the overall value of the image—is driving the subsequent memory effect. Data are mean ± s.e.m. The legends in a and b apply to their respective columns.
NAtuRe HuMAN BeHAvIouR | www.nature.com/nathumbehav

ArticlesNature HumaN BeHaviour
increased for images from play versus pass trials (Fig. 7e; t173 = 3.93, P < 0.001, d = 0.30, 95% CI = 0.078–0.24). As in experiment 1, we found no evidence that this effect differed between delay conditions (t172 = −0.31, P = 0.76, d = −0.047, 95% CI = −0.18–0.13).
The new experimental design permitted the analysis of variabil-ity in memory scores for each old image as a function of the reward probability of its category (image category) versus the reward prob-ability associated with the other, counterfactual category (other cat-egory). Based on the image RPE account, we expected to see positive and negative effects on memory for the image category and other category, respectively. Indeed, for both delays there was a cross-over effect whereby memory scores scaled positively with the reward probability associated with the image category (Fig. 7f; t173 = 2.38, P = 0.019, d = 0.18, 95% CI = 0.043–0.46), but negatively with the reward probability associated with the other category (t173 = −2.45, P = 0.015, d = −0.19, 95% CI = −0.43 to −0.046). These effects did not differ by delay (image category: t172 = 0.27, P = 0.79, d = 0.041, 95% CI = −0.36–0.48; other category: t172 = 0.43, P = 0.67, d = 0.065, 95% CI = −0.30–0.47).
To better estimate the effects of image category, other category, and play or pass behaviour on subsequent memory, we fit the
memory score data with a modified version of the hierarchical regres-sion model that included separate reward probability terms for the image and other categories. Posterior density estimates for the play or pass coefficient were greater than zero (Fig. 8a, Supplementary Table 1), replicating our findings in experiment 1. The posterior densities for the image category and other category probabilities were con-centrated in the region over which the image category was greater than other category (mean (95% CI) image category coefficient minus other category coefficient: 0.052 (0.015–0.94)) and supported independent and opposite contributions of both category probabili-ties (Fig. 8b, Supplementary Table 1). These results—in particular the negative effect of other category probability on the subsequent memory scores (mean (95% CI) other category coefficient = −0.03 (−0.06 to −0.001))—are more consistent with an RPE effect than with a direct effect of reward prediction itself. More generally, these results support the hypothesis that image RPEs enhance the degree to which such images are encoded in episodic memory systems.
Despite the general agreement between the two experiments, there was one noteworthy discrepancy. Although the hierarchical models that were fit to both datasets indicated a higher probability of positive coefficients for the interaction between value and prob-ability (for example, positive effects of reward probability on mem-ory are greater for high-value trials), the 95% CIs for these estimates in experiment 2 included zero as a possible coefficient value (mean (95% CI) probability × value coefficient = 0.007 (−0.019–0.034); Supplementary Table 1), indicating that the initial finding was not replicated in the strictest sense.
To better understand this discrepancy and to make the best use of the data, we extended the hierarchical regression approach to include additional coefficients that were capable of explaining the differences between the two experiments and fit this extended model to the combined data. As expected, this model provided evi-dence for a memory advantage in play trials, and an amplification of this advantage for trials with a high image RPE (Supplementary Fig. 7, Supplementary Table 1). In the combined dataset there was also a positive effect of the interaction between value and prob-ability (Supplementary Fig. 7; mean (95% CI) probability × value coefficient = 0.02 (0.004–0.04); Supplementary Table 1), such that the positive impact of reward probability on memory was largest on high-value trials, supporting our initial observation in experi-ment 1. This finding is predicted by the RPE account, as the high reward probability category elicits a greater RPE when the potential payout is higher (‘I could win 100 points, and now I almost certainly will’) as opposed to when the potential payout is low (‘I could win 1 point, and now I almost certainly will’). We also observed that the reward probability effect was greater in the no delay condition (Supplementary Fig. 7; mean (95% CI) probability delay difference coefficient = −0.03 (−0.05 to −0.002); Supplementary Table 1), with no evidence for any memory effects being stronger in the 24 h delay condition (Supplementary Table 1; all other delay difference P val-ues were >0.19).
Using a similar approach, we also tested whether there was a neg-ative effect of trial value on memory, which was weakly suggested by the results of experiment 1. However, using the combined dataset, we found no effect of trial value on memory (Supplementary Table 1).
DiscussionAn extensive previous literature has linked dopamine to RPEs elic-ited during reinforcement learning5,6,22,24,29,40,57–59, and a much smaller body of work has suggested that dopamine can also influence the encoding and consolidation of episodic memories by modulating activity in the medial temporal lobes21,42,60. Evidence for the relation-ship between RPE signalling and memory encoding has so far been mixed. Here, we used a two-stage learning and memory paradigm, along with computational modelling, to better characterize how RPE signals affect the strength of incidental memory formation.
Mem
ory
scor
eM
emor
y sc
ore
Mem
ory
scor
e
Previous trial Current triala
c
e
b
–40 –20 0 20 40
Feedback RPE
–0.2
–0.1
0
0.1
0.2
0.3
0.4
–40 –20 0 20 40
Feedback RPE
–0.2
–0.1
0
0.1
0.2
0.3
0.4
0.02 0.04 0.06 0.08
Surprise
–0.2
–0.1
0
0.1
0.2
0.3
0.02 0.04 0.06 0.08
Surprise
–0.2
–0.1
0
0.1
0.2
0.3
3.5 4.0 4.5
Uncertainty
–0.1
0
0.1
0.2
0.3
3.5 4.0 4.5
Uncertainty
–0.1
0
0.1
0.2
0.3
d
f
Mem
ory
scor
eM
emor
y sc
ore
Mem
ory
scor
e
Fig. 5 | No association was found between subsequent memory and surprise, uncertainty, or RPe elicited at the time of feedback. a–f No association was found between subsequent memory and RPE (a,b) surprise (c,d) or uncertainty (e,f) during the feedback phase of either the previous (a,c,e) or current trial (b,d,f; see the Bayesian ideal observer model section in Methods). Data are mean ± s.e.m. Blue (or red) indicates no delay (or 24 h delay) between encoding and memory testing in all panels (no delay, n = 109; 24 h delay, n = 90).
NAtuRe HuMAN BeHAvIouR | www.nature.com/nathumbehav

Articles Nature HumaN BeHaviour
We found that memory encoding was stronger for trials that involved positive image RPEs (Fig. 4a). This effect was only evident for trials in which participants accepted the risky offer, which is to say, trials in which the subjective prediction error could have plau-sibly been greater than zero. The effect was evident after controlling for other potential confounds (Fig. 6b, column 3) and it was ampli-fied for trials in which higher reward values were on the line (Fig. 6b, column 5). The data also suggest that the effect may depend on the timing of the RPE; memory was enhanced by positive image RPEs, but we found no evidence of an effect of positive value or feedback RPEs. These results are all consistent with a direct, posi-tive effect of RPE at the time of stimulus presentation on memory encoding. This interpretation is bolstered by the fact that individu-als who were more sensitive to value and probability in the learning task (that is to say, those participants who were most closely track-ing probability and value through the learning task) showed greater positive effects of image RPEs on memory. Experiment 2 further supported the RPE interpretation by demonstrating that memory benefits were composed of equal and opposite contributions of the reward probability associated with the observed image category and that of the unobserved, counterfactual one (Figs. 7f and 8b). Together, these results provide strong evidence that RPEs enhance the incidental encoding of visual information, with positive conse-quences for subsequent memory.
We also found that participants encoded memoranda to a greater degree during trials in which they selected a risky bet (Fig. 3). This finding is consistent with a positive relationship between RPE sig-nalling and memory strength, in that participant behaviour provides a proxy for the subjective reward probability estimates (Fig. 2a). However, this effect was prominent in both experiments, even after controlling for model-based estimates of RPE (Figs. 6b and 8a). Therefore, although we suspect that this result may at least partially reflect the direct impact of RPE, it may also reflect other factors that are associated with risky decisions. During play trials, partic-ipants view items while anticipating the uncertain gain or loss of points during the upcoming feedback presentation, whereas during pass trials participants know they will maintain their current score. A direct effect of perceived risk on memory encoding would be
consistent with recent work that has highlighted enhanced memory encoding before uncertain feedback61, particularly when that feed-back pertains to a self-initiated choice62.
One important question when interpreting these effects on memory encoding is to what degree they are mediated by shifts in anticipatory attention. Recent work by Stanek and colleagues61 demonstrated that images presented before feedback in a Pavlovian conditioning task showed a consolidation-independent memory benefit when the feedback was uncertain. Although we did not observe a memory benefit when feedback was most uncertain (note the lack of enhanced memory for intermediate reward probabilities in Fig. 4c), it is possible that attention is modulated differently in our task, and that the memory benefits that we observed (for play trials and for trials that included a large image RPE) might reflect these differential fluctuations in anticipatory attention. We attempted to minimize the influence of attention by (1) forcing participants to categorize the image during each trial, thus ensuring some baseline level of attention to the memoranda and (2) by presenting counter-factual information during pass trials that was nearly identical to the experienced outcome information. Indeed, we found that the best model of behaviour relied equally on feedback information from play or pass trials, and across all levels of image RPE (Fig. 2c), providing evidence that attention to feedback did not differ sub-stantially across our task conditions.
A more nuanced analysis revealed that participants were slightly more influenced by outcome information provided during all play trials irrespective of image RPE. This suggests that anticipatory attention is elevated slightly for play versus pass conditions, but it does not imply a difference in attention during play trials with dif-fering levels of image RPE (Supplementary Fig. 6b). Furthermore, there was no relationship between the degree to which participants modulated learning on the basis of gambling behaviour (play versus pass), and the degree to which they showed subsequent memory improvements during play trials (Supplementary Fig. 6c). Thus, although there seem to be small attentional shifts that relate to gam-bling behaviour, the size of such shifts is not a good predictor of which participants will experience a subsequent memory benefit. However, although our analyses suggest that the memory benefit
4.5 5.0 5.5
µ x–0.5 0 0.5
InterceptD
x
–0.1 0 0.1
–0.1 0 0.1Play or pass
–0.1 0 0.1
–0.1 0 0.1P(rew)
–0.1 0 0.1
–0.1 0 0.1Value
–0.1 0 0.1
–0.1 0 0.1Probability × value
–0.1 0 0.1
–0.1 0 0.1Surprise
–0.1 0 0.1
–0.1 0 0.1Uncertainty
Predictors (x ) Dx
Subjects (s)
Ms,i
Items (i )
Posterior densitya b
βi
βs,x
µx
σs
Intercept Play or pass P(rew) Value Probability × value Surprise Uncertainty
Fig. 6 | Hierarchical regression model reveals effects of choice and positive RPes on recognition memory encoding. a, Graphical depiction of the hierarchical regression model. Memory scores for each participant and item (Ms,i) were modelled as normally distributed with participant-specific variance (σs) and a mean that depended on the sum of two factors: (i) participant-level predictors related to the decision context in which an image was encountered (that is, whether the participant played or passed), linearly weighted according to coefficients (βs,x), and (ii) item-level predictors that specified which image was shown during each trial and weighted according to their overall memorability across participants (βi). Coefficients for participant level predictors were assumed to be drawn from a global mean value for each coefficient (μx) plus an offset related to the delay condition (Dx). Parameters were weakly constrained with priors that favoured mean coefficient values near zero and low variance across participant and item-specific coefficients. b, Posterior probability densities for mean predictor coefficients (μx; top row) and delay condition parameter difference (Dx; bottom row), estimated through Markov chain Monte Carlo sampling over the graphical model informed by the observable data (Ms,i); n = 199.
NAtuRe HuMAN BeHAvIouR | www.nature.com/nathumbehav

ArticlesNature HumaN BeHaviour
conferred by positive image RPEs is not mediated by attention, we cannot completely rule out the possibility that attention may have fluctuated with RPEs in ways we could not measure. Future work using proxy measurements of attention (for example, eye tracking) could further address whether attention can be dissociated from RPEs, and if so, whether it modulates the relationship between RPE and memory.
At first glance, our results appear incompatible with those of Wimmer and colleagues45, who showed that stronger RPE encoding in the ventral striatum is associated with weaker encoding of inci-dental information. We suspect that the discrepancy between these results is driven by differences in the degree to which memoranda are task relevant in the two paradigms. In our task, participants were required to encode the memoranda sufficiently to categorize them to perform the primary decision-making task, whereas in the Wimmer study, the memoranda were unrelated to the decision task and thus might not have been well-attended, particularly for trials
in which the decision task elicited an RPE. Taken together, these results suggest that RPEs are most likely to enhance memory when they are elicited by the memoranda themselves, with the potential influence of secondary tasks eliminated or at least tightly controlled.
A relationship between RPEs and memory is consistent with a broad literature that highlights the effects of dopaminergic signal-ling on hippocampal plasticity32,35,37 and memory formation42, as well as the studies that suggest that dopamine provides an RPE signal5,22 through projections from the midbrain to the striatum. It is thought that this dopaminergic RPE is also sent to the hippocampus through direct projections20, although—to our knowledge—this has never been verified directly and should be a target of future research. Our results not only support the behavioural consequences that might be predicted to result from such mechanisms, but also refine them substantially. In particular, we show that the timing of RPE signal-ling relative to the memorandum is key; we saw no effect of RPEs elicited by previous or subsequent feedback on memory (Fig. 5a),
a
b
ed
c
PlayPas
sPlay
Pass
0.6
1.0
1.4
1.8
f
Diff
eren
ce in
mem
ory
scor
es
Observed categoryUnobserved category
Observed categoryUnobserved category
d′
g
No de
lay
24 h
dela
y0.2 0.8
P(rew)
–0.15
–0.10
–0.05
0
0.05
0.10
0.15
0.20
Mem
ory
scor
e
0.2 0.8
P(rew)
–0.15
–0.10
–0.05
0
0.05
0.10
0.15
0.20
Mem
ory
scor
e
0
0.5
1.0
P(r
ew)
0 20 40 60 80 100 120 140 160
Trials
–40–20
02040
Imag
e R
PE
0
0.2
0.4
0.6
0.8
1.0
P(r
ew)
True P(rew | animate)True P(rew | inanimate)
Optimal model (animate)Optimal model (inanimate)
00.20.40.60.81.0
0 20 40 60 80 100 120 140 160
Trials
0 20 40 60 80 100 120 140 160
Trials
Fig. 7 | task structure and results from experiment 2. The effects of the observed and unobserved category probabilities on subsequent memory recall were estimated. a, Example task structure and model predictions. In the new learning task, the true reward probabilities of the two categories were independent and were restricted to either 0.2 or 0.8. The task contained at least one block (constituting at least 20 trials) of the four possible reward probability combinations (0.2 and 0.2, 0.2 and 0.8, 0.8 and 0.2, or 0.8 and 0.8). b, Trial-by-trial reward probability, showing stretches of stable reward probability (0.2 and 0.2 or 0.8 and 0.8) or varying reward probability (0.2 and 0.8 or 0.8 and 0.2). c, The variability of image RPE, influenced by the reward probability conditions shown in b. d, Average d′ for both delay conditions (no delay, n = 93; 24 h delay, n = 81). e, Mean pairwise difference in memory score between the old images and semantically matched foil images (new). f,g, Interaction between image category and reward probability for the no delay (f) and 24 h delay (g) conditions. There is a positive association between recognition memory and the reward probability of the currently observed image category and a negative association between memory and the reward probability of the other, unobserved image category. Data are mean ± s.e.m. In d–g, colours indicate time between encoding and memory testing; blue, no delay; red, 24 h delay.
NAtuRe HuMAN BeHAvIouR | www.nature.com/nathumbehav

Articles Nature HumaN BeHaviour
despite strong evidence that this feedback was used to guide rein-forcement learning and decision-making (Fig. 2). RPE-induced memory enhancement was selective to observed targets and did not generalize to semantically matched foils (Supplementary Fig. 5)—as would be expected for a hippocampal mechanism12—consistent with previous literature on the hippocampal dependence of recognition memory63,64. However, other aspects of our results—such as the lack of consolidation dependence (Fig. 6b)—deviate from previous lit-erature on dopamine-mediated memory enhancement in the hippo-campus42, raising questions regarding whether our observed memory enhancement might be mediated through an alternative dopamine signalling pathway such as pathways that target the striatum65 or the prefrontal cortex19,43,66. We hope that our behavioural study inspires future work to address these anatomical questions directly.
Although our results are consistent with some recent work that relates positive RPEs to better incidental61 and intentional47 mem-ory encoding, they differ from previous work in that image RPE effects emerged immediately and were not strengthened by a 24 h delay (Figs. 4 and 6, Supplementary Tables 1 and 2). Previous work from Stanek and colleagues61 showed that memory encoding ben-efits that are bestowed by positive RPEs required a substantial delay period for consolidation, consistent with studies that use rodents that show the mechanisms by which dopamine can enhance hippo-campal memory encoding in a consolidation-dependent manner42. However, it is unclear to what extent we should expect generaliza-tion of these results to our study, given the differences in experimen-tal paradigm, timescale, memory demands and species. The Stanek paradigm differed from ours in the timing and duration of image presentation, the relevance of the memoranda to task performance and the nature of the task itself (our RPEs were elicited in a choice task, whereas theirs were elicited through a Pavlovian paradigm)61. Indeed, our results suggest that the timing of the RPE relative to image presentation is an important determinant of memory effects; we demonstrate that the RPE elicited at the value time point 2.5 s before image presentation (Fig. 1, pink) had no appreciable effect
on subsequent memory (Fig. 4e). The RPE-inducing stimulus in the Stanek paradigm was presented 1.4 s before the memorandum, which is intermediate in timing between our image RPE (synchro-nous with memorandum) and our value RPE (preceding memo-randum). At the psychological level, it is clear that these timing differences are important, and it is possible that the strength of the encoding benefit—and even the consolidation dependence—may be sensitive to these small differences in relative timing. It should also be noted that the RPEs elicited at different times in our task occurred through the presentation of different types of information (for example, reward magnitude, reward probability and actual out-come) and thus our claims about timing assume that these distinct RPEs are conveyed in a common currency.
At the level of biological implementation, the consequence of differences in timing may be enhanced by differences in dopamine signalling in operant versus Pavlovian paradigms, with the former eliciting dopamine ramps that grow as an outcome becomes nearer in time67, and the latter eliciting the opposite trend in the firing of dopamine neurons68. Thus, it is possible that our positive prediction error conditions elicit both a phasic dopamine burst and a ramp of dopamine as the outcome approaches, whereas the Stanek para-digm elicits a short phasic burst followed by a decrease in baseline dopamine61. This signalling difference could be magnified by the differences in our presentation times; our image was present over the duration of the dopamine ramp, whereas the Stanek paradigm more precisely sampled the period during which a phasic spike in dopamine would be expected. Although it is clear that patterns of dopamine signalling differ across these task designs, it is not clear whether such differences are effectively communicated to the hip-pocampus or whether they could alter the consolidation depen-dence of dopamine-induced memory encoding benefits. Future work should carefully examine the effects of relative timing and task design on the magnitude and consolidation dependence of RPE benefits to human memory encoding. We hope that the emergence of these timing and task dependencies from human studies inspires parallel studies in rodents to characterize the precise temporal dynamics through which dopamine signals can and do facilitate memory formation, and the degree to which these dynamics affect underlying mechanisms, in particular the role of consolidation.
Our results also provide insights into apparent inconsisten-cies in previous studies that have attempted to link RPE signals to memory encoding. Consistent with previous work65, our results emphasize the importance of choice in the degree to which image RPEs contributed to memorability. Indeed, for trials in which the participants passively observed outcomes, we saw no relationship between model-derived RPE estimates and subsequent memory strength (Fig. 4a, dotted lines). This may help to explain the lack of a signed relationship between RPEs and subsequent memory strength in a recent study by Rouhani and colleagues, which lever-aged a Pavlovian design that did not require explicit choices to be made46. In contrast to our results, Rouhani and colleagues observed a positive effect of absolute RPE, similar to our model-based sur-prise estimates, on subsequent memory. Although we saw no effect of surprise on subsequent memory, other work has highlighted a role for such signals in the enhancement of hippocampal activa-tion and memory encoding69,70. One potential explanation for this discrepancy is in the timing of image presentation. Our study pre-sented images briefly during the choice phase of the decision task. By contrast, Rouhani and colleagues presented the memoranda for an extended period that encompassed the epoch containing trial feedback, potentially explaining why they observed effects related to outcome surprise46. More generally, the temporally selective effects of RPE observed here suggest that RPE effects may differ consid-erably from other manipulations across longer timescales that are thought to enhance memory consolidation through dopaminergic mechanisms21,33,43,44.
–0.1 0 0.1Play or pass
–0.1 0 0.1–0.1
0
0.1
Obs
erve
d im
age
prob
abili
typo
ster
ior
dens
ityUnobserved image probability
posterior density
Pos
terio
r de
nsity
a b
Fig. 8 | Hierarchical modelling results from experiment 2. a,b, Memory scores depend on participant gambling behaviour and on the probabilities associated with both image categories. Memory score data from experiment 2 were fit with a version of the hierarchical regression model described in Fig. 6a to replicate previous findings and determine whether reward probability effects were attributable to both observed and unobserved category probabilities; n = 174. a, Posterior probability estimates of the mean play or pass coefficient. The posterior estimates were greater than zero and consistent with those measured in experiment 1. b, Image category probability (observed) coefficients, plotted against other category probability (unobserved) coefficients, reveal that participants tended to have higher memory scores for images that were associated with high reward probabilities (upward shift of the density relative to zero) and when the unobserved image category was associated with a low reward probability (leftward shift of the density relative to zero).
NAtuRe HuMAN BeHAvIouR | www.nature.com/nathumbehav

ArticlesNature HumaN BeHaviour
In summary, our results demonstrate a role for image RPEs in enhancing memory encoding. We show that this role is temporally and computationally precise, independent of consolidation dura-tion (at least in the current paradigm), and contingent on decision-making behaviour. These data should help to clarify inconsistencies in the literature regarding the relationship between reward learning and memory. The detailed predictions we have made using these data could be tested in future studies exploring the relationship between dopamine signalling and memory formation.
MethodsExperiment 1. Experimental procedure. The task consisted of two parts—the learning task and the memory task. The learning task was a reinforcement learning task with random change points in reward contingencies of the targets. The memory task was a surprise recognition memory task using image stimuli that were presented during the learning task and foils.
Participants completed either the no delay or 24 h delay versions of the task using Amazon Mechanical Turk. For the no delay condition, the memory task followed the learning task after only a short break, during which a demographic survey was given. The entire task was therefore performed in one sitting. For the 24 h delay condition, participants returned 20–30 h after completing the learning task to do the memory task.
One task for each specific condition (no delay or 24 h delay) was administered at a time, and participants who agreed to complete the task online at the time of administration were recruited for that task condition. Data collection—but not the analysis—was performed blind to the conditions of the experiments.
Participants. A total of 287 participants (142 for the no delay condition; 145 for the 24 h delay condition) completed the task using the Amazon Mechanical Turk website. Target sample sizes were chosen on the basis of the results of an initial pilot study that used a similar design and was administered to a similar online target population. Randomization across conditions was determined by the day that participants accepted to complete the human intelligence task that was posted on Amazon Mechanical Turk. Neither participants nor experimenters were blind to the delay condition. From the total participant pool, 88 participants (33, no delay; 55, 24 h delay) were excluded from analysis because they previously completed an older version of the task or did not meet our criteria of above-chance performance in the learning task. To determine whether a participant’s performance was above chance, we simulated random choices using the same learning task structure, then computed the total score achieved by the random performance simulation. We then repeated such simulations 5,000 times and assessed whether the participant’s score was greater than 5% of the score distribution from the simulations. The final sample had a total of 199 participants (109 for the no delay condition; 90 for the 24 h delay condition; 101 males, 98 females) with an average age of 32.2 ± 8.5 yr (mean ± s.d.). Informed consent was obtained in a manner approved by the Brown University Institutional Review Board.
Learning task. The learning task consisted of 160 trials and each trial consisted of three phases—value, image and feedback (Fig. 1a). During the value phase, the amount of reward associated with the current trial was presented in the middle of the screen for 2 s. This value was equally sampled from [1, 5, 10, 20, 100]. After an interstimulus interval (ISI) of 0.5 s, an image appeared in the middle of the screen for 3 s (image phase). During the image phase, the participant made one of two possible responses using the keyboard: play (press 1) or pass (press 0). When a response is made, a coloured box indicating the participant’s choice (for example, black indicates play and white indicates pass) appeared around the image. The pairing of box colour with the participant choice was pseudorandomized across participants. This image phase was followed by an ISI of 0.5 s, after which the feedback of the trial was shown (feedback phase). The order of images was pseudorandomized.
Each trial had an assigned reward probability, such that if the participant chose play, they would be rewarded according to that probability. If the participant chose play and the trial was rewarding, they were rewarded by the amount shown during the value phase (Fig. 1a). If the participant chose play but the trial was not rewarding, they lost 10 points regardless of the value of the trial. If the choice was pass, the participant neither earned nor lost points (+0), and was shown the hypothetical result of choosing play (Fig. 1a). During the feedback phase, the reward feedback (+value, −10 or hypothetical result) was shown for 1.5 s, followed by an ISI (0.5 s) and a 1 s presentation of the participant’s total accumulated score.
All image stimuli belonged to one of two categories: animate (for example, whale or camel) or inanimate (for example, desk or shoe). Each image belonged to a unique exemplar such that there were no two images of the same animal or object. Images of the two categories had reward probabilities that were oppositely yoked. For example, if the animate category has a reward probability of 90%, the inanimate category had a reward probability of 10%. Therefore, participants only had to learn the probability for one category, and simply assume the opposite probability for the other category.
The reward probability for a given image category remained stable until a change point occurred, after which it changed to a random value between 0 and 1 (Fig. 1d). Change points occurred with a probability 0.16 for each trial. To facilitate learning, change points did not occur in the first 20 trials of the task and the first 15 trials following a change point. Each participant completed a unique task with a pseudorandomized order of images that followed these constraints.
The objective was to maximize the total number of points earned. Participants were advised to pay close attention to the value, probability and category of each trial to decide whether it is better to play or pass. Participants were thoroughly informed about the possibility of change points, and that the two categories were oppositely yoked. The participants underwent a practice learning task in which the reward probabilities for the two categories were 1 and 0 to clearly demonstrate these features of the task. Participants were awarded a bonus compensation proportional to the total points earned during the learning and memory tasks.
Computing the image RPE. The image RPE arises from the fact that the reward probabilities associated with the two image categories (animate or inanimate) differ. For instance, consider a trial in which the trial value was 100, the animate category was associated with a reward probability of 0.9, and an animate image was presented. The expected reward for that trial could be computed as follows:
= × ∣ − × − ∣
= × . − × . =
P Pexpected reward value (rew animate) 10 (1 (rew animate))
100 0 9 10 0 1 89
By contrast, if the other (inanimate) category had been presented, the expected reward would be as follows:
= × ∣ − × − ∣
= × . − × . =
P Pexpected reward value (rew inanimate) 10 (1 (rew inanimate))
100 0 1 10 0 9 1
We assume that participant reward expectations before observing the image category simply average across these two categories. Thus, in this case, the expectation before observing the animate image would have been (89 × 0.5 + 1 × 0.5) = 45. The image RPE was computed by subtracting the expected reward after the image category was revealed from the expected reward before it was revealed, in this case 89 − 45 = 44.
Memory task. During the memory task, participants viewed 160 old images from the learning task that were intermixed with 160 new images (Fig. 1i). Importantly, we ensured that the new images were semantically matched to the old images. All 160 images in the learning task were those of unique exemplars, and the 160 new images were different images of the same exemplars. Therefore, accurate responding depended on the retrieval of detailed perceptual information from encoding (for example, ‘I remember seeing this desk’, instead of ‘I remember seeing a desk’).
The order of old and new images was pseudorandomized. For each trial, a single image was presented, and the participant selected between old and new by pressing 1 or 0 on the keyboard, respectively (Fig. 1i). Afterwards, they were asked to rate their confidence in the choice from 1 (a guess) to 4 (completely certain). The participants were not provided with feedback on whether their choices were correct or incorrect.
Bayesian ideal observer model. The ideal observer model computed inferences over the probability of a binary outcome that evolved according to a change-point process. The model was given information about the true probability of a change point occurring for each trial (H; hazard rate) by dividing the number of change points by the total number of trials for each participant. For each trial, a change point was sampled according to a Bernoulli distribution using the true hazard rate (CP ≈ B(H)). If a change point did not occur (CP = 0), the predicted reward rate (μt) was updated from the previous trial (μt − 1). When a change point did occur (CP = 1), μt was sampled from a uniform distribution between 0 and 1. Given the previous outcomes, the posterior probability of the reward rate of each trial can be formulated as follows:
∑ ∑μ μ μ μ μ∣ ∝ ∣ ∣ ∣μ
− − −
−
P X P X P P P X P X( ) ( ) ( CP, ) (CP) ( ) ( ) (1)t t t t t t t t t t t1:CP
1 1 1: 1: 1t t 1
where μ∣P X( )t t is the likelihood of the outcomes given the predicted reward rate, μ μ∣ −P ( CP, )t t t 1 represents the process of accounting for a possible change point
(when CP = 1, μt ~ U(0,1), where U refers to the fact that the new mean (μt) is drawn from a uniform distribution with parameters 0 and 1; more simply, it is set to a random number sampled on the continuous range from 0 to 1), P(CPt) is the hazard rate and μ ∣−P X( )t t1 1: is the prior belief of the reward rate.
Using the model-derived reward rate, we quantified the extent to which each new outcome influenced the subsequent prediction as the learning rate in a delta-rule:
NAtuRe HuMAN BeHAvIouR | www.nature.com/nathumbehav

Articles Nature HumaN BeHaviour
α δδ
= += −+B B
X B (2)t t t t
t t t
1
where B is the belief about the current reward rate, α is the learning rate and δ is the prediction error, defined as the difference between the observed (X) and predicted (B) outcome. By rearranging, we were able to compute the trial by trial learning rate (Supplementary Fig. 8):
α =−
−+B B
X B(3)t t
t t
1
The trial-by-trial modulation of change-point probability (that is, surprise) was calculated by marginalizing over μt, which is a measure of how likely it is—given the current observation—that a change point has occurred (Supplementary Fig. 8):
∑ ∑μ μ μ μ∣ ∝ ∣ ∣ ∣μ μ
− − −
−
P X P X P P P X P X(CP ) ( ) ( CP, ) (CP) ( ) ( ) (4)t t t t t t t t t t t1: 1 1 1: 1: 1
t t 1
Uncertainty was determined by computing the entropy of the posterior probability distribution of the reward rate for each trial, measured in units of nats (Supplementary Fig. 8):
∑ μ μ= − ∣ ∣H t P X P X( ) ( )ln( ( )) (5)t t t t1: 1:
Descriptive analysis. Memory scores for each image were computed by transforming the recognition and confidence reports provided by the participant. During each trial of the recognition memory task, participants first chose between old and new, then reported their confidence in that choice on a scale of 1 to 4. We converted these responses so that choosing old with the highest confidence (4) was scored as 8, whereas choosing new with the highest confidence was scored as 1. Similarly, choosing old with the lowest confidence (1) was scored as 5, whereas choosing new with the lowest confidence was scored as 4. As such, memory scores reflected a confidence-weighted measure of memory strength ranging from 1 to 8. These memory scores were used for all analyses that involved recognition memory.
For some statistical tests and plots (Figs. 4, 5 and 7f), memory scores for target items were mean-centred per participant by subtracting out the average memory score across only the target items. Statistical analyses were then performed in a between-participant manner to assess the degree to which certain task variables affected mean-centred memory scores.
The relationships between computational factors and memory scores were assessed by estimating the slope of the relationship between each computational factor and the subsequent memory score separately for each computational variable and participant. Statistical testing was performed using one-sample t-tests on the regression coefficients across participants (for overall effects) and two-sample t-tests for differences between delay conditions (for delay effects).
When reward probability was included in a statistical analysis, we used the reward probabilities estimated by the Bayesian ideal observer model described above, as these subjective estimates of the reward rate departed substantially from ground-truth probabilities after change points and were more closely related to behaviour.
To generate the descriptive figures, we performed a binning procedure for each participant to ensure that each point on the x axis contained an equal number of elements. For each participant, we divided the y variable in question into quantiles and used the mean y value of each quantile as the binned value. To plot data from all participants on the same x axis, we first determined the median x value for each bin per participant, then took the average of the bin median values across participants. For figures that contain more than one plot, we shifted the x values of each plot slightly off-centre to avoid overlap of points (Figs. 5 and 7f).
We were interested in testing whether participants who were sensitive to reward value and probability also had a strong image RPE on memory effect. In other words, participants who better adjusted their behaviour using information about the trial value and probability will be more likely to remember items associated with higher RPEs. To quantify sensitivity to reward value and probability, we fit a logistic regression model to play or pass behaviour that included z-scored versions of the reward probability (derived from the ideal observer model) and reward value as predictors for each participant. To find the effect of image RPE on memory, we fit a linear regression model on mean-centred memory score that included the image RPE as the predictor. We then computed the Spearman correlation between the coefficients of the two regression models.
Unless otherwise specified, statistical comparisons in the manuscript used a two-tailed t-test. Data distribution was assumed to be normal, but this was not formally tested. We used an α = 0.05 for all statistical tests.
Reinforcement learning model fitting. We fit a reinforcement learning model directly to the participant behaviour using a constrained search algorithm (fmincon in MATLAB 2016a), which computed a set of parameters that maximized the total
log posterior probability of betting behaviour (Fig. 2c). Four such parameters were included in the model: (1) a temperature parameter of the softmax function used to convert trial expected values to action probabilities, (2) a value exponent term that scales the relative importance of the trial value in making choices, (3) a play bias term that indicates a tendency to attribute higher value to gambling behaviour and (4) an intercept term for the effect of learning rate on choice behaviour. In fitting the model, we wanted to account for the fact that there may be individual differences in how a participant’s betting behaviour is biased by certain aspects of the task. For instance, some participants may be more sensitive to trial value, whereas others may attribute higher value to trials in which they gambled. This was the rationale behind adding the second and third parameters. The overall ‘biased’ value that was estimated from gambling on a given trial was given by:
= + × + − × −V t B P V P( ) ( (1 ) ( 10) )B tk k
play rew rew
Where Bplay is the play bias term, Vt is the trial value (provided during the value phase) and k is the value exponent. This overall value term was converted into action probabilities ∣ ∣P V t P V t( (play ( )), (pass ( ))) using a softmax function. This was our base model.
Next, we fit additional reinforcement learning models to the data by adding parameters to the base model described above. These additional parameters controlled the extent to which other task variables affected the trial-to-trial modulation of learning rate, including surprise, uncertainty, the learning rate computed from the ideal observer model and betting behaviour. Specifically, the learning rate was determined by a logistic function of a weighted predictor matrix that included the above variables and an intercept term. Therefore, the model captured the degree to which the learning rate changed as a function of these variables. The best-fitting model was determined by computing the Bayesian information criterion for each model, then comparing these values to that of the base model71.
To compare participant behaviour to model-predicted behaviour, we simulated choice behaviour using the model with the lowest Bayesian information criterion, which incorporated surprise and uncertainty variables in determining learning rate (Fig. 2b). For each trial, we used the expected trial value (V(t)) computed above, and the parameter estimates of the temperature variable as inputs to a softmax function to generate choices.
Hierarchical regression model. Participant memory scores were modelled using a hierarchical mixture model that assumed that the memory score reported for each item and participant would reflect a linear combination of participant level predictors and item level memorability (Fig. 6a). The hierarchical model was specified in STAN using the matlabSTAN interface (http://mc-stan.org)72. In brief, memory scores for each trial were assumed to be normally distributed with a variance that was fixed across all trials for a given participant. The mean of the memory score distribution for a given trial depended on trial-to-trial task predictors that were weighted according to coefficients estimated at the participant level and item-to-item predictors that were weighted by coefficients that were estimated across all participants. Participant coefficients for each trial-to-trial task predictor were assumed to be drawn from a group distribution with a mean and variance offset by a delay variable, which allowed the model to capture differences in coefficient values for the two different delay conditions. All model coefficients were assumed to be drawn from prior distributions; for all coefficients other than the intercept (which captured overall memory scores); prior distributions were centred on zero.
Experiment 2. Experimental procedure. In experiment 2, the learning task was modified to dissociate reward rate from RPE. The reward probability of the two image categories (animate versus inanimate) were independent and set to either 0.8 or 0.2, allowing for a 2 × 2 design (0.8/0.8, 0.8/0.2, 0.2/0.8 or 0.2/0.2; Fig. 7a). Change points occurred with a probability 0.05 on every trial for the two categories independently. Change points did not occur during the first 20 trials of the task or the first 20 trials following a change point. Tasks were generated to contain at least one block of each trial type in the 2 × 2 design. Each participant completed a unique task with a pseudorandomized order of images that followed these constraints. The task instructions explicitly stated that the two image categories had independent reward probabilities that needed to be tracked separately. Importantly, participants were also unaware that the probabilities were either 0.2 or 0.8, and most likely assumed that the probabilities could be set to any value ranging from 0 to 1. The rest of the task—including the recognition memory portion—was identical to that of experiment 1.
Participants. A total of 279 participants (157 for the no delay condition; 122 for the 24 h delay condition) completed the task on Amazon Mechanical Turk. In total, 105 participants (64 for the no delay condition; 41 for the 24 h delay condition) were excluded from analysis because they previously completed an older version of the task or did not meet our criteria of above-chance performance in the learning task. The criteria for above-change performance was identical to those of experiment 1. Participants who completed experiment 1 or any previous versions of the task were identified and excluded using the participant-unique
NAtuRe HuMAN BeHAvIouR | www.nature.com/nathumbehav

ArticlesNature HumaN BeHaviour
identifier that is provided by Amazon Mechanical Turk, to ensure that participants were unaware of the surprise memory portion of the task. The final sample had a total of 174 participants (93 for the no delay condition and 81 for the 24 h delay condition; 101 males, 71 females, 2 no response) with an average age of 34.0 ± 9.1 (mean ± s.d.). Informed consent was obtained in a manner approved by the Brown University Institutional Review Board.
Reporting Summary. Further information on research design is available in the Nature Research Reporting Summary linked to this article.
Data availabilityThe behavioural data from both experiments are available from the corresponding author on request.
Code availabilityCustom code used to analyse and model the data is available from the corresponding author on request.
Received: 21 May 2018; Accepted: 27 March 2019; Published: xx xx xxxx
References 1. Sutton, R. & Barto, A. Reinforcement Learning: An Introduction (MIT Press,
1998). 2. Schacter, D. L. & Tulving, E. Memory Systems 1994 (MIT Press, 1994). 3. McClelland, J. L., McNaughton, B. L. & O’Reilly, R. C. Why there are
complementary learning systems in the hippocampus and neocortex: insights from the successes and failures of connectionist models of learning and memory. Psychol. Rev. 102, 419–457 (1995).
4. O’Reilly, R. C., Bhattacharyya, R., Howard, M. D. & Ketz, N. Complementary learning systems. Cogn. Sci. 38, 1229–1248 (2014).
5. Schultz, W. A neural substrate of prediction and reward. Science 275, 1593–1599 (1997).
6. Frank, M. J. By carrot or by stick: cognitive reinforcement learning in parkinsonism. Science 306, 1940–1943 (2004).
7. O’Doherty, J. et al. Dissociable roles of ventral and dorsal striatum in instrumental conditioning. Science 304, 452–454 (2004).
8. Sohal, V. S., Zhang, F., Yizhar, O. & Deisseroth, K. Parvalbumin neurons and gamma rhythms enhance cortical circuit performance. Nature 459, 698–702 (2009).
9. Squire, L. R. Memory and the hippocampus: a synthesis from findings with rats, monkeys, and humans. Psychol. Rev. 99, 195–231 (1992).
10. Nadel, L. & Moscovitch, M. Memory consolidation, retrograde amnesia and the hippocampal complex. Curr. Opin. Neurobiol. 7, 217–227 (1997).
11. Wan, H., Aggleton, J. P. & Brown, M. W. Different contributions of the hippocampus and perirhinal cortex to recognition memory. J. Neurosci. 19, 1142–1148 (1999).
12. Eichenbaum, H., Yonelinas, A. P. & Ranganath, C. The medial temporal lobe and recognition memory. Annu. Rev. Neurosci. 30, 123–152 (2007).
13. Moscovitch, M., Cabeza, R., Winocur, G. & Nadel, L. Episodic memory and beyond: the hippocampus and neocortex in transformation. Annu. Rev. Psychol. 67, 105–134 (2016).
14. Lohnas, L. J. et al. Time-resolved neural reinstatement and pattern separation during memory decisions in human hippocampus. Proc. Natl Acad. Sci. USA 115, E7418–E7427 (2018).
15. Jang, A. I., Wittig, J. H.Jr, Inati, S. K. & Zaghloul, K. A. Human cortical neurons in the anterior temporal lobe reinstate spiking activity during verbal memory retrieval. Curr. Biol. 27, 1700–1705 (2017).
16. Heilbronner, S. R., Rodriguez-Romaguera, J., Quirk, G. J., Groenewegen, H. J. & Haber, S. N. Circuit-based corticostriatal homologies between rat and primate. Biol. Psychiat. 80, 509–521 (2016).
17. Thierry, A. M., Gioanni, Y., Dégénétais, E. & Glowinski, J. Hippocampo-prefrontal cortex pathway: anatomical and electrophysiological characteristics. Hippocampus 10, 411–419 (2000).
18. Atallah, H. E., Frank, M. J. & O’Reilly, R. C. Hippocampus, cortex, and basal ganglia: insights from computational models of complementary learning systems. Neurobiol. Learn. Mem. 82, 253–267 (2004).
19. Eichenbaum, H. Prefrontal–hippocampal interactions in episodic memory. Nat. Rev. Neurosci. 18, 547–558 (2017).
20. Floresco, S. B. Dopaminergic regulation of limbic-striatal interplay. J. Psychiat. Neurosci. 32, 400–411 (2007).
21. Shohamy, D. & Adcock, R. A. Dopamine and adaptive memory. Trends Cogn. Sci. 14, 464–472 (2010).
22. Montague, P. R., Dayan, P. & Sejnowski, T. J. A framework for mesencephalic dopamine systems based on predictive Hebbian learning. J. Neurosci. 16, 1936–1947 (1996).
23. Steinberg, E. E. et al. A causal link between prediction errors, dopamine neurons and learning. Nat. Neurosci. 16, 966–973 (2013).
24. Schultz, W. Dopamine reward prediction-error signalling: a two-component response. Nat. Rev. Neurosci. 17, 183–195 (2016).
25. Berridge, K. C. & Robinson, T. E. What is the role of dopamine in reward: hedonic impact, reward learning, or incentive salience? Brain Res. Rev. 28, 309–369 (1998).
26. Fiorillo, C. D., Tobler, P. N. & Schultz, W. Discrete coding of reward probability and uncertainty by dopamine neurons. Science 299, 1898–1902 (2003).
27. Clark, C. A. & Dagher, A. The role of dopamine in risk taking: a specific look at Parkinson’s disease and gambling. Front. Behav. Neurosci. 8, 196 (2014).
28. Stopper, C. M., Tse, M. T. L., Montes, D. R., Wiedman, C. R. & Floresco, S. B. Overriding phasic dopamine signals redirects action selection during risk/reward decision making. Neuron 84, 177–189 (2014).
29. Collins, A. G. E. & Frank, M. J. Opponent actor learning (OpAL): modeling interactive effects of striatal dopamine on reinforcement learning and choice incentive. Psychol. Rev. 121, 337–366 (2014).
30. Zalocusky, K. A. et al. Nucleus accumbens D2R cells signal prior outcomes and control risky decision-making. Nature 531, 642–646 (2016).
31. Rutledge, R. B., Skandali, N., Dayan, P. & Dolan, R. J. Dopaminergic modulation of decision making and subjective well-being. J. Neurosci. 35, 9811–9822 (2015).
32. Lisman, J. E. & Grace, A. A. The hippocampal-VTA loop: controlling the entry of information into long-term memory. Neuron 46, 703–713 (2005).
33. Wittmann, B. C. et al. Reward-related fMRI activation of dopaminergic midbrain is associated with enhanced hippocampus-dependent long-term memory formation. Neuron 45, 459–467 (2005).
34. Tully, K. & Bolshakov, V. Y. Emotional enhancement of memory: how norepinephrine enables synaptic plasticity. Mol. Brain 3, 15 (2010).
35. Rosen, Z. B., Cheung, S. & Siegelbaum, S. A. Midbrain dopamine neurons bidirectionally regulate CA3-CA1 synaptic drive. Nat. Neurosci. 18, 1763–1771 (2015).
36. Weitemier, A. Z. & McHugh, T. J. Noradrenergic modulation of evoked dopamine release and pH shift in the mouse dorsal hippocampus and ventral striatum. Brain Res. 1657, 74–86 (2017).
37. Lemon, N. & Manahan-Vaughan, D. Dopamine D1/D5 receptors gate the acquisition of novel information through hippocampal long-term potentiation and long-term depression. J. Neurosci. 26, 7723–7729 (2006).
38. McNamara, C. G., Tejero-Cantero, Á., Trouche, S., Campo-Urriza, N. & Dupret, D. Dopaminergic neurons promote hippocampal reactivation and spatial memory persistence. Nat. Neurosci. 17, 1658–1660 (2014).
39. Gan, J. O., Walton, M. E. & Phillips, P. E. M. Dissociable cost and benefit encoding of future rewards by mesolimbic dopamine. Nat. Neurosci. 13, 25–27 (2009).
40. Bayer, H. M. & Glimcher, P. W. Midbrain dopamine neurons encode a quantitative reward prediction error signal. Neuron 47, 129–141 (2005).
41. Zaghloul, K. A. et al. Human substantia nigra neurons encode unexpected financial rewards. Science 323, 1496–1499 (2009).
42. Bethus, I., Tse, D. & Morris, R. G. M. Dopamine and memory: modulation of the persistence of memory for novel hippocampal NMDA receptor-dependent paired associates. J. Neurosci. 30, 1610–1618 (2010).
43. Murty, V. P. & Adcock, R. A. Enriched encoding: reward motivation organizes cortical networks for hippocampal detection of unexpected events. Cereb. Cortex 24, 2160–2168 (2013).
44. Murty, V. P., Tompary, A., Adcock, R. A. & Davachi, L. Selectivity in postencoding connectivity with high-level visual cortex is associated with reward-motivated memory. J. Neurosci. 37, 537–545 (2017).
45. Wimmer, G. E., Braun, E. K., Daw, N. D. & Shohamy, D. Episodic memory encoding interferes with reward learning and decreases striatal prediction errors. J. Neurosci. 34, 14901–14912 (2014).
46. Rouhani, N., Norman, K. A. & Niv, Y. Dissociable effects of surprising rewards on learning and memory. J. Exp. Psychol. Learn. Mem. Cogn. 44, 1430–1443 (2018).
47. De Loof, E. et al. Signed reward prediction errors drive declarative learning. PLoS One 13, e0189212 (2018).
48. Bouret, S. & Sara, S. J. Network reset: a simplified overarching theory of locus coeruleus noradrenaline function. Trends Neurosci. 28, 574–582 (2005).
49. Yu, A. J. & Dayan, P. Uncertainty, neuromodulation, and attention. Neuron 46, 681–692 (2005).
50. Nassar, M. R. et al. Rational regulation of learning dynamics by pupil-linked arousal systems. Nat. Neurosci. 15, 1040–1046 (2012).
51. Preuschoff, K., ’t Hart, M. & Einhäuser, W. Pupil dilation signals surprise: evidence for noradrenaline’s role in decision making. Front. Neurosci. 5, 115 (2011).
52. Behrens, T. E. J., Woolrich, M. W., Walton, M. E. & Rushworth, M. F. S. Learning the value of information in an uncertain world. Nat. Neurosci. 10, 1214–1221 (2007).
53. Nassar, M. R., Wilson, R. C., Heasly, B. & Gold, J. I. An approximately Bayesian delta-rule model explains the dynamics of belief updating in a changing environment. J. Neurosci. 30, 12366–12378 (2010).
54. Doya, K. Modulators of decision making. Nat. Neurosci. 11, 410–416 (2008).
NAtuRe HuMAN BeHAvIouR | www.nature.com/nathumbehav

Articles Nature HumaN BeHaviour
55. McGuire, J. T., Nassar, M. R., Gold, J. I. & Kable, J. W. Functionally dissociable influences on learning rate in a dynamic environment. Neuron 84, 870–881 (2014).
56. Nassar, M. R. et al. Age differences in learning emerge from an insufficient representation of uncertainty in older adults. Nat. Commun. 7, 11609 (2016).
57. Cohen, J. Y., Haesler, S., Vong, L., Lowell, B. B. & Uchida, N. Neuron-type-specific signals for reward and punishment in the ventral tegmental area. Nature 482, 85–88 (2012).
58. Rutledge, R. B. et al. Dopaminergic drugs modulate learning rates and perseveration in Parkinson’s patients in a dynamic foraging task. J. Neurosci. 29, 15104–15114 (2009).
59. Sadacca, B. F., Jones, J. L. & Schoenbaum, G. Midbrain dopamine neurons compute inferred and cached value prediction errors in a common framework. eLife 5, e13665 (2016).
60. Frey, U. & Morris, R. G. Synaptic tagging: implications for late maintenance of hippocampal long-term potentiation. Trends Neurosci. 21, 181–188 (1998).
61. Stanek, J. K., Dickerson, K. C., Chiew, K. S., Clement, N. J. & Adcock, R. A. Expected reward value and reward uncertainty have temporally dissociable effects on memory formation. Preprint at bioRxiv https://doi.org/10.1101/280164 (2018).
62. Murty, V. P., DuBrow, S. & Davachi, L. The simple act of choosing influences declarative memory. J. Neurosci. 35, 6255–6264 (2015).
63. Broadbent, N. J., Squire, L. R. & Clark, R. E. Spatial memory, recognition memory, and the hippocampus. Proc. Natl Acad. Sci. USA 101, 14515–14520 (2004).
64. Squire, L. R., Wixted, J. T. & Clark, R. E. Recognition memory and the medial temporal lobe: a new perspective. Nat. Rev. Neurosci. 8, 872–883 (2007).
65. Koster, R., Guitart-Masip, M., Dolan, R. J. & Düzel, E. Basal ganglia activity mirrors a benefit of action and reward on long-lasting event memory. Cereb. Cortex 25, 4908–4917 (2015).
66. Cohen, M. S., Rissman, J., Suthana, N. A., Castel, A. D. & Knowlton, B. J. Value-based modulation of memory encoding involves strategic engagement of fronto-temporal semantic processing regions. Cogn. Affect. Behav. Neurosci. 14, 578–592 (2014).
67. Hamid, A. A. et al. Mesolimbic dopamine signals the value of work. Nat. Neurosci. 19, 117–126 (2016).
68. Starkweather, C. K., Babayan, B. M., Uchida, N. & Gershman, S. J. Dopamine reward prediction errors reflect hidden-state inference across time. Nat. Neurosci. 20, 581–589 (2017).
69. Long, N. M., Lee, H. & Kuhl, B. A. Hippocampal mismatch signals are modulated by the strength of neural predictions and their similarity to outcomes. J. Neurosci. 36, 12677–12687 (2016).
70. Greve, A., Cooper, E., Kaula, A., Anderson, M. C. & Henson, R. Does prediction error drive one-shot declarative learning?. J. Mem. Lang. 94, 149–165 (2017).
71. Schwartz, G. Estimating the Dimension of a Model. Ann. Stat. 6, 461–464 (1978).
72. Carpenter, B. et al. Stan: A probabilistic programming language. J. Stat. Soft. https://doi.org/10.18637/jss.v076.i01 (2017).
AcknowledgementsWe thank A. Collins for comments on the experimental design and thank J. Helmers and D. Rogers for their help in setting up and collecting data through Amazon Mechanical Turk. This work was funded by NIH grant numbers F32MH102009 and K99AG054732 (M.R.N.), NIMH R01 MH080066-01 and NSF Proposal number 1460604 (M.J.F.), and R00MH094438 (D.G.D.). The funders had no role in study design, data collection and analysis, decision to publish or preparation of the manuscript.
Author contributionsA.I.J., M.R.N., D.G.D. and M.J.F. designed the experiment and wrote the manuscript. A.I.J. collected the data and M.R.N. developed the computational models. M.R.N. and A.I.J. designed and performed behavioural analysis.
Competing interestsThe authors declare no competing interests.
Additional informationSupplementary information is available for this paper at https://doi.org/10.1038/s41562-019-0597-3.
Reprints and permissions information is available at www.nature.com/reprints.
Correspondence and requests for materials should be addressed to M.R.N.
Publisher’s note: Springer Nature remains neutral with regard to jurisdictional claims in published maps and institutional affiliations.© The Author(s), under exclusive licence to Springer Nature Limited 2019
NAtuRe HuMAN BeHAvIouR | www.nature.com/nathumbehav

1
nature research | reporting summ
aryApril 2018
Corresponding author(s): Matthew Nassar
Reporting SummaryNature Research wishes to improve the reproducibility of the work that we publish. This form provides structure for consistency and transparency in reporting. For further information on Nature Research policies, see Authors & Referees and the Editorial Policy Checklist.
Statistical parametersWhen statistical analyses are reported, confirm that the following items are present in the relevant location (e.g. figure legend, table legend, main text, or Methods section).
n/a Confirmed
The exact sample size (n) for each experimental group/condition, given as a discrete number and unit of measurement
An indication of whether measurements were taken from distinct samples or whether the same sample was measured repeatedly
The statistical test(s) used AND whether they are one- or two-sided Only common tests should be described solely by name; describe more complex techniques in the Methods section.
A description of all covariates tested
A description of any assumptions or corrections, such as tests of normality and adjustment for multiple comparisons
A full description of the statistics including central tendency (e.g. means) or other basic estimates (e.g. regression coefficient) AND variation (e.g. standard deviation) or associated estimates of uncertainty (e.g. confidence intervals)
For null hypothesis testing, the test statistic (e.g. F, t, r) with confidence intervals, effect sizes, degrees of freedom and P value noted Give P values as exact values whenever suitable.
For Bayesian analysis, information on the choice of priors and Markov chain Monte Carlo settings
For hierarchical and complex designs, identification of the appropriate level for tests and full reporting of outcomes
Estimates of effect sizes (e.g. Cohen's d, Pearson's r), indicating how they were calculated
Clearly defined error bars State explicitly what error bars represent (e.g. SD, SE, CI)
Our web collection on statistics for biologists may be useful.
Software and codePolicy information about availability of computer code
Data collection Data was collected through Amazon Mechanical Turk (MTurk). We used the psiTurk Toolbox (https://psiturk.org/) to maintain the web server and manage the database for the experiments. We customized the JavaScript template code from the jsPsych library (https://www.jspsych.org/) to run our behavioral experiments.
Data analysis All analyses were performed using custom MATLAB scripts. Hierarchical regression model was fit using STAN for MCMC sampling and matlabSTAN to interface with matlab.
For manuscripts utilizing custom algorithms or software that are central to the research but not yet described in published literature, software must be made available to editors/reviewers upon request. We strongly encourage code deposition in a community repository (e.g. GitHub). See the Nature Research guidelines for submitting code & software for further information.

2
nature research | reporting summ
aryApril 2018
DataPolicy information about availability of data
All manuscripts must include a data availability statement. This statement should provide the following information, where applicable: - Accession codes, unique identifiers, or web links for publicly available datasets - A list of figures that have associated raw data - A description of any restrictions on data availability
The data from both experiments and the scripts used to analyze and model the data are available from the authors upon request.
Field-specific reportingPlease select the best fit for your research. If you are not sure, read the appropriate sections before making your selection.
Life sciences Behavioural & social sciences Ecological, evolutionary & environmental sciences
For a reference copy of the document with all sections, see nature.com/authors/policies/ReportingSummary-flat.pdf
Behavioural & social sciences study designAll studies must disclose on these points even when the disclosure is negative.
Study description This study involved quantitative measurements of decision making and learning behavior along with quantitative measurements of incidental memories formed about images presented in the learning and decision making task, which were collected either immediately (no delay) or 24 hours after completion of the initial task (24hr delay).
Research sample Users of Amazon Mechanical Turk (MTurk) that had IP addresses in the United States of America and had to have 95% of their previous HITs approved. Previous work has indicated that mechanical turk samples are not representative of the population as a whole, but that results from mechanical turk cognitive science studies replicate those performed in the laboratory, which typically rely on undergraduate participants. Here we opted to use MTurk in order to ensure sufficient power to test our hypotheses given that we expected our measurements of trial-to-trial memory reports to contain substantial variability.
Sampling strategy Our experiment, along with a brief advertisement describing it, was posted as a HIT (human intelligence task). We excluded MTurk users that were outside of the country. Assignment to conditions was determined according to the day that a user accepted the HIT and experimenters were blind the specific users that were present on the days in which HITs were posted. Explicit power analyses were not performed before data collection. Sample sizes were based on other recognition memory studies and MTurk studies and are in line with similar recognition memory experiments that have relied on MTurk for data collection (eg. Rouhani, Norman & Niv, 2018).
Data collection Data was collected on personal computers (not tablets or phones) of the participants through a web-based video game interface. Experimenters did not interact with participants during data collection and thus any person that was present at the time of data collection was blind to the experimental condition and the study hypothesis.
Timing Experiment 1 was conducted between May and December, 2015. Experiment 2 was conducted in April and May, 2016
Data exclusions In Experiment 1, 88 out of 287 subjects were excluded. In Experiment 2, 105 out of 279 subjects were excluded. In both cases, subjects were excluded if they have completed any prior version of our tasks, so that they are not aware of the surprise recognition memory portion of the task. Subjects were also excluded if their performance on the learning task was not significantly better than simulated random behavior to ensure that subjects were actively engaged in the task. Both exclusion criteria were determined prior to data analysis.
Non-participation Subjects had the option to participate in the study after reading the online advertisement, which provided a general explanation of the task. Subjects were also free to quit at any point during the task. However, we do not have data on how many subjects have declined to participate or quit after starting the task.
Randomization Experimental tasks in both delay conditions (no delay or 24 hour delay) were available at a first-come first-served basis, at varying times during the day and week.
Reporting for specific materials, systems and methods

3
nature research | reporting summ
aryApril 2018
Materials & experimental systemsn/a Involved in the study
Unique biological materials
Antibodies
Eukaryotic cell lines
Palaeontology
Animals and other organisms
Human research participants
Methodsn/a Involved in the study
ChIP-seq
Flow cytometry
MRI-based neuroimaging
Human research participantsPolicy information about studies involving human research participants
Population characteristics Experiment 1: 199 subjects (101 males, 98 females; aged 32.2 ± 8.5 (mean ± SD)). Experiment 2: 174 subjects (101 males, 71 females, 2 no response; aged 34.0 ± 9.1 (mean ± SD))
Recruitment Subjects were recruited via Amazon Mechanical Turk (MTurk). Subjects recruited through MTurk has genrally been reported to be diverse in demographics, and we are unaware of any self-selection bias that may affect the results from our behavioral task. See Mason & Suri, 2012 for a discussion on MTurk. Mason, W., & Suri, S. (2012). Conducting behavioral research on Amazon’s Mechanical Turk. Behavior research methods, 44(1), 1-23.