position of minorities in vojvodina province · branislav s. djurdjev andjelija ivkov-dŽigurski...
TRANSCRIPT

Geogaphica Timisiensis, vol. 18, nr.1-2, 2009 (pp. 19-36) ●
POSITION OF MINORITIES IN VOJVODINA PROVINCE
Branislav S. DJURDJEV
Andjelija IVKOV-DŽIGURSKI Aleksandra DRAGIN
University of Novi Sad,Faculty of Sciences, Department of Geography, Tourism and Hotel Management
Abstract: The paper discusses the position of minorities in Vojvodina Province (Northern part of Serbia Republic). Strengthening of ethnic awareness and process of democratization has contributed to a broader list of nationalities appearing with each new census. However, the changes in number and share of certain nations are evident. The position of nations has been analyzed on the basis of their representation in the school system and the data of the unemployed according to their nationalities. The main sources used were the census results, current data, as well as the results of the questionnaires. Rezumat: Articolul prezintă poziţia minorităţilor în Provincia Vojvodina (nordul Republicii Serbia). Întărirea conştiinţei entice şi procesul democratizării au contribuit la lărgirea listei minorităţilor de la un recensământ la altul. Modificările în ponderea unor minorităţi sunt evidente. Poziţia naţiunilor a fost analizată pe baza reprezentării în sistemul şcolar şi a datelor despre structura etnică a şomerilor. Principalele surse au fost: recensămintele, înregistrările curente şi chestionarele. Key words: Vojvodina Province, Serbia, ethnic structure, national minorities, demographic transition Cuvinte cheie: Provincia Vojvodina, structură etnică, minorităţi naţionale, tranziţie demografică
During the last three centuries the Vojvodina Province has changed several masters, like Turks, Austrians, Hungarians, Yugoslavs, and Serbs. Each of them were fulfilling this area with their own or loyal nationality. Ethnic complexity of the Serbian Province of Vojvodina is observed through a large number of nationalities, the number of people, and their share in the total population, and what is more important in their distribution and mutual relations. Similar ethnic variety in Europe can only be encountered in the area of Caucasus.
Ethnic heterogeneity is evident on municipal and settlement level, thus the symmetry in spatial distribution of certain nationalities is difficult to ascertain for most of them because there are no “ethnic cores” likewise in other parts of the world, where nations live in ethnically “pure” settlements. Industrial centres, settlements in their vicinity as well as the settlements near the state and provincial borders have ethnically the most heterogeneous population.
The development of the ethnic structure in the area of the present Vojvodina in the period between the 1921 and 2001 censuses may be divided into several phases. The first

● Position of minorities in Vojvodina Province 20
20
one was connected with the period of Austrian-Hungarian domination by the year 1918. Its main feature was the increase in the absolute number of all ethnic groups.
In the period between 1899 and 1913 the territory of the present Vojvodina, predominantly the Banat region was subjected to large emigrations. It has been estimated that between 100,000 and 150,000 people emigrated from this territory, mainly to the United States and other transatlantic countries. More than a half of the emigrants were Germans, whereas the members of other ethnic communities participated less frequently in the emigration process.
After the First World War (1914-1918), the population of all ethnic groups increased, with the exception of Germans and Hungarians, since there was a large emigration of state officials and brainpower to their countries of origin. Extreme increase in number was registered with Croats, as the result of the fact that Bunjevci started declaring as Croats, i.e. they converted into Croats.
The Second World War brought large consequences to the ethnic structure of the population of Vojvodina Province (Ivkov, 2005). New Yugoslav legislation accused Germans for collaboration with the Nazi army and in accordance with the decision of communistic government (from November 21, 1944) all their properties were taken away (except from Germans who participated in anti-Nazi movement during the war). According to 1948 census only 29589 Germans lived in Vojvodina Province which was only 8.8% of their number in 1921 census (Djurdjev, 1986; Djurdjev 1994).
1. CENSUS DATA COLLECTION ABOUT NATIONALITIES IN 20TH CENTURY
The first population census in the former Kingdom of Serbs, Croats and Slovenes,
on January 31st, 1921, did not include the question about nationality. Ethnic structure was reconstructed on the basis of mother tongue and religion.
The results extracted three groups: a) Nations (Serbs or Croats, Slovenes, Czechs, Ruthenians, Little Russians, Polish,
Russians, Hungarians, Germans, Arnauts, Turks, Romanians, Italians, English, French)
b) others and c) unknown The data on the number of Macedonians and Montenegrins were not possible to obtain
because neither those two nationalities existed at that time, nor the Macedonian language was officially recognized.
The 1931 census first introduced the questions about the mother tongue, religion and nationality. Everyone could freely declare their nationalities and mother tongues. Since the Kingdom of Serbs, Croats and Slovenes changed its name into the Kingdom of Yugoslavia in 1929, the country’s policy grouped all the Yugoslav nationalities from the published results under the title Yugoslav nationalities, speaking Yugoslav language, for nationalities outside the group the precise data on nationality were given.
After the Second World War, the republics were formed associated with one main nationality, except for Bosnia and Herzegovina and Croatia. Constitutive nation together with Croats in Croatia were also Serbs. In Bosnia and Herzegovina, apart from Serbs and
Branislav ĐURĐEV, Andjelija IVKOV-DŽIGURSKI, Aleksandra DRAGIN ● 21
Croats, Moslems became a constitutive nation in 1971. It was the first time Macedonians and Montenegrins declared freely their nationalities. The most of changes within the classification were in declaration of Moslems, although the changes were significantly influenced by the emergence of new modalities in declaring.
In the first post war census in 1948, nationality was considered a subjective criterion, and the answer was given according to freely declared nationality of population. It was presupposed that Moslems of Yugoslav ethnic origin give one of the following answers: “Serb-Moslem”, “Croat-Moslem”, etc. or “undeclared-Moslem”. The data processing grouped the “Serb-Moslems” into Serbs group, the “Croat-Moslems” into Croats group, and the “undeclared-Moslems” were in a separate group. For the people who declared their regional belonging, the solution was found for each case separately, e.g. Dalmatians were grouped into Croats, Šumadinci into Serbs, etc. whereas “Bosnians” were grouped according to their personal names into Serbs, Croats, or “undeclared-Moslems”. Those who could not be grouped according to their names in the previous groups were grouped as “others and unknown nationality”.
In the 1953 census, the people who declared as Moslems, as well as others of Yugoslav origin who failed to directly declare nationality were grouped in “Yugoslavs-undeclared”. The people who were not of Yugoslav origin were grouped in the “nationally undeclared” category (Bubalo Živković, Đurđev, Dragin, 2008).
The 1961 census brought new changes in the name of the Moslem group of Yugoslav origin. The people of Yugoslav origin who felt as Moslems, in the sense of either national or ethnic, but not religious belonging, declared themselves as “Moslems (in the sense of national or ethnic belonging)”. In the same census, the citizens of Yugoslavia who failed to declare their national or ethnic belonging were categorized as “Yugoslavs- undeclared nationally”. Also, the citizens who declared regional belonging were grouped in the same category.
In the 1971 census, Moslems were categorized within the modality “Moslems in the sense of nationality”, and the citizens who declared regional belonging within the modality: “declared in the sense of regional belonging”.
In the 1981 census, the citizens who declared as Moslems to the questions about nation, nationality, or ethnic group, were grouped into category Moslems.
The special features of the censuses in 1971 and 1981 were groupings of the population in two basic groups “declared nationality” and “undeclared nationality”. The group “undeclared nationality” was divided into three subgroups in 1971: “undeclared”, “declared as Yugoslavs”, “declared in the sense of regional belonging”; in 1981 it was subdivided into: “undeclared and undecided”, “declared as Yugoslavs”, or “declared in the sense of regional belonging” (Republic Statistical Office, Belgrade 2003).
The same principle was applied in the 1991 census concerning the question of nationality. Compared to the previous censuses in Yugoslavia, it is evident that in the 1991 census there was a change in the formulation of the term ethnic belonging. This time the new term was introduced – nationality (nacionalnost), different from the previous term ethnic group (narodnost) (in 1948, 1953, 1961), nationality or ethnic origin (1971), nation, nationality or ethnic group (1981). The classification of national, i.e. ethnic origin was broadened with three new modalities: Bunjevac, Šokac and Egyptian.

● Position of minorities in Vojvodina Province 22
22
Table 1 Census classification of national and ethnic structure after the Second World War
Clasificarea conform recensământului a structurii naţionale şi etnice după al doilea Râzboi Mondial
1948 1953 1961 1971 1981 1991 2002
SFRY SFRY SFRY SFRY SFRY FRY FRY
Nationality Nationality NationalityNational or
Ethnic belonging
Nation, Nationality or Ethnic belonging
Nationality National or Ethnic
belonging*
Serbs Serbs Serbs Serbs Serbs Serbs Serb Croats Croats Croats Croats Croats Croats Croat Slovenes Slovenes Slovenes Slovenes Slovenes Slovenes Slovene Macedonians Macedonians Macedonians Macedonians Macedonians Macedonians Macedonian Montenegrins Montenegrins Montenegrins Montenegrins Montenegrins Montenegrins Montenegrin
Moslems Moslems - in ethnic
Moslems Moslems Moslems Moslem
Hungarians Hungarians Hungarians Hungarians Hungarians Hungarians Hungarian Slovaks Slovaks Slovaks Slovaks Slovaks Slovaks Slovak Romanians Romanians Romanians Romanians Romanians Romanians Romanian
Gypsies Gypsies Gypsies Romas - Gypsies
Romas Romas Romas
Germans Germans Germans Germans Germans Germans German
Ruthenians Ruthenians - Ukrainians
Ruthenians -Ukrainians Ruthenians Ruthenians Ruthenians Ruthenian
Ukrainians Ukrainians Ukrainians Ukrainian Russians Russians Russians Russians Russians Russian Turkish Turkish Turkish Turkish Turkish Turkish Turk
Undeclared Yugoslavs
Undeclared Yugoslavs Yugoslavs Yugoslavs Yugoslavs Yugoslav
Shiptar Shiptar Shiptar Albanians Albanians Albanians Albanian Vlachian Vlachian Vlachian Vlachian Vlachian Vlachian Vlach Bulgarians Bulgarians Bulgarians Bulgarians Bulgarians Bulgarians Bulgarian Czechs Czechs Czechs Czechs Czechs Czechs Czech Italians Italians Italians Italians Italians Italian Hebrews Jews Jews Hebrews Hebrews Jew Polish Polish Polish Polish Polish Pole Austrians Austrians Austrians Austrian Greeks Greeks Greeks Greeks Greeks Greek Slavs Bunjevac Bunjevac Šokac Šokac Ashkali Bosniak Goranac Tzintzar Belgian

Branislav ĐURĐEV, Andjelija IVKOV-DŽIGURSKI, Aleksandra DRAGIN ● 23
Dane Egyptian English Chinese Norwegian Finn French Swiss Swedish Others - unknown nationalities
Others Others Others Others Others
Undecided Undecided
Undeclared Undeclared Undeclared Undeclared
Regional belonging
Regional belonging
Regional belonging
Unknown Unknown Unknown
Regional belonging Unknown Unknown Unknown
Other Non-Slavs
Undecided nationality
* Detailed classification Source: The census data, Federal (since 2002 census, Republic) Office of Statistic, Belgrade
The first census after the breaking apart of the SFRY on the territory of Serbia was
conducted in 2002, a year later than the census period proclaimed. The territory of Central Serbia and Vojvodina was covered in the census, whereas the territory of Kosovo and Metohija was left to be included when all the necessary preconditions are met. Population classification according to national or ethnic origin, in the 2002 census, except for the modality Moslem, had the modality Bosniak, and also three new: Ashkali, Goranac and Tzinzar (table 1).
In the 2002 census, as in all the previous censuses after the Second World War, the data on national or ethnic origin are based on free declaration. In the 2002 census, there were some changes in comparison to the 1991 census in the population structure according to nationality, which was mainly result of migrations caused by political situation after 1991. Furthermore, the situation influenced the attitudes of individuals about their declaration, contributing to differentiated natural growth of certain nationalities depending on their age structure (table 2).
The latest census has shown that within the population structure of Vojvodina according to national structure the highest representation is that of Serbs (65.0%), Hungarians (14.3%), Slovaks (2.8%), Croats (2.8%), Yugoslavs (2.5%), Montenegrins (1.7%), Romanians (1.5%) and others. In comparison to 1991, the largest changes were recorded in the group declared as Yugoslavs. The share of Yugoslavs in 1991 was 8.7%, and in 2002 it was 2.5%. The changes in the share of other nationalities were also recorded; the most specific was about ten times increase in the number of undeclared and undecided (from 0.3 % to 2.7 %) (table 2).

● Position of minorities in Vojvodina Province 24
24
Table 2 Population of Vojvodina according to national and ethnic belonging, in 1991 and 2002
Structura populaţiei Vojvodinei conform aparteneţei entice şi naţionale, în 1991 şi 2002
Census 1991 Census 2002 Nationality Number % Number %
Total 2,013,889 100.0 2,031,992 100.0 Serbs 1,143,723 56.8 1,321,807 65.0 Montenegrins 44,838 2.2 35,513 1.7 Yugoslavs 174,295 8.7 49,881 2.5 Albanians 2,556 0.1 1,695 0.1 Bosniaks - - 417 0.0 Bulgarians 2,363 0.1 1,658 0.1 Bunjevci 21,434 1.1 19,766 1.0 Vlachs 132 0.0 101 0.0 Goranci - - 606 0.0 Hungarians 339,491 16.9 290,207 14.3 Macedonians 17,472 0.9 11785 0.6 Moslems 5,851 0.3 3,634 0.2 Germans 3,873 0.2 3,154 0.2 Romas 24366 1.2 29,057 1.4 Romanians 38809 1.9 30,419 1.5 Russian 1,019 0.1 940 0.0 Ruthenians 17,652 0.9 15,626 0.8 Slovaks 63,545 3.2 56,637 2.8 Slovenians 2,730 0.1 2,005 0.1 Ukrainians 4,565 0.2 4,635 0.2 Croats 74,808 3.7 56,546 2.8 Czechs 1,844 0.1 1,648 0.1 Others 5,100 0.3 5,311 0.3 Undeclared and undecided 5,427 0.3 55,016 2.7 Regional belonging 2,503 0.1 10,154 0.5 Unknown 15,493 0.8 23,774 1.2
Source: Census data for 1991 and 2002. Federal (since 2002 census, Republic) Office of Statistic, Belgrade
Branislav ĐURĐEV, Andjelija IVKOV-DŽIGURSKI, Aleksandra DRAGIN ● 25
2. CHANGES IN THE SHARE OF NATIONALITIES IN TOTAL POPULATION
During the post war period and up to the 1960s, the number of almost all ethnic
groups was increasing due to the high natural growth rate. Slightly more dynamic increase was recorded among Serbs and Montenegrins since most of the population that arrived to Vojvodina during the colonization period were of the same origin coming from other parts of the former SFRY. However, as soon as that period ended there was the decrease of natural growth, which led to decrease in number of most of the ethnic groups in Vojvodina. Serbs recorded increase even in this period, which was the result of assimilation and emigration, whereas the increase recorded with Montenegrins was the result of their continuous immigration.
Ethnic heterogeneousness is the consequence of a large number of mixed marriages and a large number of those who declared as Yugoslavs, which finally led them to the position of the third largest group in 1981.
The beginning of 1990s announced new significant changes in the ethnic structure of the population in Vojvodina. Nationalism was flourishing in the former republics of SFRY which resulted in migrations of Yugoslav nations to their home countries.
One third of the forced migrants found their refuge in Vojvodina. Consequently, such exodus of the population, which has never been recorded in the history of this area, had to reflect to the ethnic structure of Vojvodina.
The reasons were numerous, the emigration of Croats and their re-declaration as Bunjevci and Sokci, as well as the immigration of Serbs from Croatia and Bosnia and Herzegovina. With the burst out of the war in the former SFRY, such processes reached their peaks. Masses of Serbian refugees found refuge in Vojvodina, whereas a number of national minorities left Vojvodina Province. However, the reasons for their immigration were not merely political but also economic, due to difficult living conditions under international economic sanctions to FR Yugoslavia. For that reason a part of domestic Serbian population also left Vojvodina Province.
Altogether, it led to certain changes in the ethnic structure of Vojvodina. Although the ethnic variety has been preserved to a great extent, both the number of certain nations and their share in the total population of Vojvodina have changed.
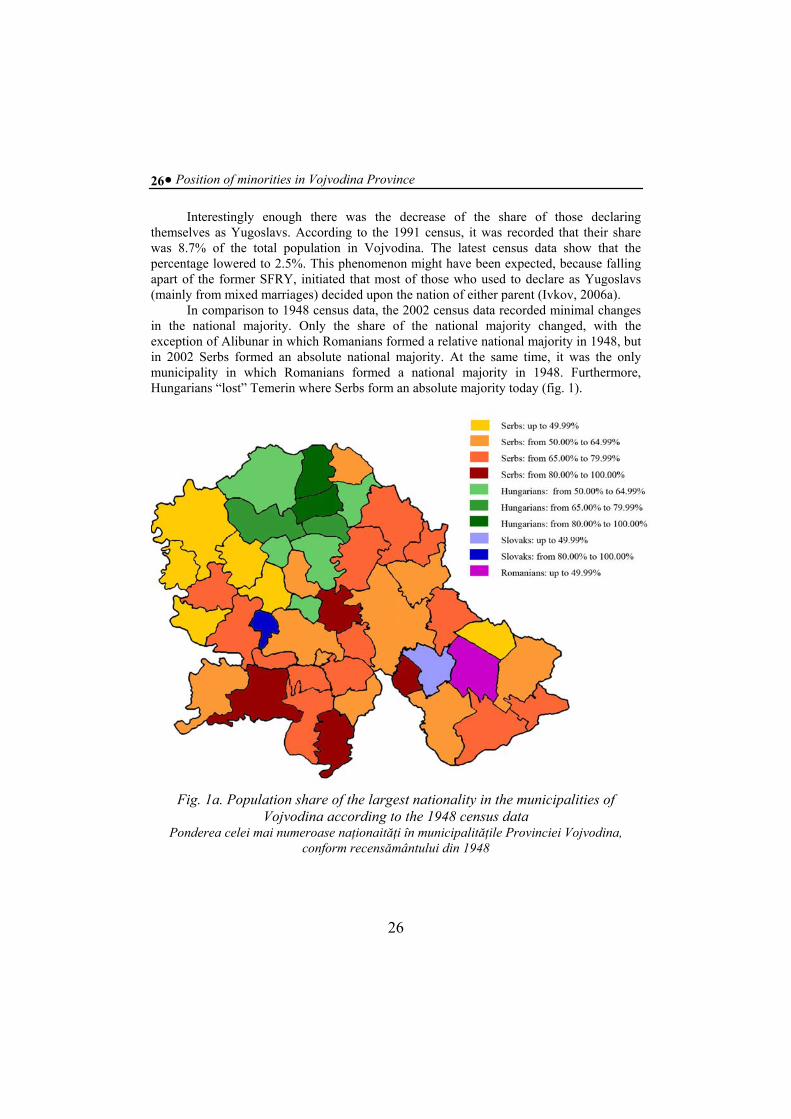
According to the 1948 census data, four nations formed majorities in most of the municipalities in Vojvodina. Apart from Serbs other three nations forming majorities were: Hungarians, Slovaks and Romanians. Serbs formed a majority in six municipalities: Sombor, Kula, Vrbas, Apatin, Bač and Plandište. In twenty-seven municipalities Serbs formed an absolute majority. Hungarians formed an absolute majority in nine municipalities.
On the basis of the 2002 census data, first the increase of 9% in Serbian population was noticeable, then the decrease of 1% in Croatian population (in part due to immigration process and in part to their declaration as Bunjevci and Šokci). More detailed analysis of the results of the latest 2002 census points out the decrease of the share of other nationalities. Thus, there has been a significant decrease of 2.5% in Hungarian population, whereas among other nations (Slovaks, Ruthenians and Romanians) the decrease has been about 0.5%.
● Position of minorities in Vojvodina Province 26
Interestingly enough there was the decrease of the share of those declaring themselves as Yugoslavs. According to the 1991 census, it was recorded that their share was 8.7% of the total population in Vojvodina. The latest census data show that the percentage lowered to 2.5%. This phenomenon might have been expected, because falling apart of the former SFRY, initiated that most of those who used to declare as Yugoslavs (mainly from mixed marriages) decided upon the nation of either parent (Ivkov, 2006a).
In comparison to 1948 census data, the 2002 census data recorded minimal changes in the national majority. Only the share of the national majority changed, with the exception of Alibunar in which Romanians formed a relative national majority in 1948, but in 2002 Serbs formed an absolute national majority. At the same time, it was the only municipality in which Romanians formed a national majority in 1948. Furthermore, Hungarians “lost” Temerin where Serbs form an absolute majority today (fig. 1).
Fig. 1a. Population share of the largest nationality in the municipalities of
Vojvodina according to the 1948 census data Ponderea celei mai numeroase naţionaităţi în municipalităţile Provinciei Vojvodina,
conform recensământului din 1948
26

Branislav ĐURĐEV, Andjelija IVKOV-DŽIGURSKI, Aleksandra DRAGIN ● 27
Fig. 1b Population share of the largest nationality in the municipalities of
Vojvodina according to the 2002 census data Ponderea celei mai numeroase naţionaităţi în municipalităţile Provinciei Vojvodina,
conform recensământului din 2002
3. GENDER STRUCTURE OF ETHNIC GROUPS
The analysis of the census data in 1991 and 2002 reveals the dominance of female population whose share according to the 1991 census data was 51.3% and to the 2002 census data it was 51.5% (table 3).
According to the 1991 census data the surplus of the male population was recorded with Albanians, Moslems, Montenegrins and Roma, whereas with other nations the surplus of female population was registered, especially with Croats and Yugoslavs.
The 2002 census indicated that the surplus of male population was recorded as in the previous census with Moslems, Roma, Montenegrins and Albanians especially (64.2%). If the results are compared, it is evident that only with Montenegrins and Roma (Ivkov, Dragin, Kovačević, 2007) there was and increase in the share of male population compared to female in 2002, of 0.7% and 0.2% respectively.
The surplus of male population with those ethnic groups is explained by selective migrations.
As far as female population is concerned, the highest share of females in 2002 was recorded with Croats (56.6%), then followed Yugoslavs (52.9%), and Hungarians (52.7%).

● Position of minorities in Vojvodina Province 28
28
The similar situation was recorded in the 1991 census, when the share of female population was slightly smaller: Croats (53.9%), Yugoslavs (52.8%) and Hungarians (54.2%).
Table 3 Gender structure of the most frequent ethnic groups in Vojvodina (censuses 1991 and 2002)
Structura pe genuri a celor mai importante grupuri entice din Vojvodina (recensămintele 1991 şi 2002)
Males and females ratio Census 1991 Census 2002
Absolute Relative (%) Absolute Relative (%) Ethnic groups
male female male
female male female male
female
Serbs 563,317 580,406 49.3 50.7 646,404 675,403 48.9 51.1 Montenegrins 23,738 21,100 52.9 47.1 19,047 16,466 53.6 46.4 Yugoslavs 82,263 92,032 47.2 52.8 23,475 26,406 47.1 52.9 Albaninas 1,678 878 65.5 34.4 1,088 607 64.2 35.8 Hungarians 161,632 177,859 47.6 52.4 137,145 153,062 47.3 52.7 Moslems 3,111 2,740 53.2 46.8 1,847 1,787 50.8 49.2 Romas 12,411 11,955 50.9 49.1 14,855 14,202 51.1 48.9 Romanians 18,940 19,869 48.8 51.2 14,658 15,761 48.2 51.8 Slovaks 30,688 32,857 48.3 51.7 27,151 29,486 47.9 52.1 Croats 34,521 40,287 46.1 53.9 24,527 32,019 43.4 56.6 Others 48,432 53,175 47.7 52.3 74,745 81,851 47.7 52.3 Vojvodina 980,731 1,033,15
8 48.7 51.3 984,942 1,047,05
0 48.5 51.5
Source: Federal of Statistics, Population census 1991, book 5: gender and age according to ethnic belonging, Federal Office of Statistics, Belgrade 1993 and Population, households and flats census in 2002, Religion, mother tongue, and national or ethnic belonging according to age and gender, Book 3 , Belgrade 2003
The balanced gender structure was recorded with Serbs, which was expected due to the fact that as the largest ethnic group on the territory of Vojvodina, they rarely got influenced by outside factors (Ivkov, 2006a).
4. REPRESENTATION OF MINORITIES IN THE SCHOOL SYSTEM
Primary education in mother tongues of national minorities is conducted if there are
at least 15 students who enrolled the first grade, but there is the option for the school to open the minority grade for even the smaller number of students. On the other hand for the minority students attending the school programme in Serbian, there is a course of mother tongue along with the elements of national culture within the elective group of courses, two classes per week, in case the pupils or parents are interested in the course.
Hungarians. Primary education in Hungarian was conducted in 29 municipalities, 113 educational units, i.e. 83 primary schools and 35 subsidiary units in the 1997/1998
Branislav ĐURĐEV, Andjelija IVKOV-DŽIGURSKI, Aleksandra DRAGIN ● 29
school year. At that time, the application of at least five students was required to start the teaching process in Hungarian language.
The total number of Hungarian students in primary education was 27,140, out of which 21,496 or 79.2% were educated in their mother tongue. The remaining 5,633 or 20.8% pupils were educated in Serbian language, but they were provided with an elective course in Hungarian language with elements of national culture twice a week. 1,732 Hungarian students out of those 5,633 attended the course.
9,502 Hungarian students attended secondary education in the same year. 6,575 out of the total number of Hungarian students or 69.2% of them were educated in their mother tongue.
Hungarian students received education in their mother tongue at three higher education institutions: Advanced School for Teachers in Novi Sad and Subotica, and Advanced Technical School in Subotica. At university level, the educational process in Hungarian language was conducted at the Faculty of Philosophy, Faculty of Economics, Faculty for Teachers, and the Academy of Arts (Ivkov, 2006). Hungarian students make 9.0% (579) of the total number of higher education students, out of that 579 students, 264 students attend lectures in Serbian, and 315 in Hungarian. 1,703 Hungarian students or 6.4% of the total number of university students in Vojvodina attended university education. Out of that number, 1,703 students attended lectures in Serbian and 411 in Hungarian language.
Slovaks. Parallel to the use of Serbian language and alphabet, there is officially acknowledged use of Slovakian language and alphabet in the municipalities of Alibunar, Bač, Bačka Palanka, Bačka Topola, Bački Petrovac, Beočin, Zrenjanin, Kovačica, Odžaci, Plandište, Stara Pazova, Šid and the town of Novi Sad (Ivkov, 2006).
In the school year 1997/1998, educational process in Slovakian language was conducted in 12 municipalities, 17 primary schools and 2 subsidiary units with the total number of 3,909 students in 185 grades. The educational process in mother tongue comprised 73.5% of the total number of Slovak students in primary education. Bilingual education in Serbian and Slovak languages was conducted in two municipalities, i.e. two primary schools with 115 students in 5 graded. For other 707 students who were educated in Serbian language, there was an elective course in Slovak language with elements of national culture twice a week in the school year 1998/1999.
1,861 students of Slovak nationality attended secondary schools in the school year 1997/1998, out of which 390 students or 21.0% were educated in their mother tongue. The educational process in Slovak language was organized in two secondary schools (grammar schools in Bački Petrovac and Kovačica), precisely in 13 grades. The learning of mother tongue with elements of national culture was organized for 221 students of Slovak nationality who were educated in Serbian language in seven secondary schools.
In the school year 1997/1998, institutions of higher education were attended by 92 students of Slovak nationality or 1.1% of the total number of university students. Out of that number 30 students were educated in their mother tongue (Department of Slovak language at the Faculty of Philosophy in Novi Sad). The subsidiary of Teachers’ Faculty from Sombor has been opened in Bački Petrovac, where the students attended lectures in Slovak language and prepare for teaching hobs in Slovak language.
● Position of minorities in Vojvodina Province 30
30
Romanians. Parallel to the use of Serbian language, Romanian language is officially acknowledged for use in following municipalities: Alibunar, Bela Crkva, Žitište, Zrenjanin, Plandište, Vršac, Kovin, Kovačica and Sečanj (Ivkov, 2006).
Teaching process in primary education in Alibunar, Bela Crkva, Žitište, Zrenjanin, Plandište, Vršac, Kovin, Kovačica and Sečanj was conducted in Romanian language in 9 municipalities, 18 primary schools and 14 subsidiaries which made the total of 1,606 students in 121 grades. The total number of Romanian students in primary education was 2,447, out of which 1,564 or 64.0% were educated in their mother tongue. Elective course in Romanian language with elements of national culture for students who were educated in Serbian language was organized in 7 municipalities, 9 primary schools for the total number of 183 students.
In secondary education, the total number of Romanian students was 578 out of which 177 students or 30.5% were educated in their mother tongue. The educational process in Romanian language was conducted in 2 municipalities, i.e. 2 schools with 8 grades (Secondary school of economy in Alibunar and Grammar school in Vršac). Learning of mother tongue with elements of national culture for students educated in Serbian language was organized in 1 school in Vršac and Kovačica with the total number of 15 students attending the course.
Out of the total number of students in higher education, there were 0.7% or 43 Romanian students. The educational process in Romanian language was organized at Advanced School for Teachers in Vršac (25 students), whereas the other 18 students attended lectures in Serbian language.
64 students of Romanian nationality attended universities, which made 0.2% of the total number of the students. Department of Romanian language at the Faculty of Philosophy in Novi Sad organized lectures for 21 students in Romanian language, whereas the others attended lectures in Serbian language.
There is also Department of Romanian language at the Belgrade University and a subsidiary of Teacher’s Faculty from Sombor in Romanian language in Vršac, enrolling students since 1998, and in the school year 2001/2002 there were 58 students attending lectures. The last two years the students from Romania are also enrolled according to the Convention of students exchange (Ivkov, 2006).
Ruthenians. Primary education process in Rutheninan language was conducted in 3 municipalities and 3 schools with the total number of 748 students. Out of the total on 1,494 students of Rutheninan nationality, 733 students or 49.1% received their primary education in their mother tongue. Elective course of mother tongue with elements of national culture for students educated in Serbian language was organized two classes a week in 6 municipalities and 24 schools comprising the total of 358 students.
608 students of Rutheninan nationality were educated in secondary schools, out of which 70 students were educated in their mother tongue. The teaching process in Rutheninan language was conducted in Grammar school in Ruski Krstur in four grades.
In higher education there were 56 students and in university education there were 251 in the academic year 1999/2000. At the Faculty of Philosophy in Novi Sad, Department of Ruthenian language and literature, and at some other study programmes, there were 21 students of Rutheninan nationality. Also the educational process in Rutheninan language is organized at the Teacher’s Faculty in Sombor.

Branislav ĐURĐEV, Andjelija IVKOV-DŽIGURSKI, Aleksandra DRAGIN ● 31
There are 8,236 books in Rutheninan language in the libraries of municipalities of Bačka Topola, Vrbas, Žabalj, Kula, Šid and the town of Novi Sad (Ivkov, 2006).
Roma. The largest number of Roma students received education in Serbian, Hungarian, Slovak and Ruthenian language. Elective Romany language teaching was organized in two primary schools (Tovariševo and Obrovac). In 2000 an ABC book in Romany language was published.
Ukrainians. For 117 students in five primary schools in the municipalities of Vrbas and Kula the educational process was conducted in Ukrainian with elements of national culture. Since 1998, there has been a summer school for preserving the Ukrainian language intended for children of Ukrainian origin.
Croats, Bunjevci. Croatian language is officially used in the municipality of Subotica. During the 19th century, a number of young Bunjevci population was educated in monastery’s public school of the Sisters of the Community of Our Lady.
5. UNEMPLOYED PERSONS ACCORDING TO NATIONALITY
At present, labour market is not tracing the national structure of the unemployed. Every unemployed person fills in a form with some information required, among which nationality declaration is demanded, but still the data have not been processed in the total. The data on national belonging of the unemployed have not been published in any form on the basis of the censuses after the Second World War. The national structure analysis of the unemployed is based on the data from the unpublished reports of Labour Market. Among the unemployed the leading position is occupied by Serbs (59.1 %), and then follow Hungarians (14.8 %), Yugoslavs (6.8 %), Roma (4.4 %), Slovaks (2.6 %), Croats (2.4 %), Montenegrins (1.8 %) etc. Ethnic structure of the unemployed complies with the ethnic structure of the total population. For example, Croats had the share of 2.8% in the total population and 2.3% in the unemployed in 2002. The second largest ethnic group, Hungarians had the share of 14.3% in the total population and 14.8% in the unemployed. The deviation was observed with the Roma group who had the share of 1.4% in the total population of Vojvodina and 4.4% in the unemployed. However, it should be considered that the education of Roma is on a lower level in comparison to other ethnic groups (table 4).
The Central Serbia is an ethnically homogenous territory, with Serbs having the share of 89.5% in the total population. Therefore, the analysis of ethnic structure of the unemployed is unnecessary.
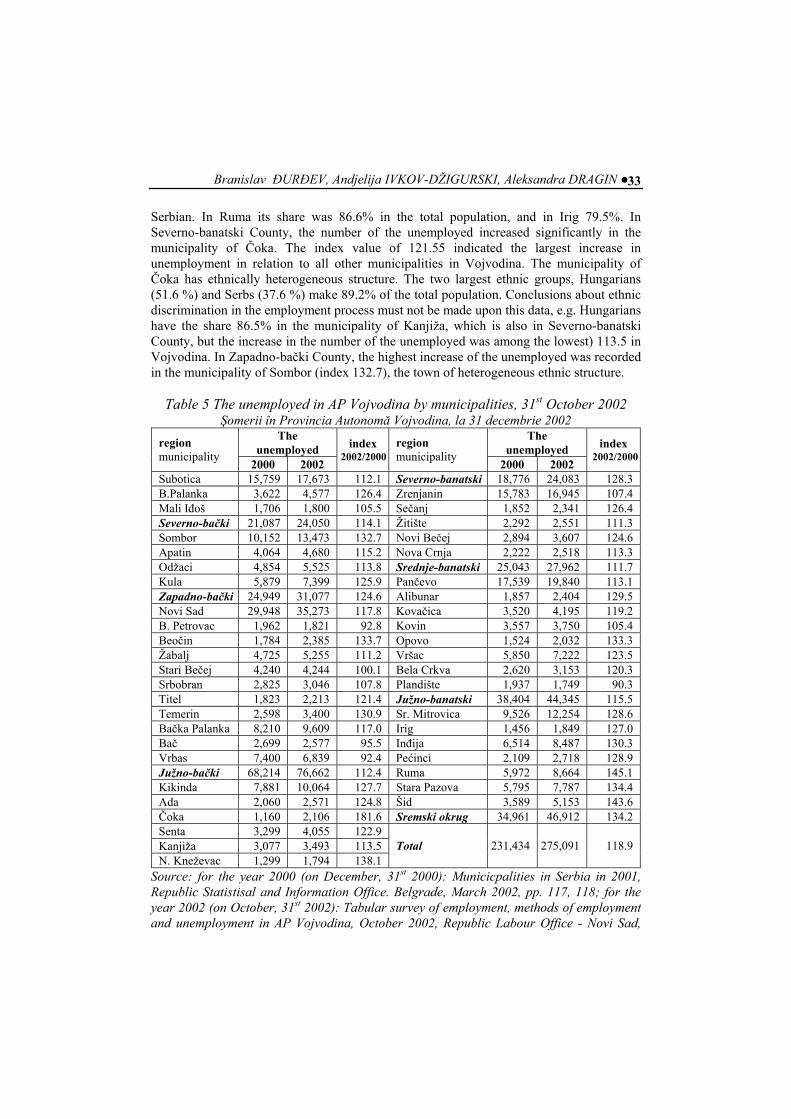
The analysis of unemployment in the municipalities of Vojvodina (Ivkov, Kovačević, Dragin, Djurdjev, Ivanović, 2007), according to variations in their ethnic structure (Ivkov, Romelić, Lazić, Dragin, Ivanović, 2007), may indicate possible discrimination in employment procedure. The analysis by counties1 and municipalities of Vojvodina shows that in the period 2000-2002 the highest increase in unemployment was recorded in Srem (table 5). The index value of 134.18 assigned this county the leading position, then followed Severno-banatski (index 128.3), Zapadno-bački (index 124.6), etc.
1 The territory of Vojvodine comprises seven administrative units, counties: Severno-bački (Subotica), Zapadno-bački (Sombor), Južno-bački (Novi Sad), Severno-banatski (Kikinda), Srednje-banatski (Zrenjanin), Južno-banatski (Pančevo), Sremski (Sremska Mitrovica).

● Position of minorities in Vojvodina Province 32
32
Table 4 Total population and unemployed persons according to nationality, in
Vojvodina 2002 Populaţia totală şi şomerii pe naţionalităţi, în Vojvodina
2002 Nationality Unemploye
d % Total %
Serbs 86,894 59.1 1,321,807
65.0
Montenegrins 2,629 1.8 35,513 1.7 Yugoslavs 10,042 6.8 49,881 2.5 Albanians 296 0.2 1,695 0.1 Bulgarians 59 0.0 1,658 0.1 Hungarians 21,861 14.8 290,207 14.3 Macedonians 2,264 1.5 11,785 0.6 Moslems 669 0.4 3,634 0.2 Germans 864 0.6 3,154 0.2 Romas 6,415 4.4 29,057 1.4 Romanians 2,154 1.5 30,419 1.5 Russians 44 0.0 940 0.0 Ruthenians 1,342 0.9 15,626 0.8 Slovaks 3,808 2.6 56,637 2.8 Slovenians 979 0.7 2,005 0.1 Ukrainians 353 0.2 4,635 0.2 Croats 3,552 2.4 56,646 2.8 Czechs 112 0.1 1,648 0.1 Greeks 68 0.0 - - Danes 201 0.1 - - Italians 38 0.0 - - Jews 73 0.0 - - Polish 67 0.0 - - Others 258 0.2 5,311 0.3 Undeclared and undecided 1,718 1.2 55,016 2.7 Regional belonging 352 0.2 10,154 0.5 Total 147,117 100.
0 2,031,99
2 100.
0 Source: data on unemployed from annual reports of the Republic Office for Labour Market Employment - Novi Sad. The reports are not published; national structure of the total population: Announcement 252, 2002:2 Note: The segment up to the total number of the unemployed is of unknown nationality.
Within the Srem County the highest increase in the unemployment was in the
municipality of Irig (127.0) which was significantly higher than the mean value for Vojvodina (118.9). Dominating nationality in the municipality of Ruma as well as in Irig is
Branislav ĐURĐEV, Andjelija IVKOV-DŽIGURSKI, Aleksandra DRAGIN ● 33
Serbian. In Ruma its share was 86.6% in the total population, and in Irig 79.5%. In Severno-banatski County, the number of the unemployed increased significantly in the municipality of Čoka. The index value of 121.55 indicated the largest increase in unemployment in relation to all other municipalities in Vojvodina. The municipality of Čoka has ethnically heterogeneous structure. The two largest ethnic groups, Hungarians (51.6 %) and Serbs (37.6 %) make 89.2% of the total population. Conclusions about ethnic discrimination in the employment process must not be made upon this data, e.g. Hungarians have the share 86.5% in the municipality of Kanjiža, which is also in Severno-banatski County, but the increase in the number of the unemployed was among the lowest) 113.5 in Vojvodina. In Zapadno-bački County, the highest increase of the unemployed was recorded in the municipality of Sombor (index 132.7), the town of heterogeneous ethnic structure.
Table 5 The unemployed in AP Vojvodina by municipalities, 31st October 2002 Şomerii în Provincia Autonomă Vojvodina, la 31 decembrie 2002
The unemployed
The unemployed region
municipality 2000 2002
index 2002/2000
region municipality
2000 2002
index 2002/2000
Subotica 15,759 17,673 112.1 Severno-banatski 18,776 24,083 128.3 B.Palanka 3,622 4,577 126.4 Zrenjanin 15,783 16,945 107.4 Mali Iđoš 1,706 1,800 105.5 Sečanj 1,852 2,341 126.4 Severno-bački 21,087 24,050 114.1 Žitište 2,292 2,551 111.3 Sombor 10,152 13,473 132.7 Novi Bečej 2,894 3,607 124.6 Apatin 4,064 4,680 115.2 Nova Crnja 2,222 2,518 113.3 Odžaci 4,854 5,525 113.8 Srednje-banatski 25,043 27,962 111.7 Kula 5,879 7,399 125.9 Pančevo 17,539 19,840 113.1 Zapadno-bački 24,949 31,077 124.6 Alibunar 1,857 2,404 129.5 Novi Sad 29,948 35,273 117.8 Kovačica 3,520 4,195 119.2 B. Petrovac 1,962 1,821 92.8 Kovin 3,557 3,750 105.4 Beočin 1,784 2,385 133.7 Opovo 1,524 2,032 133.3 Žabalj 4,725 5,255 111.2 Vršac 5,850 7,222 123.5 Stari Bečej 4,240 4,244 100.1 Bela Crkva 2,620 3,153 120.3 Srbobran 2,825 3,046 107.8 Plandište 1,937 1,749 90.3 Titel 1,823 2,213 121.4 Južno-banatski 38,404 44,345 115.5 Temerin 2,598 3,400 130.9 Sr. Mitrovica 9,526 12,254 128.6 Bačka Palanka 8,210 9,609 117.0 Irig 1,456 1,849 127.0 Bač 2,699 2,577 95.5 Inđija 6,514 8,487 130.3 Vrbas 7,400 6,839 92.4 Pećinci 2,109 2,718 128.9 Južno-bački 68,214 76,662 112.4 Ruma 5,972 8,664 145.1 Kikinda 7,881 10,064 127.7 Stara Pazova 5,795 7,787 134.4 Ada 2,060 2,571 124.8 Šid 3,589 5,153 143.6 Čoka 1,160 2,106 181.6 Sremski okrug 34,961 46,912 134.2 Senta 3,299 4,055 122.9 Kanjiža 3,077 3,493 113.5 N. Kneževac 1,299 1,794 138.1
Total 231,434 275,091 118.9
Source: for the year 2000 (on December, 31st 2000): Municicpalities in Serbia in 2001, Republic Statistisal and Information Office. Belgrade, March 2002, pp. 117, 118; for the year 2002 (on October, 31st 2002): Tabular survey of employment, methods of employment and unemployment in AP Vojvodina, October 2002, Republic Labour Office - Novi Sad,

● Position of minorities in Vojvodina Province 34
34
November 2002, table 6
The decrease in the number of the unemployed occurred in the municipalities of ethnic diversity. For instance, the number of the unemployed decreased in the municipality of Bački Petrovac, Južno-bački County (index 92.4) in the period 2000-2002. Slovaks form a majority (66.4%) in this municipality. Then, the decrease in the number of the unemployed was also recorded in the municipality of Bač (index 95.5) and Vrbas (index 92.4), both of heterogeneous ethnic structure. Finally, the number of the unemployed decreased in the municipality of Plandište Južno-banatski County (index 90.3), also of heterogeneous ethnic structure (table 5).
6. CONCLUSION
National and linguistic structure of the population is one of the indicators of varieties
in the world. The differences are traced back to ethnic and historical features of the population. As the result of major historical events which resulted in frequent migrations, Vojvodina is still one of ethnically most heterogeneous areas in the world. Ethnic heterogeneousness became observable right after the Turks were forced to leave, when the Austrian Empire commenced the large colonisations to economically reactivate the area which was almost abandoned. Afterwards, the rulers of the Province were constantly changing but they were persistent in populating the Province with their own people.
The data on the status of minorities in the school system and the data on the unemployed according to their nationality point out that there is the continuity of normative betterment of the status of minorities. Unfortunately, the events in the last decade of the 20th century initiated the process of ethnic homogenization in all the countries emerged on the territory of the Former Yugoslavia.
In Vojvodina, the people live peacefully together. The beginning of the 1990s announced the new significant changes in the ethnicity of the population in Vojvodina, which influenced certain changes in the ethnic structure. Although ethnic variety has been mainly preserved, the number of certain nations and their share in the total population in Vojvodina has changed.
REFERENCES AND DATA SOURCES Bubalo Živković Milka, Đurđev S. Branislav, Dragin Aleksandra,
(2008), The ageing of Vojvodina`s population between 1953 and 2002 with reference to middle adulthood and ageing index. Geographica Pannonica, University of Novi Sad, Faculty of Natural Science and Mathematics, Department of Geography, Tourism and Hotel Management, Novi Sad, Vol. 12 (pp. 39 - 44)

Branislav ĐURĐEV, Andjelija IVKOV-DŽIGURSKI, Aleksandra DRAGIN ● 35
Djurdjev S. Branislav, (1994), Peopling of the Vojvodina Province after the Second World War. The first regional geography conference: “Geographical Researches in the Carpathian-Danube Space”, Universitatea de Vest din Timisoara, Facultatea de Chimie-Biologie-Geografie, Departamentul de Geografie (pp. 139 - 148)
Djurdjev S. Branislav, (1995), Border Effects on Household Dissolution in the Banat Region, Yugoslavia. GeoJournal, Vol. 35, No. 4 (pp. 409 - 413)
Djurdjev S. Branislav, Vesna Katic, Dubravka Zarkov, (1992), Prevalence of the Formal Zadruga in the Village of Vilovo, Voivodina, Serbia. Journal of Family History, Vol. 17, No. 3 (pp. 319 - 329)
Djurdjev S. Branislav, (1986), Razvoj spoljnih migracija u Vojvodini. Zbornik Matice srpske za društvene nauke, Matica srpska, Novi Sad, br. 80 (pp. 109 - 127)
Djurdjev S. Branislav, (1988), Demografski preobražaj stanovništva u Vojvodini. Zbornik Matice srpske za društvene nauke, Matica srpska, Novi Sad, br. 85 (pp. 67 - 82)
Djurdjev S. Branislav, (1996), Problem izbeglištva u Jugoslaviji. Zbornik Matice srpske za društvene nauke, Matica srpska, Novi Sad, br. 100 (pp. 305 - 319)
Djurdjev S. Branislav, Miroljub Rančić, (1995), Rast stanovništva. U: Mirjana Rašević, urednik: Razvitak stanovništva Srbije, 1950-1991, Centar za demografska istraživanja Instituta društvenih nauka, Beograd (pp. 29 - 44)
Ivkov Anđelija, (2005). Stanovništvo kao faktor razvoja turizma u Vojvodini. Doktorska disertacija. Univerzitet u Novom sadu. Prirodno-matematički fakultet u Novom Sadu, Departman za geografiju, turizam i hotelijerstvo, Novi Sad (p. 314)
Ivkov Anđelija, (2006), Folklorno nasleđe u turizmu Vojvodine. Zadužbina Andrejević, Beograd (p. 127)
Ivkov Anđelija, (2006a). Demografska slika Vojvodine. Zadužbina Andrejević, Beograd (p. 99)
Ivkov Anđelija, Dragin Aleksandra, Kovačević Tamara, (2007), Karakteristike nupcijaliteta rumunskog stanovništva u Banatu na primeru sela Lokve. Zbornik radova, Geografski institut Jovan Cvijić, Srpska akademija nauka i umetnosti, Beograd, Vol. 57 (pp. 175 - 183)

● Position of minorities in Vojvodina Province 36
36
Ivkov Anđelija, Kovačević Tamara, Dragin Aleksandra, Djurdjev Branislav, Ivanović Ljubica, (2007), Influence of tourism on the employment in Vojvodina. Geographica Pannonica. Faculty of Natural Science and Mathematics, Department of Geography, Tourism and Hotel Management, Novi Sad, No. 11 (pp. 54 - 58)
Ivkov Anđelija, Romelić Jovan, Lazić Lazar, Dragin Aleksandra, Ivanović Ljubica, (2007), Folklorno nasleđe u turizmu Banata. Prirodno-matematički fakultet - Departman za geografiju, turizam i hotelijerstvo (Novi Sad) i Pokrajinsko Izvršno veće - Odeljenja za kulturu (Novi Sad) (p. 234) Republički zavod za statistiku, (2003), Popis stanovništva, domaćinstava i
stanova u 2002 - Veroispovest, maternji jezik i nacionalna ili etnička pripadnost prema starosti i polu. Republički zavod za statistiku, Beograd, Vol. 3, (p. 408)
Republički zavod za statistiku, (2003), Popis stanovništva, domaćinstava i stanova u 2002 - Nacionalna ili etnička pripadnost, podaci po naseljima. Republički zavod za statistiku, Beograd, Vol. 1, (p. 219)
Savezni zavod za statistiku, (1993), Popis stanovništva 1991. godine - pol i starost prema etničkoj pripadnosti, Savezni zavod za statistiku, Beograd, Vol. 5