ports annual reportcover - california state parks · ports annual report 2013/2014 school year...
TRANSCRIPT

PORTS Annual Report
2013/2014 School Year
California State Parks
Interpretation and Education Division
Sacramento, CA
July 2014

Ded
© 2014 CaliforniaThis publFor infor(916) 653711, TTY www.pa QuestionInterpretCaliforniaPO Box 9Phone: (9Ports.pro
dicated tow
4 California
a State Parkslication can mation call: 3‐6995, outsrelay servicrks.ca.gov
ns about thistation and Eda State Parks942896, Sacr916) 654‐22ogram@park
o Joe von who retir
a State Park
s supports ebe made ava(800) 777‐0side the U.S.e
s report or reducation Divs ramento, CA49 ks.ca.gov
Herrmaned after 3
ks
equal access.ailable in alt0369
equest for covision
A 94296‐0001
nn, found39 years o
. ternate form
opies should
1
er and viof state s
mats.
d be directed
sionary foservice.
d to:
or PORTSS,
TABLE OF CONTENTS
Annual Statistical Report ......................................................................................................... 1 Individual PORTS Site Reports
Anza‐Borrego Desert SP ....................................................................................................... 10
Baldwin Hills Scenic Overlook .............................................................................................. 13
Columbia SHP ....................................................................................................................... 17
Crystal Cove SP ..................................................................................................................... 20
Hearst San Simeon SHM ...................................................................................................... 23
North Coast Redwoods District ............................................................................................ 26
Seacliff SB ............................................................................................................................. 29
State Capitol Museum ......................................................................................................... 32
Teacher Survey Analysis Report ............................................................................................. 35

INTRODUCTION
The Parks Online Resources for Teachers and Students (PORTS) program is a distance interpretation and education program developed as a collaborative effort between public schools and California State Parks. This program uses the power of videoconferencing and California’s K‐12 High Speed Network (HSN) to deliver academic content standards‐based programs in the context of California State Parks. PORTS is coordinated by the Interpretation and Education Division. Individual PORTS distance learning sites are operated by the nine participating state park districts. In 2013/2014 PORTS served over 38,000 students. This is the ninth year PORTS has reached K‐12 youth in communities across California. The program continued to seek outreach opportunities by providing after‐school programs to students in rural Central California. In the past decade PORTS has served over a quarter million K‐12 students, many in low‐income, diverse urban communities, helping to increase student achievement and promote park values and stewardship. Through the use of an online tracking system, PORTS has compiled this report of the statistics from the 2013/2014 school year. All statistics are approximate. ANNUAL STATEWIDE STATISTICS 2013/2014 Total Number of Students (average of 31 students/class) 38,085 2013/2014 Total Number of Programs (one class per interpretive program) 1,230 Annual Comparison of Annual Comparison of Student Numbers Program Numbers 2005/2006 375 2006/2007 460 2007/2008 910 2008/2009 1,000 2009/2010 1,158 2010/2011 1,185 2011/2012 1,640 2012/2013 1,431
2013/2014 School Year Statistical Report
1

California State Parks PORTS Program—2013/2014 School Year
June 2012
PARTICIPATING COUNTIES The PORTS distance learning program focuses on California’s K‐12 educational community. During the 2013/2014 school year PORTS programs were delivered to schools in 33 of the 58 California counties.
2

California State Parks PORTS Program—2013/2014 School Year
June 2014
CALIFORNIA SCHOOL DISTRICTS For the 2013/2014 school year, 77 California school districts participated, fourteen fewer than PORTS served last year. The return rate for school districts for the 2013/2014 school year is 68%. Thirteen school districts were new to PORTS this year. PORTS continued to work closely with large, urban school districts to connect students to state parks. Armona Union Elementary Berryessa Union Elementary Bonita Unified Brawley Elementary Buckeye Union Elementary Butte County Office of Education Carlsbad Unified Carmel Unified Castro Valley Unified Colton Joint Unified Columbia Elementary Conejo Valley Unified Del Mar Union Elementary Desert Sands Unified El Centro Elementary Elk Grove Unified Empire Union Elementary Encinitas Union Elementary Eureka City Schools Fairfield‐Suisun Unified Fremont Unified Hanford Elementary School District Hawthorne Elementary Humboldt County Office of Education Imperial Unified Jamestown Elementary Kentfield Elementary Kings Canyon Joint Unified Kings River‐Hardwick Union Elementary Kingsburg Joint Union Elementary Lafayette Elementary Lakeside Union Elementary Las Lomitas Elementary Laytonville Unified Lemoore Union Elementary Lompoc Unified Los Altos Elementary Los Angeles Unified Martinez Unified
Mendocino County Office of Education Menifee Union Elementary Monterey Peninsula Unified Novato Unified Oceanside City Unified Ontario‐Montclair Elementary Orange Unified Oroville City Elementary Oxnard Elementary Pacific Union Elementary Pajaro Valley Joint Unified Palermo Union Elementary Paso Robles Union Elementary Pioneer Union Elementary Pleasanton Unified Poway Unified Redwood City Elementary Riverside Unified Roseville City Elementary Sacramento City Unified San Diego City Unified San Diego County Office of Education San Joaquin County Office of Education San Juan Unified San Marcos Unified San Ramon Valley Unified Santa Clara Unified Santa Maria‐Bonita Elementary Santee Elementary Scotts Valley Unified Simi Valley Unified Stanislaus Union Elementary Stockton City Unified Sweetwater Union High Westside Union Elementary Wheatland Elementary Ventura Unified Yuba City Unified
3

California State Parks PORTS Program—2013/2014 School Year
June 2014
STATES OUTSIDE OF CALIFORNIA During the 2013/2014 school year PORTS delivered programs to 2,029 students in nine states across the country. In the 2012/2013 school year 1,115 out‐of‐state students participated. One school in Alberta, Canada also participated These are the states that participated in 2013/2014:
Arkansas Ohio Michigan Pennsylvania Minnesota South Carolina Missouri Texas New Jersey Virginia New York Wisconsin
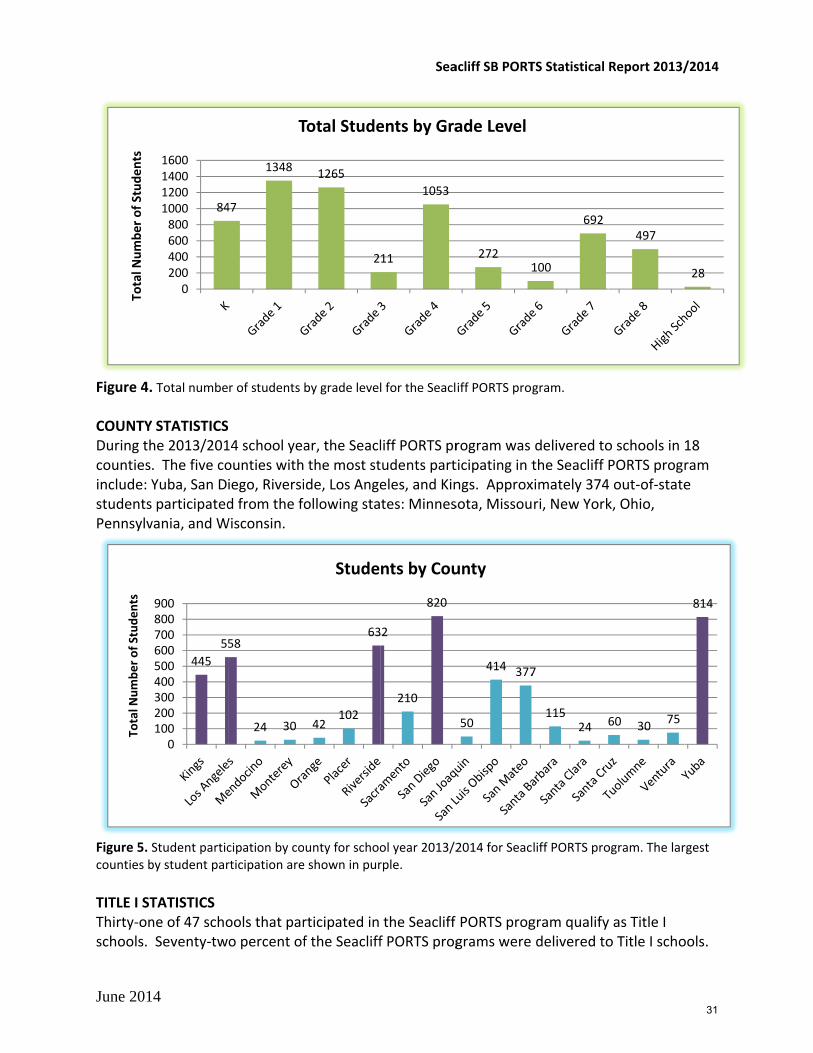
PARTICIPATING TITLE I SCHOOL STATISTICS A total of 166 individual schools in California participated in PORTS programs in the 2013/2014 school year. Of the 166 schools, 101 qualified as Title I schools as defined by federal standards. Sixty‐five percent of PORTS programs were delivered to Title I schools in California. STUDENTs BY GRADE LEVEL PORTS programs served all K‐12 grade levels during the 2013/2014 school year. The majority of the students served were in grade levels first through seventh.
4

California State Parks PORTS Program—2013/2014 School Year
June 2014
PORTS DISTANCE LEARNING SITE STATISTICS For the 2013/2014 school year PORTS programs were delivered from nine individual distance learning sites. Students per PORTS Distance Learning Site
2005
/200
6
2006
/200
7
2007
/200
8
2008
/200
9
2009
/201
0
2010
/201
1
2011
/201
2
2012
/201
3
2013
/201
4
Anza‐Borrego
5,400 7,446 8,390 8,750 7,360 8,840 13,900 8,410 8,086
Seacliff 5,550 5,030 6,170 9,220 9,570 8,860 8,200 7,945 6,313 Crystal Cove
1,100 2,103 5,510 5,750 7,440 7,375 6,350 5,750 4,891
State Capitol
255 490 1,310 2,820 4,300 0 0 875 1,190
Columbia 0 0 980 2,140 2,940 3,535 4,600 4,590 4,615 North Coast Redwoods
0 0 0 740 5,360 6,760 8,630 7,850 8,179
Hearst Castle
0 0 0 0 290 1,435 1,905 2,055 1,166
Baldwin Hills
0 0 0 0 0 0 8,150 7,835 3,645
Angel Island
0 0 0 0 0 0 0 0 30
Anza‐Borrego Desert State Park Summary The Anza‐Borrego Desert State Park PORTS program was delivered using a chroma‐key studio housed at the Stout Research Center inside Anza‐Borrego Desert State Park. This program was in full operation and delivered by a State Park Interpreter I, Permanent Intermittent. The funding for this position and program is primarily through District funds and the Anza‐Borrego Desert Foundation. This year the Anza‐Borrego Desert PORTS Program delivered presentations to over 8,086 students. Satellite truck programs were reintroduced for the spring semester. The California State Parks IT Department purchased new high‐definition videoconferencing equipment for the studio and the Anza‐Borrego Foundation purchased new peripheral equipment. Baldwin Hills Scenic Overlook Summary The 2013/2014 school year saw the Baldwin Hills Scenic Overlook PORTS program in full operation. The presentations are primarily delivered using chroma‐key technology. The studio was in operation five days a week, and utilized for many afternoon and Saturday professional development/conference sessions. The program was staffed by a State Park Interpreter I. This school year, approximately 3,645 students participated in programs from Baldwin Hills Scenic
5

California State Parks PORTS Program—2013/2014 School Year
June 2014
Overlook. Baldwin Hills PORTS spearheaded the programs to after school students in rural Central California. California State Capitol Museum Summary The California State Capitol Museum PORTS program was back to full operation in 2012/2013 and staffed by a State Park Interpreter I three days a week. This school year (2013/2014) the Capitol PORTS program delivered programs to approximately 1190 students. The long‐standing legislative program went out to schools in Riverside Unified School District, Colton Joint Unified School District and a private school in Orange County. Legislators that participated include:
• Assembly member Jose Medina (D, Riverside) • Assembly member Cheryl Brown (D, San Bernardino) • Senator Mimi Walters (R, Irvine)
Columbia State Historic Park Summary The Columbia State Historic Park PORTS program was delivered three days a week by a seasonal Park Interpretive Specialist. This school year the Columbia PORTS program delivered programs to approximately 4,615 students. All 2013/2014 programs were offered from within the state park green screen studio for the first time. Programs using the mobile vehicle were piloted from the streets of Columbia. PORTS expects regular programs with the mobile vehicle to be offered during the 2014/2015 school year. Crystal Cove State Park Summary The Crystal Cove State Park PORTS program continues to use the “EduGator” roving videoconference vehicle. The program was in operation two days a week and staffed by a State Park Interpreter I, Permanent Intermittent. The funding for this position and program is primarily through District funds and from the Crystal Cove Alliance. This year the Crystal Cove PORTS Program delivered presentations to approximately 4,891 students. This marks the last year of programs being delivered from the Historic District. As of June 2014 the entire operation is being moved to the El Moro Canyon portion of the park. New programming focusing on the science of habitat restoration will begin next school year along with a revamped tide pool program. The California State Parks IT Department purchased a new high‐definition videoconference machine and installed new wireless throughout the park. The Crystal Cove Alliance purchased peripheral equipment. Hearst San Simeon State Historical Monument Summary In its fourth year of operation, the Hearst San Simeon State Historical Monument (Hearst Castle®) PORTS program delivered videoconference programs solely from a studio using chroma‐key technology. A Guide I on special assignment provided programs three days a week. This year 1,166 students participated in programs from this site. A team of park staff and a credentialed teacher rewrote the unit of study to bring it into alignment with the Common Core State Standards and to improve the content.
6

California State Parks PORTS Program—2013/2014 School Year
June 2014
North Coast Redwoods District Summary In its fifth full year of operation, the North Coast Redwoods District PORTS studio delivered programs to approximately 8,179 students. All programs were delivered from the new green screen studio built in the Fort Humboldt State Historic Park visitor center. The program was in operation five days a week and staffed by a seasonal Park Interpretive Specialist. Funding for the position was provided by the Humboldt County Office of Education. A new high‐definition videoconference machine was purchased jointly by the Humboldt County Office of Education and the North Coast Redwoods District. Seacliff State Beach Summary The Seacliff State Beach PORTS studio delivered videoconference programs solely using chroma‐key technology. The studio was in operation four days a week and staffed by a seasonal Senior Park Aide. This school year approximately 6,313 students received interpretive programs delivered from the Seacliff PORTS studio. The California State Parks IT Department purchased a new high‐definition videoconference machine. The Friends of Santa Cruz State Parks purchased peripheral equipment.
PROFESSIONAL DEVELOPMENT TRAININGS/OUTREACH This school year PORTS staff delivered approximately forty‐two professional development trainings to teachers and school administrators. We are continuously seeking opportunities for partnerships with school districts by providing professional developments. We continue to cultivate relationships with large educational technology organizations, such as Computer Using Educators (CUE) and California Educational Technology Professionals Association (CETPA), in order to maintain a presence in the K‐12 community. SOCIAL MEDIA PORTS is engaged in social media on Facebook. The PORTS Facebook page is a media tool that helps keep followers abreast of current events with the PORTS Program and is a means of soliciting input from friends and colleagues. Find us on Facebook at http://www.facebook.com/PORTSprogram. At the end of the school year the PORTS Facebook page had over 350 “likes.” PORTS continues to have a presence on Instagram for photo sharing. Search for #PORTSProgram. PORTS is collaborating more often with the Department’s Communications Office to strategize on effectively using social media. PORTS TEACHER SURVEY The Department uses a standardized School Group Program Evaluation (SGPE) for school group interpretive programs throughout the state. Four years ago, PORTS staff created a hybrid online version of the school group evaluation, which incorporates many of the key questions on the standard SGPE along with new questions that better serve the needs of the PORTS program. The online PORTS Teacher Survey was sent out in the fall and spring to teachers and school site coordinators. We received 107 responses this school year. The questions on the teacher survey examine the program’s overall usability; the relevance of its instructional materials; the effectiveness of its live presenters; the efficiency of scheduling
7

California State Parks PORTS Program—2013/2014 School Year
June 2014
and logistics; and the technology tools for increasing student appreciation of California State Parks values. An overall summary of the PORTS Teacher Survey (The percentage change from last year is in parenthesis):
• 88% of participants gave PORTS an A grade for “Overall Program Experience” (+8%) • 81% of participants gave PORTS an A grade for “Videoconference Presentation” (+2%) • 60% of participants said they used the PORTS online lessons; 61% of those gave the
“Online Lessons” an A grade (+8%, ‐2%) • 81% of participants gave PORTS an A grade for “Scheduling Process and Logistics” (‐3%) • Twenty‐three respondents (approximately 20% of respondents) were able to take their
classes on field trips to California state parks, including:
Empire Mine SHP San Juan Bautista SHP Anza‐Borrego Desert SP Cuyamaca Rancho SP Torrey Pines SNR Big Basin RedwoodsSP Angel Island SP Año Nuevo SP Natural Bridges SB Sutter’s Fort SHP La Purísima Mission SHP Doheny SB State Capitol Museum Lake Oroville SRA Carpinteria SB Columbia SHP Sonoma SHP Point Lobos SNR California State Railroad Museum
SUMMARY In the 2013/2014 school year, PORTS continued to create and maintain innovative partnerships with the education community, non‐profits and private industry corporations, and expand programming for K‐12 youth. For the second year in a row PORTS statistics saw a decrease in participation numbers while still serving our target audience. However, we can identify a number of factors that may have played a role in the decline. Some of the factors include a reduction of days per week programs were offered at some sites. The conclusion of the Toyota USA Foundation grant/Classroom Videoconferencing Made Easy (CVME) professional developments to Los Angeles county teachers meant fewer professional developments were delivered illustrating the importance of this kind of outreach to maintain participation. As expressed by a number of teachers, Common Core State Standards just became an overwhelming reality for teachers, making it a challenge for teachers to find the time or place in their curriculum to participate. The retirement of the manager of the PORTS program, Joe von Herrmann, who was the founder and visionary of the program, shifted the workload to current staff members diminishing their ability to pursue outreach opportunities A few notable occurrences during the 2013/2014 school year were:
• PORTS received the Excellence in Museum Education Award from California State Superintendent of Public Instruction Tom Torlakson.
• PORTS implemented a partnership with the California Department of Fish and Wildlife and received financial support to incorporate messaging about Marine Protected Areas (MPAs) into relevant programming.
8

California State Parks PORTS Program—2013/2014 School Year
June 2014
• PORTS continued working with school districts on the use of free videoconferencing applications on tablet devices, further reducing the cost and technology barrier to school districts.
• Through a partnership, the Butte County Office of Education provided funding from the California Technology Advancement Project (CTAP) to contract four credentialed teachers to align all the PORTS online units of study to the Common Core State Standards and Next Generation Science Standards.
• PORTS entered into preliminary discussions with potential partners in various state agencies on developing a PORTS program at Lake Oroville State Recreation Area.
• With support from the Training Section, PORTS has been able to begin providing annual training at Mott Training Center to PORTS staff.
LOOKING FORWARD As predicted in the 2011/2012 Annual Report, participant numbers have been shrinking as district support and outside funding for the program has dwindled over the past two years. Despite these challenges, PORTS continues to be a relevant program that creates meaningful experiences for K‐12 youth across California, especially in low‐income, urban and diverse communities. The 2014/2015 school year will mark a decade of PORTS programming. PORTS continues to remain relevant by continuously evolving with changes in technology and educational pedagogy while holding fast to the overarching need for the Department to connect with the state’s rapidly changing demographics. We are hopeful that PORTS will provide programs for 50,000 students next school year.
9
June 201
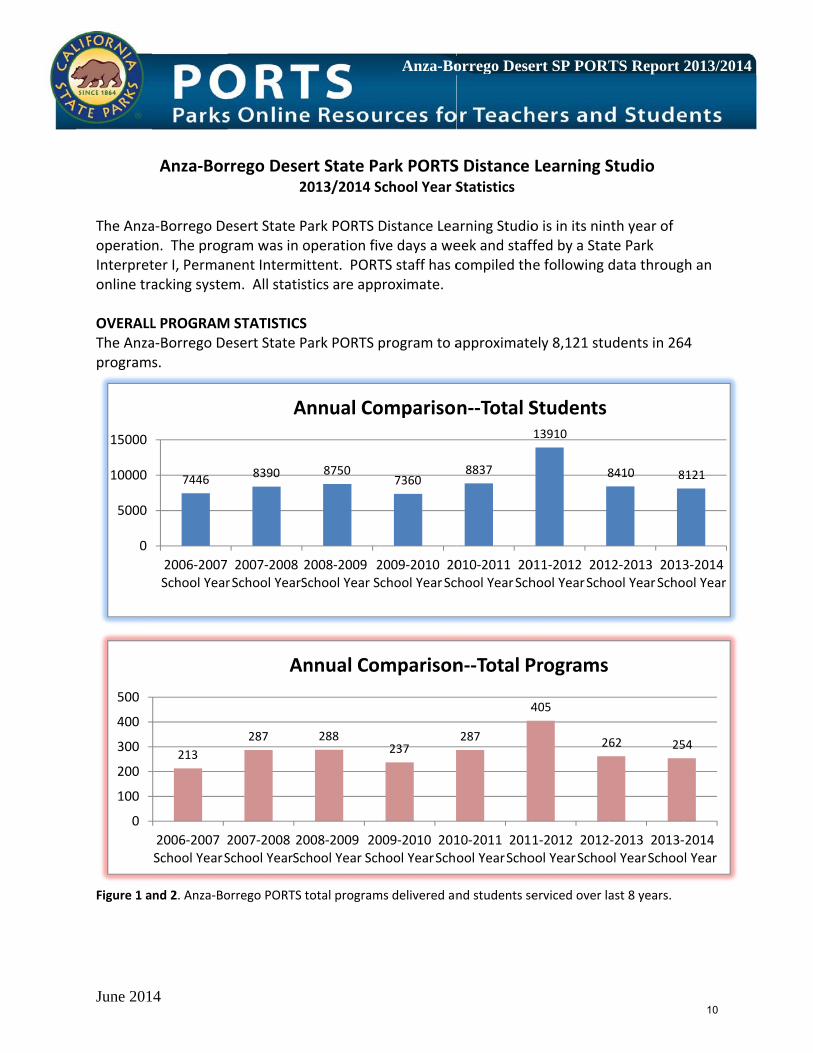
The AnzaoperatioInterpretonline tra OVERALLThe Anzaprogram
Figure 1 a
0
5000
10000
15000
0
100
200
300
400
500
4
Anza‐Bor
a‐Borrego Den. The progter I, Permanacking syste
L PROGRAMa‐Borrego Des.
nd 2. Anza‐Bo
7446
2006‐2007School Year
213
2006‐2007School Year
2S
rrego Dese2
esert State Pram was in onent Intermim. All statis
M STATISTICSesert State P
orrego PORTS
8390
r2007‐2008School YearS
A
287
2007‐2008School Year
20Sc
An
ert State Pa2013/2014 S
Park PORTS Doperation fivittent. PORTstics are app
S Park PORTS p
total program
8750
2008‐2009School Year
2S
Annual Co
288
008‐2009chool Year
20Sch
nnual Co
Anza-Bo
ark PORTSSchool Year S
Distance Leave days a weTS staff has cproximate.
program to a
ms delivered an
7360
2009‐2010chool Year
20Sc
ompariso
237
009‐2010hool Year
201Sch
mparison
orrego Dese
S Distance Statistics
arning Studioeek and staffcompiled th
approximate
nd students se
8837
010‐2011chool Year
20Sch
n‐‐Total S
287
4
10‐2011ool Year
201Scho
n‐‐Total P
ert SP POR
Learning S
o is in its ninffed by a State following d
ely 8,121 stu
erviced over l
13910
8
011‐2012hool Year
201Scho
Students
405
2
1‐2012ool Year
2012Schoo
Programs
TS Report 2
Studio
nth year of te Park data throug
udents in 264
ast 8 years.
8410 8
12‐2013ool Year
2013Scho
62 25
2‐2013ol Year
2013‐Schoo
2013/2014
h an
4
121
3‐2014ool Year
54
2014l Year
10

June 201
PROGRAThe progmobile mteachers park. Ocfor 36% o
Figure 3.program. UNIT OF The “Deswas the mfocused o In April aprogram Bighorn Sat CuyamTracking, Sixth granext larg
11111
Total N
umbe
r of S
tude
nts
14
AM DELIVERYgrams were dmode of delivand student
ctober and Jaof all studen
Number of st
STUDY sert Stories Tmain prograon Landform
and May, theaddresses SSheep trackimaca Rancho, 29% on the
de accounteest participa
0200400600800
10001200140016001800
Anza
A
Y UPDATE delivered frovery is beingts by bringinanuary werents receiving
tudents servic
Today and Yem topic deli
ms and Geolo
e program wScience in Caing at Anza‐Bo State Park.e Cedar Fire
ed for 37% oant group.
‐Borrego P
Anza‐Borrego
om either thg used to enhng real time e the busiestprograms.
ced by month
esterday” Uvered from ogy, and 35
went live in thalifornia StatBorrego Des Forty‐four restoration
of the studen
PORTS Stud
o Desert SP PO
e chroma‐kehance the livobservationt months in t
compared to
nit of Study,the studio. % focused o
he field withte Parks, spesert State Papercent of twork, and 2
nt participan
dio Progra
ORTS Program
ey studio or ve videoconfns from variothe 2013/20
last year for t
, addressingSixty‐five pe
on Paleontol
h the satellitecifically theark and the Cthe program7% on the S
nts in 2013/2
am Monthl
m Statistical
from a sateference expous locations014 school ye
the Anza‐Borre
g geology andercent of theogy and Des
e vehicle. T Swainson HCedar Fire rems focused onSwainson Ha
2014. Fourth
ly Compar
Report 2013/
llite vehicle.erience for s around theear, account
ego PORTS
d paleontoloe programs sert Ecology
he satellite tHawkwatch aestoration wn Bighorn Shwkwatch.
h grade was
rison
2013/2School
2012/2School
/2014
. The
e ting
ogy,
.
truck and work heep
the
2014Year
2013Year
11

June 201
Figure 4. grade is la COUNTYDuring thschools iBorrego Imperial.
Figure 5. 5 largest c TITLE I STThirty of I schools
Total N
umbe
r of S
tude
nts
2468
101214161820
Total N
umbe
r of S
tude
nts
14
Total numberbeled for the
STATISTICShe 2013/201n 24 countieDesert PORT. One out‐of
Student Particcounties by stu
TATISTICS 53 schools t. Fifty‐four p
0500100015002000250030003500
0135
1
0200400600800000200400600800000
A
r of students b2013/2014 sc
14 school yeaes. The five TS program f‐state schoo
cipation by Coudent particip
that particippercent of th
1171
60 60
67
Anza‐Borrego
by grade level chool year.
ar, the Anzacounties witinclude: Sanol in Texas p
ounty for schopation are sho
pated in the Ahe Borrego p
355 61
Studen
70
70
1071
60
Stu
o Desert SP PO
for Anza‐Borr
‐Borrego Deth the most n Diego, Contparticipated
ool year 2013/wn in purple.
Anza‐Borregprograms we
14
2071
nts by Grad
90 10010510
dents by C
ORTS Program
rego PORTS Pr
esert PORTS students patra Costa, Loin the Deser
/2014 for Anza
go Desert POere delivere
381
30
de Level
02
960
247
1735
County
m Statistical
rogram. Num
program warticipating inos Angeles, Rrt Stories pro
a‐Borrego POR
ORTS prograed to Title I s
030
1370
5
140
550
90 3
Report 2013/
ber of studen
as delivered n the Anza‐Riverside, anogram.
RTS Program.
m qualify aschools.
180 1
30180
60 90
/2014
ts by
to
nd
. The
s Title
120
165180
12

The 2013Overlookweek andthrough OVERALLIn the 20
Figure 1 a
0
2000
4000
6000
8000
10000
0
50
100
150
200
250
300
Baldwin H
3/2014 schok PORTS Distd staffed by an online tra
L PROGRAM013/2014 sch
and 2. Baldwi
2011‐20
2011‐201
Hills Sceni2
ol year marktance Learnia State Parkacking syste
M STATISTICShool year ap
n Hills PORTS
8150
012 School Ye
Annu
275
12 School Yea
Ann
c Overlook2013/2014 S
ked the thirdng Program.k Interpreterm. All statis
S proximately
S’ total progra
ear 201
ual Compa
ar 2012
ual Compa
k PORTS DSchool Year S
d full year of. The prograr I. PORTS ststics are app
y 3,645 stude
ams delivered
7835
12‐2013 Schoo
rison‐‐Tota
246
2‐2013 Schoo
arison‐‐Tot
Baldwin Hil
Distance LeStatistics
f operation fam was in futaff has comproximate.
ents particip
d and student
ol Year
al Student
ol Year
tal Program
ls Scenic Ove
earning Pro
for the Baldwull operationmpiled the fo
pated in 130
ts serviced ov
364
2013‐2014 S
ts
130
2013‐2014 S
ms
erlook Report
ogram
win Hills Scen five days a llowing data
presentatio
ver three yea
45
School Year
0
School Year
t 2013/2014
enic
a
ons.
rs.
13
June 2014
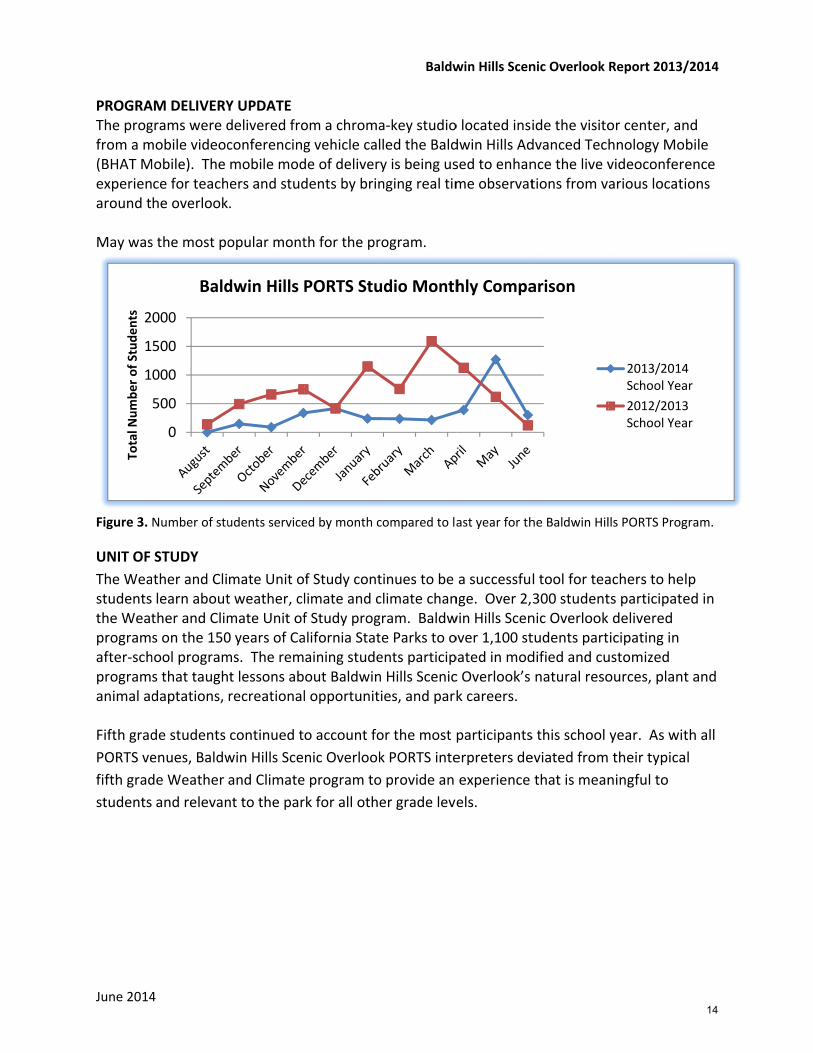
PROGRAThe progfrom a m(BHAT Mexperienaround t May was
Figure 3.
UNIT OF The Weastudentsthe Weatprogramafter‐schprogramanimal ad Fifth gradPORTS vefifth gradstudents
1
1
2
Total N
umbe
r of S
tude
nts
4
AM DELIVERYgrams were dmobile videocMobile). The ce for teachhe overlook
s the most po
Number of stu
STUDY ther and Clilearn aboutther and Clims on the 150hool programs that taughdaptations,
de students enues, Baldwde Weather and relevan
0
500
000
500
000
Bald
Y UPDATE delivered froconferencingmobile moders and stud.
opular mont
udents service
mate Unit ot weather, clmate Unit of0 years of Cams. The remt lessons abrecreational
continued twin Hills Sceand Climatent to the par
dwin Hills
om a chromag vehicle calde of deliverydents by brin
th for the pr
ed by month c
f Study contlimate and cf Study progalifornia Stataining studeout Baldwinl opportunit
o account fonic Overlooke program tork for all othe
PORTS Stu
Baldw
a‐key studioled the Baldy is being usnging real tim
rogram.
compared to la
tinues to be climate changram. Baldwte Parks to oents participn Hills Scenicies, and park
or the most k PORTS inteo provide an er grade leve
udio Month
win Hills Scen
o located insidwin Hills Adsed to enhanme observat
ast year for th
a successfunge. Over 2,win Hills Scenover 1,100 stpated in modc Overlook’sk careers.
participantserpreters deexperience els.
hly Compa
nic Overlook
ide the visitodvanced Technce the live vtions from v
he Baldwin Hil
l tool for tea300 studentnic Overlooktudents partdified and cunatural reso
s this school eviated fromthat is mean
arison
Report 2013/
or center, anhnology Movideoconferarious locat
lls PORTS Prog
achers to hets participate delivered icipating in ustomized ources, plant
year. As wit their typicaningful to
2013/2014School Yea2012/2013School Yea
/2014
nd bile ence ions
gram.
lp ed in
t and
th all al
4ar3ar
14

June 2014
Figure 4.
COUNTYDuring thdelivered
Los Angefrom BaldBonita U
Over 100Carolina.
Figure 5. largest cou
2
4
6
8
10
12
Total N
umbe
r of Stude
nts
112
Total N
umbe
r of S
tude
nts
4
Total number
STATISTICShe 2013/201d to students
eles County sdwin Hills Scnified Schoo
0 students pa.
Student Particunties by stud
105
0
200
400
600
800
000
200
232
0500
100015002000
r of students b
14 school yeas in 13 differ
students acccenic Overlool District in
articipated i
cipation by Codent participat
30 7
369
by grade level
ar, the Baldwrent countie
counted for 2ok. After‐scSanta Barba
n the Baldw
ounty for schotion are show
264
925
Student P
196 293
Students
Baldw
for Baldwin H
win Hills Scees.
25% of all stchool prograara County a
win Hills Scen
ool year 2013/n in purple.
30
224
Participatio
452
1
s by Grade
win Hills Scen
Hills PORTS Pro
enic Overloo
tudents thatams to studeccount for 3
nic Overlook
/2014 for Bald
4150
45
on by Coun
1643
453
e Level
nic Overlook
ogram.
k PORTS Pro
participatedents in the Sa30% of stude
program fro
dwin Hills PORT
58
1107
9
nty
0
Report 2013/
ogram was
d in programanta Maria‐ent participa
om South
TS Program. .
90 30
0 7
/2014
ms
ation.
The
90
15

Baldwin Hills Scenic Overlook Report 2013/2014
June 2014
PARTICIPATING SCHOOL DISTRICTS Forty‐five schools in 20 school districts in California participated in programs from Baldwin Hills Scenic Overlook.
Thirty‐five out of the 45 schools (78%) are classified as Title I. Approximately 81% of all students participating in programs from Baldwin Hills Scenic Overlook are in a Title I school.
16

June 2014
The ColuoperatioInterpretsystem.
OVERALLThis schostudents
Figure 1 averaged
PROGRAMThe progin 2010,
0
1000
2000
3000
4000
5000
0
50
100
150
200
4
Columb
mbia State Hn. The progtive SpecialisAll statistics
L PROGRAMool year the . This accou
and 2. PORTS31 students.
M DELIVERY Ugrams were dor from a m
979
2007‐2008School Year
35
2007‐2008School Year
bia State H2
Historic Parkram was in ost. PORTS sts are approxi
M STATISTICSColumbia POunted for 12%
S Columbia to
UPDATE delivered froobile videoc
2144
2008‐2009School Year
An
66
2008‐2009School Year
Ann
istoric Par2013/2014 S
k PORTS Distoperation twtaff has comimate.
S ORTS progra% of all stud
otal programs
om either thconferencing
2940
r2009‐201School Yea
nual Comp
93
2009‐2010School Yea
nual Comp
rk PORTS DSchool Year S
tance Learniwo to three dpiled the fol
am delivereddents served
delivered and
e chroma‐keg vehicle. Th
3535
0ar
2010‐20School Ye
parison‐‐To
109
0r
2010‐201School Ye
parison‐‐To
Colu
Distance LeStatistics
ng Studio is days a weekllowing data
d programs t by all PORT
d students serv
ey studio, eshe mobile m
4609
011ear
2011‐2School Y
Total Stude
147
11ear
2011‐20School Y
otal Progra
umbia PORTS
earning St
in its seventk and staffeda through an
to approximTS programs.
viced over las
stablished atmode of deliv
9 459
012Year
2012‐Schoo
ents
14
012Year
2012‐2School
ams
Report 2013
udio
th year of d by a State Pn online trac
ately 4,555 .
st 7 years. Prog
t Columbia Svery is being
91 4,
2013l Year
2013Schoo
5 1
2013l Year
2013Schoo
3/2014
Park king
grams
SHP used
555
3‐2014ol Year
147
3‐2014ol Year
17

June 2014
to enhanobservat
May wasreceivingdue to pr
Figure 3.With the C UNIT OF The Goldgrade accover last increased
Figure 4grade is la
11111
Total N
umbe
r of S
tude
nts
10
20
30
40
50
Num
ber o
f Stude
nts
4
nce the live vions from va
s the busiestg programs. rogramming
Number of stColumbia POR
STUDY d Rush Historcounted for year. All otd from zero
. Total numbbeled for the
0200400600800
10001200140016001800
00
00
00
00
00
00
20
videoconferearious locati
month in thMay saw a dg being only
tudents servicRTS staff alread
ry Unit of St80% of the her grades istudents in
er of students2013/2014 sc
Colum
0
012/2013 Scho
ence experieons around
he 2013/201decline in stuoffered thre
ced by month dy trained, pro
udy is on thestudents serncreased. T2012/2013 t
s by grade levechool year.
bia PORTS
48 319
Students
ol Year
Co
ence for teacthe park.
14 school yeaudent particee days a we
compared to ograms starte
e PORTS werviced in 201The largest gto 423 stude
el for Columb
S Studio M
3639
by Grade L
2013/2014 S
lumbia PORT
chers and st
ar accountincipation by 2eek versus fiv
last year for ted in October
bsite, www.13/2014 andgrowth occurents in the 2
ia PORTS Prog
onthly Co
126 0
Level
chool Year
TS Statistical
udents by b
ng for 27% o23% from lasve days a we
the Columbia this year.
.ports.parks.d is a decrearred in 8th gr2013/2014 sc
gram. Numbe
mparison
0
Report 2013/
ringing real
of all studentst year; this ieek.
PORTS Progra
.ca.gov. Fouse of about rade which chool year.
er of students
2013/201School Ye
2012/201School Ye
4230
/2014
time
ts is
am.
urth 17%
by
14ear
13ear
18

June 2014
COUNTYDuring thcounties with the Angeles, Columbiaof Arkans
Figure 5.San Bernaryear’s studCounty, whCounty on TITLE I STThirty‐thcategorizThirty‐onschools. Title I sch
1
Num
ber o
f Stude
nts
4
STATISTICShe 2013/201in Californiamost studenand San Diea PORTS prosas.
Student Partrdino, Santa Cldent participathile is one of 3the other han
TATISTICS ree school dzed as “Privane of 49 schoSixty‐two phools.
20 105270
3
14 school yeaa. Last year,nts participaego. These cogram. Appr
icipation by Coara, and Stanision. The 3 larg largest countid increased by
districts partate” and oneools that parercent of th
30 30
2733
2013/20
ar, the Colum program waating in the Ccounties accoroximately 1
ounty for schooslaus counties gest counties bies by participay 47% compare
icipated in te is out‐of‐strticipated in e students p
370537
50
014 Tota
Co
mbia PORTSas deliveredColumbia POount for 43%7 out‐of‐sta
ol year 2013/2had no particiby student paration, decreaseed to last year.
he Columbiatate. Public the Columb
participating
30
869
30
al ParticCount
lumbia PORT
program wad to 20 countORTS program% of all studete students
2014 for Columpation last yearticipation are ed 40% compa
a PORTS proschools accobia PORTS prg in the Colum
150
566
140
ipating Sty
TS Statistical
as deliveredties. The thrm include: Rents serviceparticipated
mbia PORTS proar and accountshown in purpred to last yea
ogram. Of thounted for 9rogram qualmbia PORTS
320
32
300
Student
Report 2013/
d to schools iree countiesRiverside, Lod by the d from the st
ogram. . Eldorat for 12% of thiple. San Diegoar. Los Angeles
hese, two ar98% all studeify as Title I S program at
0
94 30 72
s By
/2014
in 22 s s
tate
ado, is
s
e ents.
ttend
120
19

June 2014
The Crystin operatPORTS stare appro OVERALLThis schostudents
Figure 1 years.
12345678
Total N
umbe
r of S
tude
nts
1
1
2
2
Total N
umbe
r of P
rogram
s
4
Crysta
tal Cove Stattion two daytaff has comoximate.
L PROGRAMool year, the.
and 2. The C
2103
010002000300040005000600070008000
2006‐2School Y
71
0
50
00
50
00
50
2006‐200School Ye
al Cove Sta2
te Park PORTys a week anpiled the fol
M STATISTICS Crystal Cov
rystal Cove PO
3
5510
007Year
2007‐200School Ye
A
202
07ear
2007‐2008School Year
An
ate Park PO2013/2014 S
TS programnd staffed byllowing data
S e PORTS pro
ORTS total pro
5750
08ear
2008‐2009School Year
Annual Com
188
r2008‐2009School Year
2Sc
nnual Com
ORTS DistaSchool Year S
is in its eighy a State Para through an
ogram delive
ograms deliver
7440
9r2009‐2010School Year
mparison‐‐
226
009‐2010chool Year
201Scho
mparison‐‐T
Crystal Co
ance LearnStatistics
hth year of ok Interprete online track
ered program
red and stude
7375
2010‐2011School Year
2Sc
‐Total Stud
22819
10‐2011ool Year
2011‐Schoo
Total Progr
ove SP PORTS
ning Progra
peration. Ther I, Permaneking system.
ms to approx
ents serviced o
6349
2011‐2012chool Year
20Sch
dents
97 182
‐2012ol Year
2012‐20School Y
rams
S Report 201
am
he program ent Intermitt. All statistic
ximately 4,8
over the last 8
574748
12‐2013hool Year
2013Scho
165
013Year
2013‐2014School Yea
3/2014
was tent. cs
891
8
891
3‐2014ol Year
4ar
20

June 2014
PROGRAAll progryear we wIn the 20Canyon’s May wasparticipa
Figure 3.Cove PORT UNIT OF SThe Tide and 4th gprogramfrom herand relev
Figure 4.
Total N
umbe
r of S
tude
nts
Total N
umbe
r of
Stud
ents
4
AM DELIVERYams were dewill be deliv014/2015 schs environme
s the busiestnts.
Number of stTS Program.
STUDY Pool Unit ofrade studens delivered. r typical fourvant to the p
Total numbe
020040060080010001200
C
175
0
500
1000
1500
Y UPDATE elivered fromering prograhool year thental study lo
month in th
tudents servic
f Study is onnts participat As with all rth grade propark for all o
er of students
Crystal Cov
5
656
m the mobileams from thee PORTS prooop.
he 2013/201
ced by month
n the PORTS ted in the TiPORTS venuogram to proother grade l
by grade leve
ve PORTS P
686
1273
Students
Crystal C
e “EduGatore tide pools ogram at Cry
14 school yea
compared to
website, wwde Pool Ecoles, the Crystovide an expevels.
el for the Cryst
Program M
3 1294
by Grade
Cove SP PORT
r” vehicle onnear the Cryystal Cove w
ar accountin
the 2012/201
ww.ports.palogy programtal Cove PORperience tha
tal Cove PORT
Monthly Co
482288
Level
TS Statistical
n the beach. ystal Cove Hill be moving
ng for 19% o
13 school year
rks.ca.gov. m accountinRTS interpreat is meaning
TS program.
omparison
0
Report 2013/
This is the Historic Distrg to El Moro
of all student
r for the Crysta
Over 2,500 3g for 52% ofeter deviatedgful to stude
n
2013/Schoo
2012/Schoo
4 33
/2014
last ict. o
t
al
3rd f the d ents
/2014ol Year
/2013ol Year
21

June 2014
COUNTYDuring th20 countprogram studentsparticipaCarolina,
Figure 5.largest cou
TITLE I STThirty of schools.
2
4
6
8
10
12
14
Total N
umbe
r of Stude
nts
4
STATISTICShe 2013/201ties. The thrinclude: Losserved by tted from the, and Virginia
Student Partunties by stud
TATISTICS 48 schools tForty‐seven
70138
0
200
400
600
800
000
200
400
14 school yearee counties s Angeles, Rihe Crystal Coe following sa.
ticipation by Cdent participat
that participn percent of
8 10030 17
ar, the Crystwith the moiverside, andove PORTS pstates: Mich
County for schtion are show
pated in the Cthe Crystal C
215
1189
120
Stu
Crystal C
tal Cove PORost studentsd San Diego.program. Ovigan, New Je
hool year 2013n in purple.
Crystal CoveCove progra
020
90
108
udents by
Cove SP PORT
RTS programs participatin These counver 430 out‐ersey, Ohio,
3/2014 for Cry
e PORTS progams were de
1
256
445
80
y County
TS Statistical
m was deliverng in the Crynties accoun‐of‐state stuPennsylvan
ystal Cove POR
gram qualifyelivered to Ti
0 22 32 90
y
Report 2013/
red to schooystal Cove POnt for 56% ofdents ia, South
RTS Program.
y as Title I itle I schools
0 2896
333
/2014
ols in ORTS f all
The 3
s.
3439
22

June 201
Hears
The HearStudio is The progAssignmeAll statist OVERALLThis schostudents
Figure 1 ayears.
0
500
1000
1500
2000
2500
010203040506070
14
st San Sime
rst San Simein its fourth
gram was staent. PORTS tics are appr
L PROGRAMool year, the.
nd 2. The Hea
290
2009‐2010 SYear
11
2009‐2010 ScYear
eon State 2
on State Hish full year of affed by a Ststaff has comroximate.
M STATISTICS Hearst Cast
arst Castle POR
School 2010‐2
An
chool 2010‐2
Ann
Historic M2013/2014 S
storic Monumoperation. ate Park Guimpiled the f
S tle PORTS pr
RTS total prog
1219
2011 SchoolYear
nual Com
40
2011 SchoolYear
nual Com
Hearst San
Monument School Year S
ment (HearsThe programide 1, Permafollowing dat
rogram deliv
grams delivere
1905
2011‐2012 ScYear
mparison‐
62
2011‐2012 ScYear
mparison‐‐
n Simeon SH
PORTS DiStatistics
st Castle ®) Pm was in opeanent Intermta through a
vered progra
ed and studen
chool 2012‐2
‐‐Total St
chool 2012‐2Y
‐Total Pro
HM PORTS
stance Lea
PORTS Distaneration thremittent on Span online tra
ams to appro
nts serviced ov
2054
2013 SchoolYear
2
udents
59
2013 SchoolYear
2
ograms
S Report 20
arning Stud
nce Learninge days a wepecial acking system
oximately 1,
ver the last fiv
1106
2013‐2014 ScYear
35
2013‐2014 SchYear
13/2014
dio
g ek.
m.
106
ve
chool
hool
23

June 201
PROGRAAll progr2013/201
Figure 3. NCastle POR UNIT OF The Anci640 sixththe progfrom herand relev
Figure 4. T
Total N
umbe
r of S
tude
nts
Total N
umbe
r of S
tude
nts
14
AM DELIVER ams were de14 school ye
Number of stuRTS program.
STUDY ent Civilizatih grade studerams deliverr typical sixthvant to the p
Total number
0100200300400500600700800900
Hea
00
100200300400500600700
UPDATE elivered fromear accountin
udents service
ion Unit of Sents participred. As with h grade progpark for all o
of students b
rst PORTS
150
Hear
m a chroma‐ng for 41% o
ed by month co
Study is on thpated in the all PORTS vegram to provother grade l
by grade level
Studio Mo
30 55
Students
rst San Simeo
‐key studio. of all studen
ompared to th
he PORTS weAncient Civienues, the Hvide an expeevels.
for the Hearst
onthly Com
5 85
s by Grade
on SHM PORT
May was tht participatio
he 2012/2013
ebsite, wwwilization progHearst Castleerience that
t Castle PORTS
mparison
77
64
e Level
TS Statistical
he busiest mon.
3 school year f
w.ports.parkgram accoune PORTS inteis meaningf
S program.
43
0
Report 2013/
month in the
for the Hearst
s.ca.gov. Ovnting for 58%erpreter devul to studen
2012/201School Ye2013/201School Ye
06
/2014
ver % of viated ts
13ear14ear
66
24

June 201
COUNTYDuring thin five coPORTS prparticipa
Figure 5. The three TITLE I STSeven of schools.
112233
Total N
umbe
r of S
tude
nts
14
STATISTICShe 2013/201ounties. Therogram wereted.
Student partilargest count
TATISTICS the ten schoSixty‐nine p
3
050100150200250300350
14 school yea three counte: Contra Co
icipation by coies by student
ools that papercent of th
300
Hear
ar, the Hearties with theosta, Los Ang
ounty for schot participation
rticipated inhe Hearst Ca
6
Student P
rst San Simeo
st Castle POe most studegeles, and Ri
ool year 2013/n are shown in
n the Hearst stle program
295
Participatio
on SHM PORT
ORTS programents participverside. On
/2014 for the n purple.
Castle PORTms were deli
5
on by Coun
TS Statistical
m was delivepating in the ne class from
Hearst Castle
TS program qivered to Tit
280
nty
Report 2013/
ered to schoHearst Cast
m Minnesota
PORTS progra
qualify as Title I schools.
210
/2014
ols tle
am.
tle I
25

J
TTHt
OIp
F
une 2014
The North CoThe programHumboldt Cothrough an o
OVERALL PRn the 2013/programs to
Figure 1 and
0
2000
4000
6000
8000
10000
Total N
umbe
r of S
tude
nts
0
50
100
150
200
250
300
Total N
umbe
r of P
rogram
s
North Co
oast Redwoom was in opeounty Officeonline tracki
ROGRAM STA2014 schoolapproximat
d 2. PORTS NC
707
0
0
0
0
0
0
2008‐200School Ye
20
2008‐2009School Year
oast Redwo2
ods District Pration five de of Educationg system. A
ATISTICS year, the Ntely 8,179 st
CRD total prog
532
09ear
2009‐2School
Annua
161
r2009‐201School Ye
Annua
oods Distr2013/2014 S
PORTS Distadays a week on funds thisAll statistics
orth Coast Rudents in 26
rams delivere
2167
2010Year
2010Scho
al Compar
216
10ear
2010‐2School
al Compari
rict PORTS School Year S
nce Learninand staffed s position. P are approxi
Redwoods D60 programs
ed and student
756
0‐2011ol Year
20Sch
ison‐‐Tota
6
2
2011Year
2011Schoo
son‐‐Total
No
Distance LStatistics
g Studio is inby a season
PORTS staff himate.
District (NCRDs.
ts served over
8632
011‐2012hool Year
2S
l Students
80
1‐2012ol Year
20Sch
Programs
orth Coast RPORTS R
Learning S
n its sixth yeal Park Interhas compiled
D) PORTS pr
r six years.
8192
2012‐2013School Year
s
255
12‐2013hool Year
2S
s
Redwoods DReport 2013
Studio
ear of operatrpretive Sped the followi
ogram deliv
8179
2013‐2014School Year
260
2013‐2014School Year
District 3/2014
tion. ecialist. ing data
vered
26

J
PPP2
Fs UTw Odoh
F
une 2014
PROGRAM DPrograms wePark. Like ot21% of stude
Figure 3. Numschool year.
UNIT OF STUThe Redwoowww.ports.p
Over 5,400 sdelivered. Oof the prograhigh levels o
Figure 4. Tota
0
500
1000
1500
2000
Total N
umbe
r of S
tude
nts
50
100
150
200
250
Total N
umbe
r of S
tude
nts
DELIVERY UPere deliveredther PORTS sent participa
mber of stude
UDY d Ecology Uparks.ca.gov
students parOver 2,700 stams were def attendance
al number of s
0
0
0
0
0
North C
620
0
0
0
0
0
K
PDATE d from a chrsites, May wation.
nts served by
nit of Study v. Other prog
ticipated in tudents partelivered to 3e.
students by gr
Coast Redw
706 70
1 2
Tota
North C
roma‐key stuwas the busie
month for th
and Salmongram topics
the Redwooticipated in t3rd grade stud
rade level for
woods POR
03
2204
2 3
al Students
Coast Redwoo
udio in the vest month fo
e NCRD PORT
n Life Cycle Upresented w
od Ecology pthe Salmon Ldents. Four
NCRD PORTS
RTS Studio
1881
10
4Grade Leve
s by Grade
ods District P
visitor centeror the NCRD
TS program wit
Unit of Studywere special
rogram accoLife Cycle prrth grade and
program.
o ‐‐Monthl
007
1483
5 6el
e Level
PORTS Statist
r at Fort HumPORTS prog
th a comparis
y are on the l requests by
ounting for 6ogram. Twed 6th grade
ly Compar
53
7
ical Report 2
mboldt Stategram accoun
son to the prev
PORTS weby teachers.
67% of the penty‐seven pstudents als
rison
2013/2014School Yea
2012/2013School Yea
56 24
8 HighSchoo
013/2014
e Historic nting for
vious
site,
programs percent so had
4ar
3ar
ol
27

J
CDsRAP
Fc TTTs
une 2014
COUNTY STADuring the 2schools in 21Redwoods PApproximatePennsylvania
Figure 5. Stucounties by stu
TITLE I STATThirty‐sevenTitle I schoolschools.
5
10
15
20
25
Total N
umbe
r of S
tude
nts
ATISTICS 013/2014 sc1 counties. TORTS prograely 860 out‐oa, South Caro
udent Participaudent particip
ISTICS of the 57 scs. Fifty‐thre
90360
0
500
000
500
000
500
chool year, tThe five couam include: of‐state studolina, and W
ation by Counpation are sho
chools particee percent o
0
942
60
43
S
North C
the North Conties with thSan Diego, Rdents particiWisconsin.
nty for school ywn in purple.
cipating in thof the North
4
100
697
2
Student Pa
Coast Redwoo
oast Redwoohe most studRiverside, Copated from
year 2013/201
he North CoaCoast Redw
4 60 102
13
articipation
ods District P
ods PORTS pdents particiontra Costa, the followin
14 for the NCR
ast Redwoodwoods progra
371
90 20
1
n by Count
PORTS Statist
rogram wasipating in thLos Angelesng states: Mi
RD PORTS pro
ds PORTS prams were de
1925
132 64
ty
ical Report 2
s delivered toe North Coas, and Yuba. issouri, Ohio
ogram. The lar
rogram qualielivered to T
30 120 30
013/2014
o ast o,
rgest
ify as itle I
195464
28

June 201
The Seacprogram staff has approxim OVERALLThis schostudents
Figure 1 a
200
400
600
800
1000
1200
0
50
100
150
200
250
300
350
14
Sea
cliff State Bewas in opercompiled th
mate.
L PROGRAMool year the .
and 2. The Sea
5026
0
0
0
0
0
0
0
2006‐200School Yea
153
2006‐2007School Year
acliff State2
ach PORTS Dration four dhe following
M STATISTICSSeacliff POR
acliff PORTS to
6167
7ar
2007‐2008School Year
An
212
2007‐2008School Year
2S
An
e Beach PO2013/2014 S
Distance Leadays a week data throug
S RTS program
otal programs
9218
r2008‐2009School Year S
nnual Com
331
2008‐2009chool Year
20Sc
nual Com
ORTS DistaSchool Year S
arning Studioand staffed gh an online
delivered p
delivered and
9571
2009‐2010School Year
20Sc
mparison
303
009‐2010chool Year
20Sch
mparison‐
Seacliff SB
nce LearniStatistics
o is in its eigby a seasontracking sys
programs to a
d students ser
8640
010‐2011chool Year
201Sch
‐Total Stu
285 2
10‐2011hool Year
201Scho
‐Total Pro
B PORTS R
ing Studio
hth year of oal Senior Pastem. All sta
approximate
rviced over th
8334 79
11‐2012hool Year
2012Scho
udents
273 2
1‐2012ool Year
2012Schoo
ograms
Report 2013
operation. Trk Aid. PORatistics are
ely 6,313
e last 8 years.
941631
2‐2013ol Year
2013‐Schoo
55
19
2‐2013ol Year
2013‐2School
3/2014
The RTS
.
13
2014l Year
5
2014l Year
29
June 201
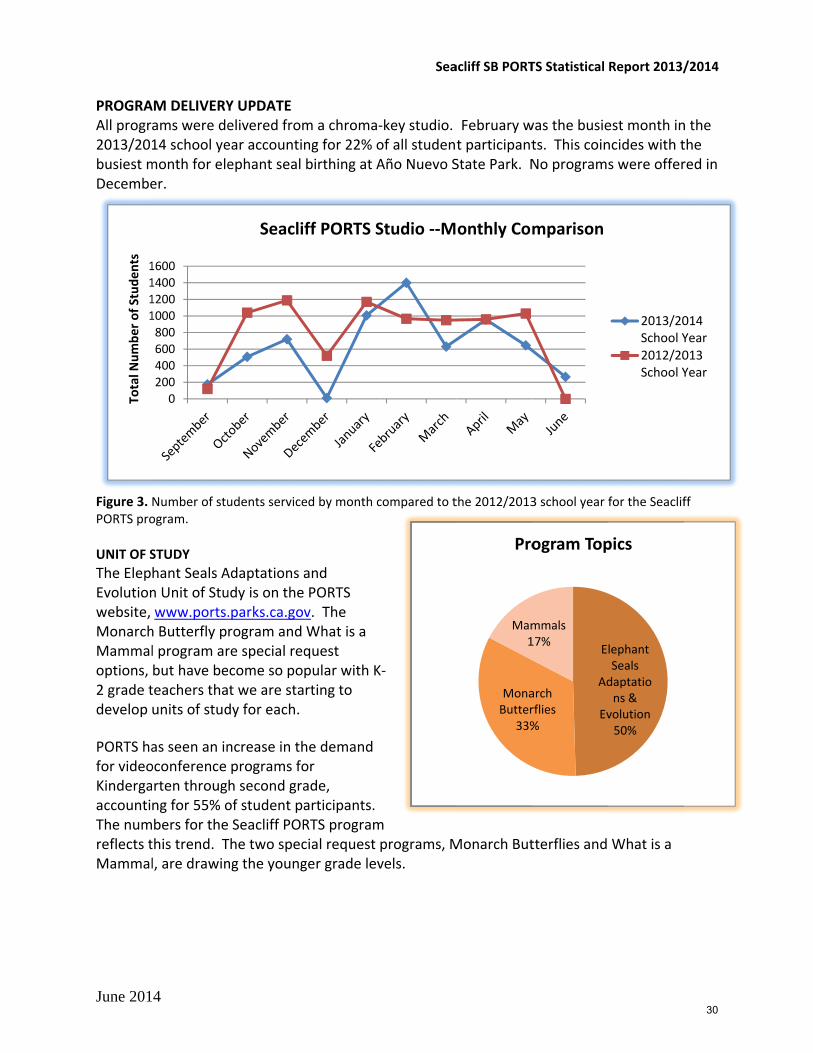
PROGRAAll progr2013/201busiest mDecembe
Figure 3. PORTS pro UNIT OF SThe ElepEvolutionwebsite, MonarchMammaloptions, 2 grade tdevelop PORTS hafor videoKindergaaccountiThe numreflects tMammal
1111
Total N
umbe
r of S
tude
nts
4
AM DELIVERYams were de14 school yemonth for eleer.
Number of stuogram.
STUDY hant Seals An Unit of Stuwww.ports.
h Butterfly pl program arbut have beteachers thaunits of stud
as seen an inoconference rten througng for 55% obers for thethis trend. Tl, are drawin
02004006008001000120014001600
Y UPDATE elivered fromear accountinephant seal
udents service
Adaptations audy is on the.parks.ca.govrogram and re special reqcome so pot we are stady for each.
ncrease in thprograms foh second graof student pa Seacliff PORThe two specng the young
Seacli
m a chroma‐ng for 22% obirthing at A
ed by month c
and PORTS v. The What is a quest pular with Krting to
he demand or ade, articipants. RTS programcial request ger grade lev
ff PORTS S
Sea
‐key studio. of all studenAño Nuevo S
compared to t
K‐
m programs, Mvels.
Studio ‐‐M
acliff SB PORT
MonaButter
33%
Mam1
Pro
February wt participantState Park. N
the 2012/2013
Monarch But
onthly Com
TS Statistical
E
Ad
Ev
arch rflies%
mmals17%
ogram Top
was the busiets. This coinNo programs
3 school year f
tterflies and
mparison
Report 2013/
lephant Seals daptations &
volution50%
pics
est month inncides with ts were offer
for the Seaclif
What is a
2013/20School Y2012/20School Y
/2014
n the the red in
ff
014Year013Year
30
June 201
Figure 4. COUNTYDuring thcountiesinclude: YstudentsPennsylv
Figure 5. Scounties b TITLE I STThirty‐onschools.
Total N
umbe
r of S
tude
nts
Total N
umbe
r of Stude
nts
4
Total numbe
STATISTICShe 2013/201. The five coYuba, San Dparticipated
vania, and W
Student particby student par
TATISTICS ne of 47 schoSeventy‐tw
84
0200400600800
1000120014001600
44555
0100200300400500600700800900
r of students
14 school yeaounties withiego, Riversid from the fo
Wisconsin.
cipation by corticipation are
ools that paro percent of
47
1348
T
58
24 30
by grade level
ar, the Seacl the most stde, Los Angeollowing sta
unty for schooe shown in pur
rticipated in f the Seacliff
1265
2
Total Stude
42102
63
Stude
Sea
l for the Seacl
liff PORTS prtudents parteles, and Kintes: Minnes
ol year 2013/2rple.
the Seacliff f PORTS prog
11
1053
ents by Gra
32
210
820
nts by Cou
acliff SB PORT
iff PORTS prog
rogram was ticipating in tngs. Approxsota, Missou
2014 for Seac
PORTS proggrams were
2721
ade Level
50
414 377
unty
TS Statistical
gram.
delivered tothe Seacliff ximately 374ri, New York
liff PORTS pro
gram qualifydelivered to
100
692
7
11524
Report 2013/
o schools in PORTS progr4 out‐of‐statek, Ohio,
ogram. The lar
y as Title I o Title I scho
497
60 30 75
/2014
18 ram e
rgest
ools.
28
814
31

J
Twt
OTi
Fw
une 2014
The Californiwas in operathe following
OVERALL PRThis school yn 35 program
Figure 1 andwere not offer
0
1000
2000
3000
4000
5000
Total N
umbe
r of S
tude
nts
020406080
100120140160
Total N
umbe
r of S
tude
nts
C
ia State Capiation five dayg data throu
ROGRAM STAyear the Statms.
d 2. The Capitored during the
490
0
0
0
0
0
0
2006‐2007SchoolYear
15
2006‐2007School Year
2S
California S2
itol Museumys a week angh an online
ATISTICS te Capitol PO
ol PORTS totae 2010/2011 a
1306
7 2007‐2008SchoolYear
2
Annu
43
2007‐2008School Year
20Sch
Annua
State Capit2013/2014 S
m PORTS prond staffed bye tracking sy
ORTS progra
l programs dend 2011/2012
2826
2008‐2009SchoolYear
20S
al Compa
97
008‐2009hool Year
200Scho
al Compa
tol MuseumSchool Year S
gram is in ity a State Parystem. All st
m delivered
elivered and st2 school year
4301
09‐2010SchoolYear
2010ScY
arison‐‐To
134
0
09‐2010ool Year
2010‐Schoo
arison‐‐To
State Capi
m PORTS PStatistics
s eighth yeark Interpretetatistics are a
programs t
tudents servicdue to loss of
0 0
0‐2011hoolYear
2011‐2SchoYea
otal Stud
0 0
‐2011ol Year
2011‐2School
otal Progr
tol Museum
Program
ar of operatioer I. PORTS approximate
o approxima
ced over the laf staffing.
874
2012oolar
2012‐20SchooYear
dents
26
2012Year
2012‐20School Ye
rams
PORTS Repo
on. The prostaff has come.
ately 1,190 s
ast 8 years. Pr
1190
013ol
2013/2014SchoolYear
35
13ear
2013/2014School Yea
rt 2013/2014
ogram mpiled
students
rograms
4
4ar
4
32

J
PTSo
FP UTwvo
OpAihMs
FPSa
une 2014
PROGRAM DThe programState Capitoof all studen
Figure 3. NumPORTS Program
UNIT OF STUThe State Cawww.ports.pvideoconfereoverview of
Over 1,050 sprograms deAssembly men Colton Joihigh school sMimi Walterschool in San
Fourth gradePORTS venueState Governall other grad
0100200300400500600
Total N
umbe
r of S
tude
nts
DELIVERY UPms were delivl Museum. t participant
mber of studem.
UDY pitol “Your Vparks.ca.govence with ststate govern
students parelivered. Apember Cheryn Unified Scstudents at Prs videoconfn Juan Capist
e students coes, the Statenment to prode levels.
State
PDATE vered from aMay was thets.
nts serviced b
Voice in Govv. The “Yourudents in 8th
nment is also
ticipated in proximatelyyl Brown vidhool DistrictPoly Tech Hierenced wittrano.
ontinued to e Capitol PORovide an exp
Capitol PO
a mobile unie busiest mo
by month com
vernment” U Voice in Goh grade and o offered.
the State Go 130 studendeoconferent, San Bernagh School inh 4th grade s
account for RTS interpreperience tha
ORTS Prog
State Capito
t in the Histonth in the 2
mpared to the 2
Unit of Studyovernment” high school.
overnment pts videoconfced with 8th
rdino. Assemn Riverside Ustudents at S
the most paeter deviatedt is meaning
gram ‐‐Mo
ol Museum P
oric Govern2013/2014 s
2012/2013 sc
y is on the POprogram bri. A non‐legi
program accferenced with grade studembly Jose MUnified SchooSt. Margaret
articipants td from his tygful to stude
onthly Com
PORTS Statist
or’s Office inchool year a
hool year for
ORTS websitngs in a statslator progr
counting for th their statents at Joe BMedina videool District, Rt’s Episcopal
his school yeypical fourthents and rele
mparison
ical Report 2
n the Califoraccounting fo
the State Cap
te, te legislator am providin
89% of the e legislatorsBaca Middle oconferenceRiverside. Sel School, a p
ear. As withh grade progevant to the
2012/2013School Yea2013/2014School Yea
013/2014
rnia or 42%
itol
to ng an
s. School d with enator rivate
h all ram park for
3ar4ar
33

J
F7 CDcit
Fc TEF
une 2014
Figure 4. Tot71% students
COUNTY STADuring the 2counties. Thnclude: Oranthe State Cap
Figure 5. Stucounties by stu
TITLE I STATEight of the 1Fifty‐five per
0200400600800
1000
Total N
umbe
r of S
tude
nts
020406080
100120140160180200
Total N
umbe
r of Stude
nts
tal number of served in 201
ATISTICS 013/2014 sche three counge, Marin, pitol PORTS
udent Participaudent particip
ISTICS 16 schools trcent of the
0000000
30
180
students by g3/2014.
chool year, tnties with thand Contra program.
ation by Counpation are sho
hat participastudents pa
0 24
Tota
0
20
14
grade level for
the State Caphe most studCosta. Thes
nty for school ywn in purple.
ated in the Srticipating in
4 0
al Students
40
175 1
Stude
State Capito
r the State Cap
pitol PORTS dents particise counties a
year 2013/201
State Capitoln the State C
848
1
s by Grade
180 181
ents by C
ol Museum P
pitol PORTS pr
program waipating in thaccount for 4
14 for State C
l PORTS progCapitol prog
10 0
e Level
30 35
County
PORTS Statist
rogram. Four
as delivered e State Capi45% of all st
Capitol PORTS
gram qualifyrams attend
0
24
97
ical Report 2
th Grade acco
to schools iitol PORTS pudents serv
Program. The
y as Title I scd Title I schoo
24860
68
30
013/2014
ounted for
n 13 program ed by
e 3 largest
chools. ols.
34

Compiled June 2013
2013/2014 Teacher Survey Report
INTRODUCTION The Department uses a standardized School Group Program Evaluation (SGPE) for school group interpretive programs throughout the state. Five years ago, PORTS staff created a hybrid online version of the school group evaluation, which incorporates many of the key questions on the standard SGPE along with new questions that better serve the needs of the PORTS program. The online PORTS Teacher Survey was sent out in the fall and spring to teachers and school site coordinators. We received 107 responses this school year. The questions on the Teacher Survey examine the program’s overall usability; the relevance of its instruction materials; the effectiveness of its live presenters; the efficiency of scheduling and logistics; and the technology tools and infrastructure in increasing student knowledge and appreciation of resources protected by California State Parks. PORTS PROGRAM EXPERIENCE GRADES The key questions asked of the respondents were graded using report card style grading (A‐F).
• 88% of participants gave PORTS an A grade for “Overall Program Experience” • 81% of participants gave PORTS an A grade for “Videoconference Presentation” • 60% of participants said they used the PORTS online lessons; 61% of those gave the
“Online Lessons” an A grade • 81% of participants gave PORTS an A grade for “Scheduling Process and Logistics”
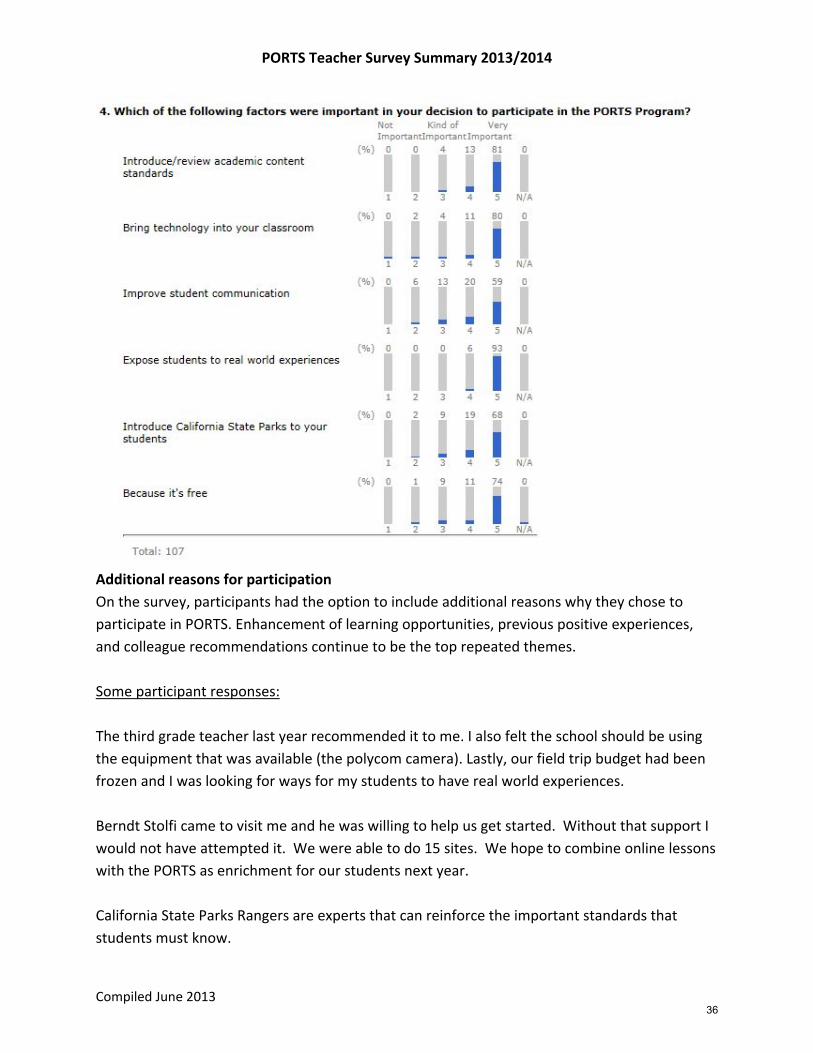
PROGRAM PARTICIPATION Which of the following factors were important in your decision to participate in the PORTS Program? The following statistics were obtained regarding the “very important” factors for respondents’ participation in the PORTS Program. Exposing students to real world experiences still remains the most important reason teachers cite for participating in PORTS. (The most important factor is in bold. The percentage change from last year is in parenthesis):
• Introduce/review academic content standards—81% (+10.5%) • Bring technology into your classroom—80% (+3.5%) • Improve student communication—59% (+4%) • Expose students to real world experiences—93% (+8%) • Introduce California State Parks to your students—68% (‐.5%) • Because it’s free—74% (+9%)
35
PORTS Teacher Survey Summary 2013/2014
Compiled June 2013
Additional reasons for participation On the survey, participants had the option to include additional reasons why they chose to participate in PORTS. Enhancement of learning opportunities, previous positive experiences, and colleague recommendations continue to be the top repeated themes. Some participant responses: The third grade teacher last year recommended it to me. I also felt the school should be using the equipment that was available (the polycom camera). Lastly, our field trip budget had been frozen and I was looking for ways for my students to have real world experiences. Berndt Stolfi came to visit me and he was willing to help us get started. Without that support I would not have attempted it. We were able to do 15 sites. We hope to combine online lessons with the PORTS as enrichment for our students next year. California State Parks Rangers are experts that can reinforce the important standards that students must know.
36

PORTS Teacher Survey Summary 2013/2014
Compiled June 2013
Our third grade has done this before and it was fantastic. Now multiple grade levels use the PORTS program. It is professional, fits our academic curriculum, engages children and we are basically thrilled with the videoconference. Our school has little money for field trips, and students come from low‐income families that rarely travel to places such as state parks. I also used the opportunity to expose other educators to the benefits of the PORTS program. Past experiences have been amazing! The programs are so well done and meet Common Core Standards. Virtual Field trips extend learning beyond the confines of the classroom. Students can be exposed to natural‐resource related topics that broadens their content knowledge and increases vocabulary acquisition. Additionally, students can hone observation, questioning and critical‐thinking skills in an environment of low‐affective filter. ONLINE LESSONS Please respond to the following comments relating to the PORTS online lessons. The graph below summarizes the responses regarding whether the Online Lessons fulfilled the following statements:
• Learning objectives were clearly outlined and appropriate • Materials aligned to academic content standards • Instructional materials were easy to use and understand • Instructional materials were interesting and appealing to my students • Lessons used current pedagogical methods: constructive learning, group participation,
etc.
37

PORTS Teacher Survey Summary 2013/2014
Compiled June 2013
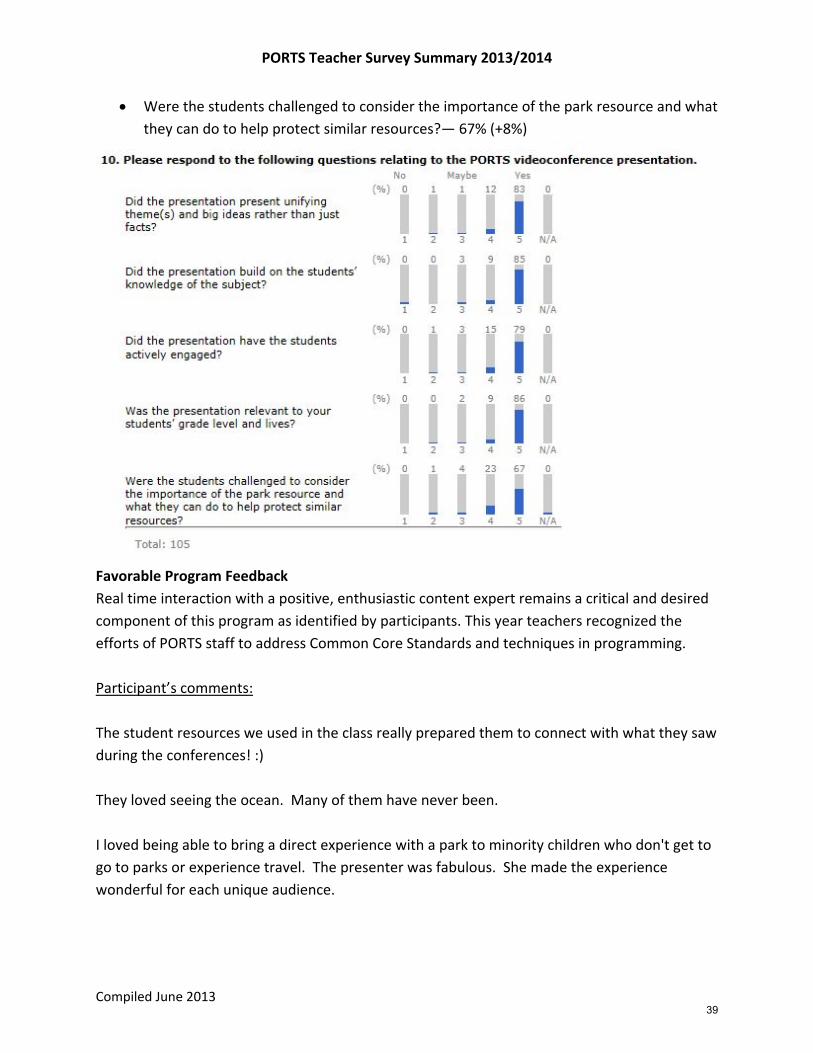
Fifty‐nine percent of teachers surveyed said they used the PORTS online lessons. This number has remained consistently low over the years. PORTS is currently working with Butte County Office of Education and contracted teachers to align all of the online lessons to the Common Core State Standards and Next Generation Science Standards. We hope more teachers will use the online lessons more upon completion of this project. The newly aligned online lessons will be available to teachers in August 2014. VIDEOCONFERENCE PRESENTATION Please respond to the following questions relating to the PORTS videoconference presentation. The following statistics were obtained regarding whether the Videoconference Presentations definitively fulfilled the following objectives (i.e. answered “Yes”. Percentage change from last year is in parenthesis):
• Did the presentation present unifying theme(s) and big ideas rather than just facts?— 83% (+6%)
• Did the presentation build on the students’ knowledge of the subject?— 85% (+6) • Did the presentation have the students actively engaged?—79% (+4) • Was the presentation relevant to your students’ grade level and lives?— 86% (+12.5%)
38
PORTS Teacher Survey Summary 2013/2014
Compiled June 2013
• Were the students challenged to consider the importance of the park resource and what they can do to help protect similar resources?— 67% (+8%)
Favorable Program Feedback Real time interaction with a positive, enthusiastic content expert remains a critical and desired component of this program as identified by participants. This year teachers recognized the efforts of PORTS staff to address Common Core Standards and techniques in programming. Participant’s comments: The student resources we used in the class really prepared them to connect with what they saw during the conferences! :) They loved seeing the ocean. Many of them have never been. I loved being able to bring a direct experience with a park to minority children who don't get to go to parks or experience travel. The presenter was fabulous. She made the experience wonderful for each unique audience.
39

PORTS Teacher Survey Summary 2013/2014
Compiled June 2013
They loved the activities that Vonnie had them do. She taught them a little game that reinforced the stages of butterfly development. Whenever the rangers were interactive with students, got them out of their seats, made jokes, or related to the students' lives. Students loved getting to see a new place. You made it very kid friendly and taught the concepts in a manner the children could relate to/understand. They get to see and learn about elephant seals which are not seen in the Imperial Valley They loved how interactive it was and the dance to "Staying'Alive" that they learned for "adaptation". They were dancing to this the next few days. They loved the videos of the salmon and that they could ask questions. My students were excited to ask a bunch of questions and learned a lot. We took our Language Arts benchmark that had text about the Gold Rush. It was very similar to what our presenter was teaching us. The kids remembered the information so much better because they actually saw it in the video conference. It worked out wonderfully! My students will say that they enjoyed everything. I'd like to point out the tremendous opportunity the PORTS Program provides to meet the Speaking and Listening Standards. Preparing the students to ask "meaty" questions of the ranger was a core element of achieving the best results possible. The online resources were a significant help in giving my students enough background information to spark a firestorm of new ideas and relevant questions. Ranger Phil was outstanding in his presentation. He seamlessly provided artifacts and connections to every child's question. It was as if we had rehearsed the event together. As we do follow up activities in class, we will be meeting even more Speaking and Listening standards. I can't wait to do this again! My students love the programs that do not use a green screen. They love seeing the rangers in the actual location. They love getting new information and sharing what they know. They love being involved both verbally and through movement. Students like the interactive, inquiry‐based style of learning in in which they construct knowledge through active engagement in questioning, analyzing, discussion and kinesthetic participation.
40

PORTS Teacher Survey Summary 2013/2014
Compiled June 2013
PROGRAM IMPROVEMENT Program improvement comments generally fall into the following categories:
• Improvement of online units of study (alignment to Common Core State Standards, ensure no broken links, etc.)
• Align programs to Common Core State Standards, especially incorporation of more open‐ended, critical thinking questions.
• Use more live media (live cameras, be in the park) Participant’s Comments: Continue the excellent distance learning presentation in which students are asked questions and only those that feel comfortable are asked to do simulations. Some of the questions should be open‐ended to include students that have limited background knowledge or are reluctant participants. Some of the Units of Study lesson links did not work or I was unable to access. Develop questions during the conference that can have more than one answer. The kids feel stumped when they know there is only one possible answer; consider how to show the individual answer during the talk but ask questions that can invite more students to share. Both of my programs were fantastic and the kids still talk about them, these are just next step ideas. It needs to be more interactive and maybe less structured or a need to "get through" material. The students need to be talked to for a few minutes but then lead to ask questions based on the presentation shown. Too many questions that were "fishing" for "right" answers instead of open ended questions that sparked critical thinking. I think giving the students more to do (talk to your shoulder partner, everyone vote instead of just one student raising their hand, thumbs up for yes and down for no, etc.), would be great. For kids in 3rd grade, especially when we cannot get there and go into the forest, less content & allowing more time for curiosity would be better. Some kids do want to visit though. Some staff as well! The kids did enjoy Ryan. He had enthusiasm and was easy to work with. I have been in Columbia I would like the students to see the dentist office, shops and other parts of the town during these times it would be great for the ranger to talk about prices, health needs, etc.
41
PORTS Teacher Survey Summary 2013/2014
Compiled June 2013
Live feeds. Talking the camera outside and showing us real redwood trees or views around the park. (If possible) Please work on aligning the programs with Common Core State Standards and Next Generation Science Standards. CONNECTING STUDENTS BEYOND THE PORTS PROGRAM Twenty‐three respondents were able to take their class on a field trip to a California state park. This is only approximately 20% of all the survey respondents, a low percentage. The state parks visited on field trips include: Angel Island SP Empire Mine SHP Año Nuevo SP Anza‐Borrego Desert SP Big Basin SP California State Railroad Museum Carpinteria SB Columbia SHP Cuyamaca Rancho SP Doheny SB
La Purísima Mission SHP Lake Oroville SRA Natural Bridges SB Point Lobos SR San Juan Bautista SHP Sonoma SHP State Capitol Museum Sutter’s Fort SHP Torrey Pines SR
CONCLUSION The PORTS Teacher Survey continues to be a valuable tool for program improvement and feedback. This is the fifth year we collected comprehensive responses from our participants. Our Overall Program Experience “A” Grade went up eight percent this year, the second year of increase. We attribute this to the hard work of the PORTS interpreters in improving their presentation techniques and program content. To address concern about interpreters’ questioning techniques, we will devote significant time in the Fall PORTS training and work on improving it this upcoming school year. With the alignment of all the online Units of Study to the Common Core State Standards and Next Generation Science Standards, there will be greater emphasis on ensuring programs support and address the appropriate standards.
42