ports 2010 a new strategic business plan for oregon’s
TRANSCRIPT
PORTS 2010A New Strategic Business Planfor Oregon’s Statewide Port SystemBy: Parsons Brinckerhoff, 400 SW Sixth Ave, Portland OR 97204 | April 2010

Consultant Team:Parsons Brinckerhoff
The Benkendorf Associates, Corp.Don Grigg
Riverwise LLCTangent Services, Inc.BST Associates, Inc.
David P. Simpson Consultants
Agency Partners:Oregon Business Development Department
Business Oregon, Ports Program775 Summer Street NE, Suite 200
Salem, Oregon 97301
Oregon Department of TransportationFreight Mobility
13th Street NE, Suite 3Salem, Oregon 97301-4179
Port Advisory Group:
Alan Brown, Oregon Transportation CommissionMartin Callery, Port of Coos Bay (representing South Coast ports)
Gary Cardwell, Northwest Container (representing shippers and private sector stakeholders)Bill Cook (Retired Port of Astoria, representing North Coast ports)
Tammy Dennee, Oregon Wheat Growers Association (representing Oregon industry stakeholders)Representative David Edwards
Jerry Grossnickle (Tow operators, marine transportation)Susie Lahsene, Port of Portland (representing Lower Columbia River ports)
Bud Shoemake, Port of Toledo (representing Central Coast ports)Chuck Daughtry, Port of Cascade Locks (representing Upper Columbia River ports)
Project Core Team:Dave Harlan, Ports Manager, Business Oregon
Lynn Schoessler, Deputy Director, Business OregonTeddie Baker, Senior Freight Planner, Oregon Department of Transportation
Chuck Green, PE, Senior Transportation Planner, Parsons BrinckerhoffAl Benkendorf, Principal, The Benkendorf Associates, Corp.
Don Grigg

Ports 2010: A New Strategic Business Plan for Oregon’s Ports i
Table of ContentsSummary ....................................................................................................................................................... 1
i. Purpose of this Strategic Business Plan ...................................................................................................... 1ii. Strategic Business Plan Goals ...................................................................................................................... 2iii. Summary of the Recommendations ............................................................................................................. 3iv. Each Port is Different .................................................................................................................................... 8v. Importance and Impact of Oregon’s Ports .................................................................................................. 8vi. Input from Port Stakeholders .................................................................................................................... 12vii. Strengths ..................................................................................................................................................... 13viii. Challenges ................................................................................................................................................... 14ix. Organization of the Strategic Business Plan Document ........................................................................... 15
I. Past Port Planning Efforts in Oregon .................................................................................................. 17A. The 1960s ...................................................................................................................................................... 17B. The 1970s and Early 1980s .............................................................................................................................. 18C. Efforts Since the Late 1980s ............................................................................................................................ 19
II. Governance and Funding ................................................................................................................... 21A. State Statutes and Regulations ........................................................................................................................ 21B. Federal Statutes and Regulations ..................................................................................................................... 27C. Recent Regulatory Issues ................................................................................................................................ 31D. Oregon’s Port Governance ............................................................................................................................... 32E. Port Governance and Oversight Examples from Other States ............................................................................. 32F. The Comparison to Oregon .............................................................................................................................. 38G. Current Port Funding and Finance Structure ..................................................................................................... 39
1. Local .............................................................................................................................................................. 392. State .............................................................................................................................................................. 393. Federal ........................................................................................................................................................... 41
III. Statewide Port Assessment ............................................................................................................... 43A. Summary of Port Interviews ............................................................................................................................ 43
1. Services and Condition of Facilities ................................................................................................................... 442. Markets .......................................................................................................................................................... 493. Transportation Access ..................................................................................................................................... 504. Financial Condition .......................................................................................................................................... 51
Ports 2010: A New Strategic Business Plan for Oregon’s Ports ii
5. Capital Facilities Needs and Funding Requests .................................................................................................. 526. Status of Strategic/Business/Master Plans ......................................................................................................... 567. Governance/State Services .............................................................................................................................. 568. Regulatory Issues ........................................................................................................................................... 57
B. OPPA.............................................................................................................................................................. 57C. Other State Agencies ....................................................................................................................................... 58D. Key Legislators ............................................................................................................................................... 58E. Tourism Commission ....................................................................................................................................... 59
IV. Strengths and Challenges Assessment ............................................................................................... 61A. Strengths ....................................................................................................................................................... 62B. Challenges ...................................................................................................................................................... 63
1. Upper Columbia River Shallow Draft Ports Assessment ...................................................................................... 652. Lower Columbia/ Coastal Deep Draft Ports Assessment ..................................................................................... 663. Coastal Ports Assessment................................................................................................................................ 67
C. Oregon’s Lifeblood: Marine Cargo .................................................................................................................... 681. What Types of Goods are Transported and How? .............................................................................................. 682. Concerns ........................................................................................................................................................ 72
D. Outlook for the Future ..................................................................................................................................... 731. Market and Economic Outlook.......................................................................................................................... 732. Forest Products Outlook .................................................................................................................................. 813. Harbors of Refuge ........................................................................................................................................... 834. Energy Outlook ............................................................................................................................................... 845. Outlook for Marinas ......................................................................................................................................... 85
V. The Strategic Plan’s Recommendations ............................................................................................. 87A. The Findings ................................................................................................................................................... 87B. Goals and Objectives ....................................................................................................................................... 88Recommendations ................................................................................................................................................. 91
Recommendation 1: Revise State Port Program Institutional Structure into a Business Relationship with each Port. . 92Recommendation 2: Revise and Elevate the Prominence of the Port Program Structure within State Government. ... 97Recommendation 3: Recognize the Importance of Oregon’s Ports within the State’s Economy .............................. 101Recommendation 4: Create a Port Investment Fund and Statewide Port Capital Facilities Plan. ............................. 105Recommendation 5: Port District Consolidation or Elimination is a Local Decision Item. ........................................ 111
Ports 2010: A New Strategic Business Plan for Oregon’s Ports iii
C. Phasing in the Recommendations ................................................................................................................... 112D. Template for Port Strategic Plans ................................................................................................................... 117E. Template for Individual Business Agreements ................................................................................................. 123
Principal Consultant Staff .......................................................................................................................... 124

Ports 2010: A New Strategic Business Plan for Oregon’s Ports iv
This page intentionally left blank.

Ports 2010: A New Strategic Business Plan for Oregon’s Ports 1
Ports 2010:A New Strategic Business Plan for Oregon's Statewide Port System
SUMMARY
i. Purpose of this Strategic Business PlanOregon’s ports provide recreational, commercial, and economic services to residents and businesses in Oregon andbeyond, serving as state, national and international transportation gateways. They are a key component insustaining Oregon’s economy and quality of life, supporting thousands of family wage jobs. One out of six Oregonjobs is directly or indirectly tied to cargo, recreation, industrial, commercial or other activities at Oregon’s ports,including privately-owned and operated docks which import and export goods (some of which are on port-ownedproperty, while others are on privately-owned land).
Since the last comprehensive port planning effort in 1980, there have been a number of smaller, more focusedport planning efforts, each of which have made recommendations for management and growth of Oregon’s ports.Since the 1980’s, the State of Oregon’s port program has experienced a number of changes, including declines instaffing levels and support. To compensate for these shortfalls, individual ports have been requesting fundingfrom the legislature or Congress without a statewide effort to evaluate or rank their funding requests.
In the past three to four years, the number of individual port funding requests has increased, causing thelegislature to request a more coordinated effort on the ports’ part. Additionally, in the past 2-3 years, keylegislators and the Oregon Economic and Community Development Commission (now the Business DevelopmentCommission) called for a statewide strategic planning effort to determine what the State of Oregon’s interest andinvolvement in, Oregon ports should be.
The purpose of this Oregon Statewide Port Strategic Plan is to:
“Define the State of Oregon’s future role, interest and investment in the statewide port system based on a realisticassessment of port markets, and economic and business development opportunities. It will identify infrastructure,equipment, administrative, regulatory and governance needs of the ports, and also identify ways that Oregon’s
Ports 2010: A New Strategic Business Plan for Oregon’s Ports 2
port system can best serve the interest of the State of Oregon and its residents.” Building on past planning effortsand lessons learned, the ports’ current situations, and their future outlook, this strategic plan provides a set ofrecommendations and implementation strategies intended to create a successful business relationship betweenOregon’s state government and all Oregon ports.
ii. Strategic Business Plan GoalsThe following goals for development of this strategic plan were formulated by the project’s Core Team based onthe assessment of the data and stakeholder input. These will be discussed in greater detail in the Strategic Plan’sRecommendations chapter.
Improve state support and funding for ports to identify and grow their existing business lines,including marine cargo and transportation, property development, tourism and recreation, air and surfacetransportation, and marine-dependent facilities.
Identify strategies for Oregon’s ports to tap into emerging markets and respond quickly to newopportunities.
Organize the State’s programs to facilitate the success of Oregon Ports consistent with therecommendation of the Statewide Port Strategic Plan.
Provide education, outreach, training, advocacy and support for ports.
Provide financing programs and investment strategies to improve the ports’ ability to pursue existingbusiness lines and new markets.
Endorsement - Upon completion of public review, seek adoption of the Port Strategic Plan by appropriatestate agencies along with support by Oregon’s ports and OPPA.
Ports 2010: A New Strategic Business Plan for Oregon’s Ports 3
iii. Summary of the RecommendationsThis document, Ports 2010: A New, Statewide Strategic Business Plan for Oregon’s Port System, is the result of theintense strategic business planning process. This strategic plan is a policy plan which lays out the framework for anew business relationship between OBDD and each port. The Strategic Plan recommends a number of changes toOregon’s state government institutional structure as it relates to ports, a change in how the ports and stateagencies interact and coordinate, a new centralized infrastructure finance program, and a new marinetransportation modal program. While its policies and framework will take effect upon adoption, includingrequirements for updates to individual port strategic plans, there are a number of other elements which will requirean implementation process, and eventually legislative action, before they take effect.
Through the adoption process for this Strategic Plan it was noted that under the legislatively-directedreorganization of the former Oregon Economic and Community Development Department, the Oregon BusinessDevelopment Department has been split into two main functions: Business Development Division, which focuseson economic and business development opportunities within the state, as well as job creation and retention, andthe Infrastructure Finance Authority (IFA), under which state funding and financing of capital infrastructureimprovements is housed. Under this restructuring, the Ports Program is located within the IFA, while the businessdevelopment functions with which the Ports Program will coordinate will still remain within Business Development.
Thus, the recommendations that apply to business and economic development will require close coordinationbetween the Ports Program manager and staff and OBDD’s regional business development officers. Once therecommendations of this Strategic Plan are implemented, Oregon’s ports will utilize the Ports Program for initialand primary points of contact, and the Ports Program will be responsible for coordination not only with other facetswithin the Business Development Department, but other state agencies as well. It is anticipated that eachOBDD/Port business agreement will lay out communications and coordination expectations. Eventually, anybusiness development or infrastructure project opportunity will be led by a coordinated team of port and state staffwho will be working toward the common mission established in that business agreement
These will be discussed in more detail later in this document. In short, the recommendations laid out in this planare:

Ports 2010: A New Strategic Business Plan for Oregon’s Ports 4
Institutional and Training: Revise the State’s Ports Program Institutional Structure into a one-on-onebusiness agreement between OBDD and each port. This would be an opt-in program whereby each portwill individually establish a business relationship with OBDD and would be able to fully utilize OBDD resourcesto coordinate, support, and communicate port needs to state agencies for port business functions as well asinfrastructure projects. Under these agreements, ports would be required to provide periodic progress reportsof expenditures of state funding, and will also be required to assess feasibility before requesting state funds toexpand or enter new markets. Differences between ORS 777 and ORS 778 may lead to differentimplementation processes that OBDD will need to consider when developing individual business agreementswith each port. Establish a state-certified, port-oriented training program available to all ports thatopt-in to the new Ports Program for those ports established and operating under ORS 777. Once OBDD hasdeveloped and implemented this training program, successful completion of training would be required bynewly-elected port commissioners as well as port managers for the port to retain eligibility for OBDD technicalsupport and funding assistance. The training program will also be available to currently appointed portcommissioners. OBDD would certify existing, port-sponsored training programs that fit the agency’s porttraining criteria. For ports with commissioners appointed by the governor, and for ports established andoperating under ORS 778, OBDD will coordinate with the governor’s office to review the criteria used to appointthose port commissioners, as well as reviewing current port-offered training programs, to determineapplicability of this recommendation to those ports. OBDD will then develop an action and implementation planaccordingly. Local Port Strategic Plans will need to be updated to be consistent with the StatewideStrategic Plan, and these plans will need to demonstrate local coordination and support with jurisdictions andthe local community.
Port Program Structure: Retain the Ports Program within Business Oregon, but elevate it commensuratewith the changes recommended in this Strategic Plan. OBDD should more strongly coordinate with other stateentities that provide oversight or funding for port programs or projects, such as the Marine Board forrecreational/boating facilities at ports and resource agencies for state and federal environmental review of stateand federally-funded port projects. The State should work to establish a new transportation modal programwithin state government called the Marine Transportation Program (further study is needed to determine wherethis would best be housed and what functions it would oversee), and establish a supporting advisory committeeas a subcommittee of OPPA to which ODOT and OBDD can supply coordinating liaisons.
Ports 2010: A New Strategic Business Plan for Oregon’s Ports 5
Key Industry Priorities: To recognize the importance of Ports under state statute, and of the criticalimportance of marine cargo transportation to all of Oregon's statewide key industries, the State should, as partof its own mission, recognize and make it a priority to support Oregon’s marine cargo transportation system asan integral link supporting the state’s key industries. Part of this recognition should come in the form of marinetransportation-related performance measures to be tracked as part of the Oregon Business Plan’sCompetitiveness Index. The state should work with the ports to identify regionally-significant industries thateach port supports. As part of this recommendation, the State should work with the ports to develop astatewide Marine Transportation Plan as one of the state’s modal plans.
Funding: Establish a new “Port Investment Fund”, a centralized port infrastructure funding account, which hassub-programs targeted to port and project size. The first element of this new funding program would consist ofdevelop a five-year, prioritized statewide port capital facilities plan to assist in identifying funding needs andpriorities. The Port Investment Fund (PIF) will require IFA support and legislative action to be established andfunded. The Infrastructure Finance Authority would administer and approve the statewide port capital facilitiesprogram and PIF priorities. As part of this new funding program, a “Means Test” would be established which“pre-qualifies” ports in order to allow them to pursue the PIF for their infrastructure projects. Minimumrequirements would include having a fully-executed OBDD/Port formal agreement and being in compliance withits terms and conditions, having an OBDD-approved Strategic Business Plan and Capital Facilities Plan, and theport being in satisfactory financial condition, demonstrating the ability to operate and maintain new capitalfacilities along with having at least six months of operating reserves. As an alternative to a new, separate fund,a component of a larger and expanded Special Public Works fund with funding targets and criteria for portscould be established.
Port Consolidation or Elimination is a Local Decision: unless there is a specific funding or financialemergency which would involve the state, creation, consolidation, or elimination of port districts should remaina decision within each port district’s local community. Although port districts are allowed under Oregon statute,they all were, and must be, created via local referendum and elected Port commissioners are subject to localrecall under Oregon elections statutes. At this time there are no ports which are receiving operatingassistance from OBDD. The information collected as part of the Strategic Plan found that each port isconsidered a critical component of their individual community’s economic development vision, and have theability to tap into a number of state and federal resources to help realize that vision. A number of portscontinue to support the type of industries that OBDD and the Business Development Commission have
Ports 2010: A New Strategic Business Plan for Oregon’s Ports 6
identified as key industries for the state. The ports often depend on state assistance and support in furtheringthese state-significant industries, but they also utilize local revenues to do so and develop business lines thatmay be of local and regional interest instead of a state-identified key industry.
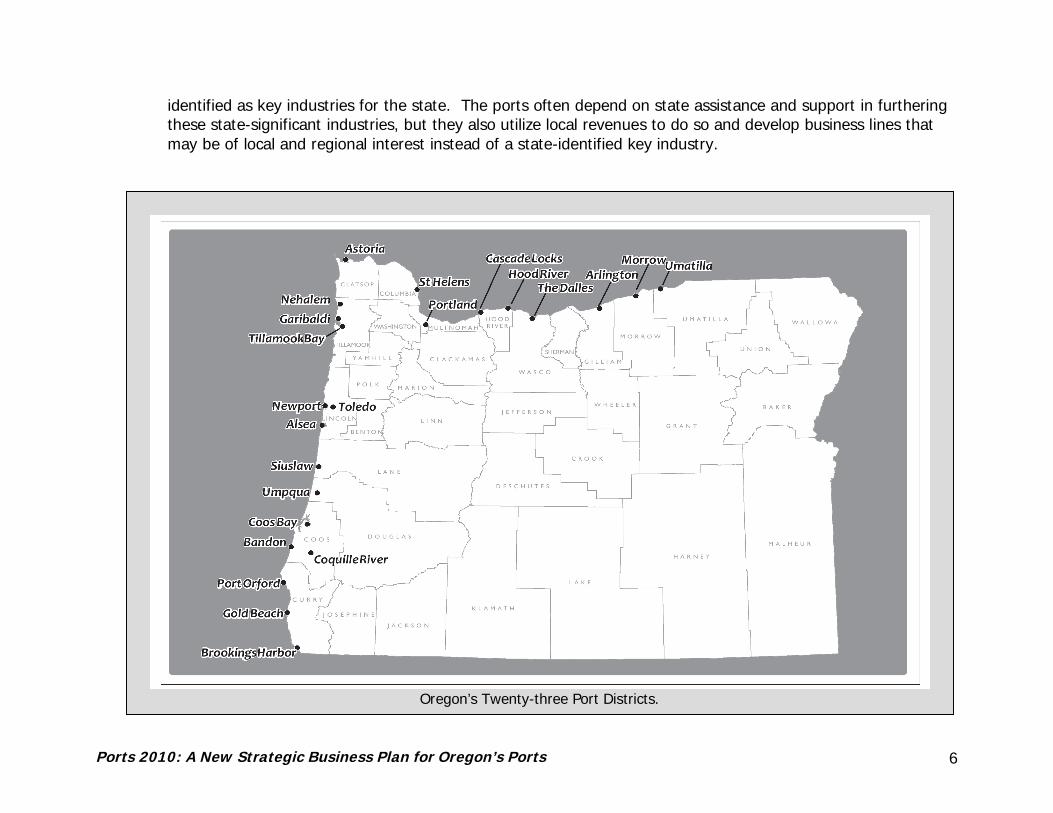
Oregon’s Twenty-three Port Districts.

Ports 2010: A New Strategic Business Plan for Oregon’s Ports 7
Strategic Plan Development Process
iii. The Strategic Planning Process
The recommended strategic plan elements were developed through a collaborative and iterative process withOregon Department ofTransportation (ODOT), OregonBusiness DevelopmentDepartment (OBDD, also knownas “Business Oregon”), OregonPublic Ports Association (OPPA),Travel Oregon, and the PortAdvisory Group. Each of the 23ports in Oregon was interviewedas part of the process.Additionally, data oninfrastructure conditions,commodity flow forecasts,market outlooks, and new andemerging markets wereassessed. The latest availableaudits of each port werereviewed, along with inventoriesof port infrastructure andfacilities. Port governance andinfrastructure finance strategiesfrom Washington, California,Florida, Louisiana, Indiana, andSouth Carolina were alsoexamined in detail. Theplanning process benefited from the participation by individuals who have been involved in previous port planningefforts over the past 40 years and from the availability of documents produced for those efforts.
Ports 2010: A New Strategic Business Plan for Oregon’s Ports 8
Policy input was provided through discussions with two key state legislators who regularly interact with ports, theOregon Business Development Commission, the Oregon Transportation Commission, and the InfrastructureFinance Authority board.
ODOT is also undertaking two other key planning processes that relate to this Strategic Business Plan: thedevelopment of the state’s first multimodal freight plan, and the Oregon Rail Study. Each of these processesprovided information for this strategic business plan, including: commodity flow forecasts, rail business studies,shipper surveys, and the relationship between Oregon’s freight transportation system and economic development.These concurrent planning efforts give Oregon the unprecedented opportunity to understand how freight flowsthrough all of the available transportation modes, including ports, and to undertake freight, rail, and port planningefforts at the same time.
iv. Each Port is DifferentAs a whole, Oregon’s ports provide facilities, services, and operations supporting recreation, commercial and sportfishing, business and economic development, and regional and international trade. However, each port is uniquein what it provides, and no two of Oregon’s ports are the same. Upper Columbia Ports provide loading points forOregon’s international agricultural trade, and the Ports of Portland, Coos Bay, and Astoria are internationalgateways. Although remotely located away from Oregon’s population centers, coastal ports provide facilities thatsupport tourism, recreation, and sport and commercial fishing that are key to their regional economies. Plannedimprovements will help with a few of the coastal ports, such as a significant highway improvement (US-20improvements currently underway) as well as two projects to re-open rail operations between the coast and inland,but several other transportation corridors across the coast range remain inadequate.
This Statewide Strategic Port Plan recognizes the individuality of each port and each port’s relationship with theState of Oregon.
v. Importance and Impact of Oregon’s PortsAs stated previously, one in six Oregon jobs, excluding construction jobs, is in some way directly or indirectlydependent on ports. Oregon’s six primary cargo ports (Portland, Coos Bay, Morrow, Umatilla, Astoria, and St.Helens) carry much of Oregon’s imports and exports: one in every five imported or exported goods produced or

Ports 2010: A New Strategic Business Plan for Oregon’s Ports 9
consumed in Oregon flows through Oregon’s ports in some way, shape, or form, with value of over $50 billion ayear.1
In wages alone, jobs related to Oregon’s ports contribute over $4.5 billion annually to the state’s economy. Thisnumber is much larger when indirect and induced jobs are also taken into account. The Port of Portland andprivate companies operating in the Portland Harbor generate over $3.2 billion a year in direct, indirect, andinduced job wages and contribute almost $6 billion annually to the Portland region’s economy.2
Oregon’s economy is highly dependent on its exported goods, and Oregon’s ports serve as international gateways.The Port of Portland captured this in their statement: “Ask a wheat farmer in eastern Oregon, a crab fisherman onthe coast or a sportswear manufacturer in the Portland area, and we think they will tell you that their ability to gettheir products through Port of Portland facilities to national and international markets is key to their businessviability.”3
The Oregon Business Plan notes that Oregon now exports nearly $20 billion worth of products annually, and thestate ranks in the top ten in exports per capita. Oregon’s ports are involved with the transportation of much ofthese exports, and continue to adapt to changes in the market: “whereas the state has historically exported mostlylightly processed raw materials such as logs, lumber and wheat, today the overwhelming majority of our exportsare value added products such as electronics, machinery, and transportation equipment.”4 Oregon’s marinetransportation ports support the State’s key industries: high technology, metals, machinery, and transportationequipment.
Based on the recently-completed Oregon Commodity Flow Forecast (2002-2035),5 marine cargo comprisesapproximately 12 percent of the total commodity flow to, through, and within Oregon. By adding in commodities
1 Based on information from the “Oregon Commodity Flow Forecasts, 2002-2035”, Parsons Brinckerhoff for Oregon Department of Transportation,October 2009”. Includes water, rail, truck, and air modes.2 “The Local and Regional Economic Impacts of the Port of Portland”, Martin Associates, 2006. Includes Portland Harbor and private facilities inoperating in the Port of Portland district. http://www.portofportland.com/PDFPOP/Trade_Trans_Studies_Ecnmc_Impact_2006.pdf3 Port of Portland Annual Meeting statement, November 2008.4 Oregon Business Plan “Policy Playbook: Initiative and Cluster Guide”, December 2008.5 Oregon Commodity Flow Forecast, Parsons Brinckerhoff for ODOT, October 2009.

Ports 2010: A New Strategic Business Plan for Oregon’s Ports 10
transferred at ports and using other modes, such as air, rail and truck, yields almost 20 percent of total commodityflow in Oregon. This is equivalent to over 80,000,000 tons per year shipped, with goods valued at over $50 billion.
Oregon’s ports offer services beyond the handling of cargo. Most of Oregon’s ports also provide land- and marine-oriented recreational activities at campgrounds, recreational vehicle (RV) parks, boat launches, and marinas. A2003 report of recreation use, visitor spending, and regional economic effects found that 18 of Oregon’s 23 portsprovided for over 700,000 recreation visits in one year (2002), resulting in $75 million in trip spending and $31million in purchases of boat-related goods and services. The spending by port visitors was even more significant,resulting in $109 million in sales, which translated to $41 million in wages and 1,670 jobs for Oregon's economy.6
Oregon’s ports support coastal and Columbia River commercial and recreational fishing. Of the 90,000 metric tonsof commercial fish landed in 2008, 99% were brought in using port-owned or operated facilities (marinas, docks,boat launches, and moorage).7 The estimated annual value of commercial fish landings at Oregon’s ports isapproximately $100 million.
Oregon’s ports provide for economic development in a variety of other ways as well, including: land acquisition,light industrial development, management of transportation infrastructure, and business recruitment/retention.The Oregon Business Plan Framework8 includes initiatives for a variety of actions and strategies to improveOregon’s business climate, and many of them will involve Oregon’s ports, and conversely Oregon’s ports will needto be recognized by the Oregon Business Plan as important contributors to the success of the Oregon BusinessPlan. Public policy initiatives potentially involving ports include transportation, economic innovation, land use,energy, and water. “Cluster Initiatives” (industry-focused initiatives) potentially involving ports include: naturalresources, forestry, food processing, agricultural products, seafood, tourism, Oregon’s state-designated keyindustries, as well as “clean and green” energy such as wind, solar, and wave energy production.
6 “Economic Impacts of Recreation Activities at Oregon Coastal and River Ports”, Wen-Huei Chang; R. S. Jackson, Engineer Research andDevelopment Center Vicksburg Ms Environmental Lab, August 2003. Available through http://www.stormingmedia.us/07/0777/A077714.html.7 Estimated using “Estimated Fish and Shellfish Landings by Port in Oregon, 2008” by the Oregon Department of Agriculture, and “CommercialFishing Statistics” by BST Associates, 2009 (summary report for the Strategic Port Plan).8 OregonBusinessPlan.org.

Ports 2010: A New Strategic Business Plan for Oregon’s Ports 11
One of every six Oregon jobs relates to ports.

Ports 2010: A New Strategic Business Plan for Oregon’s Ports 12
vi. Input from Port StakeholdersAll 23 ports, along with the OPPA, were interviewed regarding their current economic, infrastructure and marketsituation, strengths and challenges, what kind of assistance they would like from the State of Oregon, andspecifically what they hope to gain from this strategic plan. Additionally, OBDD and consultant staff met with anumber of state agencies, including ODOT, Treasurer’s Office, Department of Environmental Quality, Marine Board,Department of State Lands, as well as members of the Business Development Commission and InfrastructureFinance Authority Board to receive their input and comments regarding the Strategic Port Plan.
Generally, port officials believe they face high, and sometimes unrealistic, community expectations. They believethe state government and legislature does not fully understand or recognize the ports’ important role in theOregon economy. Port officials also recognize that as a group, they lack advocacy for the limited decentralizedsources of funding as well as for regulatory and legislative matters. The ports would like to see a mechanismdeveloped to assist OPPA in elevating its stature with the member ports as well as with Oregon’s stategovernment. The marine cargo ports would like to see a more coordinated forum to discuss issues such aspilotage, navigation and continued dredging needs, permitting, and funding.
State agency representatives agree that better coordination between each port and the State is needed, but alsostress that better state oversight of port compliance with state rules and regulations is needed as well. All stateagencies interviewed indicated they intend to commit to coordinating with OBDD and the ports as an outcome ofthe Statewide Strategic Port Plan.
Two key legislators interviewed expressed a number of concerns regarding Oregon’s ports:
State funding to ports needs tracking and accountability and should be focused on business lines of statesignificance;The legislature wants “return on investment” for all capital funding projects and wants to see a demonstratedability to maintain and operate new state-funded, capital facilities;New land use/development grant requests should include letters of support from local, land use municipalities(similar to the ConnectOregon model); andPort officials and commissioners have not always complied with state and federal laws and should havemandatory training.
Ports 2010: A New Strategic Business Plan for Oregon’s Ports 13
vii. StrengthsOregon’s port system has many existing strengths as well as opportunities to grow these strengths:
The Columbia River corridor includes three primary transportation modes – rail, barge, and highway – that isvirtually unparalleled elsewhere in the western United States. Oregon’s upper Columbia River ports (CascadeLocks, Hood River, Arlington, Morrow and Umatilla) and the Port of Portland enjoy good connections to alltransportation modes: Class I (Union Pacific and Burlington Northern Santa Fe (BNSF) Railroads), highways (I-84, I-5, and US-97), air cargo (Portland International Airport) and uncongested marine access.Oregon’s coastal location offers many scenic, fishery, and environmental features that provide the ports withopportunities to be a partner in or catalyst for economic development.The Port of Portland is one of the largest international grain export gateways in the country.There are a number of large existing or planned deep-water sites, such as those at Hayden Island (Portland),Port Westward (St. Helens), and Coos Bay, although they all have an approval or infrastructure component suchas permitting that needs to be addressed. There are several “brownfield” site development opportunities forOregon’s ports at Portland (T-4 and others), Astoria (Tongue Point), and Coos Bay.ConnectOregon is an innovative, model program for transportation funding that receives national recognition inits multimodal, economic development capabilities.There are several growing, new, and emerging markets in Oregon– agriculture and processed food products;marine sciences; live fish; eco-tourism activities on the coast; and energy sources such as wind, wave, solar,biofuel/biomass, possible Liquefied Natural Gas (LNG) terminals – as well as stable markets including: upriverfood processing, the Port of Portland’s bulk and auto markets, commercial fishing along the north coast,property development, bulk, automobiles, recreation, sport fishing, cruise tour boats.The Port of Newport recently won the competition for relocation of the National Oceanic and AtmosphericAdministration (NOAA) fleet to its facility, which will enable the Port to work with the community to establish amajor marine science center in conjunction with the existing Hatfield Marine Center and the Newport CoastalAquarium.
Many of the ports have worked for years to establish good relationships with local governments and other entitiesin their respective communities and have diversified their business lines to respond to their communities’ needs. Anumber of the ports serve as de-facto public facilities districts as well as economic development engines for their

Ports 2010: A New Strategic Business Plan for Oregon’s Ports 14
regions. Overall, Oregon’s ports have high quality port management and staff who are invested in the ports’missions, but many ports are limited by small budgets and insufficient staffing levels.
viii. ChallengesIn addition to their strengths, Oregon’s ports also face a number of challenges.
For the most part, Oregon’s cargo ports are located in small markets, which limits their ability to compete withlarger intermodal cargo ports such as Los Angeles/ Long Beach, Seattle/Tacoma/Everett. Additionally,international ports with excellent rail connections (at times subsidized by public entities) are competitorsincluding the ports listed above as well as Prince Rupert in Canada and ports in Mexico for containerized traffic.Coastal ports suffer from limited transportation access as highways across the coast range experience partial orfull closures during winter months due to weather or slides, and two cross-Coast Range rail lines are currentlyout of service.Many of the ports which own or intend to acquire waterfront land for economic development or marine terminalsface “gentrification” pressures on these lands: there is increasing pressure to develop these as residential andcommercial uses, which conflicts with industrial or marine terminal operations and port missions established byORS 777 or 778.There are limited staff resources at many of the smaller ports and in OBDD, combined with constrainedinstitutional support from the State of Oregon and OPPA.The State of Oregon has not developed a policy or procedure to quickly respond to special opportunities (suchas major shipping company interest in Coos By or the recent NOAA or LNG opportunities) or special challenges(such as the rail line closures).Ports continue to be involved in operations in declining or threatened markets, including: wood chips, breakbulk, commercial fish processing/canning, short-sea shipping (which has varied industry opinions about itsviability). Impacts of developing future marine reserves are unknown and future efforts need to include studiesof economic impacts on ports and coastal communities.There is limited federal support for coastal dredging and jetty maintenance, and weak state support forinfrastructure improvements in general.Proposals to remove dams on the Snake River, in an effort to improve Salmon habitat, are feared by the ports tonegatively impact the ability of barges to navigate the Columbia/Snake River system, resulting in goods that are

Ports 2010: A New Strategic Business Plan for Oregon’s Ports 15
currently barged (the least expensive transportation mode, per ton-mile9) having to find alternative and moreexpensive transportation modes.Many of the ports have deferred higher-cost maintenance projects due to lack of funding and resources.
ix. Organization of the Strategic Business Plan DocumentThe chapters of this document are organized as follows:
Past Port Planning Efforts: a history of port establishment and planning in Oregon
Research and Analysis: a summary of state and federal laws, rules, administrative procedures, andregulations applicable to Oregon’s ports; a comparison of other states’ port institutions and port associationswith Oregon’s; and current, port-specific state and federal funding and financing sources.
Statewide Port Assessment: a summary of the current economic, financial, infrastructure, and marketsituation for Oregon’s ports and the State of Oregon’s Port Program, including interviews with port officials andother key stakeholders, market profiles and “port-folios”, general condition of financial and infrastructure, theresults of the Strengths, Weaknesses, Opportunities and Threats analysis, and a market and economic outlookfor Oregon’s ports.
Recommendations: the recommendations of this Strategic Port Plan and implementation strategies, includingelements of the proposed memorandum of understanding between each port and OBDD and a template foreach port to use in updating their strategic (business) plans to incorporate elements of this Strategic Port Plan.
Templates: for individual port strategic business plans as well as the OBDD/port interagency agreement.
9 A Modal Comparison of Domestic Freight Transportation Effects on the General Public, Texas Transportation Institute Center for Ports andWaterways, Amended March 2009. http://www.americanwaterways.com/press_room/news_releases/NWFSTudy.pdf

Ports 2010: A New Strategic Business Plan for Oregon’s Ports 16
The appendices include:
Appendix A: Research reports including regulatory, governance, and market/economic outlookAppendix B: Detailed summary of local, state and federal port-related funding sourcesAppendix C: A market and business profile for each portAppendix D: Summaries of public meetings and comments.
Ports 2010: A New Strategic Business Plan for Oregon’s Ports 17
I. PAST PORT PLANNING EFFORTS IN OREGON
A. The 1960sAlthough there may have been previous efforts to create an Oregon statewide port plan, the oldest availabledocument is an extensive Port and Water Transportation Planning Study of 1968, written by Pacific NorthwestLaboratories division of the Battelle Memorial Institute for the Oregon Port Authorities Commission. This plan wasprompted by the 1965 creation of the Oregon Port Authorities Commission, a nine-member panel created by thelegislature and appointed by the governor to “develop a statewide plan for development of ports, marine terminals,waterways and major airports,” although at the time of its creation, this commission was not expected to be apermanent fixture in state government.
Similar to the current planning process, the 1968 study explored the governance and “state importance” issue ofports. It looked at other states’ governance structures of port activities and development, including state portauthority structures most common at that time (and still existing today) in Southeastern states such as Alabamaand South Carolina, and regional port authorities such as the Delaware River Port Authority. The study analyzedwhether separate local port operations have any conflicts or issues with the state’s interests and vice versa andwhether or not there should be state intervention in water transportation issues. The study concluded that whilewater transportation and Oregon’s ports in general were an important driver of Oregon’s economy, “the bestinterests of the State of Oregon require that the separate ports maximize the use of available resources and thatthey make the wisest use of their alternative resources and programs.” It also recommended creating some sortof agency for coordinating port development in Oregon but stopped short of recommending a strong oversightauthority, concluding that “no other state has created an agency that could adequately provide for all of Oregon’sport functions.”
In its report to the legislature, the Oregon Port Authorities Commission recommended establishment of a state portagency to “coordinate the development and financing of Oregon’s 23 port districts and Portland’s Commission ofPublic Docks,” according to an article in the Eugene Register-Guard on Jan. 13, 1969. While this did not happen,that legislative session did lead to the creation of a Ports Division when the State Highway Department, theDepartment of Motor Vehicles, the Parks Department, and the State Board of Aeronautics were combined to formthe Oregon Department of Transportation.
Ports 2010: A New Strategic Business Plan for Oregon’s Ports 18
B. The 1970s and Early 1980sThe 1970s saw the passage of Senate Bill 100 (SB 100), which resulted in another series of port planning work tiedto the development of the land use system, culminating in the Oregon Ports Study of 1980. The 1980 Study wasundertaken to assist ports in the then-new land use planning process, as well as identifying land use and resourceneeds for Oregon’s ports.
The Lower Columbia River Ports Region Study of 1975 evaluated and made recommendations on a number ofpotential deep draft sites from Portland downriver to Astoria, although it is likely that a number of the sitesrecommended for further consideration would likely be off the table today because of subsequent environmentalrestrictions and regulations. The Ports Division that was created within ODOT in 1969 was formally added tostatute during the 1973 legislative session, and was moved to the Oregon Economic Development Department(now Oregon Business Development Department) in 1975. Legislation passed two years later in 1977 resulted inthe creation of the Port Revolving Loan Fund.
Another wave of port planning began in the mid-1980s and resulted in several significant documents, including theOregon Coastal Ports Study of 1986, a joint effort of the Departments of Transportation and EconomicDevelopment; the Lower Columbia River Assessment of Oregon Deep Draft Sites, also published that same year;and the somewhat controversial Oregon Port Assessment prepared by Booz Allen Hamilton, for the OregonEconomic and Community Development Department and the Governor’s Advisory Committee for Maritime Affairs,also in 1986. The Oregon Coastal Ports Study looked at transportation improvements that would improve thecompetitiveness of the ports of Astoria, Newport, and Coos Bay. The Oregon Port Assessment provided anoverview of Oregon’s port system and noted that then-current financial and market trends were problematic for astate highly dependent on international trade, stating “a continuation of current trends suggest that future Oregonimports and exports will be dependent on the port systems of other states.” The study concluded, among otherthings, that Oregon’s ports were inadequately funded compared with ports in Washington and California. It alsolooked at the potential benefits – and risks – of relocating the state’s container handling activities from Portland tothe Astoria area. It found that “the existing situation with Oregon’s ports requires that the state have an expandedrole in port planning and development activity,” and that the “state should upgrade and expand its span of interestand influence over Oregon’s ports.” The Oregon Port Assessment recommendations were not implemented,possibly due to the change in gubernatorial administration which occurred at that time.
Ports 2010: A New Strategic Business Plan for Oregon’s Ports 19
C. Efforts Since the Late 1980sIn the late 1980s and into the 1990s, a number of other key port planning efforts were undertaken. The OregonPorts Development Study was prepared by Ports Division staff for the Oregon Port Planning and DevelopmentAdvisory Committee in 1989. The 35-page document inventoried port activities, holdings, opportunities, andfinancial performance, and it made some modest recommendations for improving port performance.
In 1997, the last time that ports were examined on a statewide basis, the Oregon Statewide Ports Study TechnicalDocument, was published by the Ports Division. The document was developed with the guidance of the OregonPorts Advisory Council, a public body created by the Oregon Legislature in 1995 (statutory references to theCouncil have since been dropped). The study inventories the activities, holdings and financial performance of theports and it includes an estimate of their economic impact to the state. The planning effort was triggered bychanges in the way federal funding was to be used to pay for maintaining coastal bar crossings and othernavigation improvements. A dredging contingency plan was developed in response to the potential reductions infederal funds for maintenance dredging; however, the pushback on those changes led to the federal governmentdropping plans to ask local jurisdictions to bear 25 percent of the cost of maintenance dredging, and instead thatcost-sharing approach was applied only to new projects. The Oregon Statewide Ports Study Technical Documentdoes not make any recommendations but references a “statewide ports study” to be completed in the coming year,along with the dredging contingency plan. Although it appears the “statewide ports study” was never completed,this process did lead to the Oregon Maintenance Dredging Contingency Plan of 1998.
Additionally, there were some recommendations from the Oregon Ports Advisory Council included in the 1997-1999Oregon Ports Biennial Report to the Legislature, including:
All ports in Oregon should be encouraged to take a critical look at their financial condition and identify andexecute actions to improve their long term financial performance.The state grant and loan programs should be reviewed to ensure appropriate incentives are available to portsthat develop plans for long term financial stability.The Port Planning and Marketing Program and other appropriate technical assistance resources of the EconomicDevelopment Department should be made available to a port or group of ports willing to undertake creativelong-range financial planning efforts.

Ports 2010: A New Strategic Business Plan for Oregon’s Ports 20
Ports should be encouraged to consider the benefits to be gained from partnering with other ports and localgovernments to pursue mutual goals and leverage resources.
During the late 1990s, the Ports Division was reduced in stature and was administratively eliminated before 2000.The popular Port Planning and Marketing Fund, which was added in the 1980s when the Ports Division consisted offive full-time staff supported solely by earnings from the Revolving Loan Fund, was retained in what became thePorts Program residing in the Oregon Business Development Department; however, the Port Program’s staffingwas decentralized and spread to other programs within the department.
The Marine Navigation Improvement Fund was created in the late 1990s during this transition. References to thePorts Division were briefly removed from statute during that period but were restored by the Legislature as a resultof aggressive lobbying efforts by the Oregon Public Ports Association. OECDD added back two professional portpositions in 2006 – a Ports Manager and a Ports Policy and Program Coordinator (PPC), but subsequentlyeliminated the PPC position because of budget restrictions.
References to a Ports Division were again removed from statute with the approval of Senate Bill 350 by the 2007Legislature. Today, the Port Program has one full-time manager, who is also a liaison to the Oregon FreightAdvisory Committee, ODOT’s Freight Plan efforts, as well as OBDD’s business development field representatives.

Ports 2010: A New Strategic Business Plan for Oregon’s Ports 21
II. GOVERNANCE AND FUNDINGTo assist in the development of the Strategic Port Plan, in-depth background research on applicable statutes,regulations, governance, and funding was undertaken. The topic of governance was investigated by examiningOregon’s past and present governance structures for ports, as well as comparing Oregon’s port governance withthat of other states.
This chapter focuses on Oregon’s ports in general (not each specific port):
Identifying the statutory role, responsibilities and powers of Oregon portsSummarizing the State of Oregon’s interest in the system including transportation, economic development,maintaining navigation access and core missionsGiving an overview of state and federal statutes and regulations and how they relate to the ports’ statutory roleand responsibilities (including how state rules on comprehensive planning may affect ports)Identifying examples of established intergovernmental agreements that involved portsDiscussing examples of regulatory conflict that may be able to be addressed by this strategic planSummarizing the governance relationship between the ports and Oregon state government, and comparing it tohow ports are regulated in other states.
A more detailed summary of state and federal regulations as well as the study of governance are found inAppendix A. Since each port falls under the planning and land use jurisdiction of a municipality (city, county orregional government), local land use regulations (governed by state statute) apply to ports as well.
A. State Statutes and RegulationsOregon Revised Statutes
Oregon Revised Statutes (ORS) Chapter 777 enables the formation of port districts in Oregon and defines theirexpected purposes, activities, and financial abilities. ORS 777 includes a subsection specifically for the OregonInternational Port of Coos Bay, and ORS 778 describes the Port of Portland’s powers in addition to those grantedwithin ORS 777. The statutes provide expansive powers to Oregon port districts by providing broad venues withinwhich ports may acquire, own, and operate facilities and services that accomplish their purposes. For example,
Ports 2010: A New Strategic Business Plan for Oregon’s Ports 22
under the purview of these statutes ports can own and operate transportation facilities (water, rail and air), act asutility providers (water and electric power) for their industrial customers, and own/operate as businesses (fueldistribution, processing facilities for fish, meat and agriculture, and industrial parks). This broad leeway isemphasized in ORS 777.258, which states that a port “may, in general, do such other acts and things, notmentioned [in relevant statutes], as tend to promote the maritime shipping, aviation and commercial interests ofthe port.” Except for the Port of Portland and Oregon International Port of Coos Bay, which have board membersappointed by the governor, all ports have locally-elected port commissions.
All of Oregon’s ports are defined as “Special Districts” under ORS 198, which provides additional (and sometimes,overlapping) regulations in administrative areas - including formation, modification, mergers and dissolution ofdistricts; and adoption of port ordinances and regulations. ORS 198.010 also allows the formation of the othertypes of special districts that pertain to operations and services currently or potentially provided by Oregon’s portsystem including utilities (ORS 261), and parks and recreation (ORS 266).
ORS 777.065 declares that development of port facilities at certain ports (specifically called out are the Ports ofUmatilla, Morrow, Arlington, The Dalles, Hood River and Cascade Locks and the development of deepwater portfacilities at Astoria, Coos Bay, Newport, Portland and St. Helens) is a state economic goal and requires stateagencies to assist ports in this endeavor. The legislature recognized that “assistance and encouragement ofenhanced world trade opportunities are an important function of the state, and that development of new andexpanded overseas markets for commodities exported from the ports of this state has great potential fordiversifying and improving the economic base of the state.” It gives state importance to development andimprovement of port facilities which could serve as global gateways for Oregon which is by declaration, to be astate economic goal of high priority. The statute also requires all agencies of the State of Oregon to be directed to“assist in promptly achieving the creation of such facilities by processing applications for necessary permits in anexpeditious manner and by assisting the ports involved with available financial assistance or services whennecessary.”
Oregon Statewide Planning Goals
Since 1973, Oregon has maintained a strong statewide program for land use planning based on a set of 19statewide planning goals. The goals express the State of Oregon’s policies on land use and related topics such asnatural resources, economic development and transportation. The goals are mandatory and have been adopted as
Ports 2010: A New Strategic Business Plan for Oregon’s Ports 23
Oregon Administrative Rules (OAR) Chapter 660; all comprehensive, land use, and transportation system plansmust adhere to these goals. Oregon’s cities and counties are responsible for complying with Chapter 660 byassuring that their comprehensive plans and development ordinances fulfill each of the goal requirements. Eachport’s responsibilities, with regards to the statewide goals, are to coordinate the improvement of their facilities andlong range plans with the local jurisdiction(s).
The planning goals that are applicable to ports include Goal 5: Open Spaces, Scenic and Historic Areas andNatural Resources, which is intended to conserve open space and protect natural and scenic resources; Goal 9:Economic Development, intended to provide adequate opportunities throughout the state for a variety of economicactivities vital to the health, welfare, and prosperity of Oregon’s citizens; Goal 12 – Transportation: To provide andencourage a safe, convenient and economic transportation system; and Goals 16-19 – Estuarine Resources,Coastal Shorelands, Beaches and Dunes and Ocean Resources, which focus on the unique characteristics ofOregon’s land mass interface with the Pacific Ocean, estuaries and wetlands.
Goal 9 (Economic Development) was amended in 2008 and specifies the requirements for complying with the goal.Cities and counties are required to assess national, state and local trends and inventory their commercial andindustrial zoned lands. Based on an assessment of future economic opportunities, jurisdictions must identify andplan for the number and types of sites that will be required to accommodate the future economic needs. The Goal9 planning process present an opportunity for ports to coordinate with the local jurisdiction(s) to incorporate theirlong range vision into the city or county’s comprehensive plan, improving the standing of future regulatory issuesrelated to commercial and industrial development with state and federal agencies. The Department of LandConservation and Development (DLCD) has been very aggressive in the past two to five years in providing funds tocommunities to update the Goal 9 section of their comprehensive plans.
Goal 12 refers to “transportation” as the movement of people and goods, and it is directed at all modes includingport facilities, airports, railroads, and regional pipelines. The rule requires jurisdictions to prepare transportationsystems plans (TSPs) that are composed of transportation system planning and transportation projectdevelopment. Local jurisdictions must coordinate with their local ports as part of developing or updating TSPs.
Goal 15 sets forth procedures for administering the 300 miles of greenway that protects the Willamette River, andincludes Portland Harbor, including terminals owned and operated by the Port of Portland.
Ports 2010: A New Strategic Business Plan for Oregon’s Ports 24
Goal 17 specifically identifies the need to conserve, protect, where appropriate, develop and where appropriaterestore the resources and benefits of all coastal shorelands. It is this goal that specifically identifies “waterdependent uses” in its statement: “Shorelands in urban and urbanizable areas and in rural areas built upon orirrevocably committed to non-resource use especially suited for water dependent uses shall be protected for water-dependent recreational, commercial and industrial uses.” Goal 17, OAR 660.037-0010 Water–DependentShorelands, was created in August 2002 to recognize the significant economic changes experienced by coastalcommunities from the early 1980s to 2000. The water dependent shorelands that had been designated in estuaryplans in the early 1980s continued to remain vacant. As result, the term water-dependent use was morespecifically defined and a new formula was created for determining the amount of water dependent shoreland thatshould be protected by each community.
Department of Environmental Quality
The Oregon Department of Environmental Quality (DEQ) is committed to working closely with Oregon’s Ports toensure appropriate environmental protection measures and the economic goals of the ports are met. Thefollowing are key components of DEQ’s mission and operations as they relate to Oregon’s ports.
401 Certifications: Section 401 of the federal Clean Water Act requires that any federal license or permit toconduct an activity that may result in a discharge to waters of the United States must first receive a water qualitycertification from the state in which the activity will occur. This section of the Clean Water Act is a direct delegationfrom Congress to the States, and allows each state an opportunity to ensure that federally approved activities willmeet water quality standards and policies established by the state under the Clean Water Act. In Oregon, DEQ isthe agency responsible for reviewing proposed projects under this requirement. By ensuring a project does notdegrade water quality, Oregon’s waters remain safe for a wide range of uses, such as drinking water, recreation,fish habitat, aquatic life, and irrigation. DEQ’s 401 program staff evaluate project proposals for potential impacts towater quality and beneficial uses. Certifications may be: 1) issued for the project as proposed, 2) issued withconditions intended to eliminate or minimize impacts, or 3) denied. A proposal to remove material from, or placefill into, waters requires a Joint Permit Application submitted to both the US Army Corps of Engineers (USACE) andthe Department of State Lands (DSL). These agencies process the applications separately. DEQs 401 Water QualityCertification (WQC) process is triggered when USACE makes a determination that an application 1) requires apermit and 2) results in a discharge. All dredging projects in Oregon require a 401 certification. More informationcan be found at: http://www.deq.state.or.us/wq/sec401cert/removalfill.htm.

Ports 2010: A New Strategic Business Plan for Oregon’s Ports 25
Water Quality permits: a DEQ water quality permit is required whenever there is a discharge of pollutants towaters of the state or to the ground. Waters of the state include surface waters (wetlands, pond, lakes, streams,rivers, etc.) and groundwater. Permits are required for discharges of wastewater (sewage, processing water, etc.),wash water, and even for wastewater that may be relatively clean, such as non-contact cooling water. Thesedischarges may occur through a variety of disposal systems including land irrigation, seepage ponds, onsitesewage systems, dry wells, etc., or may discharge to surface water directly through a pipe or ditch or indirectlythrough a storm sewer system. Certain industries and activities may also be required to obtain permits forstormwater runoff from their properties. Depending on activities occurring at Oregon’s ports, water quality permitsmay be required. More information regarding DEQ’s permit program and requirements can be found at:http://www.deq.state.or.us/wq/wqpermit/permits.htm. Regulations administered by DEQ’s Land Quality Divisionthat apply to port facilities include requirements for reporting and cleanup of spills of oil and hazardous materials.In addition to the planning for and responding to accidental spills from the Port’s own operations, port personnelcan often serve as the eyes and ears in the maritime environment to ensure good environmental stewardship forreporting and rapid response to small and large spills including “mystery sheens.” DEQ appreciates the efforts of allparties to prevent and respond effectively to spills.
DEQ’s Land Quality programs also manage regulations pertaining to: management of hazardous waste;investigation and cleanup of hazardous substance releases; underground storage tanks; solid waste, includingupland placement of dredged sediments as solid waste; spill response planning; and ballast water management.For additional information on these and other Land Quality program regulations, please see:http://www.deq.state.or.us/pubs/factsheets.htm#LQ. The following is a summary of the programs and primaryregulations.
Solid Waste (ORS 459, and OAR 340-093): solid waste regulations prescribe requirements, limitations, andprocedures for storage, collection, transportation, treatment, and disposal of solid waste.
Hazardous Waste (ORS 465 and 466, and OAR 340-100): these laws establish a regulatory structure for thegeneration, transportation, treatment, storage and disposal of hazardous wastes. The Hazardous Waste Programpromotes reduction of hazardous waste generation and toxics use, and provides oversight of the management anddisposal of hazardous waste.

Ports 2010: A New Strategic Business Plan for Oregon’s Ports 26
Underground Storage Tanks (UST: ORS 465 and 466, and OAR 340-150): the UST Programs ensure thatunderground storage tanks containing petroleum or hazardous substances are properly operated to prevent leaks,and oversees cleanup of petroleum tank releases to protect public health, safety, welfare and the environment.
Invasive Species/Ballast Water Requirements (ORS 783, and OAR 340-143): Oregon’s ballast water regulationsrequire the reporting of ballast water management practices and prohibits the discharge of ballast water into statewaters except under specified conditions. In most cases, vessels transiting into Oregon waters must complete anopen ocean exchange of ballast water prior to discharge of ballast water into state waters.
Environmental Cleanup (ORS 465, and OAR 340-122): the environmental cleanup laws address the release ofhazardous substances. They require documentation of confirmed releases and additional investigation, removal,remedial action or long-term environmental controls or institutional controls. These laws set standards for degreeof cleanup required and for the selection of a remedial action.
Emergency Response and Preparedness (ORS 459, 466, and OAR 340-142): the Emergency Response Programensures that new releases of oil and hazardous materials, including those caused by terrorist events and naturaldisasters, are contained and cleaned up. DEQ focuses on prevention and preparedness activities to minimize theeffects of releases. DEQ regularly works with industry representatives and federal on scene coordinators to planfor and respond to major spills.
Oregon State Marine Board
The Oregon State Marine Board (OSMB) is Oregon’s recreational boating agency, dedicated to safety, educationand access while protecting the environment. OSMB provides grants and engineering services to localgovernments (cities, counties, park districts, and port districts) to develop and maintain accessible boating facilitiesand protect water quality. The ports typically rely on OSMB to provide preliminary engineering and funding forrelated capital improvement projects, especially for launch ramps, boarding floats, transient tie-up, restrooms, andother boating amenities.
Ports 2010: A New Strategic Business Plan for Oregon’s Ports 27
Intergovernmental Cooperation Agreements
Port districts engage in economic development, and as such, they compete on behalf of their communities toattract new business opportunities to their respective regions. At the same time, many ports understand thatachieving success in these competitive situations often requires discovering and formalizing areas of mutualinterest with competitors. Two examples of intergovernmental cooperation agreements (IGCA) are:
In order to achieve their mutual goals of deepening the federal navigation channel within the Columbia River,the Port of Portland joined four Washington State port districts in signing a cooperative agreement with the USArmy Corps of Engineers (USACE). The agreement provides detailed definitions of terms, obligations for theparties, and a general description of funding expectations. The ultimate result is a document that helps achievethe ports’ goals for Columbia River dredging improvements while also accomplishing certain goals of state andfederal for ecosystem restoration.
Ports of Portland and Vancouver USA Cooperative Agreement: Since the early 1990s, the Port of Portland andthe Port of Vancouver USA (Washington) have worked diligently, through the evolution of several agreements(the latest beginning in 2004), to find and develop avenues for mutual cooperation. These two ports, who arecompetitors in a number of cargo and development markets, are separated by a state border and share thesame metropolitan labor force that, in turn, reap benefits from the job-creation activities of either port district.The agreement’s stated purpose is simple and direct: “to promote cooperation through openness and jointaction.” The suggested areas of cooperation are primarily joint marketing and joint pursuit of facilitydevelopment, together with formulae for cost sharing and revenue sharing. The document names the expectedstaff participants, requires regular periodic meetings of the parties, requires setting of mutual goals, prioritiesand strategies for action, but also provides an easy termination clause.
B. Federal Statutes and RegulationsThe following is a brief summary of federal statutes and regulations which affect Oregon’s port system. All ofthese regulations are applicable to Oregon’s ports, especially where federal funding is being sought or used, andare indicative of the highly regulated environment and responsibilities ports operate within, as well as indicatingthat ports would benefit from more support from the state.

Ports 2010: A New Strategic Business Plan for Oregon’s Ports 28
National Environmental Policy Act
The National Environmental Policy Act (NEPA) process consists of an evaluation of the environmental effects of afederal undertaking including assessment of alternatives to the proposed project. The NEPA process is triggeredwhen federal funds are to be used or may be used in project implementation, or where federal actions orcoordination such as wetlands permitting are included. Since federal funding is available to ports for cargo,recreational, transportation access, or marine facilities, ports are more frequently becoming involved in the NEPAprocess.
There are three levels of NEPA analysis depending on whether or not an undertaking could significantly affect theenvironment: categorical exclusion (CE) determination; preparation of an environmental assessment/finding of nosignificant impact (EA/FONSI); and preparation of an environmental impact statement (EIS). The NEPA processcan take anywhere from a few months (CE) up to several years (EIS), which will need to be factored into theproject’s timeline and budget.
For rail and highway projects requiring NEPA, project sponsors can utilize ODOT’s Collaborative Environmental andTransportation Agreement for Streamlining to expedite state and federal resource agency review of a project andthe environmental analysis and documentation. Ports, however, have historically not utilized this process and havetypically navigated the NEPA process on their own.
Merchant Marine (and Related) Acts
The Merchant Marine Act of 1920 is a United States Federal statute that regulates maritime commerce in U.S.waters and between U.S. ports. A section of the Act, Section 27, also known as the Jones Act, deals with coastalshipping and directly affects the consideration of “short sea shipping” among Oregon’s ports (and elsewhere in theUS). It requires that all goods transported by water between U.S. ports be carried in U.S.-flag ships, built in theUnited States, owned by U.S. citizens, and crewed wholly by U.S. citizens. The purpose of the law is to support theU.S. merchant marine industry; however, agricultural interests generally oppose it because, they contend, it raisesthe cost of shipping their goods, making them less competitive with foreign sources. There are amendments to theJones Act, known as the Cargo Preference Act, which provide permanent legislation for the transportation ofwaterborne cargoes in U.S.-flag vessels.

Ports 2010: A New Strategic Business Plan for Oregon’s Ports 29
Rivers and Harbors Act
The geographic jurisdiction of the Rivers and Harbors Act of 1899 includes all navigable waters of the United Stateswhich are defined (33 CFR Part 329) as, "those waters that are subject to the ebb and flow of the tide and/or arepresently used, or have been used in the past, or may be susceptible to use to transport interstate or foreigncommerce." This jurisdiction extends seaward to include all ocean waters within a zone three nautical miles fromthe coast line (the "territorial seas"). Limited authorities extend across the outer continental shelf for artificialislands, installations and other devices (see 43 U.S.C. 333 (e)). Activities requiring permits under Section 10 of theRivers and Harbors Act include structures (e.g., piers, wharfs, breakwaters, bulkheads, jetties, weirs, transmissionlines) and work such as dredging or disposal of dredged material, or excavation, filling, or other modifications tothe navigable waters of the United States. Ports with marine waterways that fall under this Act are considered theshepherds of that waterway (which essentially applies to all of Oregon’s ports), and are responsible for funding orseeking state or federal funding assistance for activities to ensure continued navigation of those waterways.
Clean Water Act
The Clean Water Act defines "navigable waters" as "waters of the United States, including the territorial seas."Thus, jurisdiction under Section 404 of the Clean Water Act is defined as encompassing waters regulated bySection 10 of the Rivers and Harbors Act plus their tributaries and adjacent wetlands and isolated waters wherethe use, degradation or destruction of such waters could affect interstate or foreign commerce.
Activities requiring Section 404 permits are limited to discharges of dredged or fill materials into the waters of theUnited States. These discharges include return water from dredged material disposed of on the upland andgenerally any fill material (e.g., rock, sand, dirt) used to construct land for site development, roadways, erosionprotection, etc. Since ports are located along coastal and river waterways, complying with this Act is critical forports.
Marine Protection Research and Sanctuaries Act
The geographic scope of Section 103 of the Marine Protection Research and Sanctuaries Act of 1972 is thosewaters of the open seas lying seaward of the baseline from which the territorial sea is measured. Along coast lines
Ports 2010: A New Strategic Business Plan for Oregon’s Ports 30
this baseline is generally taken to be the low water line. Thus, there is jurisdiction overlap with the Clean WaterAct. By interagency agreement with the US Environmental Protection Agency, the discharge of dredged material inthe territorial seas is regulated under the Section 103 criteria rather than those developed for Section 404. As withthe Clean Water Act, ports must comply with this Act for navigation, dredging, water runoff, and other marineactivities.
Other Federal Legislation
There are a number of other federal regulations with which each port’s operations must comply; a sample is listedbelow:
Captain of the Port, 50 U.S.C. 191.Coastal Zone Management Act (administered by NOAA)Deepwater Ports Act, 33 U.S.C. 1501, 1502;Eastern Pacific Tuna Fishing Act, 16 U.S.C. 972;Harbor Maintenance Tax (HMT): As a result of the 1986 Water Resources Development Act, users of federalnavigation channels pay an ad valorum tax (currently 0.125 percent on export and domestic goods moved) intoa trust fund to provide a source of non-federal revenue to perform maintenance dredging.Longshore Workers Compensation, 33 U.S.C. 902;Magnuson Fishery Conservation and Management Act, 16 U.S.C. 1802;Marine Mammal Protection Act, 16 U.S.C. 1362;Maritime Transportation Security Act of 2002 (MTSA)Ports and Waterways Safety Act, 33 U.S.C. 1223;Security and Accountability For Every Port Act of 2006 (SAFE Port Act) and 9/11 Recommendations Act of 2007:the SAFE Port Act codified into law a number of programs to improve security of US ports, such as additionalrequirements for maritime facilities, creation of the Transportation Worker Identification Credential (TWIC)System, establishment of interagency operational centers for port security, the port security grant program, theContainer Security Initiative (CSI), foreign port assessments, and Customs-Trade Partnership Against Terrorism(C-TPAT). In addition, the SAFE Port Act created the Domestic Nuclear Detection Office within the Departmentof Homeland Security and appropriated funds toward the Integrated Deepwater System Program, a long-termUS Coast Guard modernization program.
Ports 2010: A New Strategic Business Plan for Oregon’s Ports 31
Shore Protection from Municipal or Commercial Waste, 33 U.S.C. 2601;Superfund, 42 U.S.C. 9601;Tribal treaties and federal regulations involving Native American tribal fishing rights.
C. Recent Regulatory IssuesBackground research conducted for this strategic plan revealed recent examples of instances where regulationsunder various programs conflicted with another:
The Port of Newport is attempting to reconstruct a cargo dock at the request of the USACE and is experiencingenvironmental regulatory and permitting issues under state and federal environmental regulations.The Port of Arlington at one time had a USACE permit to begin construction of a new, waste off-loading andcargo dock east of Arlington. USACE put the permit on hold after construction was initiated due to a tribalhistoric fishing site claim, and the case is now in litigation.The Port of Portland is attempting to plan for and develop a marine industrial terminal on West Hayden Islandbut is experiencing delays within the local planning process.Based on prior agreements and practice, ships sailing the Pacific Ocean and calling into Oregon’s ColumbiaRiver ports must utilize “double piloting.” The captain of the international leg of the trip must yield commandto a captain who pilots through the “bar” (such as the Columbia Bar offshore from the mouth of the ColumbiaRiver), who then yields command to another captain that pilots the vessel upriver.
The State of Oregon has a Pilotage Commission that controls the rates charged by the three pilot associationsin Oregon. The ports’ concern is the high percentage of vessel entry and berthing costs for pilotage fees whencompared to the total cost of bringing a vessel into port. For example- Coos Bay’s pilotage fees are 55 percentof the total costs associated with bringing a vessel to berth. All three associations are currently seeking to raisetheir rates, and the ports have requested some level of relief from these increased costs as a competitivenessissue.

Ports 2010: A New Strategic Business Plan for Oregon’s Ports 32
D. Oregon’s Port GovernanceOregon’s state port’s program is currently housed in the Infrastructure Finance division of OBDD (previouslyOECDD), and has been within this department since 1973. Between 1969 and 1973, the state port governancestructure consisted of a ports commission under ODOT.
Since 1973, there have been a number of discussions and requests to transfer the state Ports Program back intoODOT, but none of these efforts have resulted in that transfer. This strategic plan process also was charged withexamining the relationship of the Ports Program to the different state agencies and making recommendations onwhether the current institutional organization should be changed.
Currently some agencies within state government administer programs in which the ports play a role. Theseinclude:
ODOT: ODOT administers the ConnectOregon funding program, for which ports are eligible to apply. ODOTalso administers and staffs the Oregon Freight Advisory Committee, which is charged under state statute withadvising ODOT on multimodal freight issues and planning.OSMB: OSMB is charged with statewide capital facilities planning and funding programs for boatlaunches/ramps, marinas, and water-based law enforcement. Ports which operate these functions mustcoordinate with OSMB, and often use Board funding for rehabilitation, reconstruction, or new facilities.NEPA: Unlike its neighbors Washington and California, the State of Oregon does not have an environmentalpolicy act. Therefore, any process which triggers NEPA requires the lead agency (the port in this case) tocoordinate with and obtain reviews and permitting from appropriate local, state, and federal resource agencies.
Oregon’s ports work for advocacy and support through OPPA, a chapter of Special Districts Association ofOregon headquartered in Salem, and the Pacific Northwest Waterways Association (PNWA). OPPA is supportedthrough member dues and is affiliated with the Special Districts Association of Oregon (SDAO) for duescollection, office space, and insurance.
E. Port Governance and Oversight Examples from Other StatesVirtually all ports in the United States were established under state legislative authority in the early 1900s for thespecific economic benefit of the region to be served by the port. In the early 1900s most “ports” were in the

Ports 2010: A New Strategic Business Plan for Oregon’s Ports 33
middle of a city, and vessels went from port to port delivering local cargo and passengers, thus competition amongports was not as prevalent then as it is today. During the 1930s and up to World War II, the majority of portauthorities in the United States were given charters to conduct international commerce activities via the sea and, inaddition, to develop a regional economic base of activity that included industrial land development, economicenterprises, and with the popularity of aviation travel, airport jurisdiction. Several ports were also given theauthority and responsibility to manage public transit, bridges and other transportation infrastructure.
Port governance is rapidly becoming a major topic of discussion for all west coast port authorities and statelegislatures. The Washington and California legislatures have been considering bills that would substantially revisegovernance of the port system in those states. The recent discussions of port governance are due to acombination of the current state of the national and regional economies as well as the lack of available funds tosupport port growth and capacity expansion. Also playing into these discussions is the subject of portconsolidation.
The state legislatures of California and Washington have very recently introduced bills in their respective bodiesthat call for a state port authority or, lacking that entity, a regional port authority by combining the administrativebodies of local ports into a common and more centralized functional body. The prime reason given is the coststructure of a separate entity and the perceived duplicative nature of the functions required by neighboring butcompeting ports. The focus in this effort is also the reduction of the competitiveness where the public perceivesthat one port is always attempting to “steal” customers away from their local competing port authority.
Washington StateWashington’s 75 port districts are independent county-authorized public entities, authorized by state law in 1911. Anumber of the districts are “dry” or land-based ports. In Washington state government, the port program isadministered by the Washington State Department of Transportation (WSDOT). There is no port-related programwithin the Washington State Department of Commerce, which is Washington’s equivalent of OBDD.
Compared to Oregon’s ports, Washington ports are relatively well funded. As is the case with Oregon ports,Washington ports can levy property taxes, but are allowed to assess a much higher rate, up to 45 cents per $1,000of appraised value under Washington state law. This larger tax base enables Washington ports to provide a goodlevel of funding toward the Washington Public Ports Association, enabling that entity to offer a wide variety oftraining, data collection, and analytical studies.
Ports 2010: A New Strategic Business Plan for Oregon’s Ports 34
Port districts in Washington are governed by an elected commission, independent of other local jurisdictions,including cities, counties, and the state. Commissioners are elected to either four- or six-year terms. The Ports ofSeattle and Tacoma have five commission members whom each hold office for four years. The other 73 portdistricts have three members with a term of six years. Commissioners may hold either district-specific or at-largepositions, depending on port district policy. Port commissioners establish long-term strategies for a port district,and create policies to guide the development, growth, and operation of the port. They are also responsible formanaging their port's annual budget, approving tax levy rates, and hiring the professional staff membersresponsible for the port's daily functions. Advocacy, coordination, and training are provided through theWashington Public Ports Association (WPPA), which includes 69 of the state’s 75 port districts. The WPPA wascreated by the State Legislature in 1961 to promote the interests of the port community through effectivegovernment relations, ongoing education, and strong advocacy programs. It has a full time staff of seven and hasrecently completed several major studies for its members and the State Legislatures such as the 2009 State MarineCargo Forecast, the State Rail Capacity Study (with WSDOT), and key legislative policy reports.
California
The California Association of Port Authorities (CAPA) was formed in 1940 to promote the interests of California’sports and to maintain the state’s role in the global maritime industry. CAPA is comprised of the state’s 11 publicly-owned, commercial ports: the Humboldt Bay Harbor District, the Port of Hueneme, the Port of Long Beach, thePort of Los Angeles, the Port of Oakland, the Port of Redwood City, the Port of Richmond, the Port of Sacramento,the Port of San Diego, the Port of San Francisco, and the Port of Stockton. CAPA members are all public agenciesand each is organized and managed independently.
Five of California’s ports are special districts, and six are departments of their respective host-cities; each isgoverned by a separate board of commissioners responsible for setting policy and managing port operations.Commissioners are either appointed by local jurisdictions or in some cases, directly-elected. Most of California’sports manage state tidelands on behalf of all Californians through agreements with the State Lands Commission.Subject to specific direction contained in each agreement, tideland properties and resources must be used formaritime purposes, including navigation, fisheries and commerce.
As with Washington, California’s ports are better funded through tax base and harbor fees than Oregon’s ports.
Ports 2010: A New Strategic Business Plan for Oregon’s Ports 35
On behalf of its members, CAPA maintains an association office in Sacramento with about eight full time staff whoprimarily manage the governmental relations with California’s legislative and administrative branches of stategovernment. CAPA monitors legislative and regulatory proposals related to goods movement and the maritimecommunity and provides educational leadership and advocacy on issues relating to transportation, trade, theenvironment and other subjects relevant to port operations. In addition, CAPA maintains formal agreements onbehalf of its member ports with the Federal Maritime Commission (FMC) and provides regular communication withthe FMC and other national interests.
Canada
After the Canada Maritime Act of 1996 came into force, letters of patent (the official grants of authority) wereissued for 19 “Canada Port Authorities” (CPA); that number was reduced to 17 in 2008, with the amalgamation ofthe Vancouver, Fraser River and North Fraser port authorities into a single entity, the Vancouver Fraser River PortAuthority (also known as Port Metro Vancouver).
Under the law, a CPA is a federal entity or, more precisely, “an agent of the Crown for port activities related toshipping, navigation, the transportation of passengers and goods and the storage of goods to the extent that theseare specified in the letters patent.” CPAs may engage in “other activities deemed in the letters patent to benecessary to support port operations” but only with the prior approval of the federal government before letters ofpatent are issued. Unlike many of their US counterparts, they may not engage in activity unrelated to theirmaritime functions such as airport, rail, or toll bridge operations. Other activities not expressly covered by theletters patent are subject to taxation in the same way that they would be if the port authorities were privatecorporations.
The CPAs are also required to be financially self sufficient and “no recourse to the federal treasury to discharge anyobligation or liability of the port authority, with the exception of payments provided under legislation coveringemergencies (e.g. disaster relief assistance) or other grant programs that apply generally to other companies andinstitutions.” Port authority borrowing for port purposes may be obtained from private-sector lenders, based on theCPAs future revenues. The Canadian Government will not guarantee such loans, and a CPA is not able to borrowmoney as an agent of the federal government.
Ports 2010: A New Strategic Business Plan for Oregon’s Ports 36
Each CPA must pay an annual charge to the Crown based on a formula that would be included in its letters patent.Surpluses at each port may not be distributed, since there are no shareholders, but may be re-invested in theports. For the purpose of operating the port, a CPA is permitted to lease or license any federal real property that itmanages, subject to the limits specified in its letters patent. CPA governing boards consist of seven to 11 directorswho "shall have generally acknowledged and accepted stature within the transportation industry or the businesscommunity and relevant knowledge and extensive experience related to the management of a business, to theoperation of a port or to maritime trade."
CPAs are also held to rigorous disclosure requirements. Additionally, federal law requires compliance with openmeetings regulations, financial statements, disclosure of any conflicts of interest as well as remuneration andexpenses of board members, chief executive officers, and employees whose remuneration exceeds a prescribedthreshold, disclosure of details of port income and operating expenses, and adoption of a public land use plan.Every year, CPAs must also submit a five-year business plan to the Minister of Transportation in each province.
Other States
Alabama: the Alabama State Port Authority owns and operates the Alabama State Docks in Mobile, the state’sonly cargo port. State funding is based on the state’s legislatively-approved budget.Florida: Florida’s seaports are represented by a trade association known as the Florida Ports Council (FPC). TheFPC is made up of port directors from the 14 seaports, the executive director of the Office of Tourism, Trade,and Economic Development, and the State Secretaries of Transportation and Community Affairs. The FPC doesnot provide funding for port capital projects; instead, ports compete for funding through the Florida SeaportTransportation and Economic Development Council (an average of $15 million annually in grants and $10million annually in loans and bond guarantees), Florida Department of Transportation’s Strategic IntermodalSystem, and federal transportation funding through regional planning bodies.Hawaii: the Hawaii DOT Harbors Division, otherwise known as “Port Hawaii”, operates ten commercial ports onsix major Hawaiian islands: Oahu, Maui, Molokai, Lanai, Hawaii (the Big Island), and Kauai. Port charges arepaid to the Harbors Division which forms the basis for most of the state ports funding. Port Hawaii alsogoverns the 24-hour per day pilotage into and out of Hawaii’s harbors.Indiana: the quasi-public entity, Ports of Indiana (formerly the Indiana Port Commission), created in 1961,owns and operates its three ports - one on Lake Michigan and two on the Ohio River. Ports of Indiana is run by
Ports 2010: A New Strategic Business Plan for Oregon’s Ports 37
a seven-member commission, and each port operates as a cost center and is a regional taxing authority.Louisiana: administrative oversight of ports and harbors falls under the Louisiana Department ofTransportation and Development’s (LDOTD) Ports and Flood Control Unit. The trade association is the PortsAssociation of Louisiana, which is funded by its members on a level similar to the WPPA. LDOTD providesfunding on a needs- and priority basis through the Port Construction & Development Priority Program, whichaverages approximately $37 million per year.10Mississippi: oversight of Mississippi’s 16 commercial ports is split between the Mississippi DevelopmentAuthority and the Mississippi Department of Transportation. The State of Mississippi owns two ports while theother 14 are local port districts. There is no dedicated state funding source for ports; ports must compete forfederal funding programs through state and regional programs with transportation agencies.South Carolina: The South Carolina Ports Authority is a state port authority that operates terminals at twoseaports, Charleston and Georgetown. Funding is through tariffs and other fees, and the state budget processfor capital projects.Texas: administrative assistance to Texas’ 16 ports falls under the Texas Strategic Economic DevelopmentPlanning Commission for administrative assistance and planning. The Texas Port Association is their equivalentto OPPA; very little state funding is allocated to Texas’ ports.Port Authority of New York/New Jersey is one of the few bi-state port authorities and operates throughinterstate agreements.
10 Information from “Five Year Capital Improvement Plan 2007-2011”, Shaw Environmental and Infrastructure for Ports Association of Louisiana, January 2007.

Ports 2010: A New Strategic Business Plan for Oregon’s Ports 38
How Oregon’s Institutional Structure Compares
F. The Comparison to OregonRanked on a scale of low governance (little or no state oversight or administration of port functions) to highgovernance (state ownership or strong state port or harbor commissions), Oregon’s current port governancestructure falls a little below average.

Ports 2010: A New Strategic Business Plan for Oregon’s Ports 39
G. Current Port Funding and Finance StructureThe following summarizes key local, state and federal funding sources available to ports. A more detailedsummary of the funding sources can be found in Appendix B.
1. Local
Oregon’s ports are allowed to assess property taxes under Oregon statute. Taxes are collected locally;there is no state “Port tax”. Port district rates ($ tax per $1,000 of assessed value) range from $0.0256 inCascade Locks to $0.6119 in Coos Bay. According to the Port Audits summary, the average rate for the 23port districts is approximately $0.18. When factoring in local bond issues, which are assessed on top of theannual property tax, rates range from $0.0256 in Cascade Locks to a high of $0.8738 in Port Orford.Property tax revenues tend to account for less than half of port revenue in most instances.
In addition, the Ports of Cascade Locks and Hood River own and operate toll bridges and realize asubstantial portion of their annual revenues from bridge toll receipts. Most ports receive revenue fromtenant/user fees, leasing and sales of property, which tend to form the majority of operating revenue.
2. StateOn the infrastructure funding side, there are a number of state programs that provide funding to ports:
ConnectOregon: this is a biennial program which funds projects that promote job creation and retention,access to Oregon’s key industries, and economic growth. Marine, air, and rail projects are eligible for thesefunds, but highway projects are not. There is currently $100 million available in ConnectOregon III from theLottery Fund for the 2009-2011 biennium. Rankings are recommended by a variety of modal and economicdevelopment advisory groups, and funding targets are based on geography; the Oregon TransportationCommission approves the list of projects to be funded. During the first two rounds of ConnectOregon, ports ortheir partners (private rail or terminal operators) received funding for approximately one-third of the program’stotal awarded projects.
Ports 2010: A New Strategic Business Plan for Oregon’s Ports 40
OSMB: OSMB is funded entirely through fees and penalties; it does not receive funding from the General Fund.The Boating Facilities program has developed a six-year capital facilities plan. The current planning period is(2005-2011) and uses the six-year plan to allocate Boating Facility Grants. There is approximately $5 millionper biennium available in this program. These grants, for which ports are eligible, are funds available togovernmental agencies for acquisition and construction of public recreational motorized boating facilities, suchas: boat ramps, boarding floats, restrooms, access roads, parking areas, transient tie-up docks, dredging andsigns. Project sponsors must provide a 25% match. The six-year plan also provides guidance to the OregonDepartment of Fish and Wildlife (ODFW) in allocating federal Sport Fish Restoration funds for motor boataccess. Port-sponsored projects account for seven of the 44 projects (approximately 16 percent) awardedfunding in the 2009-2011 biennium.
Marine Navigation Improvement Fund (MNIF): this port loan and grant financing program providesfunding for federally authorized projects that need matching funds and non-federally authorized projects thatdirectly support or access an authorized navigation improvement project. Only ports incorporated under ORS777 or 778 are eligible. Funding for projects is limited to money set aside by the Oregon State Legislature.Federally authorized projects include projects designed and operated by the USACE and must be authorized byCongress. They must be large enough to have a positive national cost/benefit ratio and be sponsored by a portand listed in the port's business or strategic plan. Non-federally authorized projects are smaller and cannotqualify for federal assistance. Proposed projects must support a certain level of commercial or recreationalactivity in order to qualify for state funding; meet the criteria of a freight project or a commercial/recreationproject; be a new water project that directly supports, or provides access to, a federally authorized navigationimprovement or navigation channel project; be ready to begin in the biennium in which funding is requested;and be listed in a port's business or strategic plan. Ports must secure, and be able to provide upon request, aland use compatibility statement from the appropriate jurisdiction(s) where the project is located and mustmeet at least one of the criteria as established by the Oregon State Legislature. In 2003, the OregonLegislative Assembly approved $3.5 million in funding for non-federally authorized projects.
Port Revolving Fund: this loan program assists Oregon ports in the planning and construction of facilities andinfrastructure. Any port incorporated under ORS 777 or 778 may apply for funding, although each applicant islimited to a total loan amount from this fund of no more than $3 million at any one time. To be eligible forfunding, the port must demonstrate that the proposed project is needed, feasible, a reasonable risk from a
Ports 2010: A New Strategic Business Plan for Oregon’s Ports 41
practical and economic standpoint, has received all necessary permits required by federal, state or localagencies, and the applicant's financial resources are adequate to provide the working capital needed to ensuresuccess of the project and the loan has a reasonable prospect for repayment. Funds may be used for portdevelopment projects (facilities or infrastructure) or to assist port-related private business developmentprojects.
Port Planning and Marketing Fund: this program (primarily grants) helps ports fund planning or marketingstudies related to expanding their trade and commerce activities. This includes developing and marketingfacilities and services that support important industries in the state, including: agriculture, aviation, fishing,maritime commerce, transportation, tourism/recreation, and wood products. Any port incorporated under ORS777 or 778 may apply for funding. Grants are capped at $50,000 or 75 percent of the total cost of the project,whichever is less, and a 25 percent local cash match is required for all projects. Half of the funds availableannually in the Port Planning and Marketing Fund are reserved for high-priority projects. These funds arereserved for the first four months of the state fiscal year, after which any remaining funds may be madeavailable for other eligible projects. To be eligible, projects must: enhance the port's ability to conduct tradeand commerce; lead to economic diversification, development of new or emerging industry, or redevelopmentof existing public facilities; be consistent with any applicable county or city comprehensive planning; notunnecessarily duplicate the marketing efforts among ports; not be used to subsidize regular port operatingexpenses; and not require or rely on continuing subsidies from the Infrastructure Finance Authority (IFA).These funds are considered as a good source for updates to port strategic business plans, capital facilitiesplans, and economic/market studies for consideration of a new or expanded business opportunity.
Special Public Works Fund: loan and grant assistance to eligible public entities for the construction of publicwater and sewer systems, roads, rail lines, docks and airport facilities leading to business location or expansionand the creation or retention of jobs. Loans and a small amount of grant funds are also available to helpconstruct publicly-owned “community facilities.” Port districts are eligible. Infrastructure must be neededprimarily to support economic development, and 30 percent of jobs created or retained must be family wagejobs.
3. FederalPorts are eligible to submit applications for a number of federal funding programs. At this time, they aresubject to the same restrictions on use of funds that is placed on them by ODOT or the United StatesDepartment of Transportation (US DOT); other state-imposed conditions and restrictions (such as jobs retained
Ports 2010: A New Strategic Business Plan for Oregon’s Ports 42
or increased, financial ability to operate and maintain, and so forth) are typically not placed on ports applyingfor federal funds.
Federal programs include:
Surface Transportation: ports are eligible entities under a number of the traditional surface transportationprograms. In Oregon, federal funding is apportioned through a ranking and evaluation process under ODOT.The state is divided into five regions, and each region is responsible for ranking their federal transportationproject priorities through “Area Committees on Transportation”. Ports are eligible to participate in this process.Programs include Surface Transportation Program (all modes), Enhancement (typically bicycle and pedestrian),and Congestion Mitigation and Air Quality (only in designated air quality management areas, which is notstatewide).
American Recovery and Reinvestment Act of 2009 (ARRA): this act spawned a variety of fundingprograms totaling $787 billion in an effort to stem the economic recession that began in late 2007 andcontinued through 2009. Almost $81 billion was included for infrastructure investments through “CoreInvestments” (roads, bridges, railways, sewers, other transportation including ports), investment intogovernment facilities and vehicle fleets (including the USACE and the US Coast Guard), and supplementalinvestments. Ports applied for funds through the US DOT portion of the stimulus bill (through OregonTransportation Commission) as well as Transportation Investment Generating Economic Recovery (TIGER)funds which were submitted directly to the US DOT.
Federal Boating Dollars Clean Vessel Act Funds: these federal funds are distributed to TOSMB by the USFish and Wildlife Service based on a national competitive grant process. Because this is a national competition,there is no set funding amount. Eligible projects include boat waste collection facilities or components, such assigns, pumpouts, dump stations and related support facilities; projects which receive this funding must makethem free to the public (no charge for public use). Ports are eligible participants. Project sponsors mustprovide a 25 percent local match.
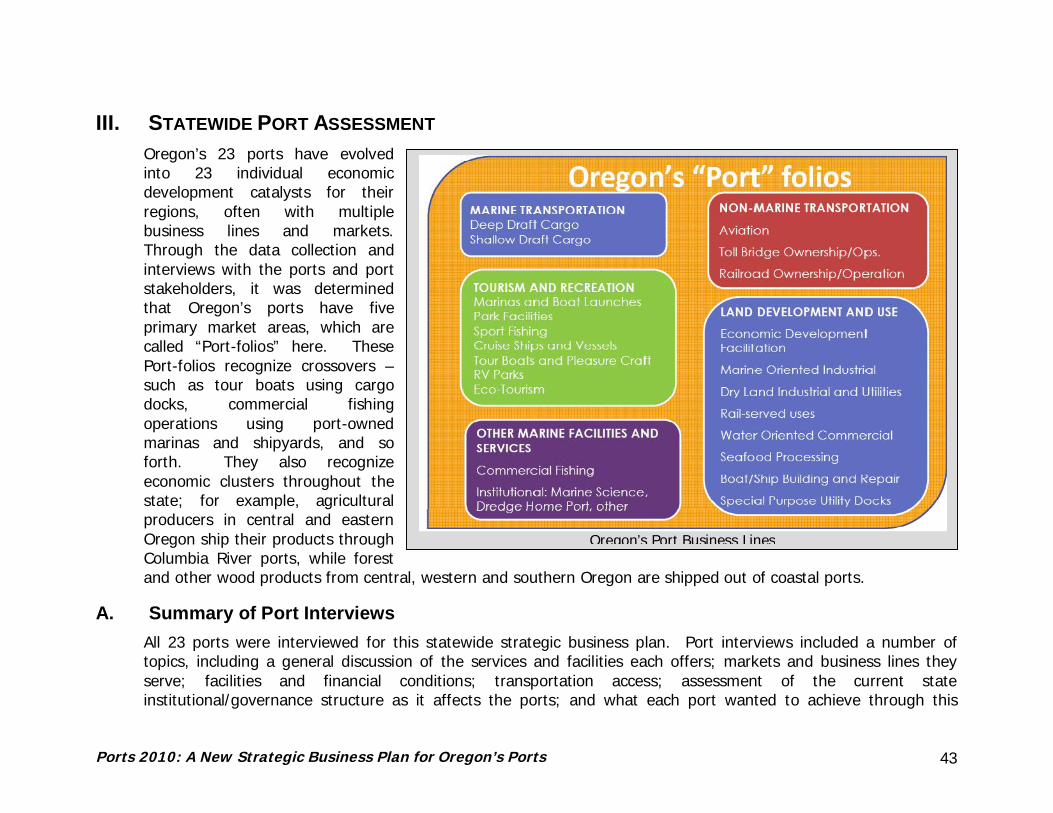
Ports 2010: A New Strategic Business Plan for Oregon’s Ports 43
Oregon’s Port Business Lines
III. STATEWIDE PORT ASSESSMENTOregon’s 23 ports have evolvedinto 23 individual economicdevelopment catalysts for theirregions, often with multiplebusiness lines and markets.Through the data collection andinterviews with the ports and portstakeholders, it was determinedthat Oregon’s ports have fiveprimary market areas, which arecalled “Port-folios” here. ThesePort-folios recognize crossovers –such as tour boats using cargodocks, commercial fishingoperations using port-ownedmarinas and shipyards, and soforth. They also recognizeeconomic clusters throughout thestate; for example, agriculturalproducers in central and easternOregon ship their products throughColumbia River ports, while forestand other wood products from central, western and southern Oregon are shipped out of coastal ports.
A. Summary of Port InterviewsAll 23 ports were interviewed for this statewide strategic business plan. Port interviews included a number oftopics, including a general discussion of the services and facilities each offers; markets and business lines theyserve; facilities and financial conditions; transportation access; assessment of the current stateinstitutional/governance structure as it affects the ports; and what each port wanted to achieve through this
Ports 2010: A New Strategic Business Plan for Oregon’s Ports 44
strategic planning effort. A Strengths, Weaknesses, Opportunities and Threats (SWOT) analysis was conductedwith each port focusing on the port and its relationship with the state. The following sections summarize the portinterviews and data collection.
1. Services and Condition of FacilitiesThe ports offered the following regarding the various services and condition of their facilities:
The Ports of Portland, Coos Bay, Umatilla, and Morrow are Oregon’s largest cargo ports by volume, basedon commodity flow surveys by ODOT, US DOT, and USACE.A number of cargo facilities/docks are in disrepair, especially those sold or leased to private entities thatno longer exist or whose market has changed.There is mixed resource and financial ability to continue maintenance dredging; a few ports also haveregulatory agency concerns regarding impacts to fish and where to place dredge material.Shipyards/boatyards and vessel repair facilities are found at the Ports of Astoria, Coos Bay, BrookingsHarbor, Toledo, and Umpqua. Grain elevators on port-owned land are found at Arlington, The Dalles,Portland, Umatilla, and Morrow.Facilities supporting commercial fishing are located in Astoria, Garibaldi, Newport, Siuslaw, Coos Bay, PortOrford, Brookings Harbor, and Winchester Bay (near Umpqua); most of the facilities are in need of somerepair or reconstruction, with the exception of Brookings Harbor, which has a new cold storage that isproviding a service to local fishing.The following ports operate airports: Astoria, Coquille River, Gold Beach, Hood River, Morrow, Portland, St.Helens, and Tillamook Bay.Cruise/tour boat calls occur at Astoria, Cascade Locks, Hood River (spring and summer at the Marina dock)and very occasionally Arlington and The Dalles.Toll bridges are owned and operated by the Ports of Cascade Locks (Bridge of the Gods) and Hood River(Hood River Bridge). The Bridge of the Gods is considered in good condition, while the Hood River Bridgeis being studied for replacement (it is currently narrow, and bicycles and pedestrians are prohibited fromusing it).
Oregon’s ports provide a variety of recreational facilities. All of Oregon’s ports own and/or operate marinasexcept for Coquille River, Nehalem, Tillamook Bay, Umpqua, Portland, and Morrow; Alsea leases its marina to aprivate operator. Ports owning and operating RV parks include Brookings Harbor, Garibaldi (which leases land to
Ports 2010: A New Strategic Business Plan for Oregon’s Ports 45
two private operators), Gold Beach, Siuslaw, Tillamook Bay, Newport, Arlington, Cascade Locks, and Umatilla.The Port of Hood River owns and maintains waterfront land which has, over time, been considered by the localcommunity as park land which makes it difficult to be developed for office or commercial uses.
All Oregon ports own land for industrial/business parks except Garibaldi. The Dalles, which has very little utility-serviced land remaining, is seeking funds to install infrastructure on 85 acres. Arlington owns some land that isnot yet developed as an industrial park. Most ports consider themselves to be economic drivers of theircommunities, including those ports with little or no land available for development, and many ports are theprimary owners of land available for economic development in their communities. The Port of Hood River hassold or developed much of its original supply of shovel-ready sites but still sees itself as an economicdevelopment driver within the community and is purchasing more industrial land for development.
The physical condition of port facilities is mixed statewide. There are a number of buildings, floating structures,piers, utilities, etc., within marinas, marine terminals, industrial parks, and airports in need of significant andcostly repair. Much of this work having been deferred over time due to lack of planning, prioritizing budgetrequests for maintenance funds, or simply lack of funds. In addition, several ports have inherited privately-operated facilities that were no longer operating and in substandard condition, but are critical to overall porthealth if brought up to useable and code compliant standards.
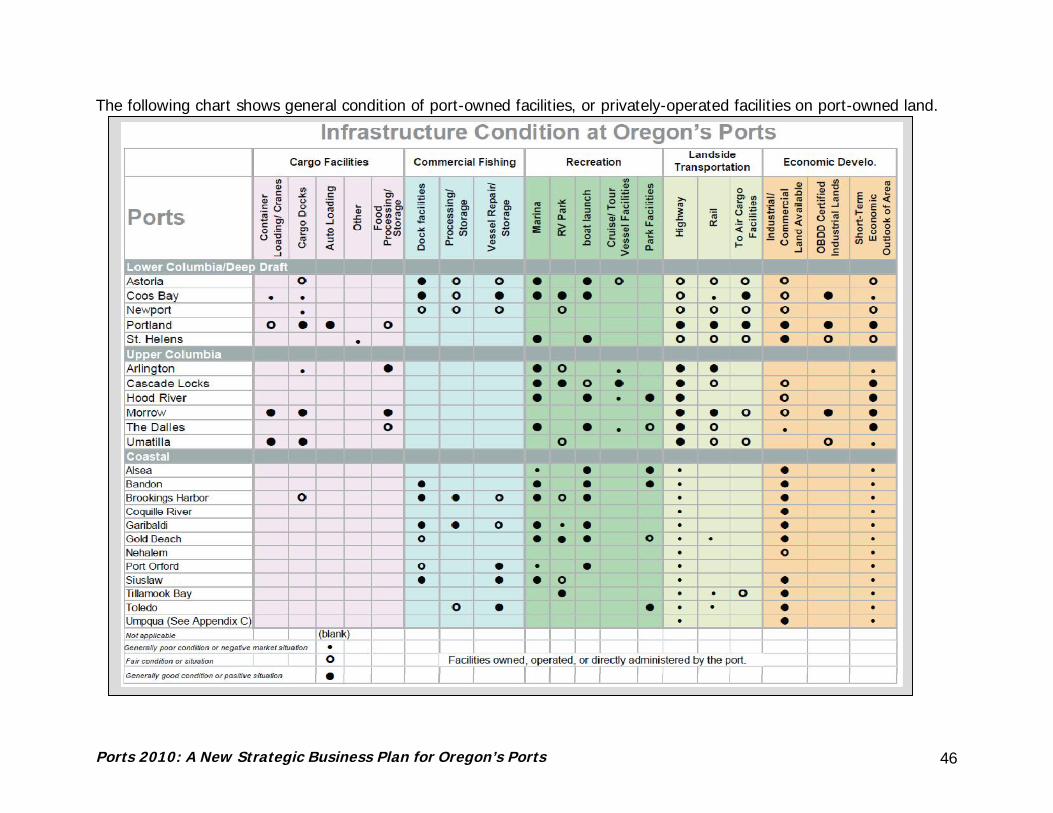
Ports 2010: A New Strategic Business Plan for Oregon’s Ports 46
The following chart shows general condition of port-owned facilities, or privately-operated facilities on port-owned land.

Ports 2010: A New Strategic Business Plan for Oregon’s Ports 47
The following chart summarizes current port market profiles and business opportunities based on the port interviews andmarket outlook.
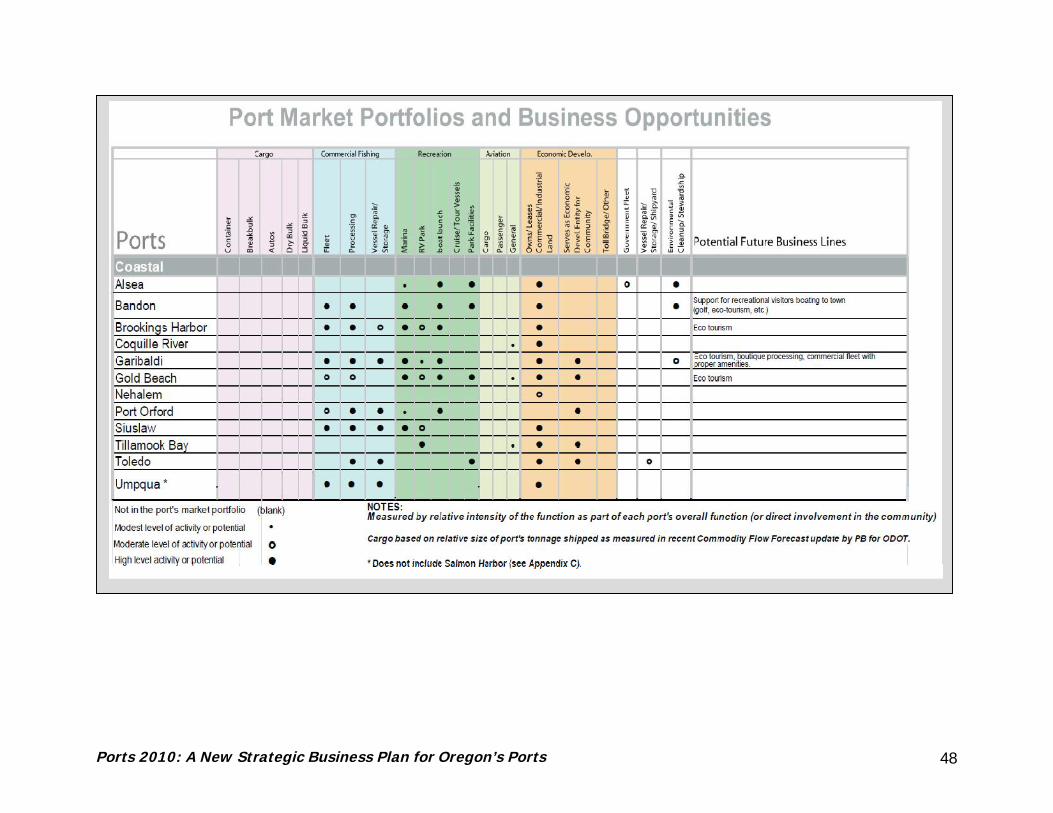
Ports 2010: A New Strategic Business Plan for Oregon’s Ports 48
Ports 2010: A New Strategic Business Plan for Oregon’s Ports 49
2. MarketsPortland has historically occupied a niche position in the container market, most often serving as an internationalgateway for goods produced in the Pacific Northwest region of Oregon, Southwest and Eastern Washington, andIdaho. At the same time, Seattle/Tacoma in the Pacific Northwest and Los Angeles/Long Beach in Californiaemerged as the dominant gateways for containerized imports to their respective regions and to the larger Midwestand East Coast intermodal markets. The reasons for Portland’s regional export role involve Portland’s inlandtransportation advantages for regional exports, its relatively small consumption market for imports, and itslimitations in terms of the Columbia River dredge depth and location 100 miles upriver from the ocean. Today, forPortland to expand its role into the broader national intermodal container market, the Port faces competition notonly from Seattle/Tacoma and Los Angeles/Long Beach, but also Vancouver and recently Prince Rupert in BritishColumbia, as well as emerging and potential gateways in Mexico.
Upriver ports have historically handled petroleum products inbound and grain and containers with export productsoutbound. There is now also a market for inbound containers filled with municipal solid waste.
Mineral bulks and automobiles remain a strong niche for the Port of Portland.
Oregon’s forest industry has changed and declined over time, affecting many of the coastal ports.
Energy is emerging as a substantial market for Oregon’s ports. Biofuels and wind energy components have beengrowing in the upriver region until the recent downturn. Wave energy as well as transport of energy componentsis becoming an emerging opportunity for Oregon’s coastal ports.
Grain markets have a substantial interaction between Oregon and Washington ports, as well as a relationship withthe BNSF and Union Pacific Railroads. While grain is important to Oregon’s economy and depends on thehighway, rail, and river system for transport, most grain elevators are privately owned. Competition from the newelevator in Longview may affect the Port of Portland, and the privately owned grain elevators along the ColumbiaRiver, but will likely have a negligible effect on the upriver ports and elevators. The BNSF short haul grain trainsmay have more of an effect in the long term if they develop additional facilities.

Ports 2010: A New Strategic Business Plan for Oregon’s Ports 50
“Eco Tourism” is becoming a substantial growth industry for ports along Oregon’s southern coast. Commercialfishing on Oregon’s southern coast fishing is declining, while the northern coast saw substantial increases in the1990s and is expected to continue to grow, although at a lower rate than the 1990s.
Coastal ports are considering the potential for short sea shipping, but there is mixed reaction in the marine cargoindustry about the viability of this market. Umatilla desires to develop a short-sea shipping connection withSeattle/Tacoma. Upper Columbia River ports are also competing with Washington state ports for the same short-sea shipping market in addition to new direct rail service to the East Coast for produce grown in Washington,which is transported through the Ports of Benton Harbor and Pasco.
3. Transportation AccessThe Ports of Astoria, Bandon and Newport do not consider themselves as navigationally constrained by channeldepth and navigability for their cargo markets. Those with constrained depths include Portland and Coos Bay,although the Columbia River Dredging project is nearing completion (improving the channel depth to at least 43feet), and Coos Bay plans to improve their existing channel depth to 50 feet. Umatilla and Arlington havenavigation challenges with the turning basins at their docks. Many of the ports need annual maintenance dredgingand, to fund it, must continue to seek federal assistance through Congressional apportionments.
At the present time, mainline rail access is available at the Ports of Portland, Morrow, Umatilla, and Arlington; andshortline access is located at Newport, Toledo, and Astoria. Coos Bay is in the process of reinstituting rail servicethat was discontinued in 2008, while Tillamook Bay has excursion rail service along the coast and freight service inWestern Washington County, but currently has published a freight embargo and applied for discontinuance ofservice for most of the line across the Coast Range. The remaining ports do not have readily-available rail service.
All Oregon ports have some type of highway access. Coastal ports all rely on Highway 101, with many requestingmobility improvements (passing lanes) on Highway 101, and Columbia River ports rely on Interstate 84 (I-84). Allports in the state rely on Interstate 5 (I-5) to some extent.
As noted above, the Ports of Astoria, Coquille River, Gold Beach, Hood River, Morrow, Portland, St. Helens, andTillamook Bay own and operate airports. Most others have airports within reasonable proximity.
Ports 2010: A New Strategic Business Plan for Oregon’s Ports 51
4. Financial ConditionOregon’s ports have mixed financial conditions. The economic downturn has worsened the overall financialsituation of most of the ports, as it has other government entities. Most of the ports are tapping cash reserves tofund operations, often with less than six months of reserves. Many ports have substantial deferred maintenanceand infrastructure improvement projects for a number of years because of lack of income. The combined port-identified infrastructure needs exceed $500 million, which include a number of jetty repair, marine facilitiesrehabilitation, dredging, and cargo dock reconstruction projects.
Ports that are generally in stable financial condition include Bandon, The Dalles, Hood River, Cascade Locks,Garibaldi, Morrow, Portland, Nehalem and Umpqua. Ports with possible cash flow issues include Coos Bay (due torailroad acquisition, offset by Liquefied Natural Gas or LNG development) and Astoria, while Brookings Harborsuffers from a high debt to asset ratio. Approximately two-thirds of Oregon’s ports are operating by using cashreserves, and a similar number are operating with less than six months of cash reserves. Deferred maintenance isa current concern, and likely an even greater future financial issue for many of the smaller, coastal ports.
For the ports that own and operate Marinas and RV Parks, there are mixed experiences with their financialcondition; there is an approximate even split between those that break even and those that lose money. Marinarates being charged are typically not sufficient to cover the cost of maintenance, operations, and replacement.
Industrial/business parks: most of the ports own land that they market for industrial or commercial development.There are a variety of policies or practices with regard to private parties developing on port-owned land; someports choose to sell the land to the developers, others choose to only lease land, while others make decisions on acase-by-case basis; cash flow is a consideration for these decisions. Some ports are running out of or have run outof port-owned land which may become a future cash-flow issue.
The toll bridges provide substantial amount of revenue for Cascade Locks and Hood River.
The Warm Springs Tribe Casino proposal in Cascade Locks currently generates revenue for the Port of CascadeLocks while the Tribe maintains an option on port-owned land.
Ports 2010: A New Strategic Business Plan for Oregon’s Ports 52
5. Capital Facilities Needs and Funding RequestsAs mentioned above, the total of the capital projects listed on the ports’ capital facilities plans exceeds $500million. A number of ports have pending or recent requests for federal stimulus funding (ARRA) submitted throughcongressional representatives with 25 requests totaling $58 million: Alsea, Bandon, Brookings Harbor, Gold Beach,Morrow, Port Orford, Siuslaw, Tillamook Bay, Toledo, Umpqua, Astoria, and Newport. The Port of Portland alsoseparately requested and received $8.9 million for renovation of Terminal 6 container docks. Astoria, Coos Bay,Morrow and Portland have applied for TIGER funding with total requests exceeding $100 million.
Ports have applied for ConnectOregon funding in the past and are expected to do so for the 2009-2011 biennium.OSMB has funded a number of marina improvements and some operations; it does not allow ports receiving fundsto charge for private boat launches. OBDD (formerly OECDD) has provided some funding in recent years but portswould like to see more and clearly defined economic development funding assistance in future.
The Port of Portland is a key partner in the I-5/Columbia River Crossing project, which is studying theenvironmental impacts, cost and revenue implications, and economic impacts of a substantial improvement to theI-5 crossing over the Columbia River, considered to be a major freight bottleneck for the Portland, OR/Vancouver,WA region as well as the I-5 interstate corridor.
The Port of Hood River is involved in the SR 35/Columbia River Crossing efforts to get $200 million or more toreplace the Hood River Bridge. Newport has been awarded the relocation of the NOAA fleet from Lake Union(Seattle) and likely will be seeking financial assistance for facilities, support services, and docks.
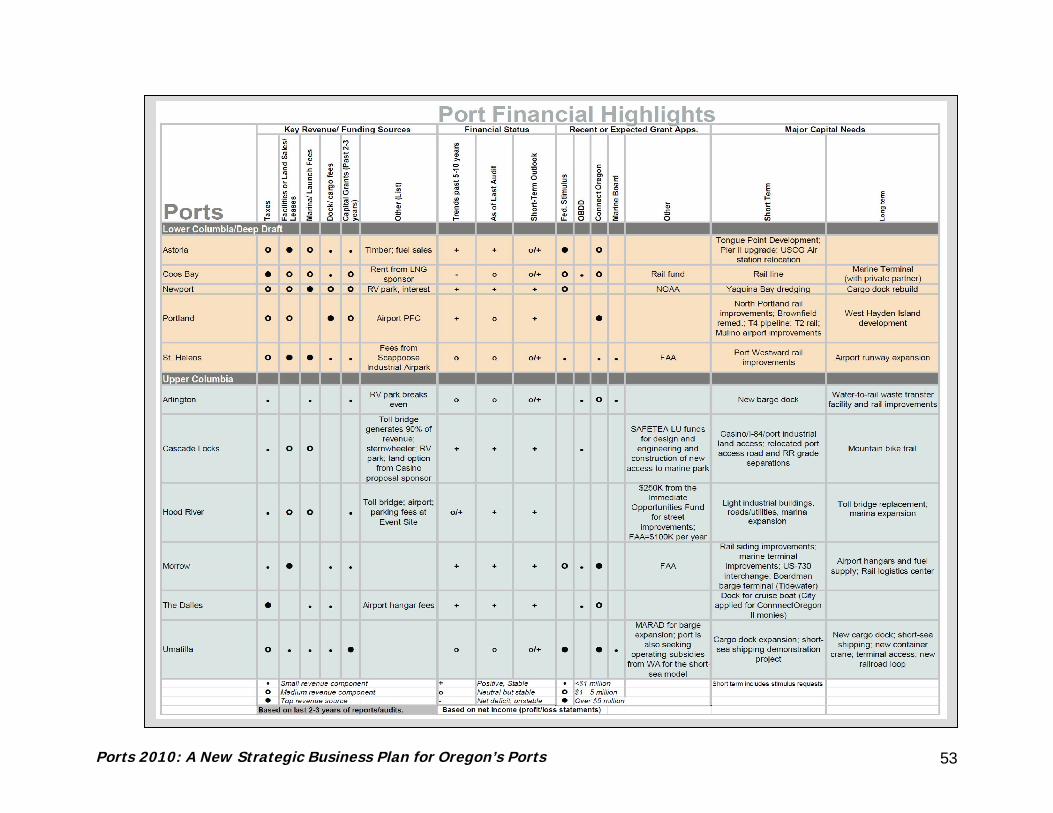
Ports 2010: A New Strategic Business Plan for Oregon’s Ports 53
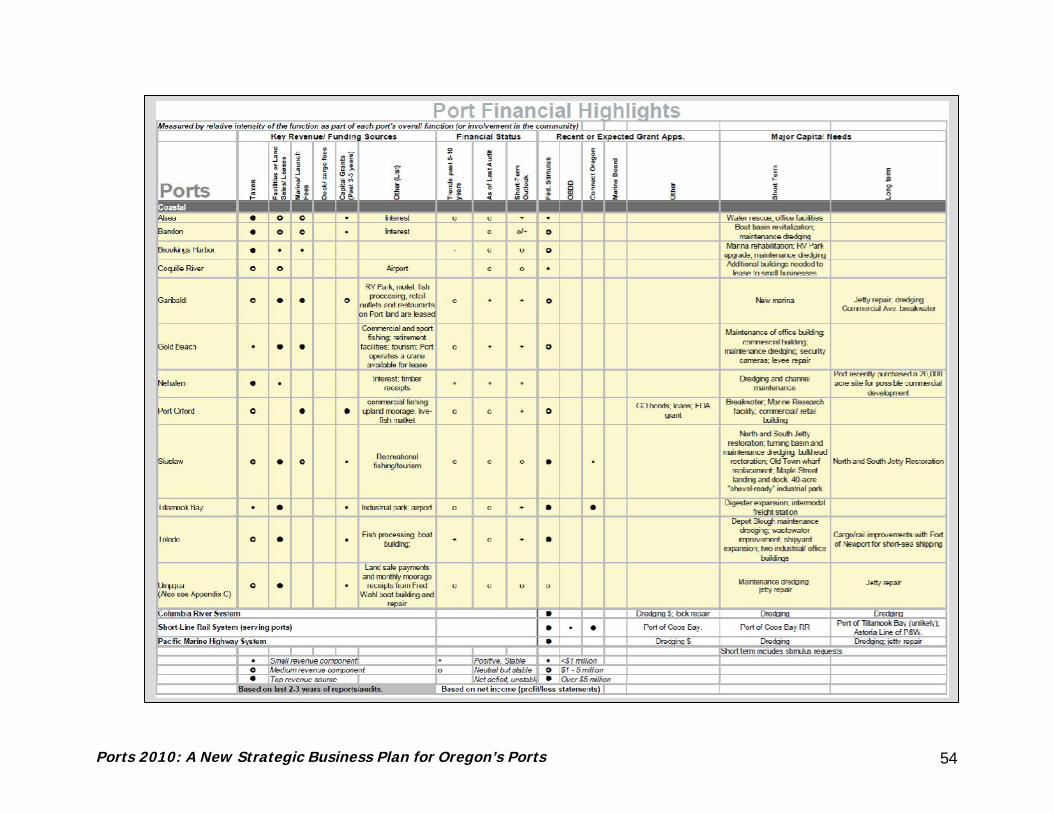
Ports 2010: A New Strategic Business Plan for Oregon’s Ports 54

Ports 2010: A New Strategic Business Plan for Oregon’s Ports 55

Ports 2010: A New Strategic Business Plan for Oregon’s Ports 56
6. Status of Strategic/Business/Master PlansStrategic, business, or master plans either do not exist or were not available for seven of the state’s 23 ports; mostof those with existing plans will need to update them subsequent to adoption of this statewide strategic plan. Atleast five ports are currently developing or updating plans as of the summer of 2009. The Port of Portland has themost expansive plans given their role in Oregon’s cargo market and statewide importance. At least four of thesmaller ports have no or very old plans and no money/staff to update them.
7. Governance/State ServicesPorts were asked their opinions regarding state governance of the port system and the current institutionalstructure. There is little support by the ports for an active, state-run port commission. Many would like to seeports elevated at the state level to a division level entity (similar to ODOT’s Highway and Rail Divisions) and wouldlike to see more influence of this program with the State Legislature. Ports seek better funding and activity levelfrom OPPA; WPPA was used as an example of what is desired, and upriver Oregon ports have as strong of ties toWashington ports and WPPA as they do to OPPA; the Pacific Northwest Waterways Association is also a key outletfor Washington lobbying.
Most ports would like to see a loosening of bureaucracy on OBDD grants. About half of Oregon’s ports have beenactive through ConnectOregon, and they are generally satisfied with the level of administration and bureaucracy.Many would like to see education of state officials and state legislators on the benefits of Oregon’s port system,while others would like to see state-sponsored training on best practices programs for port officials and portcommissioners.
A number of port coalitions have formed over the years to address issues within their section of the state, includingthe “Four Ports Group” consisting of the Ports of Bandon, Brookings Harbor, Gold Beach, Port Orford and the“Columbia Gorge Economic Development Coalition” consisting of the Ports of Hood River and Cascade Locks, plusWashington the ports in the Columbia Gorge. Umatilla actively coordinates with upriver Columbia River and SnakeRiver ports in Washington state. Coos Bay would like to see a separate (funding and legislative) coalition of “cargoports” that specifically addresses inland transportation and economic development for and from cargo handling.

Ports 2010: A New Strategic Business Plan for Oregon’s Ports 57
8. Regulatory IssuesShips entering Oregon’s harbors from the Pacific Ocean must cross a section of ocean, called “bars”, where majorriver outflows meet the Pacific Ocean. State procedures dictate that separate pilots are required to navigate cargoships over the bars, and to navigate ships into the harbor. This is called “Double Pilotage” and is a significantconcern with Oregon’s cargo ports in that they believe that this results in a high percentage of vessel entry andberthing costs for pilotage fees when compared to the total cost of bringing a vessel into port. The Port of CoosBay indicates that pilotage fees are 55% of the total costs associated with bringing a vessel to berth.
The State has a Pilotage Commission that controls the rates charged by the three Pilot Associations in the State ofOregon. All three associations are attempting to raise their rates this year and the Ports are seeking some sort ofrelief from these increased costs as a competitiveness issue. One method of relief for pilotage fees would be for allpilots to be state or port employees instead of independent contractors.
Other regulatory concerns expressed by ports include:
State-sponsored Marine Reserves in Pacific fisheries are a major concern to commercial fishing portsTribal issues have delayed Arlington’s new dock and off-loading facilities and have also been an issue at MorrowEnvironmental issues affect Newport’s ability to reconstruct its deep draft cargo dockPortland’s development of West Hayden Island must occur within City of Portland’s and Metro’s land usedecision-making processLack of state support for and community controversy regarding LNG proposals in Coos Bay and AstoriaPotential navigation and economic impacts of removal of Snake River dams.Local opposition (“NIMBY effect”) to growth and change is very prevalent in Coos Bay.
B. OPPAKen Armstrong, OPPA Administrator, and Annette Price, OPPA Chair, were interviewed during the data collectionphase and later to provide comments on the preliminary Plan recommendations. They indicated that OPPA has foryears suffered from a lack of financial stability, but now that they are housed within the SDAO, they have stabilizedthe association’s financial status. They also indicated that there were previous attempts to require port official

Ports 2010: A New Strategic Business Plan for Oregon’s Ports 58
training through legislation, which was unsuccessful. They prefer the “opt-in” provision for the Strategic Planelements (described in a later chapter).
C. Other State AgenciesOBDD and consultant staff met with senior officials from a number of state agencies as well as the BusinessDevelopment Commission and IFA Board during the period when the Draft Strategic Port Plan was circulated forcomment. State agencies included: ODOT, Treasurer’s Office, Department of Environmental Quality, Marine Board,and Department of State Lands. State agency representatives agree that better coordination between each portand the State is needed, but also stress that better state oversight of port compliance with state rules andregulations is needed as well. All state agencies interviewed indicated they intend to commit to coordinating withOBDD and the ports as an outcome of the Statewide Strategic Port Plan.
Regarding the potential establishment of a Marine Transportation Mode program within state government, thegeneral consensus was that the directors of OBDD, ODOT, Marine Board, and potentially other state agenciesshould meet and decide where such a program is best housed, what the mission and role of that program shouldbe, and how to implement and undertake such a program before approaching the state legislature with a proposal.
Members of the Business Development Commission and IFA Board felt that their roles with regard to statewidepolicy relating to ports and their economic development mission, as well as a potential new infrastructure fundingprogram for ports, need to be better developed and established as part of developing, adopting, and implementingthe Strategic Port Plan.
D. Key LegislatorsTwo key legislators were interviewed: Representative Dave Edwards, and Senator Betsy Johnson. Their commentsgenerally included:
State funding to ports needs tracking and accountability. State funds that are granted to the ports should focusthe funds on business lines of state significance.The legislature is now requiring state funding sources to demonstrate some type of “return on investment” forcapital funding; this is across the board, and not just for ports. Measures could include job creation or
Ports 2010: A New Strategic Business Plan for Oregon’s Ports 59
retention, improvements in access to Oregon’s key industries as defined by OBDD, development of newindustries, and increased revenue for the state.Those receiving state infrastructure funding must demonstrate ability to maintain and operate new state-funded, capital facilities.New land use proposals, and development grant requests should include letters of support from local, land usemunicipalities.For a new funding program, the “Community College” funding model has merit.Port officials and commissioners have not always complied with state and federal laws; they should havemandatory training.The legislators would like to see a comprehensive priority list of port capital project needs.
E. Tourism CommissionThe Plan’s Core Team met with Todd Davidson, director of Travel Oregon, an umbrella arm for Oregon’s tourismindustry and staff to the Tourism Commission. The interview focused on Travel Oregon’s and the TourismCommission’s mission and purpose as they relate to Oregon’s ports. Travel Oregon believes ports can expand theirservices by offering meeting and convention facilities or at least be local contacts and catalysts for local andregional activities, which Travel Oregon can assist in coordinating. This group has a tourism development divisionthat provides matching grants up to $10,000. Travel Oregon has seven marketing regions, and the ports couldwork with each of those regions to secure marketing grants. This program is funded by a one percent statewidelodging tax, of which 15 percent is returned in revenue back to the regions for distribution. Travel Oregon’swebsite could house port-related information and tourism links, and this organization has a strong relationship withOSMB.
Other key issues or challenges to further development of ports’ services identified by Travel Oregon include:
Ports hosting or facilitating meeting events with incentives have shown a substantial return on investment forOregon’s tourism industry until the economic downturn and corporate cost-containment efforts. They wouldlike to see that practice return.Positioning or port calls of cruise ships is an issue that they would like to see addressed in this strategic planbecause it can benefit local tourism. The Port of Astoria currently benefits from cruise ships, but Travel Oregonsees that other ports can benefit as well, although some ports, such as Newport and Coos Bay, may be limited

Ports 2010: A New Strategic Business Plan for Oregon’s Ports 60
by bridge height restrictions. Note: The Jones Act as explained earlier under Regulations may be a constraintto cruise ships calling on multiple Oregon ports at the same time, as a number of cruise lines do not meet therequirements for US crews, ownership, construction, etc. This applies mainly to ocean-going cruise ships callingon Oregon, and less so to those cruise ships which travel up and down the Columbia River.
Ports provide support for tour operators and eco-tourism. Eco-tourism, as defined by Travel Oregon, is:experiential, exploratory, environmentally sustainable nature-based recreation, including hiking, adventures, andinterpretive tours. Estuary kayaking out of Tillamook Bay is an example. Estuaries are included under eco-tourism, and ports are often located near estuaries. Ports also offer marinas and tie-ups for charter boats, RVparks, and park facilities. Certain ports with airports such as Coos Bay (although the Port no longer owns thatairport) can provide crucial scheduled and charter passenger connections with California, Portland, Seattle, etc.Additionally, the South Coast has been innovative with tourism and South Coast ports provide that link. BandonDunes has been rated the #2 golf course in the world – the Port of Bandon could help here with ensuring theirmarina can accommodate larger, personal vessels.
Ports 2010: A New Strategic Business Plan for Oregon’s Ports 61
IV. STRENGTHS AND CHALLENGES ASSESSMENTA Strengths, Weaknesses, Opportunities and Threats (SWOT) evaluation was performed for Oregon’s overall portsystem as well as for the three “mini-systems” in the state: Coastal Ports (Alsea, Bandon, Brookings Harbor,Coquille River, Garibaldi, Gold Beach, Nehalem, Port Orford, Siuslaw, Tillamook Bay, Toledo, and Umpqua), LowerColumbia and Deep Draft Ports (Astoria, Coos Bay, Newport, Portland, and St. Helens), and Upriver Ports(Arlington, Cascade Locks, Hood River, Morrow, The Dalles and Umatilla). Also included in this analysis was a dataassessment of current financial and infrastructure conditions, market and economic status of the ports and thestate, as well as an outlook for the future, which yielded the following findings:
The State of Oregon has little recognition or acknowledgement of the role of ports in the state economy.There is a general desire not to change the ports governance structure, but rather to elevate the port system inOBDD to a division level.Columbia River ports are very tied to the dredging depth of the Columbia River, and coastal ports are highlydependent on maintaining the dredging depth of their navigation inlets from the Pacific Ocean.The commercial fishing outlook is generally declining on Oregon’s southern coast, while it is remains a steadyindustry on the north coast.Charter fleets and private vessels calling into ports are holding steady on the lower part of the Columbia Riverand the south coast; however, in a number of instances the size of the vessels arriving into ports exceed thesize of the dock, slip, or marina facilities.Transport of logs/forest products out of coastal ports is generally declining, but the wood chip industry isholding steady.The ports are experiencing emerging industry growth in export/transport of biofuels and biomass, as well aswind energy components (although how long this will be sustained is uncertain). Other emerging industriesinclude transport of live seafood and eco-tourism (especially for whale watching, marine reserves, scubadiving).Policies regarding leasing versus sale of developable land owned by ports varies throughout the state.Additionally, lease and facility rental rates are commonly below market average, which limits the ability forports to keep pace with facility maintenance needs.There is some redundancy and overlap of services and business lines between ports, but not as much asanticipated at the start of the planning process.Most ports have solid working relationships with ODOT, but mixed relationships with OBDD.
Ports 2010: A New Strategic Business Plan for Oregon’s Ports 62
A. StrengthsAs mentioned in the Summary chapter, there are a number of strengths to Oregon’s port system. The ColumbiaRiver transportation corridor includes four primary modes – rail, air, barge, and highway – that is virtuallyunparalleled in the western United States. There are many coastal scenic, fishery and environmental attributes ofwhich the ports can be a partner or catalyst for economic development. Oregon’s port system has many existingstrengths as well as opportunities to grow these strengths:
The Columbia River corridor includes three primary transportation modes – rail, barge, and highway – that isvirtually unparalleled elsewhere in the western United States. Oregon’s upper Columbia River ports (CascadeLocks, Hood River, Arlington, Morrow and Umatilla) and the Port of Portland enjoy good connections to alltransportation modes: Class I railroads (Union Pacific and Burlington Northern Santa Fe or BNSF), highways (I-84, I-5, and US-97), air cargo (Portland International Airport) and uncongested marine access. The container-on-barge system between up river ports and Portland is unique in the region.Oregon’s coastal location offers many scenic, fishery, and environmental features that provide the ports withopportunities to be a partner in or catalyst for economic development.The Port of Portland is one of the largest international grain export gateways in the country and is part of thesecond largest grain exporting region in the world. It is also the largest automobile importing port on the westcoast, and fourth largest in the nation.There are a few planned deep-water sites large enough to accommodate a marine terminal,, such as those atHayden Island (Portland), St. Helens, and Coos Bay, although they all have an approval or infrastructurecomponent such as permitting that needs to be addressed. There are several “brownfield” site developmentopportunities for Oregon’s ports at Portland (T-4 and others), Astoria (Tongue Point), and Coos Bay, but thedevelopment costs are high.ConnectOregon is an innovative, model program for transportation funding that receives national recognition inits multimodal, economic development capabilities; ports are eligible to compete for rail, marine, or airportprojects (although a number of smaller ports have indicated their potential projects do not fare well within thisprogram).There are several growing, new, and emerging markets in Oregon– agriculture and processed food products;marine sciences; live fish; eco-tourism activities on the coast; and energy sources such as wind, wave, solar,biofuel/biomass, possible Liquefied Natural Gas (LNG) terminals – as well as stable markets including: upriver
Ports 2010: A New Strategic Business Plan for Oregon’s Ports 63
food processing, the Port of Portland’s bulk and auto markets, commercial fishing along the north coast,industrial and commercial property development, bulk goods, recreation, sport fishing, and tour boats.The Port of Newport recently won the competition for relocation of the National Oceanic and AtmosphericAdministration (NOAA) fleet to its facility, which will enable the Port to establish a major marine science centerin conjunction with the existing Hatfield Marine Center and the Newport Coastal Aquarium.Many of the ports have worked for years to establish good relationships with local governments and otherentities in their respective communities and have diversified their business lines to respond to theircommunities’ needs. A number of the ports serve as de-facto public facilities’ districts as well as economicdevelopment engines for their regions. Overall, Oregon’s ports have high quality port management and staffthat are invested in the ports’ missions but smaller ports face staffing constraints because of their smallrevenue resources.
B. ChallengesIn addition to their strengths, Oregon’s ports also face a number of challenges.
For the most part, Oregon’s cargo ports are located in small markets, which limits their ability to compete withlarger intermodal cargo ports such as Los Angeles/ Long Beach, Seattle/Tacoma/Everett, and internationalports such as Prince Rupert in Canada and ports in Mexico for containerized traffic. Although Prince Rupert isby itself a small market, it has the benefit of a substantial public and private investment for water and railaccess, which results in it being highly competitive with the other west coast ports.Coastal ports (cargo, recreation, and other business lines) suffer from limited transportation access as highwaysacross the coast range often experience partial or full closures during winter months due to weather or slides,and two cross-Coast Range rail lines are currently out of service.There are limited staff resources at many of the smaller ports and in OBDD, combined with constrainedinstitutional support from the State of Oregon and OPPA.The State of Oregon has not developed a policy or procedure to quickly respond to special opportunities (suchas the recent NOAA or LNG opportunities) or special challenges (such as the rail closures).Cargo ports (with some exceptions) continue to be involved in operations in declining or threatened markets,including: wood chips, break bulk, commercial fish processing/canning, short-sea shipping (which has variedindustry opinions about its viability). Impacts of developing future marine reserves are unknown and futureefforts need to include studies of economic impacts on coastal ports and coastal communities.
Ports 2010: A New Strategic Business Plan for Oregon’s Ports 64
There is limited federal support for coastal dredging and jetty maintenance, and constrained state support forinfrastructure improvements in general.Proposals to remove dams on the Snake River, in an effort to improve Salmon habitat, are feared by the portsto negatively impact the ability of barges to navigate the Columbia/Snake River system, resulting in goods thatare currently barged (the least expensive transportation mode, per ton-mile11) having to find alternative andmore expensive transportation modes.Remnants of past industry operations, including log rafting pilings, as well as pilings from demolished bridgeand retaining wall structures are navigation hazards and possibly hazardous materials (treated wood) in anumber of navigable rivers, most notably the Columbia, Willamette and Yaquina Rivers. However, over theyears, these remnants have also become habitat for in-water wildlife. There is currently no inventory of howmany of these remnants there are, nor their specific locations, and there has been no comprehensive studyperformed as to what environmental impacts may be incurred by either leaving them in the water or byremoving them.
On the statewide institutional side, the Oregon Transportation Plan (OTP) has modal plans for aviation, highway & rail butnot for the marine mode. Ports make individual funding requests (state, federal) for navigation, dredging, jetties, andindividually take their funding request message to Congress, without prioritization or a system-wide assessment.Oregon’s state government does not have a function coordinating development of and planning for Oregon’s PacificOcean and Columbia River Marine Highway Systems. Congress received over $400 million in requests for Oregon marinenavigation improvement projects in FY 2009-2010 with no priority list and no marine plan with which to evaluate theneeds.
Larger cargo ports desire a stronger statewide voice with state agencies and the legislature for marine cargo issues.Marine transportation is an important component of Oregon’s economy. The state needs to develop a planning approachfor addressing marine transportation issues, including navigation in the state’s overall intermodal planning approach forimproving linkages between modes.
11 A Modal Comparison of Domestic Freight Transportation Effects on the General Public, Texas Transportation Institute Center for Ports andWaterways, Amended March 2009. http://www.americanwaterways.com/press_room/news_releases/NWFSTudy.pdf
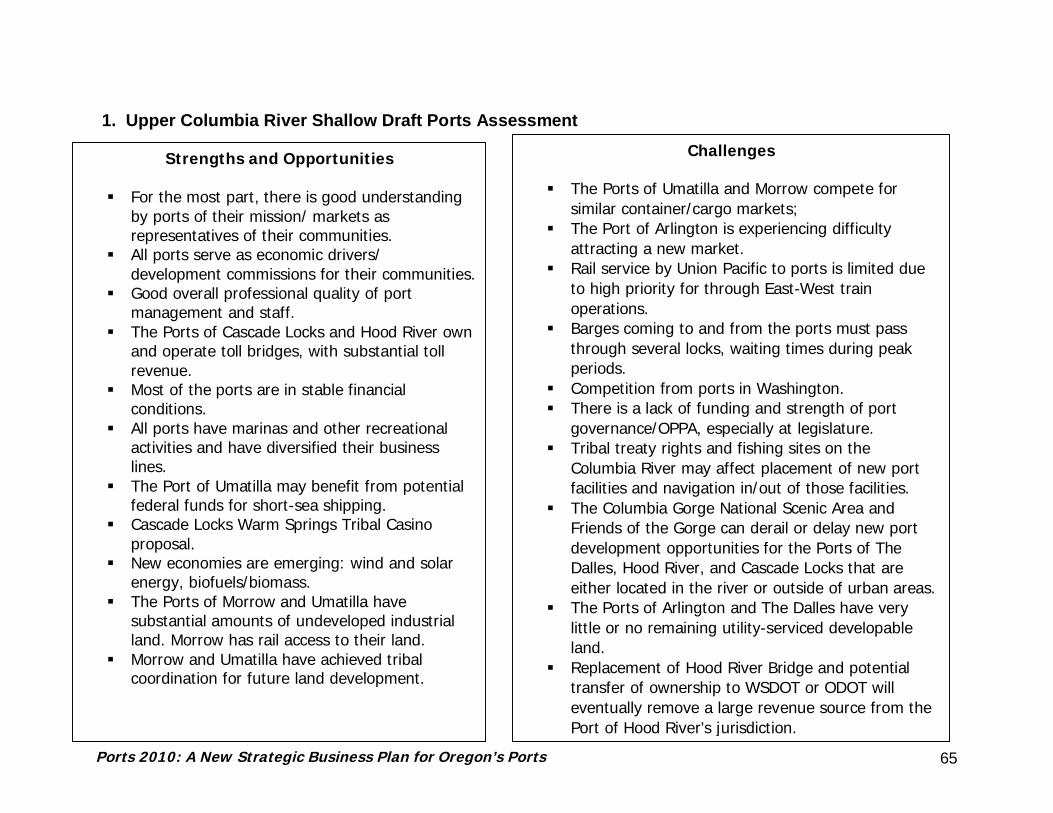
Ports 2010: A New Strategic Business Plan for Oregon’s Ports 65
1. Upper Columbia River Shallow Draft Ports Assessment
Strengths and Opportunities
For the most part, there is good understandingby ports of their mission/ markets asrepresentatives of their communities.All ports serve as economic drivers/development commissions for their communities.Good overall professional quality of portmanagement and staff.The Ports of Cascade Locks and Hood River ownand operate toll bridges, with substantial tollrevenue.Most of the ports are in stable financialconditions.All ports have marinas and other recreationalactivities and have diversified their businesslines.The Port of Umatilla may benefit from potentialfederal funds for short-sea shipping.Cascade Locks Warm Springs Tribal Casinoproposal.New economies are emerging: wind and solarenergy, biofuels/biomass.The Ports of Morrow and Umatilla havesubstantial amounts of undeveloped industrialland. Morrow has rail access to their land.Morrow and Umatilla have achieved tribalcoordination for future land development.
Challenges
The Ports of Umatilla and Morrow compete forsimilar container/cargo markets;The Port of Arlington is experiencing difficultyattracting a new market.Rail service by Union Pacific to ports is limited dueto high priority for through East-West trainoperations.Barges coming to and from the ports must passthrough several locks, waiting times during peakperiods.Competition from ports in Washington.There is a lack of funding and strength of portgovernance/OPPA, especially at legislature.Tribal treaty rights and fishing sites on theColumbia River may affect placement of new portfacilities and navigation in/out of those facilities.The Columbia Gorge National Scenic Area andFriends of the Gorge can derail or delay new portdevelopment opportunities for the Ports of TheDalles, Hood River, and Cascade Locks that areeither located in the river or outside of urban areas.The Ports of Arlington and The Dalles have verylittle or no remaining utility-serviced developableland.Replacement of Hood River Bridge and potentialtransfer of ownership to WSDOT or ODOT willeventually remove a large revenue source from thePort of Hood River’s jurisdiction.
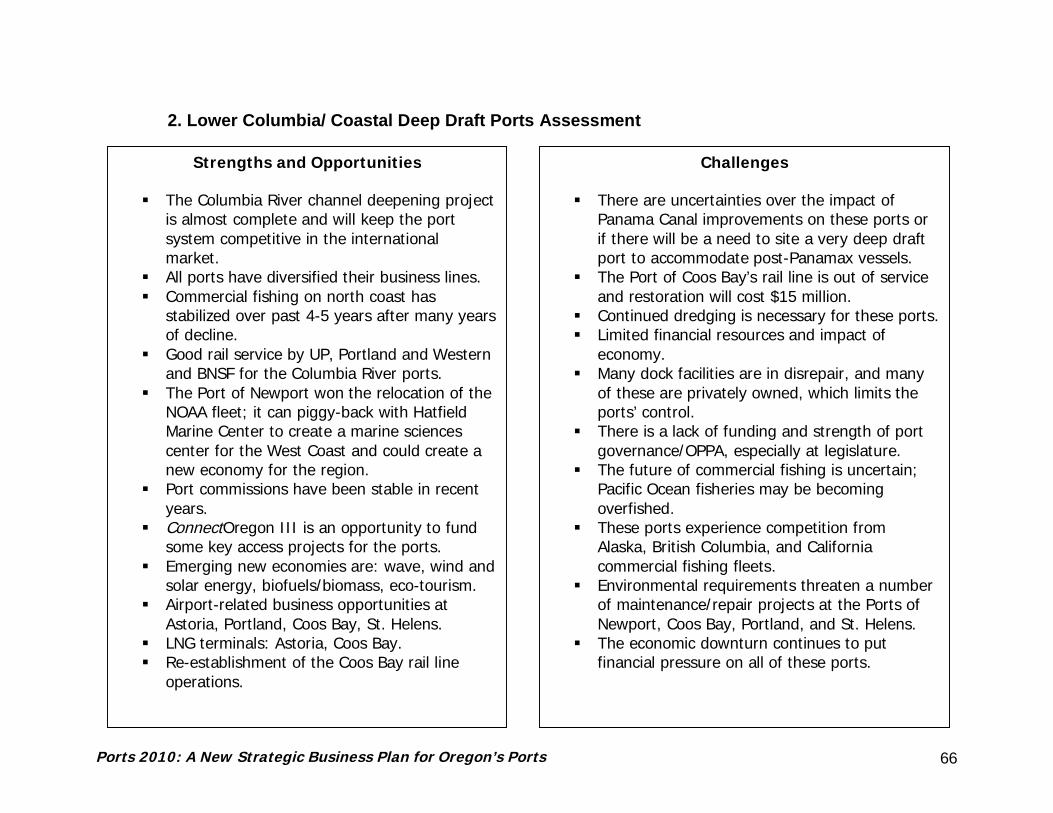
Ports 2010: A New Strategic Business Plan for Oregon’s Ports 66
2. Lower Columbia/ Coastal Deep Draft Ports Assessment
Strengths and Opportunities
The Columbia River channel deepening projectis almost complete and will keep the portsystem competitive in the internationalmarket.All ports have diversified their business lines.Commercial fishing on north coast hasstabilized over past 4-5 years after many yearsof decline.Good rail service by UP, Portland and Westernand BNSF for the Columbia River ports.The Port of Newport won the relocation of theNOAA fleet; it can piggy-back with HatfieldMarine Center to create a marine sciencescenter for the West Coast and could create anew economy for the region.Port commissions have been stable in recentyears.ConnectOregon III is an opportunity to fundsome key access projects for the ports.Emerging new economies are: wave, wind andsolar energy, biofuels/biomass, eco-tourism.Airport-related business opportunities atAstoria, Portland, Coos Bay, St. Helens.LNG terminals: Astoria, Coos Bay.Re-establishment of the Coos Bay rail lineoperations.
Challenges
There are uncertainties over the impact ofPanama Canal improvements on these ports orif there will be a need to site a very deep draftport to accommodate post-Panamax vessels.The Port of Coos Bay’s rail line is out of serviceand restoration will cost $15 million.Continued dredging is necessary for these ports.Limited financial resources and impact ofeconomy.Many dock facilities are in disrepair, and manyof these are privately owned, which limits theports’ control.There is a lack of funding and strength of portgovernance/OPPA, especially at legislature.The future of commercial fishing is uncertain;Pacific Ocean fisheries may be becomingoverfished.These ports experience competition fromAlaska, British Columbia, and Californiacommercial fishing fleets.Environmental requirements threaten a numberof maintenance/repair projects at the Ports ofNewport, Coos Bay, Portland, and St. Helens.The economic downturn continues to putfinancial pressure on all of these ports.

Ports 2010: A New Strategic Business Plan for Oregon’s Ports 67
3. Coastal Ports Assessment
Strengths and Opportunities
The financial condition at most of these portshas stabilized.Marine/Ocean research is an emergingindustry (landside facilities and vesselmoorage)The “live fish” markets and facilities areexpanding.Development of incubator buildings foremerging small businesses.Creating/enhancing port and environs as atourist destination.Traditional and Eco-tourism are majormarkets
Challenges
Small staff size and financial resources ofthese ports often limit an effective responseto regulatory issues.These ports are experiencing difficultyovercoming deferred maintenance forjetties, marinas, and other facilities.Limited financial resourcesInadequate transportation accessparticularly the distance to I-5 and thecondition of 101, which inhibits the efficientmovement of goods and servicesLack of approved upland dredged materialdisposal and mitigation sites.Unknown impacts of marine reservesUncertain fishing seasons ( length andallowable catch)Loss of timber revenues.Remnants of wood pilings from log raftingor demolished bridge structures areenvironmental and navigation hazards in theYaquina River.

Ports 2010: A New Strategic Business Plan for Oregon’s Ports 68
C. Oregon’s Lifeblood: Marine CargoOregon’s economy is highly dependent on its exported goods, and Oregon’s ports serve as international gateways.Based on the recently-completed Oregon Commodity Flow Forecast (2002-2035),12 marine cargo comprisesapproximately 12 percent of the total commodity flow to, through, and within Oregon. By adding in commoditiestransferred at ports and using other modes, such as air, rail and truck, yields Oregon’s ports factoring into almost20 percent of total commodity flow. This is equivalent to over 80,000,000 tons per year shipped, with goods valuedat over $50 billion.
Most marine cargo in Oregon is shipped through the Port of Portland (including private facilities in the PortlandHarbor), accounting for 85 percent of all water flows in Oregon. The other 15 percent of the marine cargo marketis shipped through Astoria, Coos Bay, Morrow, Umatilla and Arlington. There is one true “port system” in Oregonas marine cargo depends on vessels being able to navigate the Columbia River, the Willamette River to thePortland Harbor, and the Pacific Ocean and its inlets - a system which effectively links all of Oregon’s cargo portstogether. Additionally, both the Ports of Morrow and Umatilla load goods which flow through the Port of Portland,further cementing the importance of Oregon’s marine transportation system.
Congestion and land limitations at the major West Coast container ports outside of Oregon have, in the past (andlikely in the future) caused major carriers and providers such as APM/Maersk to seek a new location, such as CoosBay. As mentioned earlier, Oregon’s current cargo port activities provide jobs for thousands of Oregonians andcontribute billions to the local and state economy. Enticing a new entity such as APM could potentially provide amajor boost for the economy. However, that type of opportunity requires establishing good, multimodaltransportation connections, and, for the state to become involved, would have to be market driven withcommitments and not a speculative effort by the state.
1. What Types of Goods are Transported and How?The primary commodities moved in the Port of Portland include grains, fuels, metals, mineral, machinery,motorized vehicles, and clay/concrete/glass/stone. Commodity movements by water at coastal ports (Coos Bayand Astoria) are dominated by the exchange of wood chips and logs, as well as fuel, lumber, commercial fishing,
12 Oregon Commodity Flow Forecast, Parsons Brinckerhoff for ODOT, October 2009.

Ports 2010: A New Strategic Business Plan for Oregon’s Ports 69
machinery and transport equipment. For the upriver Columbia River ports (Arlington, Morrow and Umatilla),downriver flows are dominated by the outbound flow of grains, animal feed (hay), and other agriculture products ,while upriver flows are primarily waste, fuel, and fertilizers.
In the past, many of Oregon’s coastal ports moved logs, lumber and other forest products. Much of that industryhas declined; however, a number of ports, including Brookings Harbor, Coos Bay, and Astoria, are currentlyexamining ways to revitalize the log/forest product transportation industry.
Oregon’s exports are primarily transported in containers, intermodal (truck to ship), bulk, or breakbulk form.Container service and its intermodal connections is strategically important to Oregon. Hundreds of companies relyon containers at the Port of Portland, which serves state and regional markets. At this time most of theinternational container ship fleet can be served at the Port of Portland when the 43 foot channel deepening iscompleted on the Columbia River. The long-term trend for container vessels is to build increasingly larger ships forreasons of labor and fuel efficiency, the largest of which, as operated by Maersk, currently have loaded drafts of 51feet. Expansion of the Panama Canal to accommodate 50 foot drafts (versus 39.5 feet today) is expected toaccelerate conversion to the larger vessels. Such vessels will either not be able to call on the Port of Portland, orthey will not be able to be fully loaded in order to navigate the 43 foot deep channel. There are, however,varying opinions as to how large the international fleet of mega-sized container vessels will be and the demand forthese vessels to call on Oregon ports.
The intermodal truck market is critical to serving cargo that comes into and is consumed in Oregon, or ismanufactured in Oregon for the export market. For intermodal goods destined for the Midwest and the East Coastby rail, major competitors for this market are the Seattle/Tacoma and Los Angeles/Long Beach. Recently, the Portof Prince Rupert, BC has emerged as an intermodal rail port serving the U.S. Midwest and potential gateways inMexico have been studied as well. The Port of Portland is Oregon’s leading intermodal port; in fact, all goodsimported from international markets via intermodal shipping and destined for central and southern Oregon isloaded onto trucks as there are no rail intermodal offload centers outside of Portland. The Port of Portland hasindicated maintaining the international-to-Oregon intermodal truck market is critical to their business strategy andthat they have no desire to attempt to compete with larger West Coast ports for the domestic (non-Oregon)intermodal rail market. All of the marine cargo ports interviewed indicated continued support of Port of Portlandcontainer service is of statewide importance to Oregon, and all ports expressed the importance of continuing toserve as international gateways is of critical importance to Oregon’s economy.

Ports 2010: A New Strategic Business Plan for Oregon’s Ports 70
The Port of Coos Bay has noted that with increasing congestion at California ports (Oakland, Los Angeles, LongBeach), they believe that with a competitive marine cargo facility, and adequate rail and highway access inland,they can compete in the future for the northern California cargo market.
To ensure continued competitive access for Oregon importers and exporters to the broadest portion of thecontainer shipping market, two things are of strategic importance for the State. First, it is critical that the Statecontinue to support the Port of Portland and its role in the container shipping market, including continued supportfor Columbia River channel deepening and maintenance. Second, should bona-fide opportunities arise to developa second container gateway in Oregon serving the larger post-Panamax vessels and the national intermodal marketby rail, the State should carefully assess the potential and soundness of such a proposal and be prepared tosupport it fully, if warranted. Due to the substantial risks and industry dynamics involved in the container trade,such a project should not be undertaken speculatively by any port or the State, rather it should only be undertakenif it involves a major private investment and long-term commitment by a carrier or other entity directly involved inthe container trade. The APMT proposal at Coos Bay was an example of such a potential opportunity.
Transportation Access and ClosuresOregon’s Columbia River ports enjoy unparalleled access to a truly multimodal transportation corridor: rail (UnionPacific both east-west and north-south, BNSF north-south; Portland and Western), water (Columbia River bargesand deeper draft vessels calling up to Portland), highway (I-84, I-5, US-97), and air (Portland InternationalAirport). Except for the Portland metropolitan area, all of these modes offer relatively uncongested andcompetitive transportation access.
Oregon’s coastal ports, however, suffer from remoteness – they are physically separated from the inlandpopulation, employment centers, and the major transportation network by the Coast Range. Two of the rail linesconnecting the coast to the inland system, Port of Tillamook Bay and the Coos Bay Line, are currently out ofservice, with only the Port of Coos Bay having plans to rehabilitate track and restore service to their line. All east-west state highways passing through the Coast Range are subject to winter-time, weather related closures,averaging approximately five to seven days every year.
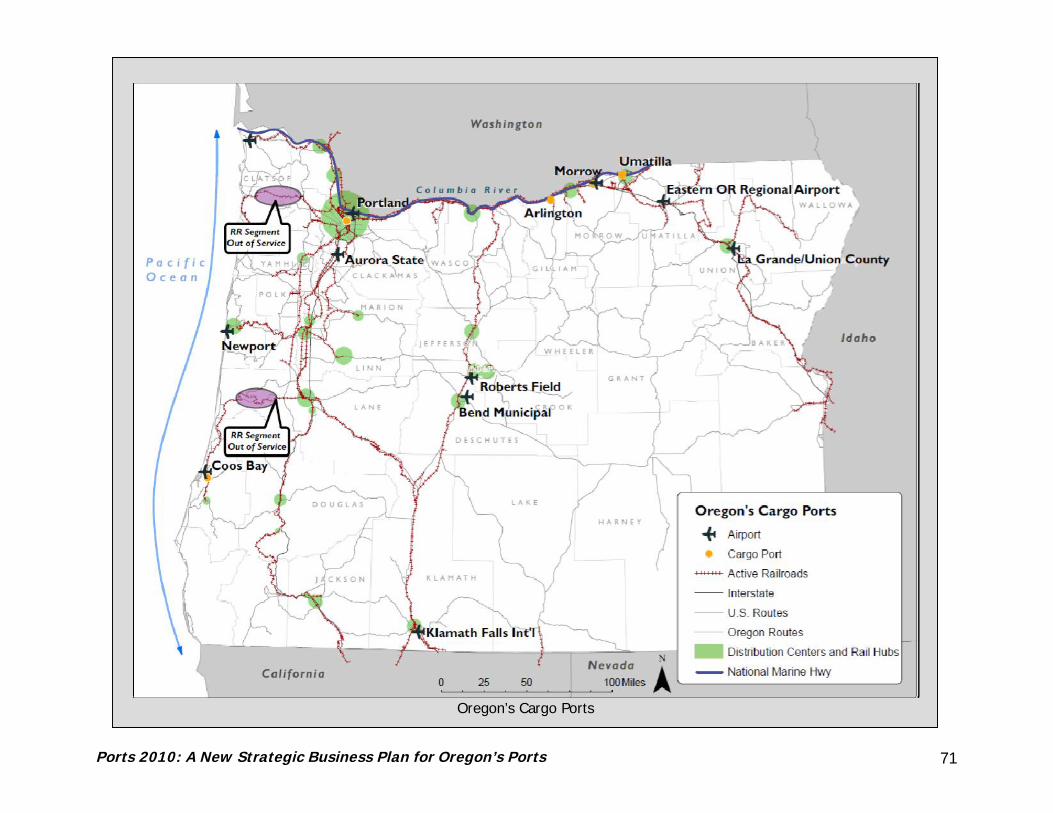
Ports 2010: A New Strategic Business Plan for Oregon’s Ports 71
Oregon’s Cargo Ports
Ports 2010: A New Strategic Business Plan for Oregon’s Ports 72
2. ConcernsThere are two major concerns facing Oregon’s ports with respect to marine cargo: the Panama Canal expansionproject which is anticipated in 2014-2015, and the proposed breaching of the Snake River dams for salmonrecovery (timeline uncertain).
The possible impacts of Panama Canal expansion are uncertain, but the impacts at this time do not appear toimpact Oregon as much as it may impact other West Coast ports, The recent ODOT Commodity Flow Forecast(through 2035) addressed the Panama Canal expansion issue, stating: “the expansion of the Panama Canal isexpected to shift some container liner calls from West Coast to East Coast ports, as it becomes less expensive toreach East Coast markets via the Panama Canal rather than shipping across the US mainland through West Coastports. The impact to Oregon, however, is expected to be limited.”13 The forecast identifies only selectedinternational commodities shipped through Oregon ports to the East Coast which could be diverted to East Coastports, most of which are machinery and base metals shipped from Asia to the Port of Portland and then via air,land, or rail to the East Coast. Automobiles handled through the Port of Portland are not expected to be impacted,as they are typically destined for the Midwest rather than East Coast, via rail.
The outcome of the proposed Snake River dam removal is less certain. The concern of the Columbia River ports isthat removing the dams will also remove an important river navigation link, resulting in transportation of goods todownriver ports (Morrow, Umatilla, Portland) being shifted from barge to rail, which was the transportation modefor goods movement between Montana, Idaho and Oregon until the dams were built in the mid 1970s. The railinfrastructure, however, has not seen much improvement since the 1970s and may not be able to handleadditional demand. The ports believe that they are at a competitive disadvantage because of the imminent loss ofbusiness and the lack of an infrastructure plan to address this loss. While the State of Oregon has officiallysupported dam removal to assist with salmon recovery, in 2008 the Bush Administration proposed an alternativesalmon recovery plan that would not include dam removal. The Obama Administration recently prepared theiralternative recovery plan which does call for dam removal if the other recovery efforts are unsuccessful. Therecovery plan is still in pending litigation.
13 Oregon Commodity Flow Forecast, op. cit., Page 16.

Ports 2010: A New Strategic Business Plan for Oregon’s Ports 73
D. Outlook for the FutureOregon’s ports have an exciting, yet challenging future ahead of them. As with any economy, markets will thriveand decline over time, and new markets will emerge. Emerging markets for Oregon’s ports includebiomass/biofuels, marine sciences, tourism including eco-tourism, energy including LNG, wind, wave, solar,fertilizer and bi-products including those produced by recombiners.
OBDD has identified a number of key Oregon industries that provide major contributions to Oregon’s economy andhas developed business strategies to nurture and grow those industries. OBDD also recognizes that there areregional and local industries which serve as the lifeblood for their host communities; if these disappear, they haveripple effects on Oregon’s economy. For example, while commercial fishing comprises less than one percent of theentire commodity flow in Oregon, the jobs and economic return provided by commercial fishing make it the leadingindustry in a number of coastal communities, spinning off a number of support and related jobs. On the otherhand, the loss of commercial fishing activity in a number of locations has led to the growth of charter fishing, sportfishing, and crabbing industries; the growth of sport fishing in such communities has supported substantial jobgrowth and, in some instances, elevated tourism and recreation to become the largest driver of local economies.
It is important to note that even though ports may not directly own or operate a business line themselves, they arecatalysts for economic growth in their communities. The Port of The Dalles, for example, does not have muchserviced land remaining that they own, but they continue to use their economic development authority granted inORS 777, along with experience coordinating with the regional economic development authority as well as city andcounty officials, to encourage development in their district. The Port of Coos Bay is a partner in a number ofcommunity improvement projects and continues to work with Coos County and local cities to foster economicdevelopment. The Port of Portland is a major stakeholder in virtually all planning and growth processes in thePortland metropolitan area, realizing the tie between what they do and the well-being of the community as awhole.
1. Market and Economic Outlook
Deep Draft PortsThe following section summarizes cargo trends and projections for the deep draft ports in Oregon, including thelower Columbia River ports of Portland, St. Helens, and Astoria, as well as the coastal deep draft ports of Newport
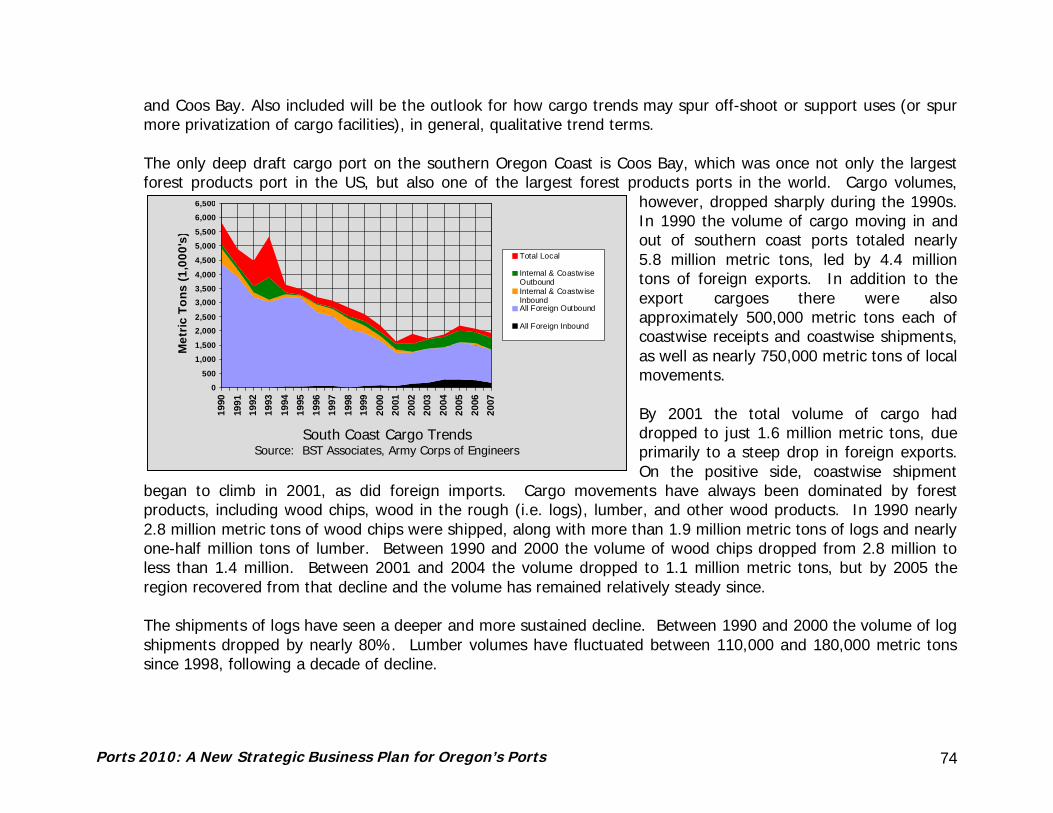
Ports 2010: A New Strategic Business Plan for Oregon’s Ports 74
South Coast Cargo TrendsSource: BST Associates, Army Corps of Engineers
0
500
1,000
1,500
2,0002,500
3,0003,500
4,000
4,500
5,000
5,500
6,000
6,500
1990
1991
1992
1993
1994
1995
1996
1997
1998
1999
2000
2001
2002
2003
2004
2005
2006
2007
Met
ric T
ons
(1,0
00's
)
Total Local
Internal & CoastwiseOutboundInternal & CoastwiseInboundAll Foreign Outbound
All Foreign Inbound
and Coos Bay. Also included will be the outlook for how cargo trends may spur off-shoot or support uses (or spurmore privatization of cargo facilities), in general, qualitative trend terms.
The only deep draft cargo port on the southern Oregon Coast is Coos Bay, which was once not only the largestforest products port in the US, but also one of the largest forest products ports in the world. Cargo volumes,
however, dropped sharply during the 1990s.In 1990 the volume of cargo moving in andout of southern coast ports totaled nearly5.8 million metric tons, led by 4.4 milliontons of foreign exports. In addition to theexport cargoes there were alsoapproximately 500,000 metric tons each ofcoastwise receipts and coastwise shipments,as well as nearly 750,000 metric tons of localmovements.
By 2001 the total volume of cargo haddropped to just 1.6 million metric tons, dueprimarily to a steep drop in foreign exports.On the positive side, coastwise shipment
began to climb in 2001, as did foreign imports. Cargo movements have always been dominated by forestproducts, including wood chips, wood in the rough (i.e. logs), lumber, and other wood products. In 1990 nearly2.8 million metric tons of wood chips were shipped, along with more than 1.9 million metric tons of logs and nearlyone-half million tons of lumber. Between 1990 and 2000 the volume of wood chips dropped from 2.8 million toless than 1.4 million. Between 2001 and 2004 the volume dropped to 1.1 million metric tons, but by 2005 theregion recovered from that decline and the volume has remained relatively steady since.
The shipments of logs have seen a deeper and more sustained decline. Between 1990 and 2000 the volume of logshipments dropped by nearly 80%. Lumber volumes have fluctuated between 110,000 and 180,000 metric tonssince 1998, following a decade of decline.
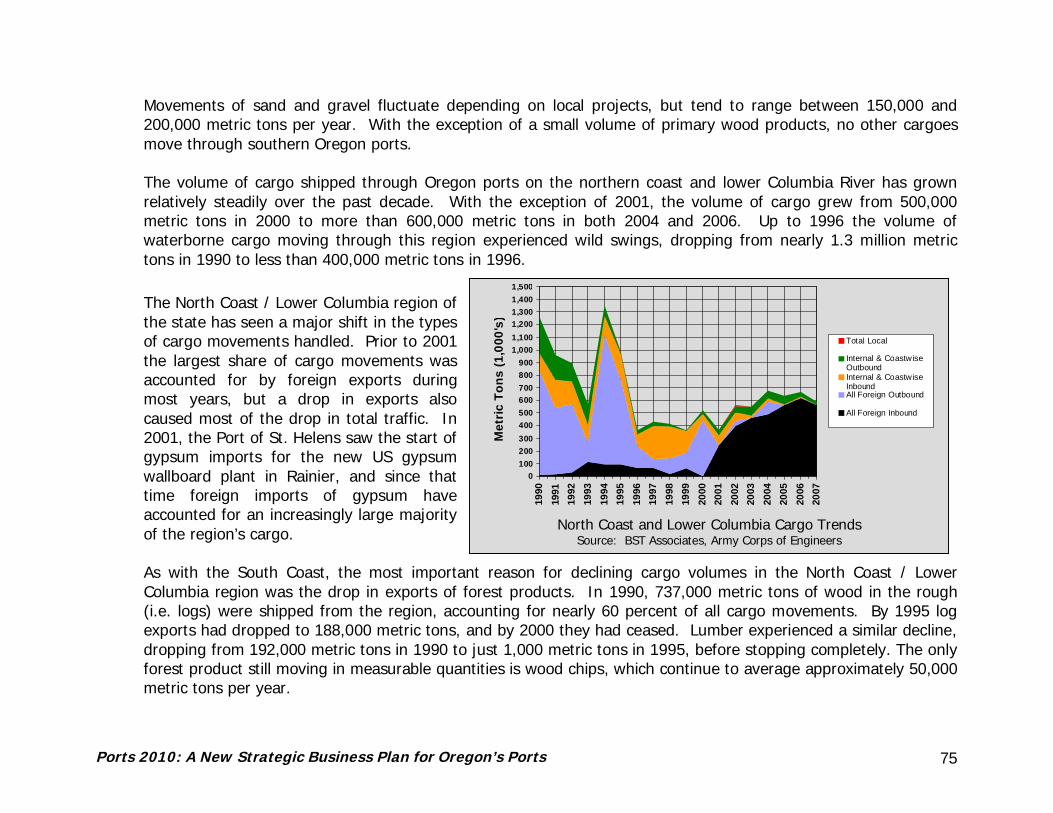
Ports 2010: A New Strategic Business Plan for Oregon’s Ports 75
North Coast and Lower Columbia Cargo TrendsSource: BST Associates, Army Corps of Engineers
0100200300400500600700800900
1,0001,1001,2001,3001,4001,500
1990
1991
1992
1993
1994
1995
1996
1997
1998
1999
2000
2001
2002
2003
2004
2005
2006
2007
Met
ric T
ons
(1,0
00's
)
Total Local
Internal & CoastwiseOutboundInternal & CoastwiseInboundAll Foreign Outbound
All Foreign Inbound
Movements of sand and gravel fluctuate depending on local projects, but tend to range between 150,000 and200,000 metric tons per year. With the exception of a small volume of primary wood products, no other cargoesmove through southern Oregon ports.
The volume of cargo shipped through Oregon ports on the northern coast and lower Columbia River has grownrelatively steadily over the past decade. With the exception of 2001, the volume of cargo grew from 500,000metric tons in 2000 to more than 600,000 metric tons in both 2004 and 2006. Up to 1996 the volume ofwaterborne cargo moving through this region experienced wild swings, dropping from nearly 1.3 million metrictons in 1990 to less than 400,000 metric tons in 1996.
The North Coast / Lower Columbia region ofthe state has seen a major shift in the typesof cargo movements handled. Prior to 2001the largest share of cargo movements wasaccounted for by foreign exports duringmost years, but a drop in exports alsocaused most of the drop in total traffic. In2001, the Port of St. Helens saw the start ofgypsum imports for the new US gypsumwallboard plant in Rainier, and since thattime foreign imports of gypsum haveaccounted for an increasingly large majorityof the region’s cargo.
As with the South Coast, the most important reason for declining cargo volumes in the North Coast / LowerColumbia region was the drop in exports of forest products. In 1990, 737,000 metric tons of wood in the rough(i.e. logs) were shipped from the region, accounting for nearly 60 percent of all cargo movements. By 1995 logexports had dropped to 188,000 metric tons, and by 2000 they had ceased. Lumber experienced a similar decline,dropping from 192,000 metric tons in 1990 to just 1,000 metric tons in 1995, before stopping completely. The onlyforest product still moving in measurable quantities is wood chips, which continue to average approximately 50,000metric tons per year.
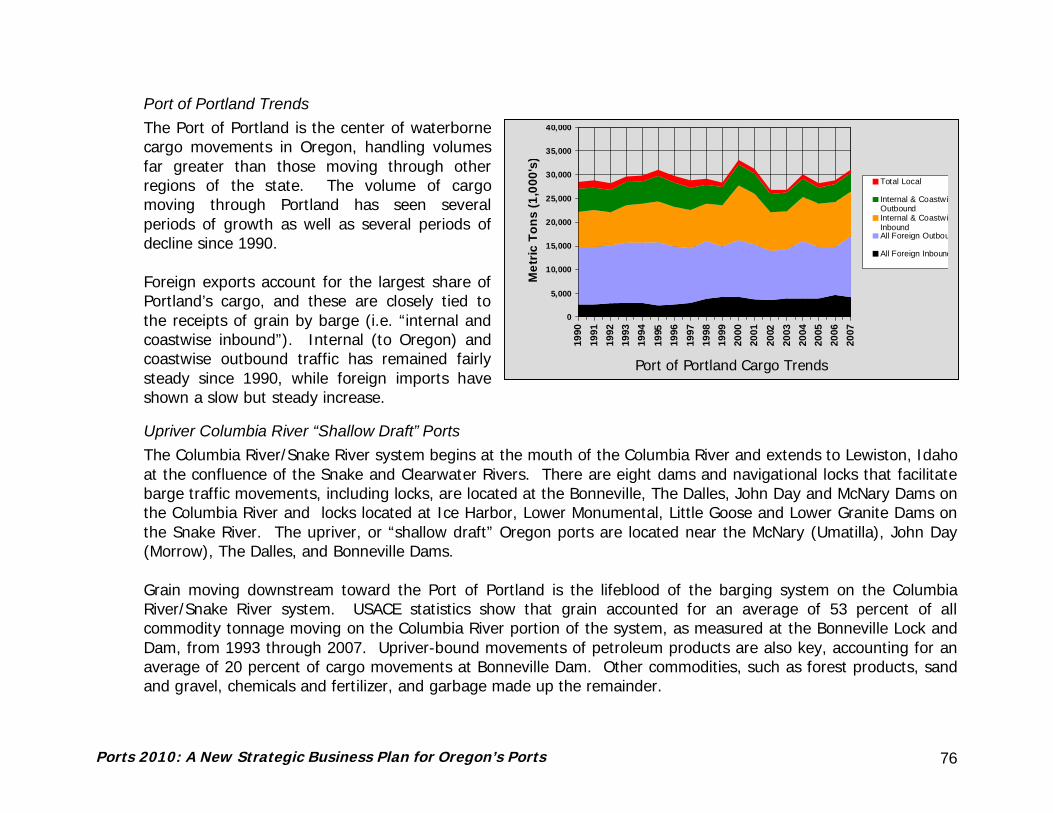
Ports 2010: A New Strategic Business Plan for Oregon’s Ports 76
Port of Portland Cargo TrendsSource: BST Associates, Army Corps of Engineers
0
5,000
10,000
15,000
20,000
25,000
30,000
35,000
40,000
1990
1991
1992
1993
1994
1995
1996
1997
1998
1999
2000
2001
2002
2003
2004
2005
2006
2007
Met
ric T
ons
(1,0
00's
)
Total Local
Internal & CoastwiseOutboundInternal & CoastwiseInboundAll Foreign Outbound
All Foreign Inbound
Port of Portland TrendsThe Port of Portland is the center of waterbornecargo movements in Oregon, handling volumesfar greater than those moving through otherregions of the state. The volume of cargomoving through Portland has seen severalperiods of growth as well as several periods ofdecline since 1990.
Foreign exports account for the largest share ofPortland’s cargo, and these are closely tied tothe receipts of grain by barge (i.e. “internal andcoastwise inbound”). Internal (to Oregon) andcoastwise outbound traffic has remained fairlysteady since 1990, while foreign imports haveshown a slow but steady increase.
Upriver Columbia River “Shallow Draft” PortsThe Columbia River/Snake River system begins at the mouth of the Columbia River and extends to Lewiston, Idahoat the confluence of the Snake and Clearwater Rivers. There are eight dams and navigational locks that facilitatebarge traffic movements, including locks, are located at the Bonneville, The Dalles, John Day and McNary Dams onthe Columbia River and locks located at Ice Harbor, Lower Monumental, Little Goose and Lower Granite Dams onthe Snake River. The upriver, or “shallow draft” Oregon ports are located near the McNary (Umatilla), John Day(Morrow), The Dalles, and Bonneville Dams.
Grain moving downstream toward the Port of Portland is the lifeblood of the barging system on the ColumbiaRiver/Snake River system. USACE statistics show that grain accounted for an average of 53 percent of allcommodity tonnage moving on the Columbia River portion of the system, as measured at the Bonneville Lock andDam, from 1993 through 2007. Upriver-bound movements of petroleum products are also key, accounting for anaverage of 20 percent of cargo movements at Bonneville Dam. Other commodities, such as forest products, sandand gravel, chemicals and fertilizer, and garbage made up the remainder.

Ports 2010: A New Strategic Business Plan for Oregon’s Ports 77
Between 2002 and 2007, the volume of grain shipped by barge on the Columbia River grew steadily, from 4.3million metric tons to 4.8 million metric tons. Petroleum products also saw strong growth, with total volume risingfrom 1.8 million short tons in 2002 to 2.1 million short tons in 2007. Forest products, on the other hand, did notfare as well. Paper and pulp volumes dropped from 232,000 metric tons to 165,000 metric tons, while other woodproducts remained essentially flat at 1.4 million metric tons.
The Commodity Flow Forecast process summarized recent trends. According to this data, the volume of grainmoving downstream by barge grew from 4.4 million metric tons in 1997 to 5.0 million metric tons in 2000. Thevolume of grain is projected to continue growing at an average rate of 1.8 percent per year, reaching 8.6 millionmetric tons in 2035.
Gravel and crushed stone is the other main commodity moving downstream by barge. The volume of gravel isreported to have dropped between 1997 and 2000, from 1.6 million metric tons to 1.2 million metric tons. Thevolume is projected to climb slowly between 2000 and 2020, reaching the 1997 level by 2020, and then remainingflat after that.
Empty containers are moved on the Columbia River/Snake River in relatively limited volume now, but this volumeis projected to more than double between 2000 and 2035, growing from 201,000 metric tons to 441,000 metrictons (primary upriver). Upriver barge flows are dominated by two commodities, gas, fuel, and petroleum/coalproducts, and gravel and crushed stone. These two commodity groups account for 87 percent of upriver cargo,and this share is not projected to change throughout the study period. Outbound flows of gas, fuel andpetroleum/coal products grew from 2.3 million metric tons in 1997 to nearly 2.8 million metric tons in 2000. It isprojected to continue growing slowly, at an average rate of 0.3 percent per year, exceeding 3.0 million metric tonsby 2035.
Upriver flows of gravel and crushed stone fell slightly between 1997 and 2000, but are projected to grow at anaverage rate of 0.7 percent per year between 2000 and 2035. These same two commodity groups account foressentially all internal (entire trip in Oregon) barge flows. The forecast 2000 to 2035 growth rate for gravel andcrushed stone is 1.5 percent per year, with a forecasted short-term decline over the next 2-3 years before risingagain. The volume of gas, fuel and petroleum/coal products shipped by barge through Oregon ports is projectedto grow throughout the period, from 508,000 metric tons in 2000 to nearly 1.0 million metric tons in 2035.

Ports 2010: A New Strategic Business Plan for Oregon’s Ports 78
ForecastsThe ODOT Commodity Flow Forecast anticipates that the volume of ocean cargo moving through Oregon ports willgrow over the next few decades. Outbound ocean freight is projected to grow at an annual average rate of 0.8percent, while inbound freight is projected to grow at an annual average rate of 1.4 percent.
These forecasts show that the single largest-volume inbound commodity type consists of petroleum and coalproducts, including gasoline and other fuel; this commodity group accounted for approximately two-thirds ofinbound ocean freight in 2000 but is projected to account for just over half of inbound freight by 2010. Despiteinbound volume growing at a very slow rate of 0.1 percent per year, the share of total freight accounted for by thiscommodity is projected to continue to decline through 2035, to less than 39 percent. Other commodities areprojected to grow at higher rates and thus comprise a higher share of overall inbound commodity flow by 2035.Inbound commodities that are projected to grow at much faster rates include nonmetallic minerals, nonmetallicmineral products, vehicles, metallic ores, and metals.
Outbound ocean cargoes consist primarily of dry bulk commodities, including grains, animal feed, chemicals, andfertilizers. The rate of growth of outbound ocean cargo is driven by the projected growth rate for grain exports.Grain accounts for nearly two-thirds of outbound ocean tonnage, and this share is projected to remain steady bythe year 2035.
The total volume of outbound ocean cargo is projected to grow at an annual rate of 0.8 percent per year betweennow and 2035. Grain exports are anticipated to grow at an annual rate between of 0.6 percent per year during thesame time period. Exports of base chemicals comprise slightly less than 13 percent of total outbound tonnagetoday; they are projected to grow faster than exports of grain, and by 2035 they are projected to account for morethan13 percent of outbound tonnage. Fertilizer also accounts for a substantial share of outbound ocean cargo, with11.6 percent of total tonnage today, and a low growth rate of 0.1 percent per year expected through 2035.
The Marine Cargo Forecast prepared for WPPA and WSDOT includes forecasts for goods moving through all portson the lower Columbia River, including those in both Washington and Oregon. This forecast calls for imports toOregon ports on the Columbia River to grow by an average of 2.6 percent per year through 2030, and exports togrow by 0.8 percent per year. Imports to Oregon Columbia River ports are projected to grow slowly over the nexttwo to three years and then grow at a much faster rate up to 2030. After 2010 the import growth rate is projected
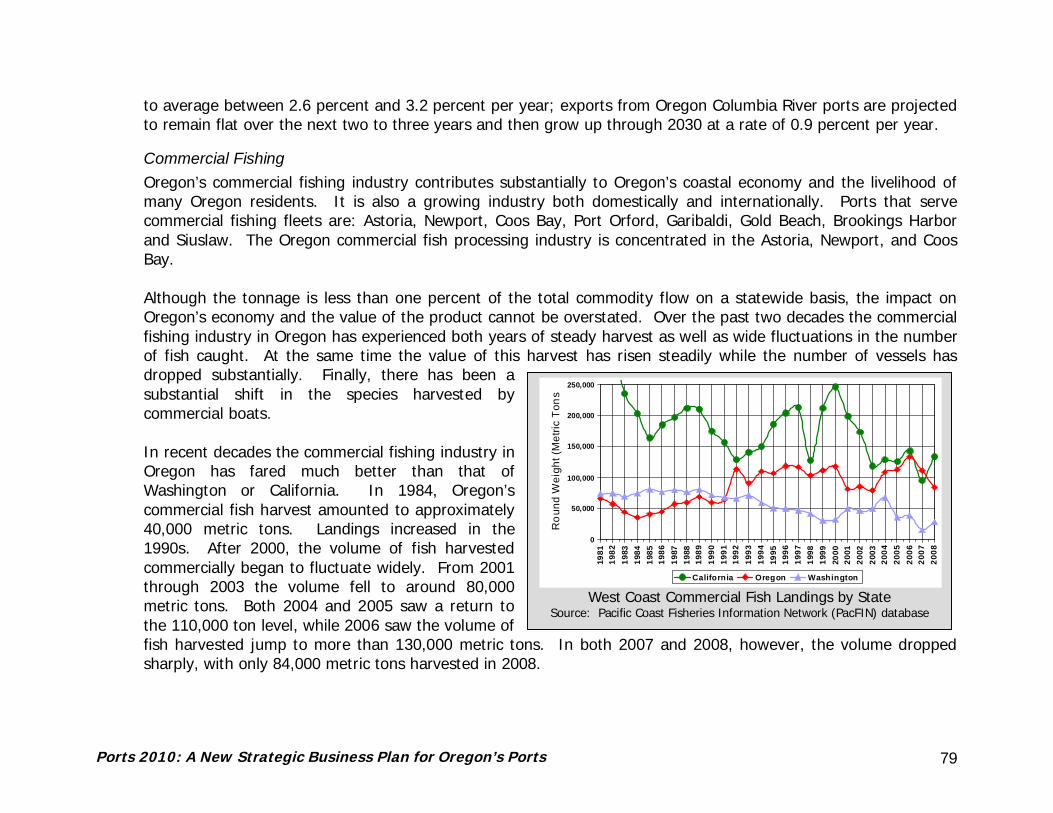
Ports 2010: A New Strategic Business Plan for Oregon’s Ports 79
West Coast Commercial Fish Landings by StateSource: Pacific Coast Fisheries Information Network (PacFIN) database
0
50,000
100,000
150,000
200,000
250,000
1981
1982
1983
1984
1985
1986
1987
1988
1989
1990
1991
1992
1993
1994
1995
1996
1997
1998
1999
2000
2001
2002
2003
2004
2005
2006
2007
2008
Ro
und
Wei
ght (
Met
ric T
ons)
California Oregon Washington
to average between 2.6 percent and 3.2 percent per year; exports from Oregon Columbia River ports are projectedto remain flat over the next two to three years and then grow up through 2030 at a rate of 0.9 percent per year.
Commercial FishingOregon’s commercial fishing industry contributes substantially to Oregon’s coastal economy and the livelihood ofmany Oregon residents. It is also a growing industry both domestically and internationally. Ports that servecommercial fishing fleets are: Astoria, Newport, Coos Bay, Port Orford, Garibaldi, Gold Beach, Brookings Harborand Siuslaw. The Oregon commercial fish processing industry is concentrated in the Astoria, Newport, and CoosBay.
Although the tonnage is less than one percent of the total commodity flow on a statewide basis, the impact onOregon’s economy and the value of the product cannot be overstated. Over the past two decades the commercialfishing industry in Oregon has experienced both years of steady harvest as well as wide fluctuations in the numberof fish caught. At the same time the value of this harvest has risen steadily while the number of vessels hasdropped substantially. Finally, there has been asubstantial shift in the species harvested bycommercial boats.
In recent decades the commercial fishing industry inOregon has fared much better than that ofWashington or California. In 1984, Oregon’scommercial fish harvest amounted to approximately40,000 metric tons. Landings increased in the1990s. After 2000, the volume of fish harvestedcommercially began to fluctuate widely. From 2001through 2003 the volume fell to around 80,000metric tons. Both 2004 and 2005 saw a return tothe 110,000 ton level, while 2006 saw the volume offish harvested jump to more than 130,000 metric tons. In both 2007 and 2008, however, the volume droppedsharply, with only 84,000 metric tons harvested in 2008.

Ports 2010: A New Strategic Business Plan for Oregon’s Ports 80
Oregon Commercial Fish Landings by RegionSource: Pacific Coast Fisheries Information Network
(PacFIN) database
0
20 ,0 00
40 ,0 00
60 ,0 00
80 ,0 00
1 00 ,0 00
1 20 ,0 00
1 40 ,0 00
19 8 1 1 9 85 1 98 9 1 9 9 3 1 9 97 2 00 1 2 0 0 5
Rou
nd W
eigh
t (M
etri
c To
ns)
Sou the rn O r eg on Coa s t N or th e rn O re g on Coa s t
The number of vessels in the Oregon commercial fishing fleet fell dramatically during the 1990s, from more than5,400 boats in 1990 to less than 1,300 boats in 1998, with the drop split evenly between the north and southcoasts. Along the south coast, Douglas County and Lane County lost the highest share of their fleet, and theremaining fleet is concentrated in Coos County and Curry County. Along the north coast Lincoln County andClatsop County have the largest share of the commercial fishing fleet.
Because of the depletion of the California, Washington and Alaskan fisheries, Oregon’s commercial fishing fleet isexperiencing more competition in the Pacific fisheries off of the Oregon coast from fishing fleets based in otherstates. Using resources such as the Pacific Fisheries Information Network, the Oregon Department of Agriculture,a fishing outlook report,14 and recent trends including establishment of Marine Reserves off the Oregon coast, thefollowing assumptions were made regarding growth in the industry as part of the Commodity Flow Forecast:
The southern Oregon Coast commercialfishing industry will experience continued decline of thecommercial fishing fleet, reduction of fisheries, speciesdepletion, and continued consolidation of the commercialfish processing industry. The ports have been makingfunding requests for cold storage and processing facilities,and it is assumed that these eventually will get built.Additionally, there is a small but growing industry oftransporting live commercial fish commodities. Thus theforecast is for an offset between the fleet decline, newstorage and processing centers, and the new live market,and commercial fishing growth on the South Coast will beminimal (but will not decline).
The North Coast will continue to experience constrained growth due to depletion of certain fish species, limitsdue to tribal fishing treaties, and competition from the Alaska and Washington fleets off the Oregon Coast, but it
14 “Oregon's Commercial Fishing Industry: Year 2005 and 2006 Review and Year 2007 Outlook”, Oregon Department of Fish and Wildlife andOregon Coastal Zone Management Association Inc., June 2007

Ports 2010: A New Strategic Business Plan for Oregon’s Ports 81
will continue to see some growth in demand. Thus, growth rates for North Coast counties will be approximatelytwo to three percent per year.
To keep pace with increased demand in Oregon, domestically in the US, and internationally, Oregon’s fishfarming industry as well as the Columbia River fisheries will continue to see moderate growth, on the order oftwo percent per year.
RecreationDuring the 1980s, the Oregon Coast charter industry diversified from complete dependence on salmon to otherspecies including bottom fish and now tuna and other species. This shift in focus was the result of a decrease inthe availability of salmon. However, salmon are still an important draw for recreational fishing to the Oregon Coast.The number of vessels in the recreational fleet in Oregon has dropped in recent years for the Oregon Coast andColumbia River regions, and this fleet is now concentrated on the southern Oregon Coast and lower ColumbiaRiver. Most of the decline in the recreational fleet was comprised of vessels that are small enough to betransported by trailer. The total number of vessels 27 feet long or less, and are located on the coast and river, hasdropped by nearly ten percent in the last decade. The number of boats that require moorage (larger vessels) grewby 50 percent, led by the Lower Columbia and the Coast.
In addition to locally-owned boats, marina facilities on the upper Columbia River serve boaters who cruise in fromout of the area, such as boaters based in Portland. Recreation, including eco-tourism, is expected to continue togrow as a larger part of Oregon’s key industries.
2. Forest Products OutlookForest products are one of two traditional mainstays of the Oregon coastal economy, and the fates of many portshave been tied to trends in the timber industry. According to data from the Oregon Department of Forestry15, Forthe last two decades timber harvest volumes have dropped by more than half, much of which occurred between1988 and 1996. Even before the peak harvest years of 1985 through 1989 there were negative signs - between1964 and 1973 the annual harvest exceeded nine billion board feet in five out of ten years; after 1972, however,the industry entered a long slump that saw harvest volumes drop to 5.7 billion board feet in 1981 and 1982. A
15 http://www.odf.state.or.us/divisions/resource_policy/resource_planning/Annual_Reports/rpt25YearHistory.asp

Ports 2010: A New Strategic Business Plan for Oregon’s Ports 82
Oregon Timber Harvest, 1960’s – 2000’sSource: Oregon Department of Forestry
recovery in the timber industry started in 1984 and lasted until 1989, with an average annual harvest of more thaneight billion board feet during the period. This recovery ended abruptly in 1990, and since 1994 the annualharvest has averaged approximately 4 billion board feet.
Much of the decline in timber harvestingoccurred in counties on the southernOregon Coast, declining slowly during the1960s and 1970s and then recovering formost of the 1980s. However, a steepdecline that started in 1989 continued forthe next decade, and as recently as 2005the harvest level in counties on thesouthern coast was less than half what itwas in 1988 and only one-third of the peaklevel of the 1960s. Northern Oregon Coastcounties also experienced a decline intimber harvests, but the level of timberharvest in this region is much smaller thanthat of the south, averaging one-quarter toone-third of the volume of the south.
Relatively little timber harvesting occurs along the deep-draft and shallow-draft portions of the Columbia River inOregon. Most of the timber harvest that does not occur along the coast takes place in inland counties, on thewestern and eastern sides of the Cascade Mountains, as well as in the Siskiyou Mountains in southern Oregon.The harvest trends in the inland counties have been similar to those of the south coast.
Waterborne movements of Oregon’s forest products are centered on the southern Oregon Coast, although trendsin the volumes of forest products moving by water reflect the level of timber harvest. The total volume of forestproducts moving through these ports dropped from 5.3 million metric tons in 1990 to 1.7 million metric tons in2007, a decline of more than two-thirds.
Ports 2010: A New Strategic Business Plan for Oregon’s Ports 83
The Port of Portland handles the next largest volume of forest products, but has also seen a sharp decline. In1990 this port handled more than 2.8 million metric tons of forest products, but by 2007 this volume had fallennearly 80 percent, to less than 500,000 metric tons. Waterborne movement through ports on the northern OregonCoast and lower Columbia River region have essentially disappeared, dropping from 1.0 million metric tons in 1990to just 33,000 in 2007.
Wood chips and wood in the rough (i.e. logs) are the two primary products moving through ports on the southcoast. In 2007 more than 1.3 million metric tons of wood chips were moved, accounting for more than 75 percentof all forest products. Logs accounted for approximately 17 percent, while lumber accounted for most of theremainder.
At the Port of Portland, approximately two-thirds of forest product movements consisted of paper products andwaste paper, with logs and lumber accounting for most of the remainder. One cargo that has nearly disappearedfrom Portland is wood chips - in 1990 the port handled more than 700,000 metric tons of wood chips, but by 2007this had fallen to just 1,000 metric tons.
In 1990 logs accounted for nearly three-quarters of northern Oregon Coast / lower Columbia River waterborneforest products, while lumber accounted for nearly 20 percent. Neither of those commodities are now handled byports in these regions.
The Commodity Flow Forecast indicates that forest and related wood/paper products as well as constructionmaterials that use forest products will show a lower than average growth rate between now and 2035.
3. Harbors of RefugeHarbors or Places of Refuge are ocean harbors which offer a place of refuge for a ship in need of assistance in asituation or severe weather. The intent is to provide a safe place to moor while the situation is being resolved orthe severe weather passes, to minimize the risk of loss of life or loss of the vessel, as well as minimizing the risk ofcreating an environmental or navigation hazard. Harbors of refuge are designated by agreement between the USCoast Guard, the Oregon Department of Environmental Quality, the Oregon Maritime Board and the Oregon StateMarine Board, and “Places of Refuge Project” of the Pacific States/British Columbia Oil Spill Task Force. InOregon, coastal ports except for the Ports of Toledo, Alsea, and Tillamook Bay serve as harbors of refuge; the Portof Brookings Harbor is a Port of Refuge for vessels up to 150 feet in length. The Oil Spill Task Force Places of
Ports 2010: A New Strategic Business Plan for Oregon’s Ports 84
Refuge effort is a work-in-progress16 which may involve federal funding to establish oil spill response infrastructureand crews at designated Places of Refuge, which would involve ports on the Oregon coast.
4. Energy OutlookOregon, through a variety of local, regional, state and federal efforts, is working to become a leader in developingand expanding alternative energy production, including wind, wave, solar, and bioenergy. The Oregon BusinessPlan strongly supports expansion of “green” energy, and the Oregon Business Development Department classifiesClean Technology (including renewable energy) as an Oregon Key Industry.
Wind energy primarily consists of large windmills (large propellers connected to a central turbine) which arelocated in wind-prone areas of central and eastern Oregon. The Ports of Portland and Morrow have been involvedin the movement of much of the wind energy equipment which is placed on truck or train to the assembly andconstruction site.
Wave energy or wave power is a new technology involving the capture of energy from ocean surface waves fromeither a floating vessel or device, which is collected in an on-shore distribution site. A 2004 report from theElectricity Innovation Institute17 studied a number of sites near coastal ports, including Astoria, Garibaldi, Newport,Siuslaw (Cushman, near Florence), Umpqua (Reedsport), Coos Bay and Brookings Harbor. While the report doesnot recommend or prioritize the sites, it does recognize the potential to compete and conflict with a number ofbusiness lines or operations involving Oregon’s coastal ports, including ocean shipping lanes and navigation,submarine cables and pipelines, commercial and sport fishing grounds, and environmentally sensitive lands.Benefits to coastal ports could include: land sales or leases for energy collection and distribution sites, relativelyinexpensive electricity from a renewable source, job creation, and potential for transport of wave energyequipment.
Solar energy is becoming a growth industry for Oregon. A number of solar manufacturers have been established,and lands in central and eastern Oregon which experience a higher level of sunlight are being viewed as potential“solar farms” (the Port of Kennewick in Washington state is one example). Not only do many of Oregon’s ports
16 http://www.oilspilltaskforce.org/docs/nrt_por_guidelines.pdf17 “E2I EPRI Survey and Characterization of Potential Offshore Wave Energy Sites in Oregon”, Electricity Innovation Institute, 2004.

Ports 2010: A New Strategic Business Plan for Oregon’s Ports 85
have industrial land which could be developed for solar manufacturing, Upper Columbia River ports haveundeveloped land which could be made available for solar farms.
Bioenergy (or biofuel) is renewable energy made available from materials derived from biological sources, orbiomass. Biomass is any organic material which has stored sunlight in the form of chemical energy; as a fuel itmay include wood, wood waste, straw, manure, sugar cane, and many other byproducts from a variety ofagricultural processes. Energy created from biomass includes ethanol and biodiesel. Ethanol production beganbooming in the mid 2000s due to tax incentives, and has become a substantial component of the overallbiomass/bioenergy program in Oregon. Ports including the Port of Morrow have opportunities to participate in thebioenergy market, through transportation of ingredients as well as providing land for bioenergy factories.ZeaChem, Inc. recently received a $25 million U.S. Department of Energy grant to build a demonstration bio-fuelproject at the Port of Morrow. This project will produce bio-fuel from nearby poplar trees. If this technology provesviable, then the production plant will expand and demand for rail transportation from that location will increase,both to important biomass as well as export processed biofuel. There will likely be other demonstration projects forbio-mass production in different parts of the state.
5. Outlook for MarinasHistorically, ports and other quasi-public agencies are asked to provide services that were needed by society butwere not profitable and therefore could not be provided by private enterprise. Examples include airports, marinasand public docks, and even some cargo facilities. Ports were allowed to establish a tax base to work from to fundthese facilities and programs as over time communities realized there is insufficient (or non-existent) privaterevenue available. Some of the ports try to take a business-like approach but recognize that they can’t chargeenough to replace the facility. In addition, there has been competition between the ports (and private operators)to keep their rates competitive. All of the ports consider marina operations to be an element of their contributionsto the local community and its economy, and in some cases consider marinas and other recreational business linesto be an obligation to the community.
From the interviews and data assessment, the financial and economic viability of Port-owned and operated marinasis mixed. In a number of instances, they do not generate enough revenue to cover all of their long term expenses,including debt service, maintenance and operations, and replacement. In order to make marina operationsprofitable, ports would need to charge rates that are market-compatible and ensure a high percentage (such as 75

Ports 2010: A New Strategic Business Plan for Oregon’s Ports 86
percent or more) of the slips are rented on an ongoing basis. A review of the results of the data assessmentindicates that many of the smaller ports are struggling financially as a whole, with a minimal operating reservecushion to continue to operate marinas profitably. Many of the south coast ports are facing some major overhaulof their marinas.
Marina moorage rates in the Pacific Northwest, including Oregon’s ports, vary widely. The highest rates are foundin the densest urban areas, with much lower rates found on the coast. Rates are charged in order to becompetitive with other ports’ marinas as well as those owned and operated by private interests. The docks andfloats in marinas typically have expected life spans of 30 to 40 years, and when they reach the end of their usefullives they must be rebuilt. A key issue with marina rates is whether or not they are high enough to cover costs,and the issue of costs raises a second key issue. Many marinas charge rates that are sufficient to cover operationsand maintenance costs, but few marinas charge enough to cover the cost of facility replacement.
The financing of replacement is typically handled through the issuance of bonds. If the moorage rates aresufficient to cover operations and maintenance as well as bond payments then revenue bonds may be issued. Ifthe marina rates are not sufficient then general obligation bonds backed by the port district, municipality, or othertype of marina owner will likely be required.
A review of moorage rates at port-owned marinas indicates that these rates are likely not sufficient to coverreplacement costs. Several recent projects in the Pacific Northwest have demonstrated that the moorage raterequired to cover construction costs for marina docks and floats can amount to $10.00 or more per foot permonth. In contrast, rates at port-owned marinas run between approximately $1.50 and $6.00 per foot per month.
The moorage market on the Oregon coast and on the Columbia River is probably not strong enough to allowmarina operators to raise rates to a level that would cover operating costs; however, these facilities are a keycomponent to the local economy in many areas, and in order to preserve those economies the cost of replacingmoorage facilities must be financed through tax revenues or grant programs.
Ports 2010: A New Strategic Business Plan for Oregon’s Ports 87
V. THE STRATEGIC PLAN’S RECOMMENDATIONSThis chapter assesses the past, present and future information to identify what the ports in Oregon need from the Stateof Oregon, and what the state needs from the ports. These findings form the basis for the recommended elements ofthis strategic plan.
The recommended Strategic Port Plan would be a business relationship between OBDD and each port. Therecommended approach for implementing this strategic plan is to work with each port to update their individual strategicplans. Each port would then be given an “opt-in” opportunity to formalize a business relationship between themselvesand OBDD. This relationship could be a formal arrangement via individual port funding requests to OBDD (and possiblyODOT through the ConnectOregon funding program), or through an all-inclusive agreement between the individual portsand OBDD. Each agreement would have certain core ingredients but would be tailored to the individual port, reflectingthe difference between ports.
A. The FindingsCompetition between ports is not as prevalent as originally anticipated when the strategic planning process started.While there is some competition for containers between the Ports of Morrow and Umatilla and minor amounts ofcompetition between marinas within the same geographies, ports generally have reduced competitive portfolios to reduceexpenses and improve cost-efficiency, or have developed inter-port agreements realizing that cooperation, rather thancompetition, is more beneficial to all ports.
The following are the major conclusions reached regarding the state’s existing Port Program housed in OBDD:
• Governance and Coordination: A better organization of port policy structure is needed within current statefunctions. While Oregon has existing programs that provide oversight and coordination of air, rail, and highwaytransportation modes, there is no current marine transportation program. Additionally, port-related functions arespread throughout a number of state agencies without a strong, centralized coordination function. Although thiscoordinated function is a priority under ORS 777.065, it has not been fully executed and requires improvement.
• Accountability: Improved accountability is needed for ports using state funding, and increased trainingopportunities and requirements are needed for port commissioners and key staff. There have been some
Ports 2010: A New Strategic Business Plan for Oregon’s Ports 88
documented and anecdotal reports of mismanagement of state funds and non-compliance with environmentalregulations.
• Investment and Infrastructure: The financial condition among Oregon’s ports is mixed: 17 of the 23 ports aretapping infrastructure fund reserves for operations, and many of those ports have less than six months of reservesavailable. The combined port-identified infrastructure needs exceed $500 million, not including the deferredmaintenance projects which exist at most of the ports or landside transportation infrastructure needs for portaccess. The State of Oregon and the legislature should recognize that the capital needs of ports are going unmetand that this has potential implications for the state’s economy. A number of large capital projects (jetty repair,marine facilities rehabilitation, cargo docks) are not funded, many of which will need federal funds. Current stateinvestment in ports is not always targeted towards the “key industry clusters” identified by OBDD; a port-focusedfunding mechanism is needed to tie these investments to the state’s business development strategy. Additionally,lack of state-level coordination on special opportunities, emergencies could miss future opportunities.
• Oregon’s Ports’ Needs: A stronger and coordinated statewide message and legislative presence with regard toport issues, funding, and economic development; higher level of state oversight in accountability; training of portmanagers and commissioners; strategic and priority-focused state funding, grants; regulatorycompliance/permitting assistance; and education, marketing, publicity, and advertising assistance.
• The State’s Needs: Ports to continue to be the local catalysts for economic growth of Oregon’s key industries;assurance that state funds are being used to further the state’s economic development goals and provide for areturn on the state’s investment in terms of job creation and retention, supporting Oregon’s key industries, andidentifying viable new industries that can benefit the state; highly trained and knowledgeable port officials who canwork with the state on these goals while complying with state and federal requirements.
B. Goals and ObjectivesThe Strategic Port Plan’s recommendations were driven by the following goals:
Improve state support and funding for ports to identify and grow their existing business lines,including marine transportation, property development, tourism and recreation, air and surface transportation, andmarine-dependent facilities.
Ports 2010: A New Strategic Business Plan for Oregon’s Ports 89
o Objective 1 - Establish adequate long-term funding mechanisms that enable Oregon to maintain andimprove infrastructure critical to the success of Oregon’s economy, including investment in the jetties,navigation channels, and cargo terminals and equipment that comprise the marine highway systems of theColumbia River and Pacific Ocean.
o Objective 2 - Develop criteria, funding and priorities for state participation that provide ports the tools toinvest in needed infrastructure improvements and property development while maintaining the ports’financial solvency.
Identify strategies for Oregon’s ports to tap into emerging markets and respond quickly to newopportunities
o Objective 1 - Develop decision criteria that would enable ports to access identified state funds in a timelymanner sufficient for the port to respond effectively to unexpected or unforeseen opportunities andemergencies.
o Objective 2 - In concert with other goals and objectives, establish increased coordination and marketingassistance to help ports identify and prepare for emerging markets.
Organize the State’s programs to facilitate the success of Oregon Portso Objective 1 - Establish a state staffing structure that coordinates port funding, advocacy and regulatory
programs among various state agencieso Objective 2 - Develop a coordinated “Issues and Actions Forum” among Oregon’s cargo ports and state
transportation agencies which recognizes the critical statewide significance of the Pacific Ocean andColumbia River marine highway systems to the future success of Oregon’s trade-based economy
Provide educational, outreach, training, advocacy and support for Ports.o Objective 1 - Develop and implement a training program for port officials, including elected/appointed
commissioners and senior staff, that equips them to carry out their duties in the most professional andethical manner
o Objective 2 - Develop an advocacy and educational program that clearly explains the value of Oregon’sports to the state economy and that provides substantive justification to state and federal legislators forports’ critical infrastructure needs
Ports 2010: A New Strategic Business Plan for Oregon’s Ports 90
Provide financing programs and investment strategies to improve the ability of Oregon’s ports topursue existing business lines and new markets.
o Objective 1 - Establish investment criteria, strategies and state investment priorities that improve thefinancial strength of Oregon’s ports while funding the State’s highest port and economic developmentpriorities
o Objective 2 - In concert with other goals and objectives, improve state funding of critical port infrastructureinvestment requirements to enable Oregon’s continued competitiveness in world markets.
Endorsement - Upon completion of public review, seek adoption of the Plan by appropriate state agencies alongwith indications of support by Oregon’s Port Districts and OPPA.
o Objective 1 - Seek input from public bodies who have a stake in Oregon’s ports, including city councils andcounty commissions, prior to adoption of the Plan by the Business Development Commission
o Objective 2 - Incorporate the Statewide Strategic Plan into future updates of individual port strategic plans.
Ports 2010: A New Strategic Business Plan for Oregon’s Ports 91
RecommendationsThe following section details each recommendation of the Strategic Port Plan. This strategic plan is a policy plan whichlays out the framework for a new business relationship between OBDD and each port. While its policies and frameworkwill take effect upon adoption, including requirements for updates to individual port strategic plans, there are a number ofother elements which will require an implementation process, and eventually legislative action, before they take effect.These are listed within each recommendation.
Unless noted within the recommendation, these recommendations are generally intended to apply to all of Oregon’s portsas well as generally applicable to the Oregon Business Development Department. However, differences between ORS777 and ORS 778 may lead to different implementation processes that OBDD will need to consider when developingindividual business agreements with each port. It should be noted that under the legislatively-directed reorganization ofthe former Oregon Economic and Community Development Department, the Oregon Business Development Departmenthas been split into two main functions: Business Development Division, which focuses on economic and businessdevelopment opportunities within the state, as well as job creation and retention, and the Infrastructure Finance Authority(IFA), under which state funding and financing of capital infrastructure improvements is housed. Under this restructuring,the Ports Program is located within the IFA, while the business development functions with which the Ports Program willcoordinate will still remain within Business Development.
Thus, the recommendations that apply to business and economic development will require the Ports Program managerand staff to directly coordinate with regional business development officers of OBDD, similar to the current arrangement.The primary difference rests with points of contact for each port; under the recommended Strategic Port Plan, ports willutilize the Port Program for initial and primary points of contact, and the Ports Program will be responsible forcoordination not only with other facets within the Business Development Department, but other state agencies as well. Itis anticipated that each OBDD/Port business agreement will lay out communications and coordination expectations.Eventually, any business development or infrastructure project opportunity will be led by a coordinated team of port andstate staff who will be working toward the common mission established in that business agreement.

Ports 2010: A New Strategic Business Plan for Oregon’s Ports 92
Recommendation 1: Revise State Port Program Institutional Structure into a Business Relationship witheach Port.
A number of institutional and governance structures were examined during the development of this strategic plan. Theseincluded those already in place in other states, as well as within Oregon. Through interviews with all of the stakeholders,it was clear that there was little desire for a state-level port commission or other strong state oversight function. Manywould like to see the port systemelevated at state level to a divisionlevel entity within OBDD (similar toODOT’s Highway or Rail Divisions),and similar to the structure in place inthe 1980s. Ports believe they need asystem where there is more influencewith the State Legislature, and manywould like to see educational outreachto state officials and state legislatorsabout the benefits of Oregon’s ports.
There is a general belief by the portsthat they are “on their own” forregulatory/ environmental compliancefor projects. Most would like to seesome relaxing of requirements orprocedures on certain state grants,but not for state administrative orregulatory support. About half of theports have been active throughConnectOregon, and they generallylike the level of administration and bureaucracy.

Ports 2010: A New Strategic Business Plan for Oregon’s Ports 93
While many ports use OSMB funding for recreational facility improvements, no “recreational” ports expressed an interestin spinning off their RV parks/marinas/parks and recreation function to a non-port entity, but instead felt that these werecommunity assets they want or were obligated to provide.
There was general support to improve training programs for port commissioners and port administrators. Whether thisshould be mandatory and a formal certification process generated mixed opinions among the ports. Smaller ports coulduse assistance with funding, paper/reporting requirements, and other work for which they lack staff.
Washington state and California have strong, well-funded port associations with training/outreach programs, conferences,economic studies, and subcommittees/functions. There is a strong desire to elevate OPPA to a similar role, but arealization that Oregon’s port tax structure is not as strong as Washington’s or California’s and therefore it is unlikely thatOPPA could be funded to the level commensurate with what is happening in either of those two states. Additionally,OPPA has been struggling to become financially stable and, in joining forces with SDAO, has nearly realized this goal.They are in the process of establishing a clear mission and a vision, and are working to gain favor within the port system.
Ports that move cargo and freight via road, rail, water and aviation would like to see some method of advancing freightrelated infrastructure issues forward (funding, capacity, economic development, etc) through some form of marine cargoadvisory committee or a focused marine transportation program within a state agency. Most of Oregon’s transportationmodes are represented in state planning and operations: highways are represented by ODOT’s Freight Mobility groupand Highways Division; rail is represented by the ODOT Rail Division, and air is represented by the Oregon Department ofAviation. The only mode not currently represented with a formal modal group is marine/water transport.
The recommended institutional structure is as follows:
Re-organize the institutional relationship between each port and the state. This relationship should takethe form of a formal business agreement through either a contract or memorandum of understanding, with OBDDacting on behalf of the State of Oregon and identifying the roles, , responsibilities, and expectations for each party(OBDD and each port). This would be an “opt-in” program; if the port desires OBDD staff support and fundingassistance, they can choose to enter into the business agreement; if they choose not to opt in they would notreceive OBDD assistance. Each agreement would have a provision to terminate the agreement based on agreed-upon circumstances. In developing and implementing these relationships, OBDD should consider differencesbetween ORS 777 and ORS 778.

Ports 2010: A New Strategic Business Plan for Oregon’s Ports 94
Establish a Training Program for Port Commissioners and Managers. This recommendation applies toports with elected commissions established and operating under ORS 777. Under this recommendation, OBDDwould establish and certify trainers in a port-oriented series of training workshops, and should utilize OPPA toadminister the training program as well as keep track of compliance and successful completion of training courses.The training program would likely be coordinated by OPPA through the SDAO, which already provides a number oftraining modules for general purpose government and special districts officials (but not specifically targeted toports). Requirements to attend training would be triggered by each port’s opting into the business agreement withOBDD, OBDD’s implementation of the new training program, and would apply to newly elected or appointedofficials or those current officials who want to take the training. OBDD would certify individual training programsrun by the ports themselves for compliance with the OBDD training requirements, or other associations such as theWPPA or the American Public Ports Association and would allow individuals who have successfully completed thesecertified training courses to opt out of taking the OBDD Port module. There would also be a pre-qualificationprocess whereby those who have demonstrated expertise and experience in port management and budgetingpractices can also receive a waiver from the training requirement.
For ports with commissions appointed by the Governor, OBDD will coordinate with the governor’s office to reviewthe criteria used to appoint those port commissioners as well as current port-offered training programs. The Portof Portland, for example, already provides rigorous training for its commissioners and staff. Reviewing what iscurrently being offered by ports with governor-appointed port commissions will help inform what level of training isneeded for the remainder of the ports and assist the state in implementation of needed training. Once that reviewhas taken place, OBDD will be able to determine the applicability of this recommendation to all ports andcoordinate with OPPA and SDAO to develop an action and implementation plan accordingly.
Increased Accountability: ports using OBDD funding would be required, through the formal businessagreement with OBDD, to provide periodic progress reports on the status of the grants or loans and an itemizationof expenditures. Additionally, OBDD will have the option of requesting the Oregon State Auditor to reviewindividual port audits).
Initial Homework: ports using the Port Planning and Marketing Funds will be required, through the businessagreement with OBDD, to do their “homework” consisting of a market feasibility study for proposed new businesslines or identification of how the proposed grant would further a state-identified key industry that the port is
Ports 2010: A New Strategic Business Plan for Oregon’s Ports 95
currently serving or is in the appropriate geography to serve. Ports would need to provide periodic progressreports on the status of the Port Planning and Marketing Fund grants and how the funds are being used.
Port Plans Should Demonstrate Local Coordination and Support. Strategic, master, and capital facilitiesplans for ports in Oregon will be required to demonstrate that the appropriate local government stakeholders, aswell as the community, have been involved in the development and review of these plans. Strategic plans shouldidentify the local or regional key industries that the port supports (including new or emerging industries) andindicate the level of support from the local entities and community for these key industries.
Develop Future Strategic Plans Consistent with the Statewide Strategic Plan Template: The StrategicPlan Template is presented later in this document. In this template, each port will be asked to identify one ormore “core functions” that the port provides and to identify current and new industries and economic developmentthat the port is expecting to support or help grow. The identified industries should be consistent with OBDD’s keystate industry list, or identified as key regional industries.
Updated Strategic Plans Should be Followed Up with Updated Capital Facilities Plans. As discussedearlier, deferred maintenance is a financial and economic problem for the majority of ports. If the port’s strategicplan identifies new infrastructure or upgrading of currently deficient infrastructure, the updated capital facilitiesplan should include reasonable cost estimates as well as estimated operating and maintenance costs for thesefacilities, and a determination made as to the financial capability of the port to own and operate these facilities.Additionally, the updated capital facilities plan should identify and assess utility needs and costs, whether providedby the port or by a non-port provider, which in either case would be a financial responsibility of the port to build,operate, and possibly maintain.
Suggested Implementation Process:
Training: For Ports established and operating under ORS 777, OBDD, in discussion with OPPA and SDAO will needto develop, approve, and initiate the port training program, which could easily be coordinated with SDAO trainingprograms already offered. Under this program, OBDD would certify trainers and the program contents; it wouldalso assess existing port-sponsored training programs that some ports may already offer to determine if thoseprograms meet OBDD’s training requirements. OPPA would host and market the training program and report toOBDD who has successfully taken the training course(s). OBDD will need to coordinate with OPPA to establish
Ports 2010: A New Strategic Business Plan for Oregon’s Ports 96
policies for waivers for those who have completed similar training programs elsewhere (these programs will needto be pre-qualified by OBDD), officials who can demonstrate comparable experience and expertise through thecurrent or previous experience, or other exemptions. For ports with commissions appointed by the Governor,OBDD will coordinate with the governor’s office to review the criteria used to appoint those port commissioners, aswell as reviewing current port-offered training programs, to determine applicability of this recommendation tothose ports. OBDD will then develop an action and implementation plan accordingly.
Implementation of individual port/OBDD agreements: the process of establishing these agreementsincludes defining the specific agreement type and content. It will take the form of an agreement between key portofficials and key members of OBDD, including the Ports Program manager. Implementation could take the form ofa memorandum of understanding, which could be structured so as to be signed by parties that can enter suchagreements for each entity: the port director for each port district, which could require prior approval by that port’scommission, and the Director of the Oregon Business Development Department. No legislative action isanticipated unless OBDD determines that differences between ORS 777 and ORS 778 result in difficulties orconstraints in implementing these agreements.
Individual port strategic plans: each port’s strategic business plan will need to be updated to incorporate theState’s Strategic Port Plan. Elements to be updated will be components of each business agreement. A templateis included later in this Statewide Port Strategic Plan.
Ports 2010: A New Strategic Business Plan for Oregon’s Ports 97
Recommendation 2: Revise and Elevate the Prominence of the Port Program Structure within StateGovernment.A number of governance and institutional structures were reviewed as part of the planning effort. They included adiscussion as to whether the state Ports Program should continue to reside in OBDD, shifted to ODOT, or perhapsreestablished as a new, state entity. In Oregon’s past, the Ports Program was originally located within ODOT, and thenwas shifted to OBDD in the 1970s, where it has since resided. During the data assessment and stakeholder inputdiscussions early in this planning process, it was clear that there was little support for creating a new state entity such asa state port commission. After reviewing the situation in other states, it is also apparent that Oregon’s ports are more ofa system of local business and economic development entities than in states where governance of the port program ishoused within a department of transportation.
It cannot be overlooked that there are significant contributions to Oregon’s economy by its cargo ports. Relocating thePorts Program within ODOT would elevate the marine transportation discussion and oversight for Oregon’s ports, butODOT’s business and economic development mission is different than OBDD’s, and OBDD’s business mission provides abetter match to what the ports are currently doing and their future needs.
While a number of ports receive funding from the OSMB for recreational/boating facilities, they also continue to beshepherds for economic development in their communities and have chosen to continue to work under the economicdevelopment charge given in ORS 777.
Thus, it is recommended that the state’s Ports Program remain within OBDD. However, to better foster therelationship between the ports and various functions within Oregon’s state government, the following are recommended:
OBDD’s Ports Program Should Coordinate State Port-Related Functions. In the short term, this wouldentail the Port Program manager seeking out internal or inter-agency agreements between OBDD and other stateagencies to gain time commitments from each group to dedicate to the Port Program. Agencies would includeODOT, OSMB, DLCD, and the Tourism Commission. The OBDD Port Program would also provide coordination anda review/comment forum for environmental compliance, regulatory agency reviews, and permitting on major portprojects requiring environmental review, similar to the “Collaborative Environmental and Transportation Agreementfor Streamlining” (CETAS) program that ODOT currently administers. In the long term, this would likely requirethree to four new OBDD staff in addition to the current Port Program manager to fully support this program; oncethis staffing level has been fully realized, the inter-agency agreements with other state agencies would no longer

Ports 2010: A New Strategic Business Plan for Oregon’s Ports 98
be needed for administrative assistance (although they would still be in place for regulatory assistance). Althoughincreasing the staffing level would require budget approval by the legislature, interviews with key legislatorsindicate a willingness to provide additional resources in the near term to transition the state’s port systemoversight to the recommended structure.
Establish an ongoing State Agency Coordination Program with regard to port strategic plans andfunding. As noted throughout this Strategic Plan, ports are involved with a number of state entities other thanOBDD in program development, capital facilities planning, and funding. For example, the Marine Board is at thetime of publishing this Strategic Plan updating its marine recreation facilities’ capital facilities plan and fundingprogram, which involve a number of ports. Also underway are budget planning and funding processes by theDepartment of State Lands and Department of Energy, both of which potentially involve port plans and projects.To ensure consistency between the different state agencies and each OBDD/port business agreement, the OBDDPorts Program should regularly and periodically coordinate with these other state entities, including participating inplanning and funding programming processes.
Create a Marine Transportation Mode Program within state government. Such a program would requirea new staff person to serve as marine transportation mode lead. The directors of ODOT, OBDD, Marine Board,Department of State Lands and Department of Environmental Quality would meet to identify which department isbest suited to house the new program and propose a funding package for legislative consideration. Further studyis needed to identify specific functions, roles and responsibilities, and reporting and decision-making structure ofthis new program. Possibly, this individual would be responsible for the Marine mode of the Oregon TransportationPlan (OTP) and would also be the lead liaison with ODOT’s other modal programs as well as the OBDD PortsProgram. They would oversee the federally identified marine highway system within the state, similar to how otherprograms oversee the rail, air, and highway systems, and would be one of the Oregon liaisons to the ongoingPlaces of Refuge planning efforts (see Page 79 for more information). This program would convene cargo ports todiscuss and list priorities for marine transportation system navigation, dredging, jetty repairs for all Oregon ports,and would coordinate the list with annual federal funding requests to the Oregon congressional delegation. It isalso recommended that the new Marine Transportation Program prepare a Marine Transportation Modal Plan,similar to the other OTP modal plans and also similar to the Florida and Louisiana plans, and also scope and seekfunding for a comprehensive study of the impacts, benefits and implications of remnant wood pilings in a numberof Oregon’s navigable waterways.
Ports 2010: A New Strategic Business Plan for Oregon’s Ports 99
Establish a New Cargo Port Advisory Subcommittee (or Port Navigation Subcommittee) at OPPA. Anew Cargo Port Advisory Subcommittee would be established at OPPA, with liaisons provided by the MarineTransportation Mode Program Lead as well as ODOT and an OBDD Port Program staff person. While thesubcommittee would emphasize its membership from Oregon’s marine cargo ports, others with navigation,dredging, or similar marine transportation issues could be invited to participate as well. The subcommittee wouldmeet quarterly or semi-annually and would use their meetings to vet port-specific and system wide cargo issuesincluding navigation, pilotage and pilotage fees, dredging, and overall marine transportation system needs. Thecommittee would identify a liaison to coordinate with OFAC and other state-sponsored advisory committees.Because of concerns about confidentiality of certain business agreements, ports participating in this group wouldnot be required to disclose confidential, private, or proprietary information. This new subcommittee may requirecargo ports to provide additional financial assistance to OPPA for staffing,
Suggested Implementation Process
The directors of ODOT, OBDD, Marine Board, Department of Energy, Department of State Lands and Department ofEnvironmental Quality would meet to identify which department is best suited to house the new program and propose afunding package for legislative consideration. Further study is needed to identify specific functions, roles andresponsibilities, and reporting and decision-making structure of this new program.

Ports 2010: A New Strategic Business Plan for Oregon’s Ports 100
This page intentionally left blank.

Ports 2010: A New Strategic Business Plan for Oregon’s Ports 101
Recommendation 3: Recognize the Importance of Oregon’s Ports within the State’s Economy
As mentioned earlier, one in every six Oregon jobs is related to or in some way dependent on Oregon’s ports. Oregon’sport business and market lines contribute billions of dollars per year to the state’s economy. The Oregon BusinessDevelopment Department recognizes key industries and emphasizes tax incentives, low-interest loans and other financeprograms, and its own business services to attract and promote these industries (it should be noted that these programsapply to other industries, but without the state emphasis). The state-recognized five key industries are AdvancedManufacturing, Clean Technology, Forest and Wood Products, High Technology, and Outdoor Gear and Apparel18.Oregon’s Marine Transportation System and Industry, strongly supported by Oregon’s marine cargo ports, plays a criticalrole in supporting all five key industries as well as other important components of the state’s economy such as agricultureand distribution.
Additionally, the Oregon Business Plan discusses the need to upgrade the state’s roads and bridges as one of itsinitiatives, and it also maintains the “Competitive Index”19. The Index measures the performance of a number of keyindicators that assess Oregon’s economic competitiveness in the Oregon Business Plan’s emphasis areas: PioneeringInnovation, People, Place, and Productivity. While the Index measures “bridge and road deficiency” and “airportperformance” under Productivity, it does not include measurements about Oregon’s multimodal freight transportationsystem, which highly integrates Oregon’s marine cargo ports into the overall freight transportation backbone supportingOregon’s industries.
Containerized, bulk, and intermodal goods transportation through Oregon’s ports has statewide impact on Oregon’seconomy, industries, and consumers. Thus, to recognize the importance of Marine Cargo transportation and ports aseconomic development entities under state statute, the State should as part of its own mission recognize andmake it a priority to support Oregon’s transportation and distribution system (marine as well as other freightmodes) through priorities for funding and administrative support, and through recognition in the Oregon BusinessPlan’s Competitive Index. Additionally, as part of this recommendation, the State should work with the ports todevelop a statewide Marine Transportation Plan as one of the state’s modal plans.
18 http://www.oregon4biz.com/The-Oregon-Advantage/Key-industries/19 OregonBusinessPlan.org

Ports 2010: A New Strategic Business Plan for Oregon’s Ports 102
Additionally, the State should recognize that Oregon’s ports support employment in non-cargo, regionally-significantindustries. While by themselves they may not have the statewide significance of the state-recognized industries, they arecritical to the economic well-being and livelihood of those living and working in those communities. The State should aspart of its economic and business development mission recognize and make it a priority to support regionally-significantindustries as part of its business mission with ports.
Suggested Implementation Process
OBDD should work with the state economist to identify and characterize the Transportation and Distribution system’simpact on supporting Oregon’s Key Industries, and recognize it within state functions and on state-supported marketingefforts, including the Business Oregon and Oregon Business Plan websites. Additionally, as part of the recommendationto develop a Marine Transportation function, ODOT and OBDD should seek through the next legislative session funding todevelop the first Marine Transportation Plan as one of the modal plans under the Oregon Transportation Plan. OBDDshould also maintain and periodically update the list and map of state-significant and regionally-significant industries asthey relate to Oregon’s ports as each port updates its strategic business plan. The map below shows the currentlyidentified state-significant and regionally-significant industries that were identified through the Statewide Port StrategicPlan, while the table below shows the regionally-significant industries supported by each of the ports.
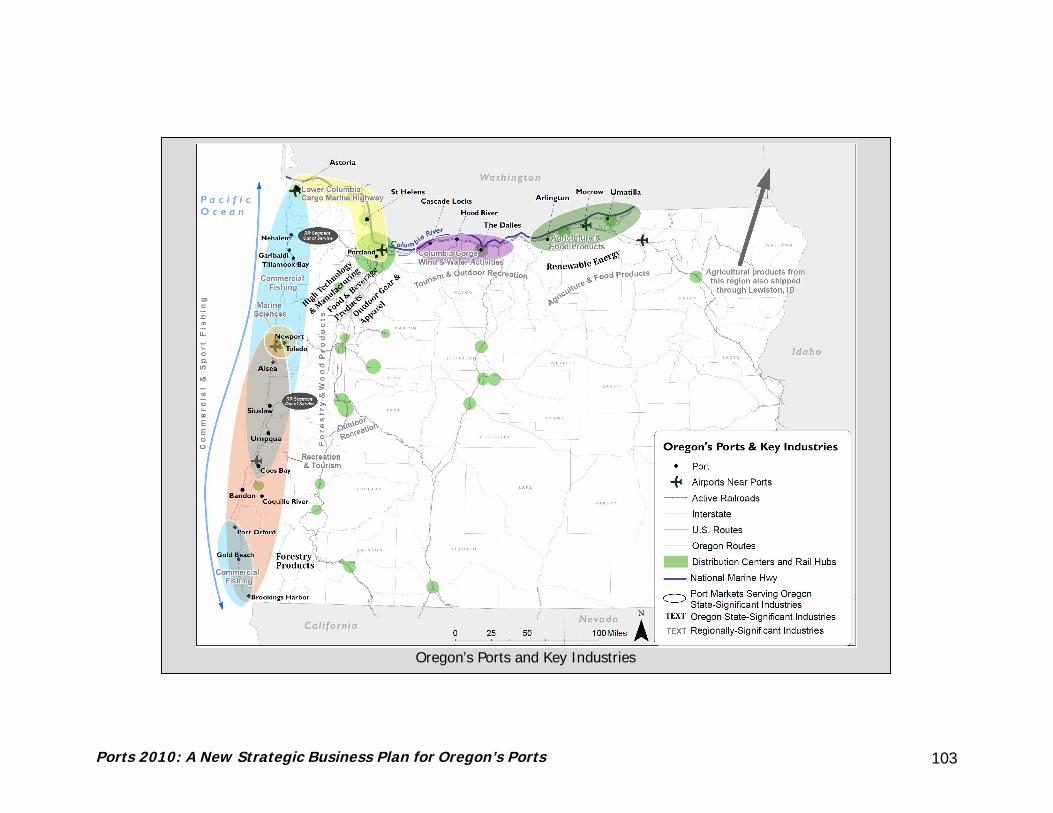
Ports 2010: A New Strategic Business Plan for Oregon’s Ports 103
Oregon’s Ports and Key Industries

Ports 2010: A New Strategic Business Plan for Oregon’s Ports 104
Oregon’s Ports and Relationship with State/Regional Key Industries
Ports 2010: A New Strategic Business Plan for Oregon’s Ports 105
Recommendation 4: Create a Port Investment Fund and Statewide Port Capital Facilities Plan.This recommendation consists of two components: development of a statewide port capital facilities plan (CFP), andestablishment of a new, centralized port infrastructure funding source called the Port Investment Fund (PIF). Both thePort CFP and the PIF would have components based on port size and market differences. These components will fundthe state’s highest port priorities based on need, job creation, ability to advance Oregon’s key industries, and financialability to operate and maintain the investment. The existing Port Revolving Fund and Marine Navigation ImprovementFund could be separately retained or combined to initiate the new PIF, and ports would continue to be eligible forConnectOregon funding. This program will need legislative approval to establish the new fund and adoption of anadministrative rule to establish criteria and how it will be administered.
Under the program described below, the state definition of port size, which is used in summarizing the Port AuditSummary, would be used:
Small ports are those with less than $4.5 million in assets (8 ports currently in this category)Medium ports are those with $4.5 million to $15 million in assets (7 ports currently in this category); andLarge ports are those with more than $15 million in total assets (includes 8 ports).
This new program would be a two-step process, approved and administered through the Infrastructure Finance Authority(IFA):
Port Capital Facilities Plan: First, ports would be asked to convene and under the oversight of IFA andadministered by OBDD, develop a five- or six-year capital facilities plan (CFP) of the top port priorities around thestate for which state funds may be sought. The CFP should identify existing funding sources which could be soughtfor projects, as well as identify the “unfunded” or shortfall of funds. This funding shortfall could be used as a basisto seek funding from the legislature for the PIF. This CFP project list could also include projects identified by theMarine Transportation Modal Program through the proposed Marine Transportation Plan. The CFP should beupdated every biennium to precede the major budgetary legislative session, in the event that additional funds forthe program will be sought or the project list has been amended. The CFP should receive endorsement by the IFABoard. This list should be separated into small/medium and large port categories, and the process could befacilitated through OPPA with support from OBDD.
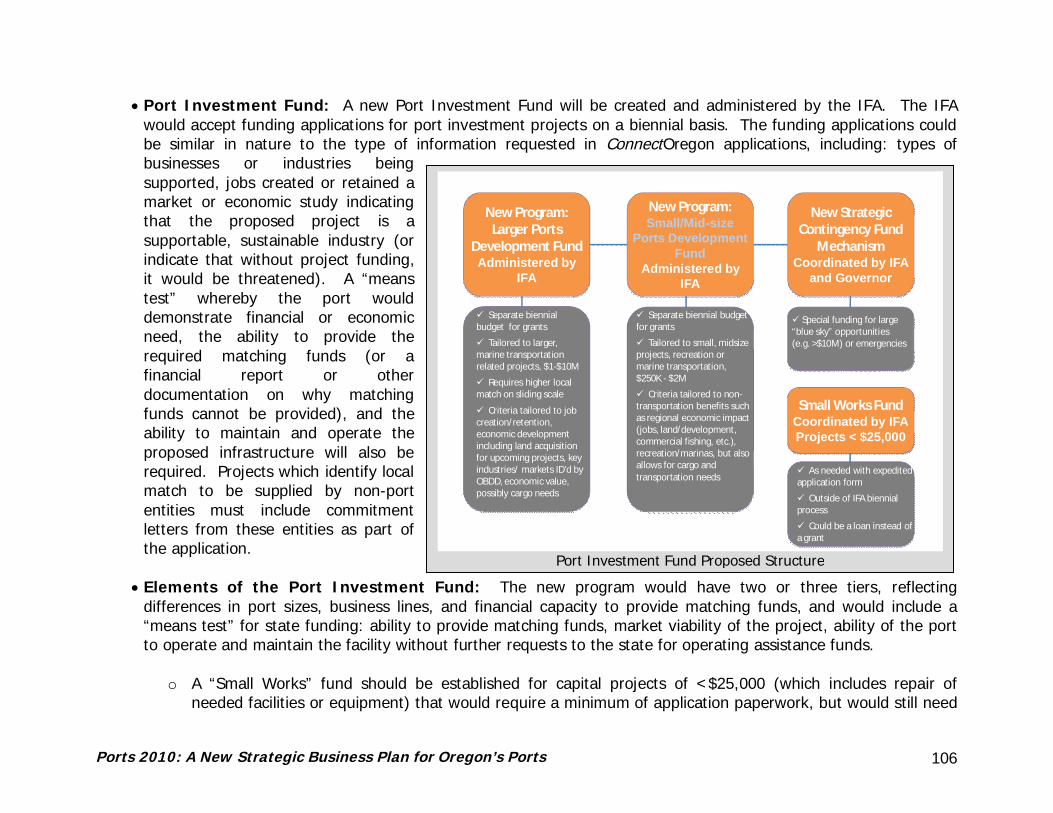
Ports 2010: A New Strategic Business Plan for Oregon’s Ports 106
3
New Program:Larger Ports
Development FundAdministered by
IFA
New Program:Small/Mid-size
Ports DevelopmentFund
Administered byIFA
New StrategicContingency Fund
MechanismCoordinated by IFA
and Governor
Separate biennialbudget for grants
Tailored to larger,marine transportationrelated projects, $1-$10M
Requires higher localmatch on sliding scale
Criteria tailored to jobcreation/retention,economic developmentincluding land acquisitionfor upcoming projects, keyindustries/ markets ID’d byOBDD, economic value,possibly cargo needs
Separate biennial budgetfor grants
Tailored to small, midsizeprojects, recreation ormarine transportation,$250K - $2M
Criteria tailored to non-transportation benefits suchas regional economic impact(jobs, land/development,commercial fishing, etc.),recreation/marinas, but alsoallows for cargo andtransportation needs
Special funding for large“blue sky” opportunities(e.g. >$10M) or emergencies
Small Works FundCoordinated by IFAProjects < $25,000
As needed with expeditedapplication form
Outside of IFA biennialprocess
Could be a loan instead ofa grant
Port Investment Fund Proposed Structure
Port Investment Fund: A new Port Investment Fund will be created and administered by the IFA. The IFAwould accept funding applications for port investment projects on a biennial basis. The funding applications couldbe similar in nature to the type of information requested in ConnectOregon applications, including: types ofbusinesses or industries beingsupported, jobs created or retained amarket or economic study indicatingthat the proposed project is asupportable, sustainable industry (orindicate that without project funding,it would be threatened). A “meanstest” whereby the port woulddemonstrate financial or economicneed, the ability to provide therequired matching funds (or afinancial report or otherdocumentation on why matchingfunds cannot be provided), and theability to maintain and operate theproposed infrastructure will also berequired. Projects which identify localmatch to be supplied by non-portentities must include commitmentletters from these entities as part ofthe application.
Elements of the Port Investment Fund: The new program would have two or three tiers, reflectingdifferences in port sizes, business lines, and financial capacity to provide matching funds, and would include a“means test” for state funding: ability to provide matching funds, market viability of the project, ability of the portto operate and maintain the facility without further requests to the state for operating assistance funds.
o A “Small Works” fund should be established for capital projects of <$25,000 (which includes repair ofneeded facilities or equipment) that would require a minimum of application paperwork, but would still need

Ports 2010: A New Strategic Business Plan for Oregon’s Ports 107
to demonstrate that the proposed use is consistent with the Port/OBDD business agreement and that theport can afford to operate and maintain this project without further state assistance. Emergency projectswould have a small local match or a waiver of the match requirement. The fund would be set up to handlefunding requests as loans instead of grants.
o A Small/Medium size port investment fund (non-cargo projects) should be directed at priority projects whichserve port market portfolios except for marine cargo projects, which would be eligible under theMedium/Large PIF program.,.
o A Medium-Large-size port investment fund which includes marine cargo projects. This would be aimed atthe larger, cargo-oriented ports and fund larger-scale projects. It is expected that ports in this programhave a revenue and financial structure better able to accommodate larger projects and a larger local match.
A two-step process would be used to qualify ports for use of the Port Investment Fund (“means test”) as well asevaluate and prioritize projects (programming), as follows:
Means Test: This step “pre-qualifies” ports in order to pursue the PIF for their infrastructure projects. Minimumrequirements would include having a fully-executed OBDD/Port formal agreement and being in compliance with itsterms and conditions, having an OBDD-approved Strategic Business Plan and Capital Facilities Plan (OBDD wouldhave the option to qualify a previously-completed plan, or pre-qualify based on an active plan update or revision),and the port being in satisfactory financial condition, demonstrating the ability to operate and maintain new capitalfacilities along with having at least six months of operating reserves.
Project Prioritization Process: In order to be eligible to be considered for the PIF, a project must be on thestatewide five-year port capital facilities list (this requirement could be waived for Small Works projects), musteither implement a business element contained in the port’s strategic plan, or if a new market, must complete the“homework” needed to address viability of new market. Priority would be given to projects which fill a state orport priority funding need, with emergencies constituting a higher priority. Points would also be given for projectsfrom ports demonstrating financial responsibility: credit given for positive financial performance of port, andprevious financial responsibility on previous grants/projects, and operating reserves > two years. The port mustdisclose all funding sources they are seeking for the project. Priority would also be given to projects whichleverage private or federal investment (especially where there is private funding for the project). Matching fundsprovided on a “sliding scale” percentage basis, based on port’s regular revenue (not grant funds) from prior audit,and size and scale of overall port operations (port assets as categorized by the State), up to a 50 percent match
Ports 2010: A New Strategic Business Plan for Oregon’s Ports 108
requirement. Other criteria should include: return-on-investment in terms of job creation or retention; retaining orinitiating new business lines identified as strategic for the port as part of its Strategic Business Plan or identified aseither a Regional or State Key Industry; if the project is a deferred maintenance project identified as strategicbased on the port’s Strategic Business Plan.
Suggested Implementation Process
The entire structure of this program will need to be developed, including: how the Small Works program will beadministered, what information and compliance will be required for the streamlined funding application, how theindividual elements such as the Small/Medium Port and Large Port programs will be administered, and the fundingtargets. Implementation will require IFA to administer the development of a short-term capital facilities priority list (five-or six-year plan) as well as the funding criteria and evaluation process. Legislative action (possibly in the 2011 session)will be necessary to establish the program and provide funding.
Until the legislature acts to establish funding for this program, the following process could be used in the interim:
Under the oversight of IFA, OBDD and the ports could work to develop and adopt a 5-year prioritized CFP,which would identify statewide port infrastructure needs and the funding gap or shortfall to fully fund thelist.OBDD works with OPPA and the Marine Board to identify and prioritize port-sponsored marine recreationprojects that would be included on the OSMB’s six-year CFP.OBDD, under IFA’s oversight, develops the structure for the PIF, as well as potential funding sources for theprogram, which could be used to approach the legislature in an upcoming session.

Ports 2010: A New Strategic Business Plan for Oregon’s Ports 109
Alternative Port Infrastructure Funding Program
During the review process of this Strategic Plan, a number of concerns were expressed regarding the continued andenhanced practice of providing funds exclusively for ports, or any other targeted group. The concerns are two-fold:
Why the ports should have their own fund for typical infrastructure activities that are also funded by other IFA(and other) programs accessible by Ports, andThe ability of the state to manage and administer separate, individual funding programs for a variety of specialdistricts or public entities such as cities and counties in an era of limited resources for all state infrastructureneeds.
A second option is proposed which would give the ports a funding target as part of a larger infrastructure program. Inthis case, the existing Special Public Works Fund (SPWF) would be expanded into a revised program which would stillconsist of primarily loans as well as grants, but the maximum loan and grant amounts would be increased and the overallprogram would receive a higher funding level (contingent upon legislative adoption of this new program). The expandedSPWF would be administered through the IFA as the SPWF is now, and the eligibility list for the program would remainthe same (cities, counties, airport and special service districts established under ORS, Tribal Councils of Indian tribes, andports). The IFA would establish a multi-year funding program, and ports would for the first time have a targeted fundingamount, especially for historic Port Planning and Marketing fund support. This would be consistent with other planninggrant targets within the current SPWF program for municipal planning and feasibility studies. The expanded SPWF wouldalso have separate targets for small/medium and medium/large ports similar to what was described earlier in the PIFrecommendation. Also as discussed earlier under the proposed PIF, a Small Works program could be established butwould be open to all eligible entities.
As with the PIF option above, this concept could also include the “means test” underwriting approach whereby OBDDwould pre-qualify, or underwrite the port, and then funded projects, based on compliance discussed earlier under “MeansTest”. The advantage of this approach is that ports could pursue larger projects from a larger, overall funding pool, aswell as having the opportunity to jointly pursue water and sewer projects with their local utility providers where the portis seeking to extend service, while still having an established funding target in the program. This also helps get to theloan-grant decisions and collateral determinations based on project size and port size and financial capacity. The otheradvantage is that funding priorities, accounting, and administration of the program would be consistent across the various

Ports 2010: A New Strategic Business Plan for Oregon’s Ports 110
entities, instead of having separate criteria and levels of state staff oversight as would occur if the SPWF and PIF wereseparate programs.
Under this option, separate statewide capital facilities plans could be developed for ports and for utilities (water andsewer) which would identify comprehensive lists of project backlog and funding needs for which state funding would besought. These CFPs would give the IFA Board and the legislature a much more comprehensive understanding ofinfrastructure funding needs of ports and water and sewer providers. Funding criteria would likely need to be revisedfrom the current SPWF criteria to reflect the difference between port and utility providers as well as return-on-investmentcriteria that have been included in recent funding programs such as ConnectOregon.
Ports 2010: A New Strategic Business Plan for Oregon’s Ports 111
Recommendation 5: Port District Consolidation or Elimination is a Local Decision Item.
At the beginning of this planning process the topic of port consolidation or elimination was discussed. There have beendiscussions and at least one previous study of port consolidation (Port Consolidation Study, Ports of Garibaldi, Nehalemand Tillamook Bay, report by The Benkendorf Associates, Corp. December 2008). Late in the 1990s there wasconsideration by Malheur County for a “dry land” port which received endorsement by the Oregon Economic andCommunity Development Commission, but local officials were unable to pass a tax base and the interest apparently haswaned. Other than these instances, no other recent considerations of port consolidation or elimination were identifiedduring the development of the Statewide Port Strategic Plan.
Although port districts are allowed under Oregon statute, they all were, and must be, created via local referendum.Elected Port commissioners are subject to local recall under Oregon elections statutes. The information collected as partof the Port Strategic Plan resulted in findings that each port is considered a critical component of their individualcommunity’s economic development vision, and have the ability to tap into a number of state and federal resources tohelp realize that vision. At this time there are no ports which are receiving operating assistance from OBDD.
In terms of economic development, ports continue to adapt to changes in local market conditions and business lines. Anumber of ports continue to support the type of industries that OBDD has identified as key industries for the state. Theports often depend on state assistance and support in furthering these state-significant industries, but they also utilizelocal revenues to do so and develop business lines that may be of local and regional interest instead of a state-identifiedkey industry.
It is the recommendation of this Strategic Port Plan that decisions on port consolidation, elimination, and local businesslines (which do not use state funding or support) continue to rest with the local port district, its officials, and itscommunity.
Ports 2010: A New Strategic Business Plan for Oregon’s Ports 112
C. Phasing in the RecommendationsAs noted above, implementing all of the recommendations contained in this Strategic Port Plan will need to occur inphases. Some of the recommendations will require administrative action within state government, while others willrequire legislative action. Additionally, the institutional recommendations pertaining to the Ports Program and a newMarine Transportation Program will require additional staffing levels to be fully realized, and on an interim basis willrequire inter-agency agreements within the state to implement.
The following phasing strategy is recommended for the three main recommendation categories: Institutional, Funding,and Policy.
Institutional and Staffing
The following elements of Port Program functions will be required when these recommendations are fully implemented:
Completion of the individual port strategic business plans
Oversight of the individual port strategic planning processes
Multi-agency coordination and development of interagency agreements for improving permitting and coordinatingon environmental studies and permitting processes
Increased focus on federal lobbying issues and funding requests to the Oregon congressional delegation
Assisting ports with development of infrastructure master plans as appropriate
Recapitalization of the Port Revolving Fund
Implementation of the new port programs
Ports 2010: A New Strategic Business Plan for Oregon’s Ports 113
Development and implementation of state accredited training program including identification and development ofa best practices handbook
Port Reporting System update (which would help with requests for Army Corps assistance)
Maintaining up to date port project list quantifying infrastructure needs and deferred maintenance backlog as wellas development and implementation of port project prioritization process
Staffing Marine Project Review Committee as part of Connect Oregon process
Coordination aspects: continued direct coordination with all ports, liaison with OPPA, improved Coordination withODOT on variety of transportation related issues (Marine Transportation Plan, industrial lands, and port-related railissues), liaison to the new Marine Cargo advisory committee.
Updating/revising ORS 777 (and possibly ORS 778 based on requests from the Port of Portland).
Fully implementing these recommendations will require a Port Program staffing level that is similar to what the PortsDivision had in the mid-1980s: five, full-time equivalents. At that time, the Ports Division staff included a Port Managerwho would also be the Ports Program’s liaison to the new Marine Transportation Program, an outreach person who wouldalso coordinate the training program, a state/federal/regulatory agency liaison, a program manager for the new PortInvestment Fund, and an administrative assistant for the program (which could be shared with other OBDD functions).This would be in addition to the business and economic development staff that already exists within OBDD and continueto coordinate with ports as business and economic development entities. Thus, the recommendations would require anadditional 3-4 FTE in the Ports Program over current levels. Creating a new Marine Transportation Function within thestate would require one new FTE, which would be located based on decision from the proposed department directors’meeting.
Immediately upon adoption or endorsement of this Plan, OBDD should continue to work internally, as well as externallywith other state agencies, to develop agreements which will establish departmental commitments or priorities for port-related functions. The first agreement should be with other state agencies to partner in establishing a MarineTransportation program (which in itself would require a new FTE).

Ports 2010: A New Strategic Business Plan for Oregon’s Ports 114
The status quo (1 FTE in the Port Program) will oversee the completion or updates of the individual port strategic plans;however, a portion of the funding dedicated to the updating of these plans should be reserved either to hire a temporaryposition or retain a consultant to provide oversight and coordinate reviews and comments on the expected 16 or 17 planupdates expected within the first year after the adoption of the Statewide Port Plan. If the legislature establishes a newPort Investment Fund in the 2011 legislative session, the second priority should be to add 2 FTEs to implement the PIF,which would entail overseeing the establishment of a five-year Statewide Port Capital Facilities Plan as well as identifyingfunding priorities for the first two years of the PIF, as well as initiate the training program for Oregon’s ports.
The next priority will be to establish a new FTE to be a port program liaison to the state and federal regulatory andenvironmental permitting process. Adding back the administrative assistant was our third priority.
Funding Levels and Restrictions
A consideration as part of financially supporting new staff positions needed to fully implement these recommendationsincludes recapitalization of the Port Revolving Fund. Funding to support an elevated Port Program could come throughinterest payments on a Port Revolving Fund that is recapitalized to a higher level than what it is today.
With a backlog of on-site port infrastructure projects exceeding $500 million, and the backlog of navigation, channelclearing and deepening and dredging projects exceeding $400 million, funding port infrastructure investments will requirea much more aggressive and a higher funding level than what is currently available. At a minimum, the PIF shouldeventually provide $10-15 million per biennium if it is to sustainably reduce the port backlog of infrastructure anddeferred maintenance projects over a 20-year period.
There are already a number of funding programs, such as ConnectOregon, transportation funding under the StatewideTransportation Improvement Program, the Marine Board, and other programs listed earlier in this document for whichports can compete. Over the past two or three biennia, these programs in total have provided funding for port-sponsoredprojects that is within the $10-15 million per biennium range.
Ports, as well as other project sponsors, regularly attempt to package funding from a variety of sources to gain larger,fully funded projects. Creating a dedicated fund such as the PIF will enable ports to tap into a program which couldprovide the matching funds needed to fully fund these larger projects. In order to avoid ports submitting duplicative

Ports 2010: A New Strategic Business Plan for Oregon’s Ports 115
funding requests (applying for the same funding from multiple funding sources), ports should submit an overall fundingprogram with each funding application that clearly shows which funding sources, and amounts, are being requested.
Funding for the PIF should be implemented over multiple biennia, reaching eventually a level of $10-15 million perbiennium. OBDD should seek a starting level of $3-5 million for the first biennium in the 2011 session, raising to $5-10million for the next biennium (2013-2015), and then achieving $10-15 million per biennium starting with the 2015-2017biennium. The Five-Year Capital Facilities Plan which is recommended to be developed prior to initiating the PIF programshould identify statewide port project priorities, as well as potential funding sources beyond the PIF to fund theseprojects, as a general funding program.
The Port Program manager, under the administration of the IFA, should establish an advisory group to develop fundingcriteria as well as establish funding policies. These criteria should take into consideration the “return on investment”emphasis of the state legislature for state investment in the port system, similar to how ConnectOregon evaluatesprojects, and should also require ports to provide a listing of other funding sources expected to be sought and utilized forprojects funded through the PIF.
The new Strategic Contingency Fund should be set at a level to provide financing capabilities for projects of up to $100million. Examining the special circumstance cases that have arisen recently (the NOAA project, rail closures and rail linepurchases, new international cargo terminal, etc.), a level of $100 million should be sufficient to accommodate most ofthese emergency or special circumstance request. At least ten percent of this fund should be capitalized ($10 million incash reserves) with the rest falling within the state’s bonding capacity.
The Small Works Project program should have “upside” requirements, such as a maximum number of requests a port canmake each year (such as two), or a total maximum dollar amount a port is awarded each year (such as $50,000).
Ports 2010: A New Strategic Business Plan for Oregon’s Ports 116
This page intentionally left blank.
Ports 2010: A New Strategic Business Plan for Oregon’s Ports 117
D. Template for Port Strategic PlansThe following is a proposed template for new or updated existing port strategic plans in order to be consistent with thisStatewide Strategic Port Plan. It is offered as a general guide to the development of strategic plans for ports in Oregon.Each port’s business agreement will provide the opportunity to modify or streamline this template. It is not expected thatevery port will be required to address every topic in the template, but rather that each update will represent a significantstep towards an effective program to address their major business and organizational challenges.
It should be noted here that this template is focused on developing strategic business plans, which serves as the visionand guidance document for port master planning and capital facilities planning. The following definitions are offered todifferentiate between these documents:
Strategic Business Plan
A Strategic Business Plan is comprised of two parts:
An assessment of the port’s existing operations, facilities, markets and financial condition.A description of the port’s long-range vision and mission statement, and goals, policies and strategies designed tomanage the port’s assets, resources and capabilities over a specific time period, in order to fulfill the mission.
Capital Facilities Plan
A Capital Facilities Plan describes the planned capital improvements to the port’s land, buildings, facilities and equipmentfor a specific time period, such as 10-20 years. The plan should be divided into prioritized phases (such as 5-yearincrements) and illustrate the preliminary cost, time frame and potential funding source(s) to implement each project.
Facilities Master Plan
A Facilities Master Plan is a plan for maintaining and improving each port facility (such as a dock or boat ramp), utilitysystem and other infrastructure elements such as; streets, lighting, pedestrian walkways and security.NOTE: The Dept. of Land Conservation and Development’s (DLCD) administrative rule for Goal 11- Public Facilities,includes the following definition: “A public facility includes, water, sewer, and transportation facilities, but does not
Ports 2010: A New Strategic Business Plan for Oregon’s Ports 118
include buildings, structures or equipment incidental to the direct operation of those facilities.” A Public Facility Plan’scomponents (per DLCD) are described in OAR 660-011-0010, and include an inventory and general assessment of thecondition of all significant public facility systems, a list and description of significant public facility projects and planning-level cost estimates, a policy statement indicating the provider of each system, and funding options as well as prioritiesfor these facilities.
Strategic Business Plan Template
1. Port History and Mission: a brief introductory statement summarizing when the port was established and for whatpurposes (i.e. what prompted the formation of the port?), a statement of the port’s current mission and why, howthe mission changed from the port’s original purpose, and definitions of terms used in the mission statement (suchas family-wage jobs, financial return, create and retain jobs, quality of life, economic diversification, communitydevelopment, economic development, etc.).
2. Port’s Overall Goals: brief overview of the port’s overall goals for specific areas, which should include (ifapplicable): marine property and facilities, industrial property, commercial property, recreational property andfacilities, aviation property, management and commission structure, financial, environmental, and other factorsimportant to the strategic plan.
3. Overview of the Strategic Plan’s Development Process: coordination and involvement of local entities and thecommunity, land use coordination efforts with local entities and DLCD, process steps or phases, and adoptionprocess should be summarized.
4. Port Overview and Description:a) Port Resources: What net revenue does the port derive from operations, both before and after depreciation is
accounted for? What tax or other ongoing non-operational revenues (timber receipts, OSMB maintenancegrants, Federal Aviation Administration funds, etc.) does the port receive? Are port properties included in anUrban Renewal District generating monies for specific port projects? How many months of cash reserves doesthe port currently have, utilizing the latest budget and audit? What is the annual average of grant dollars theport has received during the past five years and what have they been used for?
b) Port Policies and Procedures: What is the management structure and what is the division of authority betweenmanagement and the commission? All policies and procedures should support the port mission statement. Do

Ports 2010: A New Strategic Business Plan for Oregon’s Ports 119
these policies encourage/require training of port commissioners and management staff? Does the port haveestablished governances and what do they say about the division of authority, commission conflict of interest, arequirement that the commission follow proper procedures, and a clear definition of fiduciary responsibility andconflict of interest? Include governances as an appendix to the plan. In this template “governances” refers toany internal oversight, administrative, bylaws or policies that relate to the relationship between PortCommissioners and management, as well as the roles and responsibilities of each.
c) Commission: Who is on the board, how long have they been on the board, and what are their backgrounds?Briefly restate what the governances require of commissioners and what their roles and responsibilities are.Have they undergone the required OBDD training? (Note: OBDD will be establishing the training programrequirements as part of the implementation of the Statewide Port Strategic Plan).
d) Staff/Professional Development: Identify organizational structure, key staff, how long they have been with theport, and what their professional background and expertise includes. Describe the port’s policy on professionaldevelopment – both for staff and the commission – and identify professional development goals for key staffand the commission to the extent possible.
e) Financial and Market Conditions: Who are the port and the community’s competitors (Other ports, otherfacilities, other communities or regions)? Do port activities and facilities compete with private operations in theregion? What existing markets are served by the port and the community’s facilities (Examples: recreationalfishing in Southern Oregon; local manufacturers looking to expand; small footloose manufacturers looking torelocate from high cost locations; retirees from California, etc.). Are these markets identified on OBDD’s keyindustries map, or are they identified as regionally-important industries by agreement between the Port andOBDD? What are the Port’s resources (operational surpluses, staff capacity) and assets (industrial land,buildings, other facilities) and what is the trend in the Port’s financial condition and capacity? Include totalassets, port equity, debt, etc.
5. Defining the Problem and Opportunity: The intent is to tie the port’s development efforts to the economic needsand opportunities of the communities they serve.a) District Demographic Profile (Income, Poverty, Education, etc.): Most of this information can be obtained from
the Oregon Employment Division’s Regional Profiles and from the underlying US Census data.b) District Economic Profile (Workforce, Unemployment, Key Industries): Most of this information can be obtained
from the Oregon Employment Division’s Regional Profiles.c) Trends for Regional, State, and National (if applicable) Key Industries: Which industries are growing, which are
mature (flat) and which are declining?

Ports 2010: A New Strategic Business Plan for Oregon’s Ports 120
d) Community Role: identify economic development issues not in the port’s direct control, but for which the porthas been a stakeholder or a partner. These can be private interests or other, local agency interests.
e) Analysis: How do the port district’s income, poverty and educational levels compare to the state and thenation? How are the demographics of the district changing? What’s happening with the region’s workforce andwhat are the job trends for the region? What’s happening with the region’s key industries (manufacturing,tourism, natural resources, services, etc.) - which are growing, which are declining – and how does thatcontrast with state and national trends?
6. Policy Context: Include a threshold statement, such as indicating that the strategic plan has been prepared withfunding from OBDD and based on this template, as well as indicating that the plan is consistent with local andregional (if applicable) planning policies and goals. Other items to include:a) Port is committed to following its governances and this strategic plan. The port will update its capital facilities
plan at least once every 10 years, with a 5-year “midpoint review” to identify any changes in circumstances,goals and objectives, costs or policies that may affect the implementation of the CFP.
b) Indicate sitting commissioners have undergone board training and have agreed on procedures for handlingconflict-of-interest issues and have agreed to follow best practices and fiduciary responsibility as defined above.
c) The plan should have flexibility to allow for unanticipated business opportunities that contribute to the port’seconomic development or revenue enhancement goals.
d) Planning and Environmental Policy Compliance Issues: Discuss the port’s environmental values, practices andpolicies, and what the port’s role is in addressing local and regional environmental issues. Address theStatewide Planning Goals relevant to ports (5,9,12,16-19), and specifically address:i. Statewide Planning Goal 9 – Economic Development: How has and is the port addressing Goal 9
(ownership of industrial or commercial lands or buildings; pursuing opportunities to purchase and developindustrial and commercial lands)? Are their properties available that would enhance the Port’s ability tomeet its economic development and revenue goals? Does the port have adequate resources to do so?
ii. Statewide Planning Goal 12 – Transportation: How has and is the port addressing Goal 12? Whattransportation facilities (marinas, docks, airports, etc.) does the port own or operate? Are the port’stransportation projects and needs included in local and regional transportation plans? What transportationaccess infrastructure improvements, outside of port ownership, are needed to maintain or improve accessinto/out of the port?
iii. Statewide Planning Goal 17 – Water Dependent Use: What is the applicability of Goal 17 to port waterfrontlands? Does property need to be preserved for maritime cargo activity or other marine-related activities? Is
Ports 2010: A New Strategic Business Plan for Oregon’s Ports 121
their waterfront property that could or should be redeveloped to increase economic activity, support localservices and provide increased revenues for the port?
e) Statewide Port Strategic Plan Recommendations: Address how the port’s strategic plan is addressing therelevant recommendations contained in the Statewide Port Strategic Plan (or indicate which of thoserecommendations are not applicable).
f) Other Local and Regional Plans: Reference other community, county and regional economic plans and describehow they relate to the port’s plan? If other plans reference key industries or opportunities how does the Portplan address them?
g) Political Context and Analysis: Characterize the working relationship of the port with the county, local cities andspecial districts. What interest or advocacy groups are involved with local issues and how can they be engagedor consulted. Are demographic changes driving changes in local and regional public perceptions and attitudes?
7. Situational Analysis – in context of district demographic/economic profile.a) SWOT: identify strengths, weaknesses, opportunities and threatsb) Critical Issues: What issue or issues does the port face that if left unaddressed would result in a serious
erosion of the port’s facilities, revenues or capacity (EXAMPLE – Bulkhead of the dock underneath Gold BeachCannery Building is failing. Port is moving to diversify but if the old dock fails it could lose a key asset).
c) Demand Analysis: What type of demand is growing in the local and regional economy (housing, retail, etc.)based on key industry trends? What type of demand is decreasing? How do the port’s assets match up withdemand and opportunity?
d) District Needs: Given demand, economic needs and the port’s assets, capacity and resources, what kinds ofprojects and strategies can the port most effectively pursue to address the economic needs of its district andits residents?
e) Port direct impact on jobs: make best effort to include available information on current jobs at the port,including port tenants (both private and public). It is understood that information may be consideredproprietary and not be available.
f) Risk Analysis: What are the biggest risks facing the port in pursuing strategies to achieve its economicdevelopment and revenue goals, including political risk?
8. Goals and Objectives:a) Property Goals: (Marine, Aviation, Industrial, Commercial, Recreational, etc.): background and status, strategic
objectives, action plan
Ports 2010: A New Strategic Business Plan for Oregon’s Ports 122
b) Management Goals: policies and procedures, staffing, staff and board development, emergency managementprocedures and protocols
c) Financial Goals: property acquisition, debt management, depreciation, reserves.d) Environmental goals: background and status, objectives, action plan.e) Marketing Goals: background and status, objectives, action plan.
9. Facilities and Business Plana) Five- (or six-) Year Capital Program: The first 5-6 years of the longer-term Capital Facilities Plan. Based on
property goals and objectives, priorities identified in the Strategic Plan and CFP, reviewed annually as part ofbudget process.
b) Economic and business plan: indicate how many new jobs the Strategic Business Plan is expected to realizeover its planning timeline, as well as identifying how the Plan will work to retain existing jobs at the port and porttenants.
c) Management Plan: Based on management goals and objectives, updated annually as part of budget process.Includes professional development and board development goals.
d) Financial Plan: Based on financial goals and objectives, updated annually as part of budget process. As part ofthis plan, the port should evaluate the financial impacts of charging below-market rates for marinas, boat ramps,buildings, and other infrastructure and whether it can financially support operations and maintenance of thesefacilities, in conjunction with other infrastructure and port operations, as well as eventually upgrading,reconstructing, or replacing these facilities.
e) Environmental Plan: Based on environmental goals and objectives, updated annually.f) Marketing Plan: Based on marketing goals and objectives, updated annually.
10.Attachments and Exhibits

Ports 2010: A New Strategic Business Plan for Oregon’s Ports 123
E. Template for Individual Business AgreementsThis could take one of several forms: a contractual relationship, a memorandum of agreement or understanding, or aninteragency compact or agreement. It is intended to be signed by parties who can enter into contracts or agreements onbehalf of the port and OBDD: the Port Manager or Port Commission chair as well as the Director of the Oregon BusinessDevelopment Department.
The following are elements recommended to be included in the individual business agreements:Points of contact with each entityRoles, responsibilities, and expectations of each partyCommitment from the port for abiding by the terms included in this strategic plan (training, environmentalcompliance, consistency of its strategic plan with the template contained in the Statewide Strategic Port Plan,etc.)Commitment from OBDD to coordinate within Oregon state government multi-department support of the port’sneeds in circumstances requiring this coordination (including planning, environmental resource agency review,permitting, etc.)Specific terms of the agreement, including how often to update port plans, elements to be included in theseplan updates, identifying the port’s core functions and markets/portfolios, addressing new or emerging marketsin the port’s business plan, etc.Termination clause.
Ports 2010: A New Strategic Business Plan for Oregon’s Ports 124
PRINCIPAL CONSULTANT STAFF
Chuck Green, PE, Supervising Transportation Planner, Parsons Brinckerhoff, Consultant Project Manager and PrincipalAuthorAl Benkendorf, The Benkendorf Associates, Corp., Senior Policy and Regulatory PlannerAllan Rumbaugh, Consultant, Port Policy and Operations PlannerDon Grigg, Senior Consultant, Port Strategic Planning AdvisorMargaret Johnson, Riverwise, LLC, Senior Port PlannerAnn-Marie Lundberg and Craig Levie, Tangent Services, Inc., Rail/Port Connections PlannersBrian Winningham, BST Associates, Inc., Economist and Market Outlook PlannerDavid Simpson, David P. Simpson Consultants, National Policy AdvisorJ. Michael Zachary, PE, PPM, Principal Consultant, Parsons Brinckerhoff, Global Maritime Goods MovementRalph Petereit, PE, Ports and Marine Regional Manager, Parsons Brinckerhoff, Port Plan Senior AdvisorJerald Ramsden, Supervising Engineer, Parsons Brinckerhoff, Port Engineering and Data CompilationSine Adams, Transportation Planner, Parsons Brinckerhoff, Mapping and Port Commodity Flow ForecastsMark Rohden, Transportation Planner, Parsons Brinckerhoff, Market Outlook Planner