portland harbor ri/fs remedial …wllase08. field and data report downtown portland sediment...
TRANSCRIPT

PORTLAND HARBOR RI/FS
REMEDIAL INVESTIGATION REPORT
APPENDIX A DATA SOURCES AND SITE CHARACTERIZATION/RISK
ASSESSMENT DATABASE
FINAL
February 8, 2016

PORTLAND HARBOR RI/FS
REMEDIAL INVESTIGATION REPORT
APPENDIX A1 CHEMISTRY SURVEY DESCRIPTIONS FOR DATA
COLLECTED BY OTHER PARTIES
FINAL
February 8, 2016

Portland Harbor RI/FS Final Remedial Investigation Report
February 8, 2016
. A1-i
TABLE OF CONTENTS
TABLE OF CONTENTS ........................................................................................................... i CHEMISTRY SURVEY DESCRIPTIONS FOR DATA COLLECTED BY OTHER
PARTIES ........................................................................................................................1 RIEDEL97. Baseline Sediment Assessment (Prepared by Maul Foster & Associates, Inc.,
November 20, 1997). .....................................................................................................2 WLR0797. Results of July 1997 Willamette River Sediment Study (Prepared by U.S.
Army Corps of Engineers, Portland District, 1997). .....................................................4 WLCASF97. Assessment of the Nature of PAH in Surface Sediments along the
Southwestern Shore of Portland Harbor Superfund Site, Portland, OR (Prepared by Battelle, 2002). ..........................................................................................................6
WLCT4E97. Sediment Characterization Study River Terminal 4, Slip 3 Willamette River, Portland OR (Prepared by Hart Crowser, August 1997) .....................................7
WLCT4J97. Sediment Characterization Study Terminal 4, Berth 416, Port of Portland (Prepared by Hart Crowser, March 1998). .....................................................................8
PSYD&M97. Results of Sediment Investigation to Identify Chemicals in the Vicinity of the Portland Shipyard (Prepared by Dames & Moore, 1998). .......................................9
WRD&M98. Results of Sediment Investigation to Identify Chemicals in the Vicinity of the Portland Shipyard (Prepared by Dames & Moore, 1998). .....................................10
WR-WSI98. Portland Harbor Sediment Investigation, Multnomah County, Oregon (Prepared by Roy F. Weston, Inc., May 1998). ............................................................ 11
WLRWTF98. Remedial Investigation Report, Willbridge Facility (Prepared by KHM Environmental Management, December 2000). ..........................................................13
WLCT4J98. Remedial Investigation Report Terminal 4, Slip 3 Sediments, Port of Portland (Prepared by Hart Crowser, April 2000). ......................................................14
WLCT0I98. Sediment Characterization Study of Local Sponsors’ Berths, Columbia and Willamette River Navigation Channel Deepening, Longview and Kalama, Washington and Portland, Oregon (Prepared by Hart Crowser, February 1999). .......16
WLCITH98. International Terminals-Sediment Sampling Event, Memorandum Draft, Portland, OR (Prepared by Schnitzer Steel Products Company, December 1998). .....17
PSYSEA98. Portland Shipyard Sediment Investigation Data Report (Prepared by Striplin Environmental Associates, Inc., November 1998).......................................................18
WLCRIL99. Site Investigation Report, Port of Portland Confined Dredged Material Disposal, Ross Island Facility, Portland, OR (Prepared by Hart Crowser, November 30, 2000). ...................................................................................................20
WLCT5K99. Sediment Characterization at Marine Terminal 5, Barge Berth 501 and Berth 503, Portland, OR (Prepared by Hart Crowser, 1999). ......................................22
WLCRIJ99. Baseline Sediment Characterization, In-Water Clear Zone Sampling Results, Ross Island Lagoon (Prepared by Landau Associates, January 24, 2000). ..................23

Portland Harbor RI/FS Final Remedial Investigation Report
February 8, 2016
. A1-ii
WLCRIV99. Phase I Remedial Investigation, Ross Island Sand & Gravel Co. (Prepared by Landau Associates, September 20, 2000). ..............................................................24
WLCGXV99. Environmental Site Assessment, GATX Terminals Corporation Linnton Terminal (Prepared by KHM Environmental Management, December 1999). ...........25
WLCMBJ99. Sediment Remedial Design Final Sampling Data Summary Report, McCormick & Baxter Creosoting Company, Portland, OR (Prepared by Ecology and Environment, Inc., February 2001). ......................................................................27
WLR0499; WLR1199. Willamette River Sediment Sampling Evaluation (Prepared by U.S. Army Corps of Engineers, June 1999 and March 2000)......................................28
TOSCO99. January 1999 Sediment Sampling Results for Tosco Portland Terminal (Prepared by Exponent, April 29, 1999). .....................................................................29
WLRELF99. Elf Atochem Acid Plant Area Remedial Investigation Interim Data Report (Prepared by Exponent, June 1999). ............................................................................30
PPTLDT24. Sediment Characterization Study Marine Terminal 2, Berths 203-206, Port of Portland (Prepared by Hart Crowser, March 1999). ................................................32
WLCGAB99. Pre-dredge Sediment Goldendale Aluminum Co. Portland, OR (Prepared by CH2M Hill, February 1999). ..................................................................................33
WLCT1F00. Marine Terminal 1 Baseline Investigation Final Report, Port of Portland, Portland, OR (Prepared by Striplin Environmental Associates, August 2000). ...........33
WLCGAF00. Dredging Sampling Results, Goldendale Alumina Unloading Facility, Phase I Sampling, Portland, OR (Prepared by CH2M Hill, March 2001). ..................34
WLCGAL00. Preliminary Assessment and Dredging Sampling Results, Goldendale Alumina Unloading Facility, Phase II Sampling, Portland, OR (Prepared by CH2M Hill, March 2001). ...........................................................................................35
WLCOSJ00. Pre-remedial Investigation Field Activities Data Report, Oregon Steel Mills, Inc. (OSM), Portland, OR (Prepared by Exponent, February 2001). ................36
WLCWTI00. Revised 60-inch Storm Sewer Interim Remedial Actions Report, Tosco Willbridge Terminal, Portland, OR (Prepared by KHM Environmental Management, Inc., May 2002). ....................................................................................38
WLCAYH00. Expanded Preliminary Assessment Data Report, Union Pacific Railroad (UPRR) Albina Yard, Portland, OR (Prepared by Jacobs Engineering, November 2000). ...........................................................................................................................39
WLCMFH00. Expanded Preliminary Assessment Data Report, Marine Finance Site, Portland, OR (Prepared by Jacobs Engineering, November 2000). ............................41
WLCZDI00. Final Remedial Investigation and Risk Assessment, Zidell Waterfront Property (Prepared by Maul Foster & Alongi, Inc., 2003). .........................................42
WLCT4L01. Dredged Material Characterization Study Marine Terminal 4, Slip 3, Portland, OR (Prepared by Hart Crowser, Inc., February 2002). ................................44
WLLRSI01. Lower Willamette River Reference Area Study, U.S. Army Corps of Engineers, Portland, OR (Prepared by Hart Crowser, February 26, 2002). .................46

Portland Harbor RI/FS Final Remedial Investigation Report
February 8, 2016
. A1-iii
WLLRSH01. Willamette River Reference Area Study – Phase I Results and Recommendations for Phase II Sampling Locations, Portland, OR (Prepared by Hart Crowser, September 2001). ..................................................................................47
WLCCIF01. Results of Sediment Sampling and Analysis, Cargill Irving Elevator Terminal, Portland, OR (Prepared by Harding ESE, August 3, 2001). ........................48
WLCT0F01. Dredged Material Characterization Study, Marine Terminal 2, Berths 203-206, Marine Terminal 5, Berth 501, Portland, OR (Prepared by Hart Crowser, August 24, 2001). .........................................................................................................49
WLCCPF01. Chevron Willbridge Terminal Dock Sediment Sampling, Portland, OR (Prepared by PNG Environmental, 2001). ...................................................................51
WLCGSD01. NW Natural “Gasco” Site, Draft Screening Level Nearshore Source Control Evaluation Results Report, Portland, OR (Prepared by Anchor Environmental, L.L.C., July 2001). .............................................................................53
WLCMBA01. Sediment Remedial Design Final Sampling Data Summary Report, McCormick & Baxter Creosoting Company, Portland, OR (Prepared by Ecology and Environment, Inc., February 2001). ......................................................................54
WLCSLH01. Supplemental Investigation Report, Siltronic Surface Water and TZW Data (Prepared by Maul Foster & Alongi, Inc., September 8, 2005). ..................................55
WLCEAF02. Phase II Stage 1 & 2 In-River Groundwater and Sediment Investigation Report Volume 1 Report and Appendix A, Portland, OR (Prepared by Integral Consulting Inc., December 2003). ...............................................................................57
WLCOFJ02. Source Control Sediment Investigation for the City of Portland Outfalls, Portland, OR (Prepared by CH2M Hill, January 2004). ..............................................58
WLCMBI02. Surface Water, Sediment, and Groundwater Sampling Report, McCormick & Baxter Creosoting Company Site, Portland, OR (Prepared by Ecology and Environment, Inc., February 2003). .............................................................................59
WLCMRI02. Final Limited Sediment Investigation Report U.S. Government Moorings, Portland, OR (Prepared by URS, May 2003). .............................................................60
WLCOFH02. Source Control Pilot Project for the City of Portland Outfalls, Portland, OR (Prepared by CH2M Hill, August 2002). ..............................................................62
WLCMCB02. MarCom Expanded Preliminary Assessment, Portland, OR (Prepared by Parametrix, 2002). ........................................................................................................63
WLCGXB02. Remedial Investigation Kinder Morgan Liquid Terminals, LLC, Linton Facility, Portland, OR (Prepared by KHM Environmental Management, Inc., October 2002). .............................................................................................................64
WLCWTG02. Willbridge Terminal Post-Dredging Sediment Characterization Data Report Portland, OR (Prepared by PNG Environmental, Inc., and Anchor Environmental, L.L.C., October 2002). .......................................................................65
WLCPOB02. Willamette River Fnc Post Office Bar Reach (RM 2.2) Sediment Quality Evaluation Report. (Prepared By Portland District Corps Of Engineers, February 2009). ...........................................................................................................................66

Portland Harbor RI/FS Final Remedial Investigation Report
February 8, 2016
. A1-iv
WLCPGH02. CLD Pacific Grain Post Dredge Surface Sediment Sample (August 29, 2002) ............................................................................................................................67
WLCDRI03. Willamette River Federal Navigational Channel Operation & Maintenance Sediment Characterization Report Portland, OR (Prepared by Hart Crowser, June 2004). ...........................................................................................................................67
WLCGNG03. Gunderson, Inc. Area 2 - Sandy Beach Area Upland Source Evaluation (Prepared by Squier|Kleinfelder, February 2004). .......................................................69
WLCITC03. International Terminals Sediment Data Report Portland, OR (Prepared by Floyd Snider McCarthy, Inc., June 2003). ...................................................................69
WLCSPL03. Expanded Preliminary Assessment Sulzer Pumps Site (Prepared by GeoDesign, 2004) ........................................................................................................71
WLTASE03. ODHS/USEPA/ATSDR Fish Contaminant Study (Prepared by ODHS, USEPA and ASTDR, 2003). ........................................................................................72
WLCGWF03. Dredge Material Characterization Report Glacier Northwest Portland Cement Terminal Portland, Oregon (Prepared By Anchor Environmental, July 2003). ...........................................................................................................................74
C167-1103. Draft Removal Action Area Characterization Report Arkema Early Action. (Prepared by Integral Consulting and ARCADIS, December 24, 2010). ....................75
WLCGSG04. Draft Removal Action Completion Report, NW Natural “Gasco” Site Portland, OR (Prepared by Anchor Environmental L.L.C., January 2006). ................76
WLCEMH04. Technical Memorandum ExxonMobil Beach Sediment Sheen Sample, Portland, OR (Prepared by Kleinfelder, September 2004). .........................................77
WLCT4C04. Terminal 4 Early Action EE/CA Report Public Review Draft, Appendix E─Summary of Sediment Quality Characteristics, Port of Portland, Portland, OR (Prepared by Blasland, Bouck & Lee, Inc., May 2005). ..............................................78
WLCZDH04. Supplemental Remedial Investigation Report: Riverbank Characterization, Zidell Waterfront Property (Prepared by Maul Foster & Alongi, Inc., 2004). ...................................................................................................................79
WLCGWI04. Surface Sediment Verification Sampling Glacier Northwest Portland Cement Terminal , Portland, OR. (Prepared by Anchor Environmental LLC, November 2004). .........................................................................................................80
WLCRPI04. Outfall 22B: Remaining Remedial Investigation Technical Memorandum RPAC – Portland Site (Prepared by AMEC Earth & Environmental, Inc., February 4, 2003). Remaining Remedial Investigation Technical Memorandum Addendum North Doane Lake Investigation RP – Portland Site (Prepared by AMEC Earth & Environmental, Inc., July 9, 2004). Draft Outfall 22B Storm Sewer Sampling Report RP - Portland Site (Prepared by AMEC Earth and Environmental, Inc., March 24, 2005). ..........................................................................................................81
WLCDRD05. Vol. 1 Dredge Material Management Plan Sediment Characterization Report, Lower Willamette River Federal Navigation Channel (Prepared by Tetra Tech EC Inc., January 2006). .......................................................................................82

Portland Harbor RI/FS Final Remedial Investigation Report
February 8, 2016
. A1-v
WLCACF05. Sediment Data Report Ash Grove Cement Company Willamette River Portland, Oregon (Prepared By Parson Brinckerhoff, September 19, 2005). ..............84
WLCBPE06. BP Bulk Terminal 22T Supplemental Sediment and Revetment Investigation Portland, OR (Prepared by URS, March 2007). ....................................85
WLCGSJ06. Phase I Report and Phase 2 Field Sampling Approach. Gasco Siltronic Groundwater Source Evaluation Portland, OR (Prepared by Anchor Environmental L.L.C., May 2007)...............................................................................86
WLCT4G06. Data Report: Sediment Chararacterization Results for Terminal 4 Phase I Removal Action, Preconstruction Sampling, Port of Portland (Appendix G) (Prepared by Anchor Environmental LLC, 2008). .......................................................87
WLC1200Z. City of Portland Bureau of Environmental Services (BES) TSS Data (Sanders, D. 2006. Personal communication [compact disk of City of Portland BES Watershed Program dataset, Portland, OR] provided to K. Pine, Integral Consulting Inc.)............................................................................................................89
WLFLH07. Blue Heron Paper Company Site Investigation (Prepared by Ecology and Environment, 2007). ....................................................................................................89
WLCGSG07. Offshore Investigation Report NW Natural “Gasco” Site, Portland, OR (Prepared by Anchor Environmental L.L.C., February 2008) .....................................90
WLCGED07. June 2007 Storm Water Monitoring Report, GE Energy – Energy Services (Prepared by AMEC Earth and Environmental, Inc., 2007). .......................................93
November 2007 Storm Water Monitoring Report, GE Energy – Energy Services (Prepared by AMEC Earth and Environmental, Inc., 2007). .......................................93
WLCT4C07. Field Sampling Procedures Report, Stormwater Sampling Program, Terminal 4 Upland Facility (Prepared by Ash Creek Associates, Inc., 2008) .............98
WLcZDI07. Zidell Waterfront Property. (Maul Foster & Alongi).........................................105 WLCITG08. Sediment Sampling Results Focused Sediment Investigation International
Terminals Slip, Portland Oregon (Prepared By CH2M HILL, April 10, 2009). ........105 WLCARI08. Interim Construction Report Revetment Source Control Measure BP Bulk
Terminal 22T, Portland, OR (Prepared By URS, March 2009). ................................107 WLCMRD08. Remedial Investigation Report U.S. Government Moorings Portland, OR
(Prepared By KTA, TEC Inc. May 2010). .................................................................108 WLLASE08. Field and Data Report Downtown Portland Sediment Characterization
Willamette River Portland, Oregon (Prepared By GSI Water Solutions Inc., January 2009). ............................................................................................................ 110
WLCCWI08. Chevron Willbridge Terminal 2008/2009 Pre-Dredge Sediment Investigation, Portland, OR (Prepared By Arcadis, August 2009). ........................... 111
WLRASE08. Field Sampling Report for the Collection of Eggs and Determination of Producitivity of Osprey Nesting Within the Portland Harbor Superfund Site and Vicinity (Prepared By USGS, October 30, 2009; USGS 2009). ................................ 114

Portland Harbor RI/FS Final Remedial Investigation Report
February 8, 2016
. A1-vi
WLCT4L08. Data Report Sediment Characterization Results for Terminal 4 Phase 1 Removal Action Post-Construction Sampling WLCT4L08. Port of Portland, Portland, Oregon (Prepared By Anchor QEA, August 2009). ................................... 115
WLCPWL09. Sediment Characterization Report Conocophillips Pipe Line Company Portland Terminal Marine Dock at River Mile 7.8, Portland, OR (Prepared by AMEC Earth & Environmental Inc., April 2010). ..................................................... 116
WLLPGH09. Sediment Investigation Report Portland Gas Manufacturing Site, Portland, OR (Prepared by Anchor QEA, LLC, December 2009). ........................................... 117
WLCPSK09. Sediment Chraracterization Report Portland Ship Repair Yard Portland, OR (Prepared by ERM-WEST Inc., Portland, OR). ......................................................... 118
RM11E. Surface and Subsurface Sediment Field and Data Report River Mile 11 East Focused Sediment Characterization, Portland, OR (Prepared by GSI Water Solutions, Inc., August 2009). .................................................................................... 118
RM11E_BD. Bank Soil and Debris Field and Data Report River Mile 11 East Focused Sediment Chracterization, Portland, OR (Prepared by GSI Water Solutions, Inc. June 2010). .................................................................................................................120
WLLASB10. Field and Data Report Downtown Portland Sediment Characterization Phase II Willamette River Portland, OR (Prepared by GSI Water Solutions and Hart Crowser, June 2010). .........................................................................................121
WLLGEC10. Data Report Portland General Electric Willamette River Sediment Investigation River Miles 13.1 and 13.5, Portland, OR (Prepared by URS, June 16, 2010). ...................................................................................................................124
RM11E_ST. Draft In-River Sediment Trap Field and Data Report River Mile 11 East Focused Sediment Characterization, Portland, Oregon (Prepared by GSI Water Solutions Inc., June 2010). .........................................................................................125
REFERENCES ......................................................................................................................127

Portland Harbor RI/FS Final Remedial Investigation Report
February 8, 2016
A1-1
CHEMISTRY SURVEY DESCRIPTIONS FOR DATA COLLECTED BY OTHER PARTIES Historical and concurrent non-Lower Willamette Group (LWG) sediment chemistry data in the project database were compiled from several sources, including the U.S. Environmental Protection Agency (USEPA), Oregon Department of Environmental Quality (DEQ), U.S. Army Corps of Engineers (USACE), Port of Portland, and numerous private parties. The database was queried to select non-LWG data of known quality (Category 1 QA1 or QA2) obtained since May 19971. Only sediment data collected below +13 ft NGVD were included. Further, only Category 1 QA2 sediment data were queried for use in the risk assessments (dredged and capped samples were removed). Specifics about each survey are provided in the summaries below for surveys completed since May 1997 and meeting the selection criteria provided in Section 2 of this RI report.
Data from other matrix types collected by other parties have also been included in chemical distribution discussions (Section 5), loading calculations (Section 6), background (Section 7), risk evaluations (Sections 8 and 9, Appendices F and G), and the conceptual site model (Section 10). These data include fish tissue data from USEPA, the Oregon Department of Health Services (ODHS), and the Agency for Toxic Substances and Disease Registry (ATSDR), transition zone water (TZW) data from Siltronic and Gasco, total suspended solids (TSS) data from the City of Portland, seep data from Starlink Logistics (Outfall 22B) and stormwater data from Terminal 4,GE Energy, and other entities.
Each summary described herein includes information on the project objectives, sampling dates, sampling methods, sample types, and analyses for that survey. This information was obtained from the survey source document, and the reference is provided. Summary results (maximum and minimum concentrations) for selected chemicals in surface and/or subsurface sediments are also provided in each survey description. Minimum concentrations are reported as the lowest detected concentration or the reporting limit. Maximum concentrations are reported as the highest detected concentration, or, if all concentrations are not detected, the highest reporting limit. Total PCBs are Aroclors unless otherwise noted. Sampling locations for each Category 1 sediment survey can be found on Maps 2.1-15a–y and aa–kk (surface sediments) and Maps 2.1-17a–t and aa–oo (subsurface locations). As appropriate, the location of the maximum concentration is also provided.
Each data set was reviewed to characterize the quality of the data prior to entry in the database and to ensure that the data were appropriate for use in the RI/FS. Additional information on the data and review process is provided in Section 2 of this RI report or in the Programmatic Work Plan (Integral et al. 2004).
1 One Category 2 data set, the Zidell South Waterfront site (WLCZDI00), was selected to complete the database.
The Zidell Category 2 data are believed to be of high quality per DEQ cleanup oversight.

Portland Harbor RI/FS Final Remedial Investigation Report
February 8, 2016
A1-2
RIEDEL97. BASELINE SEDIMENT ASSESSMENT (PREPARED BY MAUL FOSTER & ASSOCIATES, INC., NOVEMBER 20, 1997).
Maul Foster & Associates completed two phases of work supporting Triangle Park’s purchase of the former Zidell property, located immediately south of the McCormick & Baxter site. The first phase of work had no supporting data report, only a summary table and associated laboratory report. Data with the survey code, RIEDEL96, were collected in this first phase of work on August 30, 1996. The second phase of work, RIEDEL97, is reported in the Baseline Sediment Assessment, dated November 20, 1997.
In the first phase of work, divers collected seven cores (SED-1 through SED-7) by pushing 2.5-ft-long Shelby tubes into the sediment. Core lengths ranged from 0.6 to 1.6 ft. Stations were located nearshore, extending from the southern property boundary (SED-1) to the northern property boundary (SED-7). Samples were analyzed for metals, PCBs, and butyltins. Indicator chemical results (dry weight) are summarized below.
RIEDEL96 Summary Data for Surface Samples. Parameter Minimum Maximum (Location) Arsenic (mg/kg) 4 35 (SED-4) Cadmium (mg/kg) 1 U 1 U Copper (mg/kg) na na Lead (mg/kg) 20 U 60 (SED-4) Mercury (mg/kg) na na Zinc (mg/kg) na na TBT (µg/kg) 3 U 32,000 (SED-4) bis(2-ethylhexyl)phthalate (µg/kg) na na Total LPAH (µg/kg) na na Total HPAH (µg/kg) na na Total PCBs (µg/kg) 100 UA 200 UA (several samples) 2,3,7,8-TCDD (ng/kg) na na Total DDT (µg/kg) na na Dibenzofuran (µg/kg) na na 4-Methylphenol (µg/kg) na na Diesel range hydrocarbons (mg/kg) na na Xylenes (µg/kg) na na
Notes: (The notes below apply to all tables in this appendix.) na - Not analyzed A - Detected quantities of analytes added together as defined in WAC 173-204-320 for LPAH and HPAH, as in USACE et al. (2000) for DDT, and for all Aroclors or congeners for PCB. B - Analyte found in associated blank. E - Estimated because of the presence of interference G - Estimate is greater than value shown. H - Holding time exceeded. HPAH - High- molecular-weight polycyclic aromatic hydrocarbon J - Associated value is an estimate LPAH - Low-molecular-weight polycyclic aromatic hydrocarbon T - Value calculated or selected from multiple results

Portland Harbor RI/FS Final Remedial Investigation Report
February 8, 2016
A1-3
TBT - Tributyltin U – Not detected at detection limit shown UA - All summed analytes undetected, high detection limit shown. V - In diesel range but doesn’t match diesel standard. Z – Data qualifier indicating that characteristic profiles for petroleum hydrocarbon fuels and lubricants were not apparent.
In the second phase of work, Maul Foster & Associates collected eight cores using an impact corer and generally split the cores into surface samples (0–15 cm) and from one to five subsurface samples of various lengths. The longest core length was approximately 15 ft (up to 460 cm). Stations were distributed around the dock and pilings. Phase II sediment samples were analyzed for limited metals, limited SVOCs (including PAHs), and butyltins. Results for surface sediment samples and subsurface samples are provided below in separate tables. Results are reported in dry weight.
RIEDEL97 Summary Data for Surface Samples. Parameter Minimum Maximum (Location) Arsenic (mg/kg) 3 6 (SED-10) Cadmium (mg/kg) na na Copper (mg/kg) 38 56 (SED-10) Lead (mg/kg) 20 U 28 (SED-13) Mercury (mg/kg) na na Zinc (mg/kg) na na TBT (µg/kg) 3 380 (SED-10) bis(2-ethylhexyl)phthalate (µg/kg) na na Total LPAH (µg/kg) 64 A 169 A (SED-10) Total HPAH (µg/kg) 338 A 1,095 A (SED-10) Total PCBs (µg/kg) na na 2,3,7,8-TCDD (ng/kg) na na Total DDTs (µg/kg) na na Dibenzofuran (µg/kg) 5 U 10 (SED-10) 4-Methylphenol (µg/kg) na na Diesel range hydrocarbons (mg/kg) na na Xylenes (µg/kg) na na
RIEDEL97 Summary Data for Subsurface Sediment Samples.
Parameter Minimum Maximum (Location) Arsenic (mg/kg) 1 U 32 (SED-10) Cadmium (mg/kg) na na Copper (mg/kg) 12 218 (SED-10) Lead (mg/kg) 20 U 204 (SED-15) Mercury (mg/kg) na na Zinc (mg/kg) na na

Portland Harbor RI/FS Final Remedial Investigation Report
February 8, 2016
A1-4
Parameter Minimum Maximum (Location) TBT (µg/kg) 1 UH 24,000 (SED-10) bis(2-ethylhexyl)phthalate (µg/kg) na na Total LPAH (µg/kg) 5 UA 3,223 A (SED-16) Total HPAH (µg/kg) 5 UA 6,665 A (SED-16) Total PCBs (µg/kg) na na 2,3,7,8-TCDD (ng/kg) na na Total DDT (µg/kg) na na Dibenzofuran (µg/kg) 5 U 52 GH (SED-10) 4-Methylphenol (µg/kg) na na Diesel range hydrocarbons (mg/kg) na na Xylenes (µg/kg) na na
WLR0797. RESULTS OF JULY 1997 WILLAMETTE RIVER SEDIMENT STUDY (PREPARED BY U.S. ARMY CORPS OF ENGINEERS, PORTLAND DISTRICT, 1997).
This Willamette River sediment study for a proposed channel deepening project is composed of laboratory data sheets for the USACE, Portland District. No project narrative, including objectives, methods, sampling interval(s), or sampling locations, is provided. However, sediment chemistry data are provided for 18 surface sediment samples (including three composites and two field duplicates) and 34 subsurface sediment core samples (eight of which are field duplicates).
Surface sediment samples were collected on July 24–25, 1997, from the 0- to 10-in. depth interval. Surface sediments were analyzed for metals, SVOCs, TBT, DDT, PCBs, TVS, total solids, TOC, and grain size.
Subsurface sediment samples were collected from July 22–25, 1997. Core depths ranged from 6 to 20 ft. Sediment cores were sampled for layers of varying thickness. Subsurface sediment samples were also analyzed for the same parameters as for surface sediment.
Results for indicator chemicals in surface and subsurface samples are presented in the following tables. All results were reported in dry weight.
Summary Data for Surface Samples. Parameter Minimum Maximum (Location) Arsenic (mg/kg) 0.6 4 (WR-BC-10) Cadmium (mg/kg) 0.05 0.93 (WR-BC-07) Copper (mg/kg) 8 39 (WR-BC-15) Lead (mg/kg) 3.9 32.2 (WR-BC-36) Mercury (mg/kg) 0.01 0.17 (C16/17) Zinc (mg/kg) 45.2 171 (WR-BC-36)

Portland Harbor RI/FS Final Remedial Investigation Report
February 8, 2016
A1-5
Parameter Minimum Maximum (Location) TBT (µg/kg) 0.01 J 0.42 (WR-BC-23) bis(2-ethylhexyl)phthalate (µg/kg) na Na Total LPAH (µg/kg) 2.5 A 395,500 A (WR-BC-22) Total HPAH (µg/kg) 2 A 1,024,100 A (WR-BC-22) Total PCBs (µg/kg) 4 A 105 A (WR-BC-36) 2,3,7,8-TCDD (ng/kg) na na Total DDT (µg/kg) 0.2 A 17.3 A (WR-BC-21) Dibenzofuran (µg/kg) 0.9 G 2,100 G (WR-BC-22) 4-Methylphenol (µg/kg) na na Diesel range hydrocarbons (mg/kg) na na Xylenes (µg/kg) na na
Summary Data for Subsurface Samples. Parameter Minimum Maximum (Location) Arsenic (mg/kg) 0.5 U 19.7 (WR-CD-43) Cadmium (mg/kg) 0.03 2.12 (WR-CD-43) Copper (mg/kg) 8.9 70.1 (WR-CD-43) Lead (mg/kg) 1.2 489 (WR-CD-43) Mercury (mg/kg) 0.01 E 0.87 E (WR-CD-42) Zinc (mg/kg) 10.8 190 (WR-GC-39) TBT (µg/kg) 0.5 U 0.5 U bis(2-ethylhexyl)phthalate (µg/kg) na na Total LPAH (µg/kg) 1.4 A 1,484 A (WR-GC-11) Total HPAH (µg/kg) 2 A 5,654 A (WR-GC-11) Total PCBs (µg/kg) 5 A 246 A (WR-CD-42) 2,3,7,8-TCDD (ng/kg) na na Total DDT (µg/kg) 0.3 A 198 (WR-GC-24) Dibenzofuran (µg/kg) 0.5 G 85 G (WR-GC-18) 4-Methylphenol (µg/kg) na na Diesel range hydrocarbons (mg/kg) na na Xylenes (µg/kg) na na

Portland Harbor RI/FS Final Remedial Investigation Report
February 8, 2016
A1-6
WLCASF97. ASSESSMENT OF THE NATURE OF PAH IN SURFACE SEDIMENTS ALONG THE SOUTHWESTERN SHORE OF PORTLAND HARBOR SUPERFUND SITE, PORTLAND, OR (PREPARED BY BATTELLE, 2002).
This investigation consisted of surface sediment sampling to characterize the nature of PAHs in surface sediments along the southwestern shore of the Portland Harbor Superfund Site. Sediment sampling occurred from RM 4 to 9, including areas close to the Willbridge Area, Time-ExxonMobil-ARCO Terminals, BP (ARCO), Phillips Petroleum (Tosco), ChevronTexaco, and Time Oil, (collectively referred to as the Light Products Study Group; LPSG). The primary objective of this study was to use detailed chemical “fingerprinting” techniques to assess the nature and concentration of PAHs that occur within the Study Area.
Battelle Laboratory collected surface sediment (0 to 10 cm) from June 11 through June 13, 1997. Samples were collected using a 0.1-m2 van Veen grab sampler, and 39 samples were collected. Thirty-six samples, including two field replicates and one trip blank, were analyzed. Most sediment samples collected represented 6 to 8 in. of penetration, except for stations in the Willbridge area (S-001 to S-013), which achieved penetration depths of 4 in. or less due to a clay substrate that prevented full penetration with the van Veen grab sampler. All samples were analyzed for TPH, PAHs, biomarkers, grain size, and TOC. Each of the sediment extracts was quantitatively analyzed in order to provide both concentration data and a fingerprint of the C27-C35 pentacyclic triterpanes and C27-C29 regular steranes and rearranged steranes. Also, qualitative distributions of the alkylcyclohexanes and C13-17 sesquiterpanes were also obtained.
Summary Data for Surface Samples. Parameter Minimum Maximum (Location) Arsenic (mg/kg) na na Cadmium (mg/kg) na na Copper (mg/kg) na na Lead (mg/kg) na na Mercury (mg/kg) na na Zinc (mg/kg) na na TBT (µg/L) na na bis(2-ethylhexyl)phthalate (µg/kg) na na Total LPAH (µg/kg) 78 TA 56,500,105 TA (LPSG-S-017-R-1 RM
6.3) Total HPAH (µg/kg) 339 TA 6,855,256 TA (LPSG-S-017-R-1 RM
6.3) Total PCBs (µg/kg) na na 2,3,7,8,-TCDD (ng/kg) na na Total DDT (µg/kg) na na Dibenzofuran (µg/kg) 4 99,303 (LPSG-S-017-R-1 RM 6.3) 4-Methylphenol (µg/kg) na na Diesel range hydrocarbons (mg/kg) na na Xylenes (µg/kg) na na

Portland Harbor RI/FS Final Remedial Investigation Report
February 8, 2016
A1-7
WLCT4E97. SEDIMENT CHARACTERIZATION STUDY RIVER TERMINAL 4, SLIP 3 WILLAMETTE RIVER, PORTLAND OR (PREPARED BY HART CROWSER, AUGUST 1997)
This investigation consisted of sediment sampling in order to characterize material to be removed during routine maintenance dredging at Terminal 4, Slip 3, Berth 410 and 411, RM 5, to maintain berth elevation of -40 ft below CRD. This investigation also determined the suitability of sediment for in-water disposal at the Morgan Bar disposal site. Sediments unacceptable for in-water disposal would be disposed of at an approved confined location.
Subsurface sediment sampling was conducted by Hart Crowser on May 4, 1997 using a vibracorer. Six cores were collected at approximately 100-ft intervals along a transect parallel to the dock face (HC-VC-01 through HC-VC-06). This provided two cores in each of the three DMMUs. The two cores from each DMMU were composited. Sediment cores at each location were collected from the sediment-water interface down to an elevation of -41.0 ft. The location of Sediment Samples HC-VC-01 and HC-VC-02 were moved closer to the face of the pier at the request of the USACE.
Subsurface Sampling Locations. Subsurface Core ID
DMMU Composite Sample ID
Approximate Interval
Interval Description
HC-VC-01 T4/1 HC-T4-01 0–4 ft Proposed dredging depth (including 1-ft overdredge) HC-VC-02
HC-VC-03 T4/2 HC-T4-02 0–5 ft Proposed dredging depth (including 1-ft overdredge) HC-VC-04
HC-VC-05 T4/3 HC-T4-03 0–5 ft Proposed dredging depth (including 1-ft overdredge) HC-VC-06
All sediment samples were analyzed for metals, butyltins, phenols, LPAHs, HPAHs, chlorinated hydrocarbons, phthalates, miscellaneous extractables, PCBs, pesticides, and conventional parameters (grain size, percent solids, TVS, TOC, total sulfides, and ammonia). At the request of the USACE, archived sediment samples collected from below the proposed dredge prism were submitted for the analysis of PAHs, TOC, cadmium, lead, and zinc.
Summary Data for Subsurface Samples. Parameter Minimum Maximum (Location) Arsenic (mg/kg) 4.76 7.2 (T4/3 RM 4.57) Cadmium (mg/kg) 0.5 15.6 (T4/3 RM 4.57) Copper (mg/kg) 31.9 38.4 (T4/3 RM 4.57 ) Lead (mg/kg) 22.6 167 (T4/3 RM 4.57 ) Mercury (mg/kg) 0.05 U 0.05 U (T4/3 RM 4.57) Zinc (mg/kg) 97 J 236 J (T4/3 RM 4.57 ) TBT (µg/L) 0.025 U 0.048 (T4/3 RM 4.57) bis(2-ethylhexyl)phthalate (µg/kg) 863 B 1,500 JT (T4/2 RM 4.55)

Portland Harbor RI/FS Final Remedial Investigation Report
February 8, 2016
A1-8
Parameter Minimum Maximum (Location) Total LPAH (µg/kg) 791 TA 3,023.1 TA (T4/3 RM 4.57 ) Total HPAH (µg/kg) 5,618 TA 24,293 TA (T4/3 RM 4.57) Total PCBs (µg/kg) 39.5 TA 100 UTA(T4/2 RM 4.55) 2,3,7,8,-TCDD (ng/kg) na na Total DDT (µg/kg) 5 UT 10.6 T (T4/2 RM 4.55) Dibenzofuran (µg/kg) 37.1 79 (T4/3 RM 4.57) 4-Methylphenol (µg/kg) 40 U 40 U (T4/3 RM 4.57) Diesel range hydrocarbons (mg/kg) na na Xylenes (µg/kg) na na
WLCT4J97. SEDIMENT CHARACTERIZATION STUDY TERMINAL 4, BERTH 416, PORT OF PORTLAND (PREPARED BY HART CROWSER, MARCH 1998).
The purpose of this investigation was to characterize sediment in the proposed maintenance dredging area in Terminal 4, Berth 416 in order to assess the quality of the proposed dredge prism and to determine appropriate dredged sediment disposal options. The dredge prism was divided into two separate DMMUs. Two sub-tidal sediment cores were collected within the prism for each DMMU. Two separate samples from cores HC-VC-102 and HC-VC-103 were submitted to characterize one DMMU, and a composite of cores HC-VC-104 and HC-VC-105 was submitted to characterize a second DMMU.
The methods by which the cores were collected, processed, and subsampled were not described in the report. Sediment from throughout the entire length of the cores was homogenized for each sample. Subsurface sediment samples were analyzed for metals, SVOCs, pesticides, PCBs, TBT, TOC, ammonia, sulfides, TVS, and total solids.
Organic carbon content ranged from 1.28 to 3.14 percent. Results for indicator chemicals in subsurface samples are presented in the following tables. All results were reported in dry weight.
Summary Data for Subsurface Samples. Parameter Minimum Maximum (Location) Arsenic (mg/kg) 3.38 J 4.66 J (C104105) Cadmium (mg/kg) 0.5 U 0.5 U Copper (mg/kg) 15.5 34.2 (HC-VC-103) Lead (mg/kg) 9.53 17.7 (HC-VC-103) Mercury (mg/kg) 0.0717 0.254 (HC-VC-103) Zinc (mg/kg) 74.4 123 (C104105) TBT (µg/L) 0.0089 U 0.012 (HC-VC-102) bis(2-ethylhexyl) phthalate (µg/kg) 500 U 500 U Total LPAH (µg/kg) 455.7 A 1,804.3 A (C104105) Total HPAH (µg/kg) 1,225.6 A 4,807.7 A (C104105)

Portland Harbor RI/FS Final Remedial Investigation Report
February 8, 2016
A1-9
Parameter Minimum Maximum (Location) Total PCBs (µg/kg) 20 UA 20.6 A (C104105) 2,3,7,8-TCDD (ng/kg) na na Total DDT (µg/kg) 1 UA 14.35 A (C104105) Dibenzofuran (µg/kg) 31.8 93.8 (C104105) 4-Methylphenol (µg/kg) 40 U 69.1 (HC-VC-103) Diesel range hydrocarbons (mg/kg) na na Xylenes (µg/kg) na na
PSYD&M97. RESULTS OF SEDIMENT INVESTIGATION TO IDENTIFY CHEMICALS IN THE VICINITY OF THE PORTLAND SHIPYARD (PREPARED BY DAMES & MOORE, 1998).
In November 1997 and January 1998, Dames & Moore collected three subsurface (DM-20, DM-24C1, and DM-24C2) and five surface (DM-1, DM-9, DM-16, DM-18, and DM-22) sediment samples in the Portland Shipyard area. Stations DM-12, DM-16, and DM-21 were located in Swan Island Lagoon. Surface samples were collected from the top 10 cm. Subsurface sample cores ranged from 106 to 198 cm in depth. The remaining stations were located within the drydock area of the shipyard. No project narrative, including objectives, methods, or sampling gear, is provided. All samples were analyzed for heavy metals, SVOCs, PCBs, and TOC.
Results for indicator chemicals in surface samples are presented in the following tables. All results were reported in dry weight.
Summary Data for Surface Samples. Parameter Minimum Maximum (Location) Arsenic (mg/kg) 4.49 7.18 (DM-16) Cadmium (mg/kg) 0.5 U 1.53 (DM-16) Copper (mg/kg) 38.1 146 (DM-9) Lead (mg/kg) 12.3 53.5 (DM-16) Mercury (mg/kg) 0.09 0.27 (DM-22) Zinc (mg/kg) 71.3 397 (DM-16) TBT (µg/kg) 92 1,158 (DM-18) bis(2-ethylhexyl)phthalate (µg/kg) 779 1,920 B (DM-22) Total LPAH (µg/kg) 29.4 A 342.8 A (DM-16) Total HPAH (µg/kg) 314.4 A 2,256.3 A (DM-16) Total PCBs (µg/kg) 40 UA 168 A (DM-1) 2,3,7,8-TCDD (ng/kg) na na Total DDT (µg/kg) na na Dibenzofuran (µg/kg) na na

Portland Harbor RI/FS Final Remedial Investigation Report
February 8, 2016
A1-10
Parameter Minimum Maximum (Location) 4-Methylphenol (µg/kg) na na Diesel range hydrocarbons (mg/kg) na na Xylenes (µg/kg) 50 U 50 U
Summary Data for Subsurface Samples. Parameter Minimum Maximum (Location) Arsenic (mg/kg) 3.16 4.6 (DM-20) Cadmium (mg/kg) 1.29 E 1.98 E (DM-20) Copper (mg/kg) 27.8 55.8 (DM-20) Lead (mg/kg) 10 U 28.9 (DM-20) Mercury (mg/kg) 0.05 U 0.73 (DM-24C2) Zinc (mg/kg) 69.2 141 (DM-20) TBT (µg/kg) na na bis(2-ethylhexyl)phthalate (µg/kg) 13 UB 425 (DM-20) Total LPAH (µg/kg) 6.7 UA 318 A (DM-20) Total HPAH (µg/kg) 6.7 UA 1,700.8 A (DM-20) Total PCBs (µg/kg) 40 UA 150 A (DM-20) 2,3,7,8-TCDD (ng/kg) na na Total DDT (µg/kg) na na Dibenzofuran (µg/kg) na na 4-Methylphenol (µg/kg) na na Diesel range hydrocarbons (mg/kg) na na Xylenes (µg/kg) na na
WRD&M98. RESULTS OF SEDIMENT INVESTIGATION TO IDENTIFY CHEMICALS IN THE VICINITY OF THE PORTLAND SHIPYARD (PREPARED BY DAMES & MOORE, 1998).
In January 1998, Dames & Moore collected surface sediment samples from 12 stations in the vicinity of the Portland Shipyard. No project narrative, including objectives, methods, or sampling gear, is provided.
Stations were identified as DM-A through DM-L. All stations were located along the eastern shore between RM 7 and RM 11. Stations DM-A, DM-B, and DM-C were located at RM 10.7; stations DM-D, DM-E, and DM-F were located at RM 9.9; DM-G was located at RM 9; DM-H was located at RM 8.3, DM-I and DM-J were located off Triangle Park at RM 7.7; and DM-K and DM-L were located off the McCormick & Baxter site at RM 7. Surface samples were

Portland Harbor RI/FS Final Remedial Investigation Report
February 8, 2016
A1-11
collected from the top 10 cm. All samples were analyzed for heavy metals, SVOCs, PCBs and TOC.
Results for indicator chemicals in surface samples are presented in the following tables. All results were reported in dry weight.
Summary Data for Surface Samples. Parameter Minimum Maximum (Location) Arsenic (mg/kg) 2.88 5.86 (DM-B) Cadmium (mg/kg) 0.5 UE 2.13 E (DM-B) Copper (mg/kg) 24.4 46.7 (DM-J) Lead (mg/kg) 10 U 31.4 (DM-F) Mercury (mg/kg) 0.05 U 1.06 (DM-C) Zinc (mg/kg) 60.6 119 (DM-B) TBT (µg/kg) 2 36 (DM-I) bis(2-ethylhexyl)phthalate (µg/kg) 435 B 7,330 B (DM-I) Total LPAH (µg/kg) 14 A 856.2 A (DM-B) Total HPAH (µg/kg) 153.3 A 7,905 A (DM-B) Total PCBs (µg/kg) 40 UA 109 A (DM-F) 2,3,7,8-TCDD (ng/kg) na na Total DDT (µg/kg) na na Dibenzofuran (µg/kg) na na 4-Methylphenol (µg/kg) na na Diesel range hydrocarbons (mg/kg) na na Xylenes (µg/kg) na na
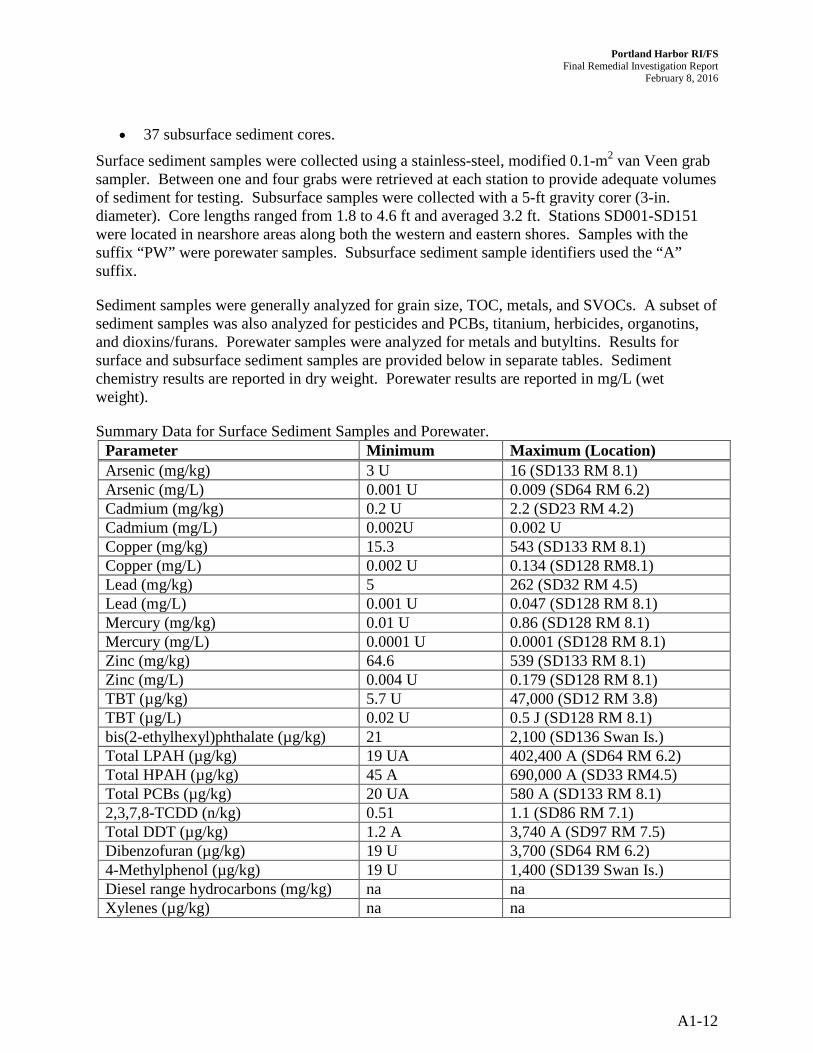
WR-WSI98. PORTLAND HARBOR SEDIMENT INVESTIGATION, MULTNOMAH COUNTY, OREGON (PREPARED BY ROY F. WESTON, INC., MAY 1998).
This Portland Harbor sediment investigation was performed for USEPA as part of a site inspection. The USEPA site inspection process evaluates actual and potential environmental hazards for purposes of identifying remedial action priorities. The Portland Harbor sediment investigation was conducted between RM 3.5 and 9.5. The purpose of the investigation was to provide a screening level evaluation of sediment contamination within this portion of the LWR.
The following surface sediment, subsurface sediment, and porewater samples were collected and evaluated:
• 150 surface (0–10 cm) sediment samples
• 28 sediment porewater samples
Portland Harbor RI/FS Final Remedial Investigation Report
February 8, 2016
A1-12
• 37 subsurface sediment cores.
Surface sediment samples were collected using a stainless-steel, modified 0.1-m2 van Veen grab sampler. Between one and four grabs were retrieved at each station to provide adequate volumes of sediment for testing. Subsurface samples were collected with a 5-ft gravity corer (3-in. diameter). Core lengths ranged from 1.8 to 4.6 ft and averaged 3.2 ft. Stations SD001-SD151 were located in nearshore areas along both the western and eastern shores. Samples with the suffix “PW” were porewater samples. Subsurface sediment sample identifiers used the “A” suffix.
Sediment samples were generally analyzed for grain size, TOC, metals, and SVOCs. A subset of sediment samples was also analyzed for pesticides and PCBs, titanium, herbicides, organotins, and dioxins/furans. Porewater samples were analyzed for metals and butyltins. Results for surface and subsurface sediment samples are provided below in separate tables. Sediment chemistry results are reported in dry weight. Porewater results are reported in mg/L (wet weight).
Summary Data for Surface Sediment Samples and Porewater. Parameter Minimum Maximum (Location) Arsenic (mg/kg) 3 U 16 (SD133 RM 8.1) Arsenic (mg/L) 0.001 U 0.009 (SD64 RM 6.2) Cadmium (mg/kg) 0.2 U 2.2 (SD23 RM 4.2) Cadmium (mg/L) 0.002U 0.002 U Copper (mg/kg) 15.3 543 (SD133 RM 8.1) Copper (mg/L) 0.002 U 0.134 (SD128 RM8.1) Lead (mg/kg) 5 262 (SD32 RM 4.5) Lead (mg/L) 0.001 U 0.047 (SD128 RM 8.1) Mercury (mg/kg) 0.01 U 0.86 (SD128 RM 8.1) Mercury (mg/L) 0.0001 U 0.0001 (SD128 RM 8.1) Zinc (mg/kg) 64.6 539 (SD133 RM 8.1) Zinc (mg/L) 0.004 U 0.179 (SD128 RM 8.1) TBT (µg/kg) 5.7 U 47,000 (SD12 RM 3.8) TBT (µg/L) 0.02 U 0.5 J (SD128 RM 8.1) bis(2-ethylhexyl)phthalate (µg/kg) 21 2,100 (SD136 Swan Is.) Total LPAH (µg/kg) 19 UA 402,400 A (SD64 RM 6.2) Total HPAH (µg/kg) 45 A 690,000 A (SD33 RM4.5) Total PCBs (µg/kg) 20 UA 580 A (SD133 RM 8.1) 2,3,7,8-TCDD (n/kg) 0.51 1.1 (SD86 RM 7.1) Total DDT (µg/kg) 1.2 A 3,740 A (SD97 RM 7.5) Dibenzofuran (µg/kg) 19 U 3,700 (SD64 RM 6.2) 4-Methylphenol (µg/kg) 19 U 1,400 (SD139 Swan Is.) Diesel range hydrocarbons (mg/kg) na na Xylenes (µg/kg) na na

Portland Harbor RI/FS Final Remedial Investigation Report
February 8, 2016
A1-13
Summary Data for Subsurface Sediment Samples. Parameter Minimum Maximum (Location) Arsenic (mg/kg) 4 U 14 (SD133 RM8.1) Cadmium (mg/kg) 0.3 5.3 (SD143 RM 8.8) Copper (mg/kg) 36.8 729 (SD133 RM 8.1) Lead (mg/kg) 13 1,080 (SD143 RM 8.8) Mercury (mg/kg) 0.04 0.80 (SD133 RM 8.1) Zinc (mg/kg) 91.3 598 (SD133 RM 8.1) TBT (µg/kg) 5.7 U 15,000 (SD133 RM 8.1) TBT (µg/L) na na bis(2-ethylhexyl)phthalate (µg/kg) 31 U 5,000 (SD143 RM 8.8) LPAH (µg/kg) 34 A 69,410 A (SD55C RM 5.7) HPAH (µg/kg) 135 A 152,700 A (SD35 4.7) Total PCBs (µg/kg) 15 A 2,379 A (SD133 RM 8.1) 2,3,7,8-TCDD (ng/kg) 0.76 U 1.2 (SD72 RM 6.6) Total DDT (µg/kg) 2.7 UA 51,000 A (SD92 RM 7.2) Dibenzofuran (µg/kg) 19 U 3,600 (SD72 RM6.6) 4-Methylphenol (µg/kg) 19 U 450 (SD01 RM 3.3) Diesel range hydrocarbons (mg/kg) na na Xylenes (µg/kg) na na
WLRWTF98. REMEDIAL INVESTIGATION REPORT, WILLBRIDGE FACILITY (PREPARED BY KHM ENVIRONMENTAL MANAGEMENT, DECEMBER 2000).
KHM Environmental Management conducted an RI of the Willbridge Facility. The purpose of the RI was to determine the need for remedial action. Information was collected to interpret subsurface conditions, evaluate potential human health and ecological risk, and to evaluate characteristics relevant to identifying potential hot spots of contamination. Soil, groundwater, surface water, and sediment samples were collected.
A total of 13 river sediment locations were sampled December 17–18, 1998. Nine stations were located along the site-river interface, two stations were located upstream outside the dock embayment, and two stations were located downstream outside the dock embayment. The draft RI report stated that surface samples were collected from the top 24 in. of sediment at all 13 locations. Sediment was collected using a stainless-steel sediment corer with 3-in.-diameter barrel and slide hammer.
Samples were analyzed for BTEX, PAHs, and metals. Some samples were also analyzed for SVOCs, VOCs, and organochlorine pesticides. Results for indicator chemicals are presented in the following table. All results were reported in dry weight.

Portland Harbor RI/FS Final Remedial Investigation Report
February 8, 2016
A1-14
Summary Data for Surface Samples. Parameter Minimum Maximum (Location) Arsenic (mg/kg) 1.22 6.53 G (TOS-SD5) Cadmium (mg/kg) 0.651 5.79 (TOS-SD5) Copper (mg/kg) 11.3 47.9 (TOS-SD3) Lead (mg/kg) 10 G 49.3 (GATX-SD2) Mercury (mg/kg) 0.05 U 0.12 U (TOS-SD3) Zinc (mg/kg) 17.3 G 73.7 G (CHEV-SD1) TBT (µg/kg) na na bis(2-ethylhexyl)phthalate (µg/kg) 2,000 UG 4,800 UG (TOS-SD3) Total LPAH (µg/kg) 6.7 UA 341 A (TOS-SD3) Total HPAH (µg/kg) 6.7 UA 1,496 A (TOS-SD3) Total PCBs (µg/kg) na na 2,3,7,8-TCDD (ng/kg) na na Total DDT (µg/kg) 3.35 UA 10.6A (GATX-SD3) Dibenzofuran (µg/kg) 500 UG 1,200 UG (TOS-SD3) 4-Methylphenol (µg/kg) 500 UG 1,200 UG (TOS-SD3) Diesel range hydrocarbons (mg/kg) na na Xylenes (µg/kg) 50 U 120 UG (TOS-SD3)
WLCT4J98. REMEDIAL INVESTIGATION REPORT TERMINAL 4, SLIP 3 SEDIMENTS, PORT OF PORTLAND (PREPARED BY HART CROWSER, APRIL 2000).
Hart Crowser conducted an RI of Terminal 4, Slip 3 sediments for the Port of Portland. The RI study area consisted of sediments located upriver at the Pier 5 Willamette River Dock, Slip 3, and Wheeler Bay immediately downriver and adjacent to Slip 3. The purpose was to delineate the extent of contamination and to evaluate potential risks to the Willamette River environment and to human health posed by contaminants in river sediments. Sub-tidal surface sediments (0-10 cm) were collected at 44 offshore stations. Nine subsurface samples were collocated with surface sampling stations.
Surface sediment samples were collected on October 12–15, 1998, using a hydraulic grab sampler, and subsampled using stainless-steel instruments. Surface sediments were analyzed for pencil pitch, diesel, metals, SVOCs, VOCs, pesticides (on a limited subset of samples), TOC, and grain size.
Subsurface sediment samples were collected on October 12, 1998, using a vibracorer. Sediment cores were sampled for a top layer (0 to 2 ft), a bottom layer (-2 to -4 ft), and a deeper layer (-4 to -6 ft). Subsurface sediment samples were analyzed for pencil pitch, diesel, metals, SVOCs, VOCs, pesticides (on a limited subset of samples), TOC, and grain size.
Results for indicator chemicals in surface and subsurface samples are presented in the following tables. All results were reported in dry weight.

Portland Harbor RI/FS Final Remedial Investigation Report
February 8, 2016
A1-15
Summary Data for Surface Samples. Parameter Minimum Maximum (Location) Arsenic (mg/kg) 3 14 G (HC-S-02) Cadmium (mg/kg) 0.2 6.6 G (HC-S-25) Copper (mg/kg) 15.3 90.1 (HC-S-02) Lead (mg/kg) 15.2 E 1,160 E (HC-S-19) Mercury (mg/kg) 0.02 E 0.34 E (HC-S-25) Zinc (mg/kg) 82 G 1,330 G (HC-S-25) TBT (µg/kg) na na bis(2-ethylhexyl)phthalate (µg/kg) 50 550 (HC-S-43) Total LPAH (µg/kg) 233 A 114,000 A (HC-S-02) Total HPAH (µg/kg) 2,068 A 765,000 A (HC-S-01) Total PCBs (µg/kg) na na 2,3,7,8-TCDD (ng/kg) na na Total DDT (µg/kg) 5 A 39 A (HC-S-16) Dibenzofuran (µg/kg) 20 UG 860 (HC-S-38) 4-Methylphenol (µg/kg) 20 U 130 (HC-S-19) Diesel range hydrocarbons (mg/kg) 25 U 2,100 (HC-S-01) Xylenes (µg/kg) 5 UT 25 UT (HC-S-11, HC-S-43)
Summary Data for Subsurface Samples. Parameter Minimum Maximum (Location) Arsenic (mg/kg) 2 G 15 G (HC-S-07) Cadmium (mg/kg) 0.1 UG 3.3 G (HC-S-07) Copper (mg/kg) 13.3 83.2 (HC-S-07) Lead (mg/kg) 3 576 (HC-S-07) Mercury (mg/kg) 0.02 0.18 (HC-S-07) Zinc (mg/kg) 37 G 656 G (HC-S-11) TBT (µg/kg) na na bis(2-ethylhexyl)phthalate (µg/kg) 20 U 180 G (HC-S-39) Total LPAH (µg/kg) 20 UA 10,000 A (HC-S-42) Total HPAH (µg/kg) 20 UA 198,000 A (HC-S-42) Total PCBs (µg/kg) na na 2,3,7,8-TCDD (ng/kg) na na Total DDT (µg/kg) na na Dibenzofuran (µg/kg) 20 U 4000 U 4-Methylphenol (µg/kg) 20 U 4000 U

Portland Harbor RI/FS Final Remedial Investigation Report
February 8, 2016
A1-16
Parameter Minimum Maximum (Location) Diesel range hydrocarbons (mg/kg) 25 U 100 U Xylenes (µg/kg) 5 T 10 UT (HC-S-11, HC-S-39, HC-S-42)
WLCT0I98. SEDIMENT CHARACTERIZATION STUDY OF LOCAL SPONSORS’ BERTHS, COLUMBIA AND WILLAMETTE RIVER NAVIGATION CHANNEL DEEPENING, LONGVIEW AND KALAMA, WASHINGTON AND PORTLAND, OREGON (PREPARED BY HART CROWSER, FEBRUARY 1999).
The purpose of this investigation was to provide preliminary dredge prism characterization for the dredging of the Columbia and Willamette navigation channels. Two sub-tidal sediment cores were collected at each DMMU identified in the project area. Cores were collected for the proposed dredge prisms at Berth 501, Terminal 6, Berth 401, and the Irving Street Terminal at the Port of Portland; the Harvest States Grain Terminal and the Peavey Grain Terminal at the Port of Kalama; and the Longview Grain Terminal at the Port of Longview. Twelve surface grab samples were also collected from deeper water locations in the Willamette River.
Subsurface sediment cores were collected using a vibracorer on September 14–17, 1998. Sediment cores were sectioned and composited from 0 to -3 ft and -3 to -5 ft. Sediment samples were analyzed for metals, SVOCs, VOCs, TBT, pesticides, PCBs, TOC, ammonia, sulfides, TVS, and total solids.
Surface sediment samples were collected on September 14–15, 1998. The report does not specifically describe the method by which the samples were collected, other than to say they were “grab samples.” In addition, no description of the grab sub-sampling scheme was presented. Surface sediment samples were analyzed for metals, SVOCs, VOCs, TBT, pesticides, PCBs, TOC, ammonia, sulfides, TVS, and total solids.
Organic carbon content ranged in the core composites from 0.05 to 1.63 percent, and in the grab samples from 0.65 to 2.27 percent. Results for indicator chemicals in surface and subsurface samples are presented in the following tables. All results were reported in dry weight.
Summary Data for Surface Samples. Parameter Minimum Maximum (Location) Arsenic (mg/kg) 0.7 2.4 G (Grab 09) Cadmium (mg/kg) 0.09 B 0.27 J (Grab 01) Copper (mg/kg) 12.3 48 (Grab 08) Lead (mg/kg) 4.64 17.7 (Grab 01) Mercury (mg/kg) 0.02 U 0.07 (multiple) Zinc (mg/kg) 38.6 73.9 (Grab 08) TBT (µg/kg) 0.02 UG 0.12 G (Grab 08) bis(2-ethylhexyl)phthalate (µg/kg) 100 U 1,000 (Grab 12)

Portland Harbor RI/FS Final Remedial Investigation Report
February 8, 2016
A1-17
Parameter Minimum Maximum (Location) Total LPAH (µg/kg) 20 A 155,000 A (Grab 05) Total HPAH (µg/kg) 212 A 452,000 A (Grab 05) Total PCBs (µg/kg) 10 UA 14 A (Grabs 10 & 12) 2,3,7,8-TCDD (ng/kg) na na Total DDT (µg/kg) 2 UA 65.9 A (Grab 04) Dibenzofuran (µg/kg) 20 U 10,000 U 4-Methylphenol (µg/kg) 20 U 10,000 U Diesel range hydrocarbons (mg/kg) na na Xylenes (µg/kg) na na
Summary Data for Subsurface Samples. Parameter Minimum Maximum (Location) Arsenic (mg/kg) 1 2.6 (B501-C1) Cadmium (mg/kg) 0.14 J 0.85 (B501-C1) Copper (mg/kg) 14.4 21.8 (B401-C1) Lead (mg/kg) 9.8 367 (IS-C2) Mercury (mg/kg) 0.05 0.21 (B401-C1) Zinc (mg/kg) 53.4 115 G (IS-C2) TBT (µg/kg) 0.03 G 0.05 G (IS-C1) Bis(2-ethylhexyl)phthalate (µg/kg) 20 U 220 (IS-C1) Total LPAH (µg/kg) 45 A 9,654 A (IS-C1) Total HPAH (µg/kg) 438 A 74,460 A (IS-C1) Total PCBs (µg/kg) 12 A 7,100 A (IS-C1) 2,3,7,8-TCDD (ng/kg) na na Total DDT (µg/kg) 2 UA 479.8 A (B401-C1) Dibenzofuran (µg/kg) 20 U 27 (IS-C1) 4-Methylphenol (µg/kg) 20 U 77 (B501-C1) Diesel range hydrocarbons (mg/kg) na na Xylenes (µg/kg) na na
WLCITH98. INTERNATIONAL TERMINALS-SEDIMENT SAMPLING EVENT, MEMORANDUM DRAFT, PORTLAND, OR (PREPARED BY SCHNITZER STEEL PRODUCTS COMPANY, DECEMBER 1998).
This investigation consisted of surface (10.2 to 12.5 cm) sediment sampling to determine whether sample SD012, collected by Roy F Weston in 1997, is representative of sediment quality

Portland Harbor RI/FS Final Remedial Investigation Report
February 8, 2016
A1-18
near the International Terminal (IT) facility and to establish baseline sediment quality within the slip. The IT property is located at 12005 North Burgard in Portland, Oregon, near RM 4.
Two sediment samples (SD-11 and SD-12) were collected using a 0.1m2 van Veen grab sampler on August 18, 1998. The sediment samples were analyzed for total solids, TOC, grain size, total metals, butyltins, organochlorine pesticides, and semivolatile organic compounds.
Summary Data for Surface Samples. Parameter Minimum Maximum (Location) Arsenic (mg/kg) 3 4 (SD12 RM 3.85) Cadmium (mg/kg) 0.2 U 0.3 (SD12 RM 3.85) Copper (mg/kg) 30 36 (SD12 RM 3.85) Lead (mg/kg) 12 24 (SD12 RM 3.85) Mercury (mg/kg) 0.06 0.07 (SD11 RM 3.78) Zinc (mg/kg) 62 101 (SD12 RM 3.85) TBT (µg/kg) 110 200 (SD03 RM 3.76) bis(2-ethylhexyl)phthalate (µg/kg) 200 400 (SD12 RM 3.85) Total LPAH (µg/kg) 100 TA 111 TA (SD11 RM 3.78) Total HPAH (µg/kg) 1,458 TA 3,341 TA (SD11 RM 3.78) Total PCBs (µg/kg) na na 2,3,7,8,-TCDD (ng/kg) na na Total DDT (µg/kg) 2 UTA 9 TA (SD11 RM 3.78) Dibenzofuran (µg/kg) 5 U 5 U (SD12 RM 3.85) 4-Methylphenol (µg/kg) na na Diesel range hydrocarbons (mg/kg) na na Xylenes (µg/kg) na na
PSYSEA98. PORTLAND SHIPYARD SEDIMENT INVESTIGATION DATA REPORT (PREPARED BY STRIPLIN ENVIRONMENTAL ASSOCIATES, INC., NOVEMBER 1998).
The purpose of this investigation was to characterize surface and subsurface sediment quality in the vicinity of the Portland Shipyard, develop site-specific sediment quality criteria, and to identify potential sources of contamination.
Sub-tidal sediments were collected at 52 surface and 23 subsurface locations. Surface samples were collected from the top 10 cm of the sediment. Subsurface core samples represented sediments composited over approximate 4-ft intervals (0 to -4 ft, -4 to -8 ft, and -8 to -12 ft). All sediments were collected over a 3-week period beginning on March 31, 1998.
Surface sediment samples were collected from March 31 through April 7, and on April 16, 1998, using a hydraulic grab sampler, and subsampled using stainless-steel instruments. Surface sediments were analyzed for selected metals, SVOCs, TOC, total solids, and grain size. All but

Portland Harbor RI/FS Final Remedial Investigation Report
February 8, 2016
A1-19
five samples were analyzed for porewater TBT and ammonia. Selected stations were analyzed for pesticides and VOCs.
Subsurface sediment samples were collected from April 14–16, 1998, using a vibracorer. Subsurface sediment samples for 15 cores were analyzed in 4-ft intervals for metals, SVOCs, PCBs, TOC, and grain size. Additionally, two cores were analyzed at 1-ft intervals for selected total metals, bulk TBT, and grain size.
Results for indicator chemicals in surface and subsurface samples are presented in the following tables. All results were reported in dry weight.
Summary Data for Surface Samples. Parameter Minimum Maximum (Location) Arsenic (mg/kg) 2 17 (PSY27) Cadmium (mg/kg) 0.1 U 23 (PSY08) Copper (mg/kg) 15.6 655 (PSY27) Lead (mg/kg) 10.2 96.6 (PSY21) Mercury (mg/kg) 0.05 U 0.54 (PSY49) Zinc (mg/kg) 66 683 E (PSY10) TBT (µg/kg) 0.025 U 11 (PSY27) bis(2-ethylhexyl)phthalate (µg/kg) 94 B 7,590 J (PSY08) Total LPAH (µg/kg) 10 A 2,467 A (PSY12) Total HPAH (µg/kg) 10 A 17,268 A (PSY12) Total PCBs (µg/kg) 10 UA 2,500 A (PSY14) 2,3,7,8-TCDD (ng/kg) na na Total DDT (µg/kg) 2 UA 153 A(PSY27) Dibenzofuran (µg/kg) 10 U 204 (PSY10) 4-Methylphenol (µg/kg) 100 U 760 (PSY77) Diesel range hydrocarbons (mg/kg) na na Xylenes (µg/kg) 5 U 25 U
Summary Data for Subsurface Samples. Parameter Minimum Maximum (Location) Arsenic (mg/kg) 2 U 21 (PSY30C, 36C) Cadmium (mg/kg) 0.1 U 1.6 (PSY30C) Copper (mg/kg) 10.5 1,580 (PSY30C) Lead (mg/kg) 2.1 146 (PSY30C) Mercury (mg/kg) 0.02 0.72 (PSY27C) Zinc (mg/kg) 24 1,340 (PSY30C)

Portland Harbor RI/FS Final Remedial Investigation Report
February 8, 2016
A1-20
Parameter Minimum Maximum (Location) TBT (µg/kg) 1 U 90,000 (PSY30C) bis(2-ethylhexyl)phthalate (µg/kg) 100 U 16,000 G (PSY36C) Total LPAH (µg/kg) 10 UA 5,780 A (PSY36C) Total HPAH (µg/kg) 10 UA 13,420 A (PSY36C) Total PCBs (µg/kg) 10 A 2,290 A (PSY20C) 2,3,7,8-TCDD (ng/kg) na na Total DDT (µg/kg) na na Dibenzofuran (µg/kg) 10 U 266 G (PSY36C) 4-Methylphenol (µg/kg) 100 UG 157 G (PSY01C) Diesel range hydrocarbons (mg/kg) na na Xylenes (µg/kg) na na
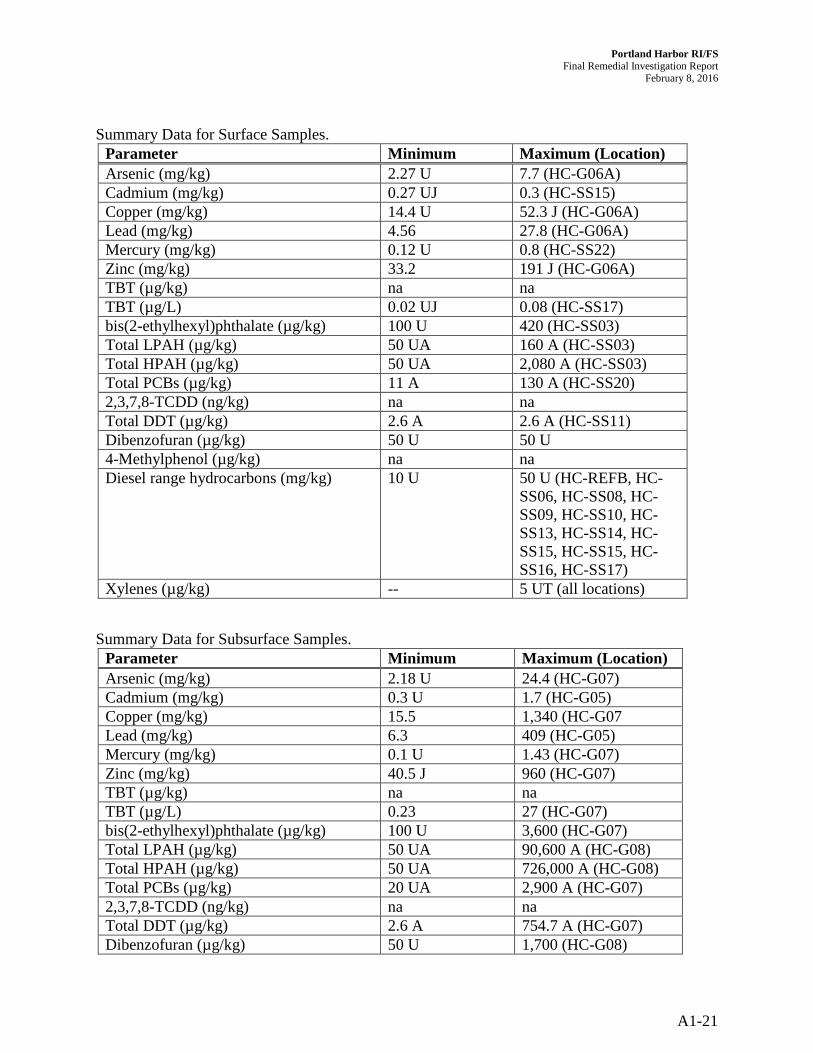
WLCRIL99. SITE INVESTIGATION REPORT, PORT OF PORTLAND CONFINED DREDGED MATERIAL DISPOSAL, ROSS ISLAND FACILITY, PORTLAND, OR (PREPARED BY HART CROWSER, NOVEMBER 30, 2000).
Hart Crowser conducted a site investigation at the Ross Island Confined Dredged Material Disposal Facility to determine whether dredged material from Port facilities, which was placed at Ross Island, posed a risk to human health or the environment. In addition to groundwater and surface water sampling, Hart Crowser collected samples of lagoon sediment.
Surface (0–10 cm) sediment samples were collected at 34 locations during November 16–19, 1999. These included 29 locations within the lagoon, Holgate Slough, and the adjacent Willamette River (Samples HC-SS01 through HC-SS31); two upstream background samples (HC-SS32 and HC-SS33); and three reference samples in the Columbia River (HC-REF1, HC-REF2, HC-REF3). Surface samples were collected using a van Veen grab.
Subsurface sediment samples were collected at 19 locations within Ross Island Lagoon (seven in disposal cells and 12 near the cells to assess slope stability) during November and December 1999. Borings ranged from 18 to 94.5 ft below mudline; sampling intervals ranged from approximately 4.4–26 ft to 15.5–59 ft. Subsurface samples were collected using a hollow-stem auger, split-spoon sampler, Gus sampler, and Hart sampler.
Samples were analyzed for TOC, grain size, metals, SVOCs, VOCs, PCBs, DDT, and TPH. Some samples were also analyzed for porewater TBT. Organic carbon in surface sediments ranged from 0.12 to 1.9 percent. Results for surface sediment samples and subsurface samples are provided below in separate tables. Results are reported in dry weight.
Portland Harbor RI/FS Final Remedial Investigation Report
February 8, 2016
A1-21
Summary Data for Surface Samples. Parameter Minimum Maximum (Location) Arsenic (mg/kg) 2.27 U 7.7 (HC-G06A) Cadmium (mg/kg) 0.27 UJ 0.3 (HC-SS15) Copper (mg/kg) 14.4 U 52.3 J (HC-G06A) Lead (mg/kg) 4.56 27.8 (HC-G06A) Mercury (mg/kg) 0.12 U 0.8 (HC-SS22) Zinc (mg/kg) 33.2 191 J (HC-G06A) TBT (µg/kg) na na TBT (µg/L) 0.02 UJ 0.08 (HC-SS17) bis(2-ethylhexyl)phthalate (µg/kg) 100 U 420 (HC-SS03) Total LPAH (µg/kg) 50 UA 160 A (HC-SS03) Total HPAH (µg/kg) 50 UA 2,080 A (HC-SS03) Total PCBs (µg/kg) 11 A 130 A (HC-SS20) 2,3,7,8-TCDD (ng/kg) na na Total DDT (µg/kg) 2.6 A 2.6 A (HC-SS11) Dibenzofuran (µg/kg) 50 U 50 U 4-Methylphenol (µg/kg) na na Diesel range hydrocarbons (mg/kg) 10 U 50 U (HC-REFB, HC-
SS06, HC-SS08, HC-SS09, HC-SS10, HC-SS13, HC-SS14, HC-SS15, HC-SS15, HC-SS16, HC-SS17)
Xylenes (µg/kg) -- 5 UT (all locations)
Summary Data for Subsurface Samples. Parameter Minimum Maximum (Location) Arsenic (mg/kg) 2.18 U 24.4 (HC-G07) Cadmium (mg/kg) 0.3 U 1.7 (HC-G05) Copper (mg/kg) 15.5 1,340 (HC-G07 Lead (mg/kg) 6.3 409 (HC-G05) Mercury (mg/kg) 0.1 U 1.43 (HC-G07) Zinc (mg/kg) 40.5 J 960 (HC-G07) TBT (µg/kg) na na TBT (µg/L) 0.23 27 (HC-G07) bis(2-ethylhexyl)phthalate (µg/kg) 100 U 3,600 (HC-G07) Total LPAH (µg/kg) 50 UA 90,600 A (HC-G08) Total HPAH (µg/kg) 50 UA 726,000 A (HC-G08) Total PCBs (µg/kg) 20 UA 2,900 A (HC-G07) 2,3,7,8-TCDD (ng/kg) na na Total DDT (µg/kg) 2.6 A 754.7 A (HC-G07) Dibenzofuran (µg/kg) 50 U 1,700 (HC-G08)
Portland Harbor RI/FS Final Remedial Investigation Report
February 8, 2016
A1-22
Parameter Minimum Maximum (Location) 4-Methylphenol (µg/kg) na na Diesel range hydrocarbons (mg/kg) na na Xylenes (µg/kg) na na
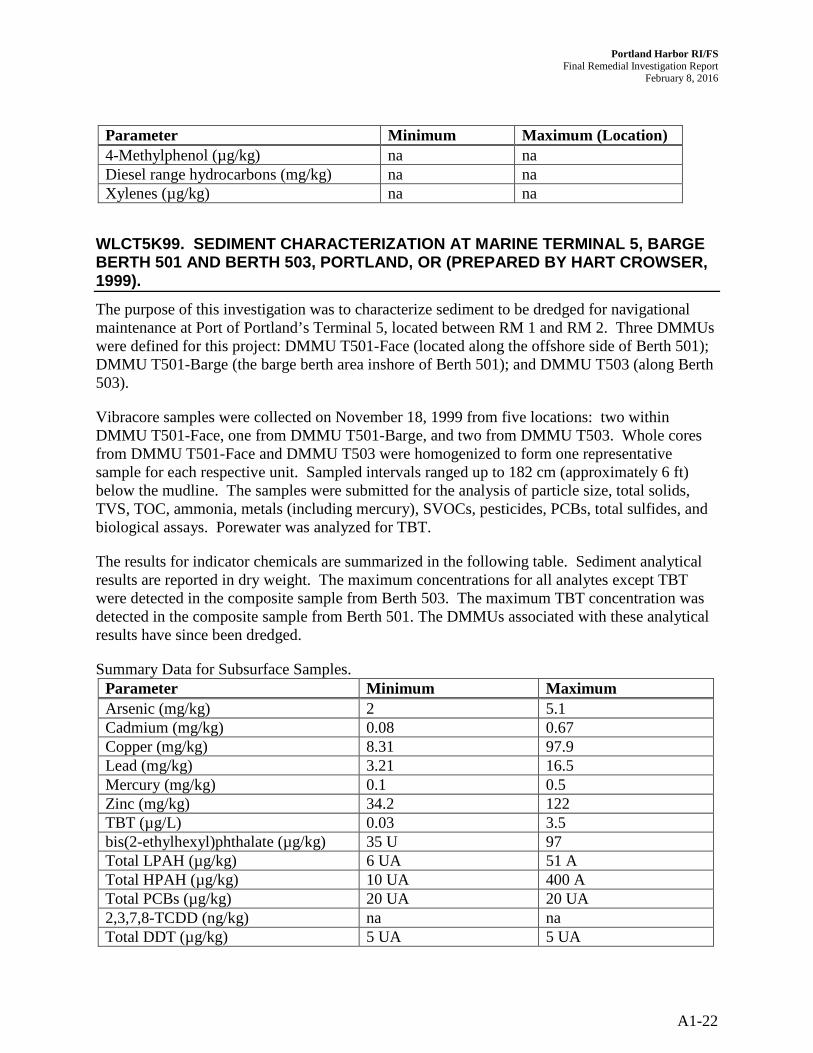
WLCT5K99. SEDIMENT CHARACTERIZATION AT MARINE TERMINAL 5, BARGE BERTH 501 AND BERTH 503, PORTLAND, OR (PREPARED BY HART CROWSER, 1999).
The purpose of this investigation was to characterize sediment to be dredged for navigational maintenance at Port of Portland’s Terminal 5, located between RM 1 and RM 2. Three DMMUs were defined for this project: DMMU T501-Face (located along the offshore side of Berth 501); DMMU T501-Barge (the barge berth area inshore of Berth 501); and DMMU T503 (along Berth 503).
Vibracore samples were collected on November 18, 1999 from five locations: two within DMMU T501-Face, one from DMMU T501-Barge, and two from DMMU T503. Whole cores from DMMU T501-Face and DMMU T503 were homogenized to form one representative sample for each respective unit. Sampled intervals ranged up to 182 cm (approximately 6 ft) below the mudline. The samples were submitted for the analysis of particle size, total solids, TVS, TOC, ammonia, metals (including mercury), SVOCs, pesticides, PCBs, total sulfides, and biological assays. Porewater was analyzed for TBT.
The results for indicator chemicals are summarized in the following table. Sediment analytical results are reported in dry weight. The maximum concentrations for all analytes except TBT were detected in the composite sample from Berth 503. The maximum TBT concentration was detected in the composite sample from Berth 501. The DMMUs associated with these analytical results have since been dredged.
Summary Data for Subsurface Samples. Parameter Minimum Maximum Arsenic (mg/kg) 2 5.1 Cadmium (mg/kg) 0.08 0.67 Copper (mg/kg) 8.31 97.9 Lead (mg/kg) 3.21 16.5 Mercury (mg/kg) 0.1 0.5 Zinc (mg/kg) 34.2 122 TBT (µg/L) 0.03 3.5 bis(2-ethylhexyl)phthalate (µg/kg) 35 U 97 Total LPAH (µg/kg) 6 UA 51 A Total HPAH (µg/kg) 10 UA 400 A Total PCBs (µg/kg) 20 UA 20 UA 2,3,7,8-TCDD (ng/kg) na na Total DDT (µg/kg) 5 UA 5 UA

Portland Harbor RI/FS Final Remedial Investigation Report
February 8, 2016
A1-23
Parameter Minimum Maximum Dibenzofuran (µg/kg) 6 U 6 U 4-Methylphenol (µg/kg) 10 U 10 U Diesel range hydrocarbons (mg/kg) na na Xylenes (µg/kg) na na
WLCRIJ99. BASELINE SEDIMENT CHARACTERIZATION, IN-WATER CLEAR ZONE SAMPLING RESULTS, ROSS ISLAND LAGOON (PREPARED BY LANDAU ASSOCIATES, JANUARY 24, 2000).
Landau conducted an investigation to evaluate sediment quality in the in-water clear zone of a mined area prior to reclamation.
Surface sediments (0–10 cm) were sampled in eight locations in the in-water clear zone (CZ01 to CZ08). Porewater samples from four of the eight locations were also analyzed. In addition, three surface sediment samples were collected in the vicinity of a previously sampled location (SVS-18, located in a 1998 breach area) to verify previously reported concentrations. Stations SVS-18-R1 and SVS-18-R2 were near the original station SVS-18; three grab samples from along the toe of the slope were composited into one sample for analysis (SVS-18-COMP). All samples were collected October 26–28, 1999, using an Ekman grab sampler.
Sediment samples were analyzed for TOC, grain size, metals, SVOCs, pesticides, PCBs, and organotins. Porewater samples were analyzed for organotins. Organic carbon ranged from 1.01 to 1.58 percent. Sediments were composed predominantly of silt and clay. Results for indicator chemicals in surface sediments are presented in the following table. All results were reported in dry weight.
Summary Data for Subsurface Samples. Parameter Minimum Maximum (Location) Arsenic (mg/kg) 2.7 6.6 (CZ06) Cadmium (mg/kg) 0.09 0.7 (SVS18R2) Copper (mg/kg) 25.5 56.9 (CZ07) Lead (mg/kg) 9.18 23.6 (CZ04) Mercury (mg/kg) 0.05 0.18 (SVS18R1) Zinc (mg/kg) 52.7 130 (SVS18R2) TBT (µg/kg) 15 117 (SVS18R1) TBT (µg/L) 0.006 J 0.01 J (CZ07) bis(2-ethylhexyl)phthalate (µg/kg) 40 JB 160 J (SVS18R1) Total LPAH (µg/kg) 13 A 184 A (SVS18R2) Total HPAH (µg/kg) 104 A 1,592 A (SVS18R2) Total PCBs (µg/kg) 20 UA 11 A (CZ03) 2,3,7,8-TCDD (ng/kg) na na Total DDT (µg/kg) 0.8 A 2.7 A (CZ03) Dibenzofuran (µg/kg) 2 J 7 (SVS18R2)

Portland Harbor RI/FS Final Remedial Investigation Report
February 8, 2016
A1-24
Parameter Minimum Maximum (Location) 4-Methylphenol (µg/kg) 200 U 200 U Diesel range hydrocarbons (mg/kg) na na Xylenes (µg/kg) na na
WLCRIV99. PHASE I REMEDIAL INVESTIGATION, ROSS ISLAND SAND & GRAVEL CO. (PREPARED BY LANDAU ASSOCIATES, SEPTEMBER 20, 2000).
Landau collected sediment samples to provide supplemental data for a remedial investigation (RI) of the Ross Sand & Gravel site. The overall objective of the RI was to collect data in conjunction with other site investigations to provide an indication of the nature and extent of contamination at the site and to focus subsequent RI study components.
Four surface sediment samples were collected in October 1999. Two samples (PA01 and PA02) were collected within Ross Island lagoon, and two samples (PA03 and PA04) were collected within Holgate Slough. These surface samples were collected from the top 10 cm of sediment. In addition, 41 subsurface sediment samples from 15 borings within the lagoon were collected during November and December 1999. These included two samples from the 0–1 cm depth interval. The subsurface samples were collected in conjunction with a Port of Portland investigation (see WLCRIL99). Sampling methods were not reported in the Phase I RI report (Landau 2000), but the Port reported that subsurface samples were collected using a hollow-stem auger, split-spoon sampler, Gus sampler, and Hart sampler.
Surface samples were analyzed for TOC, grain size, metals, SVOCs, VOCs, pesticides, PCBs, hydrocarbons, and organotins. Organic carbon in surface sediments ranged from 1.44 to 1.69 percent. Results for indicator chemicals in surface sediments are presented in the following table. All results were reported in dry weight.
Summary Data for Surface Samples. Parameter Minimum Maximum (Location) Arsenic (mg/kg) 3 7.7 (G06A) Cadmium (mg/kg) 0.08 U 0.234 (PA01) Copper (mg/kg) 24.8 55.6 (PA01) Lead (mg/kg) 11.8 27.8 (G06A) Mercury (mg/kg) 0.04 0.18 (PA01, PA02) Zinc (mg/kg) 72.5 191 J (G06A) TBT (µg/kg) 0.4 J 11 (PA01) bis(2-ethylhexyl)phthalate (µg/kg) 100 U 180 (G06A) Total LPAH (µg/kg) 11 A 55A (G06A, PA02) Total HPAH (µg/kg) 77 A 442 A (G05) Total PCBs (µg/kg) 5 A 8 A(PA03)
2,3,7,8-TCDD (ng/kg) na na Total DDT (µg/kg) 0.9 A 2.3 A (PA03)

Portland Harbor RI/FS Final Remedial Investigation Report
February 8, 2016
A1-25
Parameter Minimum Maximum (Location) Dibenzofuran (µg/kg) 1 J 3 J (PA02) 4-Methylphenol (µg/kg) 200 U 200 U Diesel range hydrocarbons (mg/kg) 10 U 50 U (G06A) Xylenes (µg/kg) -- 10 UT (all locations)
Subsurface samples were analyzed for conventional parameters, metals, SVOCs, pesticides, PCBs, hydrocarbons, and organotins. Organic carbon in subsurface sediments ranged from 0.06 to 7.35 percent. Results for indicator chemicals in subsurface sediments are presented in the following table.
Summary Data for Subsurface Samples. Parameter Minimum Maximum (Location) Arsenic (mg/kg) 0.2 UJ 24.4 (G07) Cadmium (mg/kg) 0.03 U 1.7 (G05) Copper (mg/kg) 10.5 1,340 (G07) Lead (mg/kg) 2 409 (G05) Mercury (mg/kg) 0.01 J 1.43 (G07) Zinc (mg/kg) 21.9 960 (G07) TBT (µg/kg) 0.2 J 2,000 (G07) bis(2-ethylhexyl)phthalate (µg/kg) 100 J 3,600 (G07) Total LPAH (µg/kg) 50 UA 90,600 A (G08) Total HPAH (µg/kg) 50 UA 726,000 A (G08) Total PCBs (µg/kg) 4 A 2,900 A (G07) 2,3,7,8-TCDD (ng/kg) na Na Total DDTs (µg/kg) 0.2 A 6,500 A (G05) Dibenzofuran (µg/kg) 50 U 1,700 (G08) 4-Methylphenol (µg/kg) na na Diesel range hydrocarbons (mg/kg) 10 U 540 (G10) Xylenes (µg/kg) 4 UT 7.4 UT (G06B)
WLCGXV99. ENVIRONMENTAL SITE ASSESSMENT, GATX TERMINALS CORPORATION LINNTON TERMINAL (PREPARED BY KHM ENVIRONMENTAL MANAGEMENT, DECEMBER 1999).
KHM Environmental Management conducted an investigation to provide baseline petroleum hydrocarbon data in subsurface soils at the Linnton Terminal and sediments in the adjacent Willamette River.
A total of eight sediment samples were collected at four locations on October 8, 1999. Stations S-1 and S-2 were located near sump outfalls. Stations S-3 and S-4 were located in the river

Portland Harbor RI/FS Final Remedial Investigation Report
February 8, 2016
A1-26
adjacent to the facility. One surface (0–10 cm) and one subsurface (30–40 cm) sample were collected at each location. Samples were collected using a core-type sampler.
Samples were analyzed for TOC, grain size, ammonia, metals, SVOCs, VOCs, pesticides, and PCBs. Organic carbon ranged from 0.2 to 1.5 percent. Results for surface sediment samples and subsurface samples are provided below in separate tables. Results are reported in dry weight.
Summary Data for Surface Samples. Parameter Minimum Maximum (Location) Arsenic (mg/kg) 2.6 4.32 (S-1) Cadmium (mg/kg) 0.5 U 1.02 U (S-3) Copper (mg/kg) 22.4 28.3 (S-3) Lead (mg/kg) 16.5 29.4 (S-4) Mercury (mg/kg) 0.1 U 0.112 (S-4) Zinc (mg/kg) 68.8 126 (S-4) TBT (µg/kg) na na bis(2-ethylhexyl)phthalate (µg/kg) 2,000 U 20,400 U (S-3) Total LPAH (µg/kg) 330 UA 2,250 A (S-2) Total HPAH (µg/kg) 330 UA 8,670 A (S-2) Total PCBs (µg/kg) 134 UA 274 UA (S-3) 2,3,7,8-TCDD (ng/kg) na na Total DDT (µg/kg) 6.7UA 29.2 A (S-4) Dibenzofuran (µg/kg) 330 U 3,370 U (S-3) 4-Methylphenol (µg/kg) na na Diesel range hydrocarbons (mg/kg) na na Xylenes (µg/kg) na na
Summary Data for Subsurface Samples.
Parameter Minimum Maximum (Location) Arsenic (mg/kg) 3.61 6.62 (S-2) Cadmium (mg/kg) 0.5 U 1.08 U (S-2) Copper (mg/kg) 26.8 34.4 (S-2) Lead (mg/kg) 17.8 47 (S-2) Mercury (mg/kg) 0.149 0.333 (S-1) Zinc (mg/kg) 69.8 164 (S-2) TBT (µg/kg) na na bis(2-ethylhexyl)phthalate (µg/kg) 2,000 U 21,500 U (S-2) Total LPAH (µg/kg) 330 UA 1,670 A (S-3) Total HPAH (µg/kg) 330 UA 2,750 A (S-4) Total PCBs (µg/kg) 85.9 A 194 A (S-4) 2,3,7,8-TCDD (ng/kg) na Na Total DDT (µg/kg) 6.7 UA 33.1 A (S-4) Dibenzofuran (µg/kg) 330 U 3,550 U (S-2) 4-Methylphenol (µg/kg) na na

Portland Harbor RI/FS Final Remedial Investigation Report
February 8, 2016
A1-27
Parameter Minimum Maximum (Location) Diesel range hydrocarbons (mg/kg) na na Xylenes (µg/kg) na na
WLCMBJ99. SEDIMENT REMEDIAL DESIGN FINAL SAMPLING DATA SUMMARY REPORT, MCCORMICK & BAXTER CREOSOTING COMPANY, PORTLAND, OR (PREPARED BY ECOLOGY AND ENVIRONMENT, INC., FEBRUARY 2001).
Ecology and Environment conducted sediment sampling on behalf of DEQ to support the remedial design for contaminated sediment at the McCormick & Baxter Creosoting Company’s Portland facility, located at approximately RM 7.
Phase I of the remedial design sampling was conducted in October 1999 and included surface water and sediment sampling. Thirty-nine sediment samples were collected within approximately 300–400 ft of the facility shoreline, from a mudline depth interval of 0–6 in. Four reference samples were collected at approximately RM 18, 22, 23, and 24. Samples were collected using a ponar grab sampler deployed from a sampling platform or vessel. Samples were composited from three replicate grabs on average, although up to 12 grabs were required at one location to acquire sufficient sample volume. The samples were submitted for grain-size distribution, arsenic, pentachlorophenol, PAHs, and toxicity analyses. Selected samples were analyzed for dioxins/furans.
The sediment samples were composed primarily of sands, which ranged from 72.67 to 100 percent of sample material. Results for indicator chemicals are summarized in the following table. All results were reported in dry weight.
Summary Data for Surface Samples. Parameter Minimum Maximum Arsenic (mg/kg) 2.9 11.7 Cadmium (mg/kg) na na Copper (mg/kg) na na Lead (mg/kg) na na Mercury (mg/kg) na na Zinc (mg/kg) na na TBT (µg/L) na na bis(2-ethylhexyl)phthalate (µg/kg) na na Total LPAH (µg/kg) 10 UA 282,830 A Total HPAH (µg/kg) 10 UA 102,460 A Total PCBs (µg/kg) na na 2,3,7,8-TCDD (ng/kg) 1 U 4 Total DDT (µg/kg) na na Dibenzofuran (µg/kg) na na 4-Methylphenol (µg/kg) na na Diesel range hydrocarbons (mg/kg) na na

Portland Harbor RI/FS Final Remedial Investigation Report
February 8, 2016
A1-28
Parameter Minimum Maximum Xylenes (µg/kg) na na
WLR0499; WLR1199. WILLAMETTE RIVER SEDIMENT SAMPLING EVALUATION (PREPARED BY U.S. ARMY CORPS OF ENGINEERS, JUNE 1999 AND MARCH 2000).
USACE collected sediment cores during two sampling surveys in the Willamette River to characterize sediments prior to maintenance dredging to determine whether sediments were suitable for open, in-water disposal.
In the first survey, a total of nine sediment cores representing three DMMUs were collected on April 29, 1999. The sediment represented by the April samples exceeded the Dredged Material Evaluation Framework screening levels and required additional chemical and biological testing. Therefore, a second survey was conducted. Five additional sediment cores were collected on November 29, 1999, from five of the nine locations sampled in April. In addition, a fourth DMMU was added and three additional cores collected from a shoal at RM 11.
Sediment Sampling Locations.
DMMU RM Location
Station (WLR0449,
April)
Station (WLR1199, November)
1 2+10 East edge of navigation channel off Oregon Steel Mill dock
WR-VC01A WR-VC02N WR-VC02A
2 9 to 9+35 Shoal on west edge of navigation channel
WR-VC03A WR-VC05N WR-VC04A 3 8+30 to 8+50 Navigation channel in front
of Texaco dock WR-VC05A WR-VC03N
WR-VC06A WR-VC04N WR-VC07A WR-VC08A 4 11 Shoal in navigation channel. Not sampled WR-VC06N
WR-VC07N WR-VC08N The depth interval for all samples was 0–8 ft. At stations WR-VC08 (April), WR-VC06 (November), and WR-VC07 (November), the bottom interval (approximately 8–12 ft) was also analyzed. Cores were collected using a vibracorer.
The subsurface samples were analyzed for conventionals, metals, SVOCs, PCBs, pesticides, and herbicides. Some samples were also analyzed for dioxin/furans and porewater organotins. Organic carbon ranged from 0.37 to 2.4 percent. Results for indicator chemicals are presented in the following table. All results were reported in dry weight.

Portland Harbor RI/FS Final Remedial Investigation Report
February 8, 2016
A1-29
Summary Data for Subsurface Samples. Parameter Minimum Maximum (Location) Arsenic (mg/kg) 2.4 J 5 (WR-VC06N) Cadmium (mg/kg) 0.17 J 0.41 J (WR-VC02N) Copper (mg/kg) 30 44 (WR-VC04N) Lead (mg/kg) 15 42 (WR-VC06N) Mercury (mg/kg) 0.079 J 0.35 (WR-VC06N) Zinc (mg/kg) 83 230 (WR-VC07N) TBT (µg/kg) na na TBT (µg/L) 0.02 U 0.13 (WR-VC07N) bis(2-ethylhexyl)phthalate (µg/kg) 11 JB 210 B (WR-VC07N) Total LPAH (µg/kg) 3.2 UA 322 A (WR-VC01A) Total HPAH (µg/kg) 8.9 A 699 A (WR-VC01A) Total PCBs (µg/kg) 26 UA 32 UA (WR-VC06A) 2,3,7,8-TCDD (ng/kg) 0.68 U 0.76 U (WR-VC05N) Total DDT (µg/kg) 2.9 A 15.4 A (WR-VC07N) Dibenzofuran (µg/kg) 3.6 J 16 (WR-VC07N) 4-Methylphenol (µg/kg) na na Diesel range hydrocarbons (mg/kg) na na Xylenes (µg/kg) na na
TOSCO99. JANUARY 1999 SEDIMENT SAMPLING RESULTS FOR TOSCO PORTLAND TERMINAL (PREPARED BY EXPONENT, APRIL 29, 1999).
Exponent conducted a sediment investigation at the Tosco Portland Terminal to determine whether sediments proposed for dredging were acceptable for unconfined, open-water disposal.
Sediment cores were collected on January 20–22, 1999, at six locations in the dredged area adjacent to the facility. Cores were composited into two samples for analysis. Core sample intervals ranged from 0–4 to 0–6.8 ft in DMMU 1, and from 0–8 to 0–11 ft in DMMU 2. Cores were collected using a 4-in.-diameter vibracorer with polyethylene (i.e., LEXAN®) core liners.
Samples were analyzed for conventional parameters, metals, SVOCs, PCBs, and pesticides. Organic carbon ranged from 1.97 to 2.24 percent, and samples contained greater than 80 percent fine-grained material. Results for indicator chemicals are presented in the following table. All results were reported in dry weight.
Summary Data for Subsurface Samples. Parameter Minimum Maximum (Location) Arsenic (mg/kg) 4 G 5 G (DMMU 1) Cadmium (mg/kg) 1 U 1 U (DMMU 1 & 2) Copper (mg/kg) 44 46 (DMMU 1) Lead (mg/kg) 21 29 (DMMU 1) Mercury (mg/kg) 0.2 U 0.2 (DMMU 2) Zinc (mg/kg) 144 164 (DMMU 1)

Portland Harbor RI/FS Final Remedial Investigation Report
February 8, 2016
A1-30
Parameter Minimum Maximum (Location) TBT (µg/kg) na na bis(2-ethylhexyl)phthalate (µg/kg) 140 370 (DMMU 1) Total LPAH (µg/kg) 400 A 962 A (DMMU 1) Total HPAH (µg/kg) 1,133 A 2,309 A (DMMU 1) Total PCBs (µg/kg) 74 A 240 A (DMMU 1) 2,3,7,8-TCDD (ng/kg) na na Total DDT (µg/kg) 19 A 52 A (DMMU 2) Dibenzofuran (µg/kg) 13 46 (DMMU 1) 4-Methylphenol (µg/kg) 48 63 (DMMU 2) Diesel range hydrocarbons (mg/kg) na na Xylenes (µg/kg) na na
WLRELF99. ELF ATOCHEM ACID PLANT AREA REMEDIAL INVESTIGATION INTERIM DATA REPORT (PREPARED BY EXPONENT, JUNE 1999).
The purpose of this investigation was to identify and delineate the nature and extent of COIs in soil, groundwater, and sediments related to the former DDT manufacturing facility. Sediments were collected from six riverbank (RB) and six offshore (OS) stations adjacent to the Elf Atochem site.
Riverbank samples were collected on November 23–24, 1998. Riverbank sediment samples were collected from 0–10 cm using a stainless-steel spoon, and from >10 cm using a titanium drive corer. Coring depths to the 90-cm target depth could be achieved at only one station (RB-6). Subsurface refusal limited penetration to 35 cm or less at stations RB-1, RB-2, RB-3, RB-4, and RB-5. Surface sediments and sediment core samples were analyzed for SVOCs, VOCs, TOC, and grain size.
Offshore sediment samples were collected on January 19–20, 1999. Offshore sediments were collected with either a Livingston® gravity corer or with a vibracorer. Sediment cores were sampled for a surface interval (0–10 cm) and a deeper interval (either one 20-cm interval, or, at two stations, an entire 10-to-90-cm interval). Sediment samples were analyzed for SVOCs, VOCs, organochlorine pesticides, TOC, and grain size. Results for indicator chemicals in surface and subsurface samples are presented in the following tables. All results were reported in dry weight.
Summary Data for Surface Samples. Parameter Minimum Maximum (Location) Arsenic (mg/kg) na na Cadmium (mg/kg) na na Copper (mg/kg) na na Lead (mg/kg) na na Mercury (mg/kg) na na

Portland Harbor RI/FS Final Remedial Investigation Report
February 8, 2016
A1-31
Parameter Minimum Maximum (Location) Zinc (mg/kg) na na TBT (µg/kg) na na bis(2-ethylhexyl) phthalate (µg/kg) 20 UG 1,800 (OSS006) Total LPAH (µg/kg) 10 UA 2,246 A (OSS004) Total HPAH (µg/kg) 25.5 A 69,700 A (OSS004) Total PCBs (µg/kg) na na 2,3,7,8-TCDD (ng/kg) na na Total DDT (µg/kg) 57 A 84,909 A (OSS002) Dibenzofuran (µg/kg) 5 U 76 (OSS004) 4-Methylphenol (µg/kg) na na Diesel range hydrocarbons (mg/kg) na na Xylenes (µg/kg) na na
Summary Data for Subsurface Samples. Parameter Minimum Maximum (Location) Arsenic (mg/kg) na na Cadmium (mg/kg) na na Copper (mg/kg) na na Lead (mg/kg) na na Mercury (mg/kg) na na Zinc (mg/kg) na na TBT (µg/kg) na na Bis(2-ethylhexyl)phthalate (µg/kg) 20 U 4,200 (OSS006) Total LPAH (µg/kg) 10 UA 16,780 A (OSS004) Total HPAH (µg/kg) 14 A 118,400 A (OSS004) Total PCBs (µg/kg) na na 2,3,7,8-TCDD (ng/kg) na na Total DDT (µg/kg) 122 A 22,556 A (OSS002) Dibenzofuran (µg/kg) 5 U 360 (OSS004) 4-Methylphenol (µg/kg) na na Diesel range hydrocarbons (mg/kg) na na Xylenes (µg/kg) na na

Portland Harbor RI/FS Final Remedial Investigation Report
February 8, 2016
A1-32
PPTLDT24. SEDIMENT CHARACTERIZATION STUDY MARINE TERMINAL 2, BERTHS 203-206, PORT OF PORTLAND (PREPARED BY HART CROWSER, MARCH 1999).
Hart Crowser conducted a pre-maintenance dredging sediment characterization at Terminal 2 on the Willamette River for the Port of Portland. Maintenance dredging was proposed at Berths 203, 204, 205, and 206 to remove sediment that had accumulated above navigational depths. Sub-tidal sediment cores (5.5 to 6 ft in depth) were collected at five offshore stations to characterize two DMMUs. Two cores in Berth 203 (HC-VC-04 and HC-VC-05) were composited to characterize one DMMU, and three cores from Berths 204-206 (HC-VC-01, HC-VC-02, and HC-VC-03) were composited to characterize a second DMMU.
Subsurface sediment samples were collected on September 15, 1998. The method by which the cores were collected was not described in the report. Sediment cores were sectioned and composited from 0 to -3 ft. Sediment samples were analyzed for metals, SVOCs, VOCs, TBT, pesticides, PCBs, TOC, ammonia, sulfides, TVS, total solids, and grain size.
Results for indicator chemicals in surface and subsurface samples are presented in the following tables. All results were reported in dry weight.
Summary Data for Subsurface Samples. Parameter Minimum Maximum Arsenic (mg/kg) 1.4 G 2 G Cadmium (mg/kg) 0.13 G 0.17 G Copper (mg/kg) 17.2 G 22.5 G Lead (mg/kg) 11.6 14.4 Mercury (mg/kg) 0.05 0.06 Zinc (mg/kg) 55.9 G 85.7 G TBT (µg/kg) 0.02 UG 0.04 U bis(2-ethylhexyl)phthalate (µg/kg) 120 G 350 G Total LPAH (µg/kg) 26 A 117 A Total HPAH (µg/kg) 510 A 1,105 A Total PCBs (µg/kg) 10 UA 26 A 2,3,7,8-TCDD (ng/kg) na na Total DDT (µg/kg) 2 UA 103 A Dibenzofuran (µg/kg) 20 U 20 U 4-Methylphenol (µg/kg) 20 U 20 U Diesel range hydrocarbons (mg/kg) na na Xylenes (µg/kg) na na
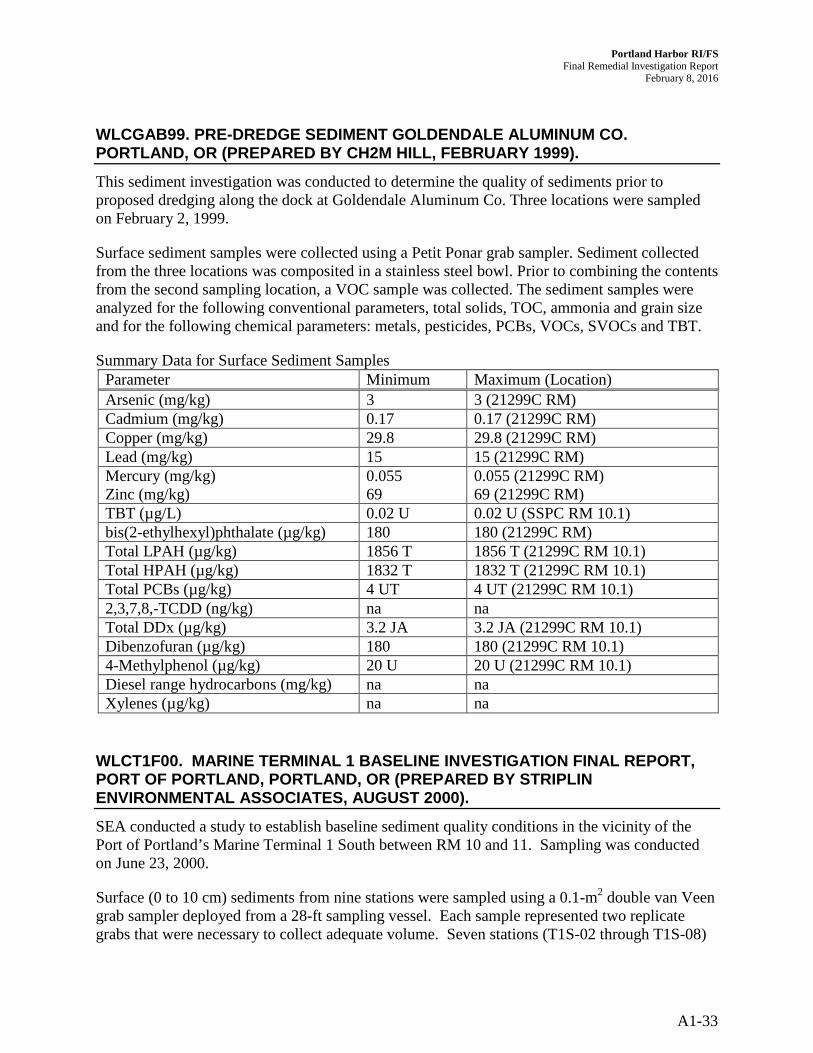
Portland Harbor RI/FS Final Remedial Investigation Report
February 8, 2016
A1-33
WLCGAB99. PRE-DREDGE SEDIMENT GOLDENDALE ALUMINUM CO. PORTLAND, OR (PREPARED BY CH2M HILL, FEBRUARY 1999).
This sediment investigation was conducted to determine the quality of sediments prior to proposed dredging along the dock at Goldendale Aluminum Co. Three locations were sampled on February 2, 1999.
Surface sediment samples were collected using a Petit Ponar grab sampler. Sediment collected from the three locations was composited in a stainless steel bowl. Prior to combining the contents from the second sampling location, a VOC sample was collected. The sediment samples were analyzed for the following conventional parameters, total solids, TOC, ammonia and grain size and for the following chemical parameters: metals, pesticides, PCBs, VOCs, SVOCs and TBT.
Summary Data for Surface Sediment Samples Parameter Minimum Maximum (Location) Arsenic (mg/kg) 3 3 (21299C RM) Cadmium (mg/kg) 0.17 0.17 (21299C RM) Copper (mg/kg) 29.8 29.8 (21299C RM) Lead (mg/kg) 15 15 (21299C RM) Mercury (mg/kg) 0.055 0.055 (21299C RM) Zinc (mg/kg) 69 69 (21299C RM) TBT (µg/L) 0.02 U 0.02 U (SSPC RM 10.1) bis(2-ethylhexyl)phthalate (µg/kg) 180 180 (21299C RM) Total LPAH (µg/kg) 1856 T 1856 T (21299C RM 10.1) Total HPAH (µg/kg) 1832 T 1832 T (21299C RM 10.1) Total PCBs (µg/kg) 4 UT 4 UT (21299C RM 10.1) 2,3,7,8,-TCDD (ng/kg) na na Total DDx (µg/kg) 3.2 JA 3.2 JA (21299C RM 10.1) Dibenzofuran (µg/kg) 180 180 (21299C RM 10.1) 4-Methylphenol (µg/kg) 20 U 20 U (21299C RM 10.1) Diesel range hydrocarbons (mg/kg) na na Xylenes (µg/kg) na na
WLCT1F00. MARINE TERMINAL 1 BASELINE INVESTIGATION FINAL REPORT, PORT OF PORTLAND, PORTLAND, OR (PREPARED BY STRIPLIN ENVIRONMENTAL ASSOCIATES, AUGUST 2000).
SEA conducted a study to establish baseline sediment quality conditions in the vicinity of the Port of Portland’s Marine Terminal 1 South between RM 10 and 11. Sampling was conducted on June 23, 2000.
Surface (0 to 10 cm) sediments from nine stations were sampled using a 0.1-m2 double van Veen grab sampler deployed from a 28-ft sampling vessel. Each sample represented two replicate grabs that were necessary to collect adequate volume. Seven stations (T1S-02 through T1S-08)

Portland Harbor RI/FS Final Remedial Investigation Report
February 8, 2016
A1-34
were located offshore of Berths 104, 105, and 106, and the remaining two were located upstream (T1S-09) and downstream (T1S-01) of the berth areas to assess impacts stemming from potential sources beyond the Terminal 1 property boundaries.
The samples were analyzed for TOC, grain-size distribution, VOCs, total sulfides, SVOCs, pesticides, PCBs, and metals, and porewater was analyzed for TBT. The samples were generally fine-grained; fines content ranged from approximately 27 to 66 percent. Organic content ranged from 1.4 to 2.65 percent. The results for indicator chemicals are summarized in the following table.
Summary Data for Surface Samples. Parameter Minimum Maximum (Location) Arsenic (mg/kg) 3.3 5.5 (T1S-06) Cadmium (mg/kg) 0.16 0.26 (T1S-03) Copper (mg/kg) 30.1 N 57.2 N (T1S-01) Lead (mg/kg) 10.7 20.8 (T1S-01) Mercury (mg/kg) 0.04 0.56 (T1S-09) Zinc (mg/kg) 75.5 N 114 N (T1S-01) TBT (µg/L) 0.05 UX 0.05 UX bis(2-ethylhexyl)phthalate (µg/kg) 140 310 (T1S-08) Total LPAH (µg/kg) 20 UA 157 A (T1S-09) Total HPAH (µg/kg) 20 UA 410 A (T1S-09) Total PCBs (µg/kg) 14 A 41 A (T1S-01) 2,3,7,8-TCDD (ng/kg) na na Total DDT (µg/kg) 1.8 A 6.7 A (T1S-09) Dibenzofuran (µg/kg) 20 U 20 U 4-Methylphenol (µg/kg) 120 U 120 (U) Diesel range hydrocarbons (mg/kg) na na Xylenes (µg/kg) 2 U 10 U (T1S-06)
X – See case narrative.
WLCGAF00. DREDGING SAMPLING RESULTS, GOLDENDALE ALUMINA UNLOADING FACILITY, PHASE I SAMPLING, PORTLAND, OR (PREPARED BY CH2M HILL, MARCH 2001).
Phase I of this investigation consisted of sampling to characterize sediments proposed for removal during maintenance dredging at GAC’s Portland Unloading Facility dock (RM 11). The results of previous sampling of the material conducted in 1999 by CH2M Hill had indicated that chemical concentrations in the material were below screening levels for aquatic disposal, but DEQ requested additional sampling to characterize the material for disposal at Ross Island.
Five surface (0–30 cm) sediment samples were collected on June 12, 2000 from the proposed dredging area near the facility’s dock. The sampling was performed by David Evans and Associates using a ponar clamshell sampler deployed from a boat. The samples were analyzed for grain-size distribution, conventional parameters (ammonia as nitrogen, total sulfide, TOC),

Portland Harbor RI/FS Final Remedial Investigation Report
February 8, 2016
A1-35
VOCs, SVOCs, organochlorine pesticides, PCBs, butyltins, and metals. Three of the samples were selected by GAC and DEQ for bioassays.
The samples were primarily composed of silt with very fine sand. Organic content ranged from 1.91 to 2.47 percent. The results for indicator chemicals are summarized in the following table. The results (except porewater TBT) are reported on a dry-weight basis.
Summary Data for Surface Samples. Parameter Minimum Maximum Arsenic (mg/kg) 2.9 3.8 Cadmium (mg/kg) 0.16 0.17 Copper (mg/kg) 31.6 34 Lead (mg/kg) 11.5 13.3 Mercury (mg/kg) 0.2 U 0.2 U Zinc (mg/kg) 68.5 73.1 TBT (µg/L) 6.3 36 bis(2-ethylhexyl)phthalate (µg/kg) 95 2,700 Total LPAH (µg/kg) 12 A 2,948 A Total HPAH (µg/kg) 95 9,585 A Total PCBs (µg/kg) 20 UA 20 UA 2,3,7,8-TCDD (ng/kg) na na Total DDT (µg/kg) 1.9 A 4.7 A Dibenzofuran (µg/kg) 3 J 64 4-Methylphenol (µg/kg) 25 U 25 U Diesel range hydrocarbons (mg/kg) na na Xylenes (µg/kg) 20 U 24 U
WLCGAL00. PRELIMINARY ASSESSMENT AND DREDGING SAMPLING RESULTS, GOLDENDALE ALUMINA UNLOADING FACILITY, PHASE II SAMPLING, PORTLAND, OR (PREPARED BY CH2M HILL, MARCH 2001).
Following maintenance dredging at the Goldendale Alumina Company (GAC) dock in October 2000, sediment sampling was conducted as part of a preliminary assessment (PA) of the GAC facility. The PA was performed by GAC, as requested in DEQ’s strategy recommendation for the site.
Three surface (0–30 cm) sediment samples were collected on December 21, 2000 and analyzed for PAHs. Two of the samples (Post Dredge 1 and Post Dredge 2) were collected from within the dredged area and one (UP Outfall) was collected near a stormwater outfall. A stormwater sample was subsequently collected in January 2001 to assess whether stormwater near the site was contributing to PAHs detected in sediments near the dock. No PAHs or oil and grease constituents were detected in the stormwater.

Portland Harbor RI/FS Final Remedial Investigation Report
February 8, 2016
A1-36
The analytical results of indicator chemicals in the three Phase II sediment samples are summarized in the following table. The maximum concentrations were all detected in sample Post Dredge 2. All results are reported on a dry-weight basis.
Summary Data for Surface Samples. Parameter Minimum Maximum Arsenic (mg/kg) na na Cadmium (mg/kg) na na Copper (mg/kg) na na Lead (mg/kg) na na Mercury (mg/kg) na na Zinc (mg/kg) na na TBT (µg/L) na na bis(2-ethylhexyl)phthalate (µg/kg) na na Total LPAH (µg/kg) 193 A 5,530 A Total HPAH (µg/kg) 1,357 A 40,280 A Total PCBs (µg/kg) na na 2,3,7,8-TCDD (ng/kg) na na Total DDT (µg/kg) na na Dibenzofuran (µg/kg) 9.6 280 4-Methylphenol (µg/kg) na na Diesel range hydrocarbons (mg/kg) na na Xylenes (µg/kg) na na
WLCOSJ00. PRE-REMEDIAL INVESTIGATION FIELD ACTIVITIES DATA REPORT, OREGON STEEL MILLS, INC. (OSM), PORTLAND, OR (PREPARED BY EXPONENT, FEBRUARY 2001).
Exponent performed this pre-remedial investigation at the OSM Portland mill in October 2000. The facility is located at approximately RM 2. Field activities included upland subsurface soil and groundwater sampling near a former oil sump, and beach sampling in the vicinity of stormwater outfalls along the Willamette River.
Beach sampling was conducted on October 10–11, 2000. Surface (0–10 cm) samples were collected from four stations in the vicinity of each of two outfalls (Outfalls 001 and 003) that drain the property. In addition, two surface samples were collected 100 ft apart near both the upstream and downstream property boundaries. Deeper samples were obtained at two additional stations near Outfall 003 using a coring device or a shovel. Deeper samples could not be obtained near Outfall 001 due to refusal. The sample locations, IDs, and intervals are summarized in the table below.

Portland Harbor RI/FS Final Remedial Investigation Report
February 8, 2016
A1-37
Sample IDs and Intervals by Station. Location Sample ID Interval Near northern property boundary SD0001 0–10 cm
SD0002 0–10 cm Outfall 003 SD0003 0–10 cm
SD0004 0–10 cm SD0005 0–10 cm SD0006 0–10 cm SD0007 (dup of SD0006) 0–10 cm SD0014 0–30 cm SD0015 0–30 cm SD0016 0–60 cm
Outfall 001 SD0008 0–10 cm SD0009 0–10 cm SD0010 0–10 cm SD0011 0–10 cm SD0014 0–10 cm SD0015 0–10 cm SD0016 0–10 cm
Near southern property boundary SD0012 0–10 cm SD0013 0–10 cm
All beach samples were analyzed for priority pollutant metals, SVOCs, PCBs, TOC, and grain size. Samples SD0015 and SD0016 were also analyzed for TPH.
The beach samples were composed primarily of sands and gravels. Fines content in the samples ranged from approximately 3 to 8 percent. Organic content ranged from less than 0.05 to 1.91 percent. The results for indicator chemicals in the sediment samples are summarized in the following table. All results were reported in dry weight.
Summary Data for Beach Surface Samples. Parameter Minimum Maximum (Location) Arsenic (mg/kg) 1.8 132 (SD0009) Cadmium (mg/kg) 1 U 2.1 (SD0009) Copper (mg/kg) 111 148 (SD0015) Lead (mg/kg) 19.8 U 166 (SD0010) Mercury (mg/kg) 0.02 U 0.07 (SD0005) Zinc (mg/kg) 43.1 823 (SD0009) TBT (µg/L) na na bis(2-ethylhexyl)phthalate (µg/kg) 180 U 2,000 U (SD0009) Total LPAH (µg/kg) 8.9 UA 14,093 A (SD0004) Total HPAH (µg/kg) 19 UA 39,000 (SD0004) Total PCBs (µg/kg) 140 A 2,790 A (SD0005) 2,3,7,8-TCDD (ng/kg) na na

Portland Harbor RI/FS Final Remedial Investigation Report
February 8, 2016
A1-38
Parameter Minimum Maximum (Location) Total DDT (µg/kg) na na Dibenzofuran (µg/kg) 8.9 U 1,000 (SD0004) 4-Methylphenol (µg/kg) na na Diesel range hydrocarbons (mg/kg) 10 U 10 U (SD0015) Xylenes (µg/kg) na na
WLCWTI00. REVISED 60-INCH STORM SEWER INTERIM REMEDIAL ACTIONS REPORT, TOSCO WILLBRIDGE TERMINAL, PORTLAND, OR (PREPARED BY KHM ENVIRONMENTAL MANAGEMENT, INC., MAY 2002).
KHM Environmental Management performed subsurface investigations and interim remedial actions at the Tosco Willbridge Terminal facility, which is located on the west bank of the Willamette River at RM 8. These activities were performed to address the seepage of petroleum hydrocarbons from bedding/backfill materials associated with a 60-in.-diameter storm sewer. The storm sewer is owned by the City of Portland, but crosses the Tosco terminal between Front Avenue and the river. The primary goal of the interim remedial activities was to assess the extent of separate-phase hydrocarbons (SPH) in the vicinity of the storm sewer, and eliminate SPH seepage to the Willamette. Remedial goals also included removal of the affected sediment adjacent to the outfall.
The investigation included the collection of groundwater and soil/sediment samples in the vicinity of the outfall as well as the installation of various engineering controls to contain and reduce the SPH seepage. Four sediment/soil samples were collected near the Willamette River low-water line on either side of the storm sewer outfall, using hand tools such as shovels or trowels. The samples were collected on September 21, 2000 within a 6-in. interval beginning at the sand/silt interface, which ranged from approximately 0.5 to 1 ft below the ground surface (bgs). On September 21–22, 2000, nine additional soil/sediment samples were collected from test pits excavated in the outfall area to determine the area of sediment impact and calculate the volume of material that would require removal. Test pit samples were collected directly from the excavator bucket at depth intervals ranging from 61 to 229 cm bgs.
All soil/sediment samples were analyzed for hydrocarbon identification and TPH (as diesel and heavy oil). One test pit sample was also analyzed for VOCs and RCRA metals for disposal characterization. Results for indicator chemicals in LWR samples are summarized in the following table, reported on a dry-weight basis. Based on the analytical results of the soil/sediment samples in the vicinity of the outfall, a permit was requested from the USACE for excavation of the affected area.
Summary Data for Samples. Parameter Minimum Maximum Arsenic (mg/kg) 1.69 1.69 Cadmium (mg/kg) 0.5 U 0.5 U Copper (mg/kg) na na

Portland Harbor RI/FS Final Remedial Investigation Report
February 8, 2016
A1-39
Parameter Minimum Maximum Lead (mg/kg) 10 U 10 U Mercury (mg/kg) 0.1 U 0.1 U Zinc (mg/kg) na na TBT (µg/kg) na na bis(2-ethylhexyl)phthalate (µg/kg) na na Total LPAH (µg/kg) na na Total HPAH (µg/kg) na na Total PCBs (µg/kg) na na 2,3,7,8-TCDD (ng/kg) na na Total DDT (µg/kg) na na Dibenzofuran (µg/kg) na na 4-Methylphenol (µg/kg) na na Diesel range hydrocarbons (mg/kg) 50 U 12,400 Xylenes (µg/kg) 1,250 1,250
WLCAYH00. EXPANDED PRELIMINARY ASSESSMENT DATA REPORT, UNION PACIFIC RAILROAD (UPRR) ALBINA YARD, PORTLAND, OR (PREPARED BY JACOBS ENGINEERING, NOVEMBER 2000).
Jacobs Engineering performed an expanded preliminary assessment (XPA) of the Union Pacific Railroad (UPRR) Albina Yard site in August 2000. The purpose of the XPA was to determine whether the site had experienced or might experience a release that could endanger human health or the environment per Oregon’s Revised Statutes (ORS Chapter 465.200). The XPA included the collection of soil, groundwater, and surface water samples, as well as six sediment samples. Four of these samples were collected from the Willamette River, while the remaining two were collected from storm drains. The river sediment sampling station locations were described as follows.
River Sediment Sampling Stations. Station Location SD-01 Upstream of Albina Yard, northwest of Fremont Bridge, sediment quality presumably
unaffected by site activities (baseline sample) SD-02 Near Outfall #2, draining stormwater runoff from the southeastern portion of UPRR
site SD-03 Near Outfall #1, draining stormwater runoff from the central portion of UPRR site SD-04 Near Outfall #3, draining stormwater runoff from the northwestern portion of UPRR
site Both surface and subsurface sediment samples were collected. Surface samples were collected from the top 20 cm using a single grab with a 0.1-m2 van Veen sampler. Subsurface sediment samples were collected using a 2-in.-diameter gravity corer configured with a 3-ft barrel. Sample recovery was difficult at most locations given the steeply sloped bottom and the amount
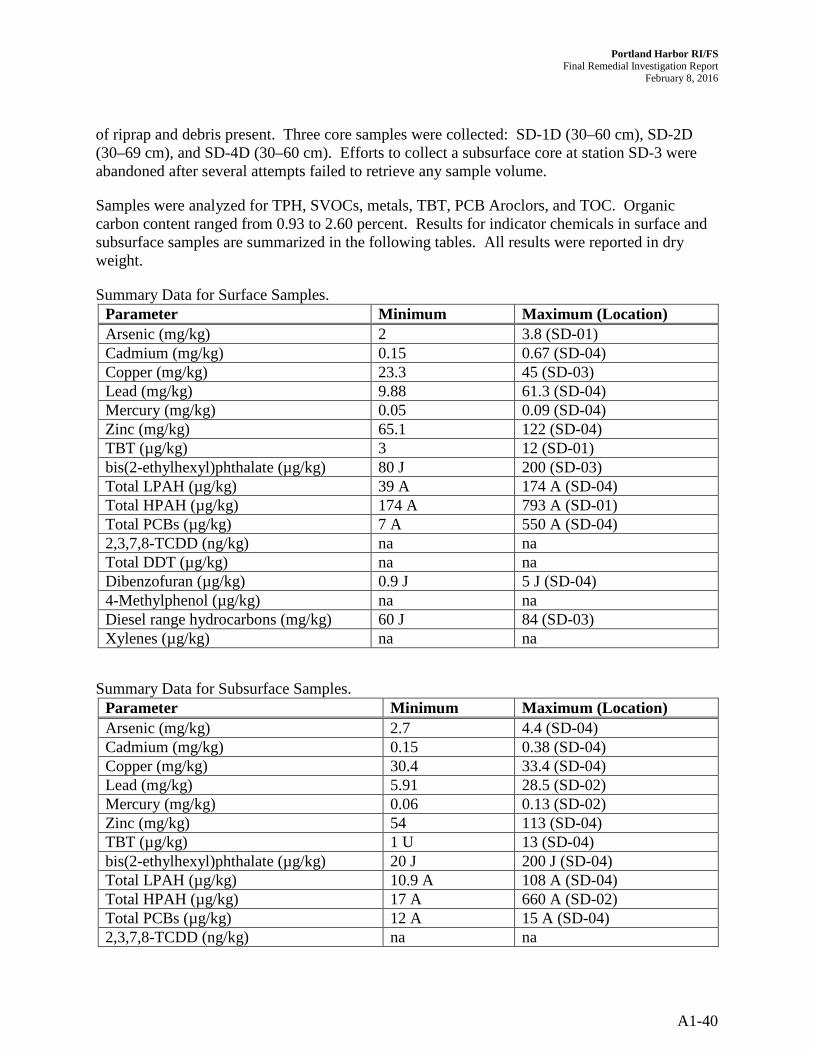
Portland Harbor RI/FS Final Remedial Investigation Report
February 8, 2016
A1-40
of riprap and debris present. Three core samples were collected: SD-1D (30–60 cm), SD-2D (30–69 cm), and SD-4D (30–60 cm). Efforts to collect a subsurface core at station SD-3 were abandoned after several attempts failed to retrieve any sample volume.
Samples were analyzed for TPH, SVOCs, metals, TBT, PCB Aroclors, and TOC. Organic carbon content ranged from 0.93 to 2.60 percent. Results for indicator chemicals in surface and subsurface samples are summarized in the following tables. All results were reported in dry weight.
Summary Data for Surface Samples. Parameter Minimum Maximum (Location) Arsenic (mg/kg) 2 3.8 (SD-01) Cadmium (mg/kg) 0.15 0.67 (SD-04) Copper (mg/kg) 23.3 45 (SD-03) Lead (mg/kg) 9.88 61.3 (SD-04) Mercury (mg/kg) 0.05 0.09 (SD-04) Zinc (mg/kg) 65.1 122 (SD-04) TBT (µg/kg) 3 12 (SD-01) bis(2-ethylhexyl)phthalate (µg/kg) 80 J 200 (SD-03) Total LPAH (µg/kg) 39 A 174 A (SD-04) Total HPAH (µg/kg) 174 A 793 A (SD-01) Total PCBs (µg/kg) 7 A 550 A (SD-04) 2,3,7,8-TCDD (ng/kg) na na Total DDT (µg/kg) na na Dibenzofuran (µg/kg) 0.9 J 5 J (SD-04) 4-Methylphenol (µg/kg) na na Diesel range hydrocarbons (mg/kg) 60 J 84 (SD-03) Xylenes (µg/kg) na na
Summary Data for Subsurface Samples. Parameter Minimum Maximum (Location) Arsenic (mg/kg) 2.7 4.4 (SD-04) Cadmium (mg/kg) 0.15 0.38 (SD-04) Copper (mg/kg) 30.4 33.4 (SD-04) Lead (mg/kg) 5.91 28.5 (SD-02) Mercury (mg/kg) 0.06 0.13 (SD-02) Zinc (mg/kg) 54 113 (SD-04) TBT (µg/kg) 1 U 13 (SD-04) bis(2-ethylhexyl)phthalate (µg/kg) 20 J 200 J (SD-04) Total LPAH (µg/kg) 10.9 A 108 A (SD-04) Total HPAH (µg/kg) 17 A 660 A (SD-02) Total PCBs (µg/kg) 12 A 15 A (SD-04) 2,3,7,8-TCDD (ng/kg) na na
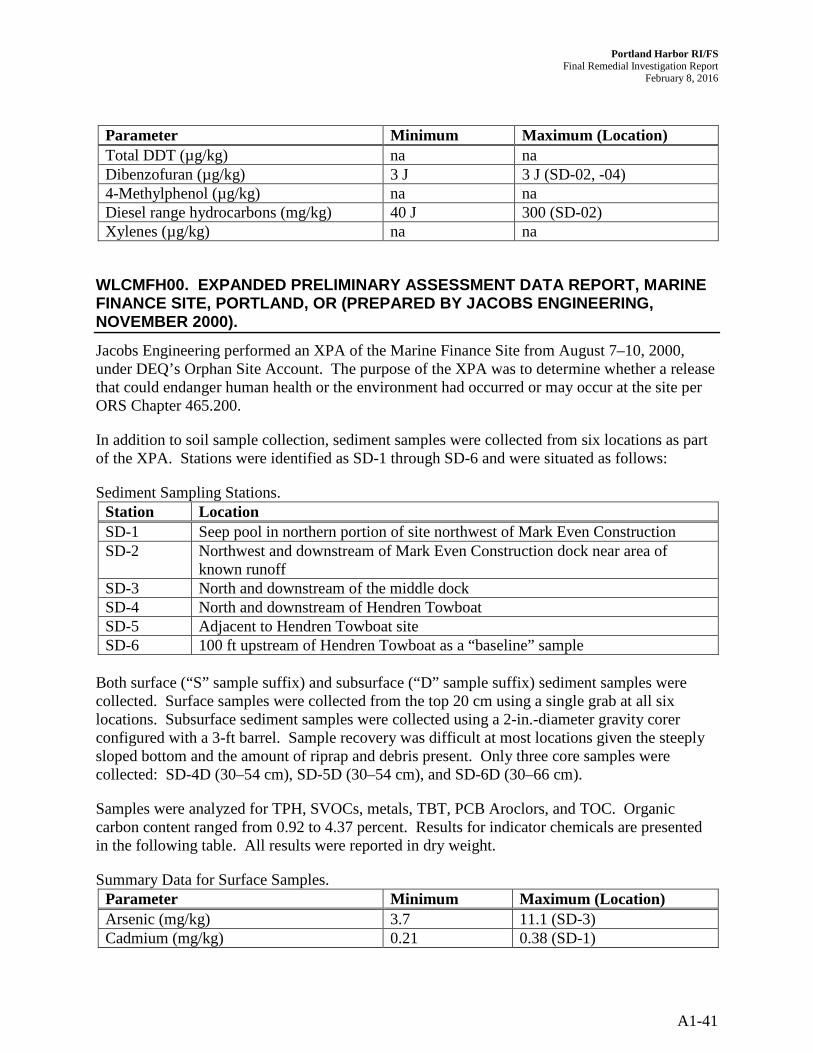
Portland Harbor RI/FS Final Remedial Investigation Report
February 8, 2016
A1-41
Parameter Minimum Maximum (Location) Total DDT (µg/kg) na na Dibenzofuran (µg/kg) 3 J 3 J (SD-02, -04) 4-Methylphenol (µg/kg) na na Diesel range hydrocarbons (mg/kg) 40 J 300 (SD-02) Xylenes (µg/kg) na na
WLCMFH00. EXPANDED PRELIMINARY ASSESSMENT DATA REPORT, MARINE FINANCE SITE, PORTLAND, OR (PREPARED BY JACOBS ENGINEERING, NOVEMBER 2000).
Jacobs Engineering performed an XPA of the Marine Finance Site from August 7–10, 2000, under DEQ’s Orphan Site Account. The purpose of the XPA was to determine whether a release that could endanger human health or the environment had occurred or may occur at the site per ORS Chapter 465.200.
In addition to soil sample collection, sediment samples were collected from six locations as part of the XPA. Stations were identified as SD-1 through SD-6 and were situated as follows:
Sediment Sampling Stations. Station Location SD-1 Seep pool in northern portion of site northwest of Mark Even Construction SD-2 Northwest and downstream of Mark Even Construction dock near area of
known runoff SD-3 North and downstream of the middle dock SD-4 North and downstream of Hendren Towboat SD-5 Adjacent to Hendren Towboat site SD-6 100 ft upstream of Hendren Towboat as a “baseline” sample
Both surface (“S” sample suffix) and subsurface (“D” sample suffix) sediment samples were collected. Surface samples were collected from the top 20 cm using a single grab at all six locations. Subsurface sediment samples were collected using a 2-in.-diameter gravity corer configured with a 3-ft barrel. Sample recovery was difficult at most locations given the steeply sloped bottom and the amount of riprap and debris present. Only three core samples were collected: SD-4D (30–54 cm), SD-5D (30–54 cm), and SD-6D (30–66 cm).
Samples were analyzed for TPH, SVOCs, metals, TBT, PCB Aroclors, and TOC. Organic carbon content ranged from 0.92 to 4.37 percent. Results for indicator chemicals are presented in the following table. All results were reported in dry weight.
Summary Data for Surface Samples. Parameter Minimum Maximum (Location) Arsenic (mg/kg) 3.7 11.1 (SD-3) Cadmium (mg/kg) 0.21 0.38 (SD-1)

Portland Harbor RI/FS Final Remedial Investigation Report
February 8, 2016
A1-42
Parameter Minimum Maximum (Location) Copper (mg/kg) 34.6 98.5 (SD-3) Lead (mg/kg) 13.6 232 (SD-5) Mercury (mg/kg) 0.02 0.11 (SD-5) Zinc (mg/kg) 87.8 273 (SD-3) TBT (µg/kg) 0.7 J 130 (SD-3) bis(2-ethylhexyl)phthalate (µg/kg) 50 J 300 J (SD-3) Total LPAH (µg/kg) 214 A 19,320 A (SD-5) Total HPAH (µg/kg) 970 A 78,600 A (SD-5) Total PCBs (µg/kg) 8 A 19 A (SD-5) 2,3,7,8-TCDD (ng/kg) na na Total DDT (µg/kg) na na Dibenzofuran (µg/kg) 6 J 200 J (SD-5) 4-Methylphenol (µg/kg) na na Diesel range hydrocarbons (mg/kg) 92 720 (SD-5) Xylenes (µg/kg) na na
Summary Data for Subsurface Samples. Parameter Minimum Maximum (Location) Arsenic (mg/kg) 3.6 3.8 (SD-4) Cadmium (mg/kg) 0.15 0.43 (SD-5) Copper (mg/kg) 26.3 36.5 (SD-5) Lead (mg/kg) 10.9 46 (SD-5) Mercury (mg/kg) 0.07 0.18 (SD-5) Zinc (mg/kg) 65.1 121 (SD-5) TBT (µg/kg) 1 J 5 (SD-6) bis(2-ethylhexyl)phthalate (µg/kg) 20 J 3,000 J (SD-5) Total LPAH (µg/kg) 130 A 180,800 A (SD-5) Total HPAH (µg/kg) 1,570 A 402,800 A (SD-5) Total PCBs (µg/kg) 10 A 76 A (SD-5) 2,3,7,8-TCDD (ng/kg) na na Total DDT (µg/kg) na na Dibenzofuran (µg/kg) 2 J 1,500 (SD-5) 4-Methylphenol (µg/kg) na na Diesel range hydrocarbons (mg/kg) 97 2,800 (SD-5) Xylenes (µg/kg) na na
WLCZDI00. FINAL REMEDIAL INVESTIGATION AND RISK ASSESSMENT, ZIDELL WATERFRONT PROPERTY (PREPARED BY MAUL FOSTER & ALONGI, INC., 2003).
DEQ prepared the record of decision (ROD), which presents the selected remedial action for the waterfront property owned by ZRZ Realty Company (Zidell) between RM 13 and 15. The
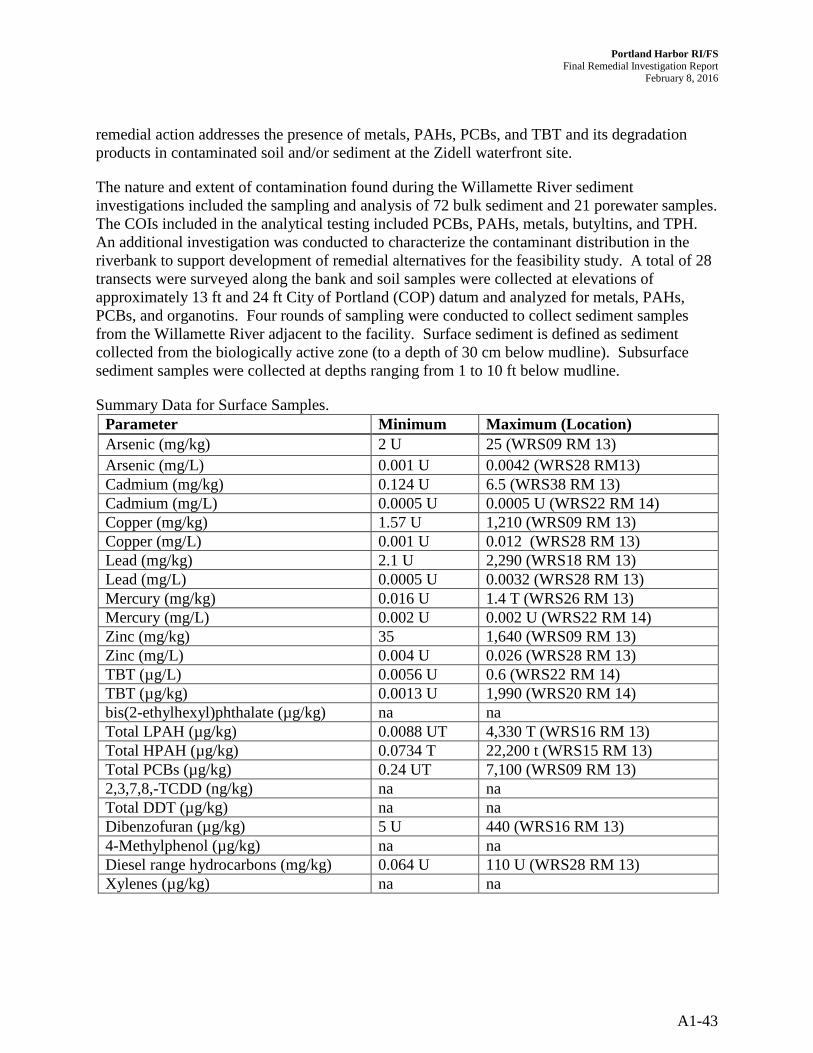
Portland Harbor RI/FS Final Remedial Investigation Report
February 8, 2016
A1-43
remedial action addresses the presence of metals, PAHs, PCBs, and TBT and its degradation products in contaminated soil and/or sediment at the Zidell waterfront site.
The nature and extent of contamination found during the Willamette River sediment investigations included the sampling and analysis of 72 bulk sediment and 21 porewater samples. The COIs included in the analytical testing included PCBs, PAHs, metals, butyltins, and TPH. An additional investigation was conducted to characterize the contaminant distribution in the riverbank to support development of remedial alternatives for the feasibility study. A total of 28 transects were surveyed along the bank and soil samples were collected at elevations of approximately 13 ft and 24 ft City of Portland (COP) datum and analyzed for metals, PAHs, PCBs, and organotins. Four rounds of sampling were conducted to collect sediment samples from the Willamette River adjacent to the facility. Surface sediment is defined as sediment collected from the biologically active zone (to a depth of 30 cm below mudline). Subsurface sediment samples were collected at depths ranging from 1 to 10 ft below mudline.
Summary Data for Surface Samples. Parameter Minimum Maximum (Location) Arsenic (mg/kg) 2 U 25 (WRS09 RM 13) Arsenic (mg/L) 0.001 U 0.0042 (WRS28 RM13) Cadmium (mg/kg) 0.124 U 6.5 (WRS38 RM 13) Cadmium (mg/L) 0.0005 U 0.0005 U (WRS22 RM 14) Copper (mg/kg) 1.57 U 1,210 (WRS09 RM 13) Copper (mg/L) 0.001 U 0.012 (WRS28 RM 13) Lead (mg/kg) 2.1 U 2,290 (WRS18 RM 13) Lead (mg/L) 0.0005 U 0.0032 (WRS28 RM 13) Mercury (mg/kg) 0.016 U 1.4 T (WRS26 RM 13) Mercury (mg/L) 0.002 U 0.002 U (WRS22 RM 14) Zinc (mg/kg) 35 1,640 (WRS09 RM 13) Zinc (mg/L) 0.004 U 0.026 (WRS28 RM 13) TBT (µg/L) 0.0056 U 0.6 (WRS22 RM 14) TBT (µg/kg) 0.0013 U 1,990 (WRS20 RM 14) bis(2-ethylhexyl)phthalate (µg/kg) na na Total LPAH (µg/kg) 0.0088 UT 4,330 T (WRS16 RM 13) Total HPAH (µg/kg) 0.0734 T 22,200 t (WRS15 RM 13) Total PCBs (µg/kg) 0.24 UT 7,100 (WRS09 RM 13) 2,3,7,8,-TCDD (ng/kg) na na Total DDT (µg/kg) na na Dibenzofuran (µg/kg) 5 U 440 (WRS16 RM 13) 4-Methylphenol (µg/kg) na na Diesel range hydrocarbons (mg/kg) 0.064 U 110 U (WRS28 RM 13) Xylenes (µg/kg) na na

Portland Harbor RI/FS Final Remedial Investigation Report
February 8, 2016
A1-44
Summary Data for Subsurface Samples. Parameter Minimum Maximum (Location) Arsenic (mg/kg) 2 7.5 (WRS46 RM 14) Cadmium (mg/kg) 1 U 3.6 (WRS46 RM 14) Copper (mg/kg) 14 1,050 (WRS07 RM 13) Lead (mg/kg) 2.1 U 972 (WRS07 RM 13) Mercury (mg/kg) 0.016 U 1.3 (WRS07 RM 13) Zinc (mg/kg) 41 2,270 (WRS07 RM 13) TBT (µg/kg) 0.0015 U 14,000 (WRS06 RM 13) bis(2-ethylhexyl)phthalate (µg/kg) na na Total LPAH (µg/kg) 3.5 UT 600 UT (WRS02 RM 13, etc.)* Total HPAH (µg/kg) 3.9 UT 600 UT (WRS02 RM 13, etc.)* Total PCBs (µg/kg) 100 U 2,300 U (WRS03 RM 13) 2,3,7,8,-TCDD (ng/kg) na na Total DDT (µg/kg) na na Dibenzofuran (µg/kg) 300 U 600 (WRS16 RM 13)* 4-Methylphenol (µg/kg) na na Diesel range hydrocarbons (mg/kg) 0.064 U 110 U (WRS28 RM13) Xylenes (µg/kg) 5 U 10 U (WRS02 RM 13)
* There are several stations with this maximum value.
WLCT4L01. DREDGED MATERIAL CHARACTERIZATION STUDY MARINE TERMINAL 4, SLIP 3, PORTLAND, OR (PREPARED BY HART CROWSER, INC., FEBRUARY 2002).
This investigation consisted of sediment sampling to characterize the quality of the newly exposed sediment in the Slip and the proposed dredge material for permitting and placement at a solid waste landfill, and to evaluate the potential water quality impacts associated with dredging operations. The target area for this sediment characterization study was Berth 410 at Terminal 4 Slip 3, located at approximately RM 5.
Hart Crowser, Inc. collected core samples on December 11 and 13, 2001. Sampling took place using a vibracorer deployed from the vessel, the John B. Preston. Three sediment cores (T4-VC-01, T4-VC-02, and T4-VC-03) were collected at Berth 410, depth-integrated up to the maximum removal depth of -42 ft CRD, and composited into T4-01-410-COMP, representing one dredged material management unit (DMMU). At each of the coring locations, between 1 and 4 ft of additional sediment was collected below the proposed dredge prism and tested or archived as discrete samples. These samples were catalogued as the following: subsample interval -42 to -43 ft CRD (T4-01-1A, T4-01-2A, and T4-013A, the “A” interval); subsample interval -43 to -44 ft CRD (T4-01-1B, T4-01-2B, the “B” interval); and -44 to -45 ft CRD (T4-01-1C and T4-01-2C, the “C” interval).

Portland Harbor RI/FS Final Remedial Investigation Report
February 8, 2016
A1-45
Summary of Core Samples. Sample Location Berth 410
Subsample Interval Top
Subsample Interval Bottom
Sample ID
Sample Type
T4-VC-01 -38 -42 -43 -44
-42 -43 -44 -45
T4-01-410-COMP T4-01-1A T4-01-1B T4-01-1C
Composite Discrete Discrete Discrete
T4-VC-02 -40 -42 -43 -44 -45
-42 -43 -44 -45 -46
T4-01-410-COMP T4-01-2A T4-01-2B T4-01-2C T4-01-2D
Composite Discrete Discrete Discrete Discrete
T4-VC-03 -40 -42
-42 -42.5
T4-01-410-COMP T4-01-3A
Composite Discrete
The B and C intervals were analyzed for selected parameters, depending on the chemical testing results from the A interval. The composite sample (T4-01-410-COMP) and a duplicate of this sample (T4-01-Dup) and each discrete sample from the A interval were analyzed for Lower Columbia River Management Area (LCMRA) metals, chlorinated pesticides, PCBs, SVOCs, TOC, and grain size (T4-410-COMP only). Samples T4-01-2B and T4-01-2C were analyzed for SVOCs and samples T4-01-1B, T4-01-1C, and T4-01-2B were analyzed for chlorinated pesticides and PCBs. In order to determine whether the dredged sediment would be designated as hazardous waste, sample T4-01-410-COMP and its duplicate were tested for toxicity characteristic leaching procedure (TCLP) metals, and sample T4-01-410-COMP and river supply water collected from the mouth of Slip 3 were submitted to the Hart Crowser Soils Lab to conduct the dredge elutriate test.
Subsurface sediment coring was proposed at two additional locations within the DMMU at Berth 411, but it was determined that no dredge prism existed, and no sediment core samples were collected.
Summary Data for Subsurface Samples. Parameter Minimum Maximum (Location) Arsenic (mg/kg) 3.87 11.6 (T4-VC-03 RM 4.57) Cadmium (mg/kg) 0.403 5.72 (T4-VC-03 RM 4.57) Copper (mg/kg) 32.6 72.3 (T4-VC-03 RM 4.57) Lead (mg/kg) 41 1,090 (T4-VC-03 RM 4.57) Mercury (mg/kg) 0.08 T 0.25 (T4-VC-03 RM 4.57) Zinc (mg/kg) 112 T 1,010 (T4-VC-03 RM 4.57) TBT (µg/L) na na bis(2-ethylhexyl)phthalate (µg/kg) 1,500 U 3,600 U (T4-VC-02 RM 4.55) Total LPAH (µg/kg) 1,146 TA 10,930 TA (T4-VC-02 RM 4.55) Total HPAH (µg/kg) 4297 TA 85,600 TA (T4-VC-02 RM 4.55)

Portland Harbor RI/FS Final Remedial Investigation Report
February 8, 2016
A1-46
Parameter Minimum Maximum (Location) Total PCBs (µg/kg) 56.5 TA 456 TA (T4-VC-03 RM 4.57) 2,3,7,8,-TCDD (ng/kg) na na Total DDT (µg/kg) 4.8 TA 34.5 TA (T4-VC-03 RM 4.57) Dibenzofuran (µg/kg) 60 J 290 (T4-VC-02 RM 4.55) 4-Methylphenol (µg/kg) 29 J 120 J (T4-VC-02 RM 4.55) Diesel range hydrocarbons (mg/kg) na na Xylenes (µg/kg) na na
WLLRSI01. LOWER WILLAMETTE RIVER REFERENCE AREA STUDY, U.S. ARMY CORPS OF ENGINEERS, PORTLAND, OR (PREPARED BY HART CROWSER, FEBRUARY 26, 2002).
This investigation was the second phase in the effort to identify potential reference sediment locations in the Willamette River as part of the USACE’s effort to develop a DMMP for the waterway. The objective was to identify three reference areas representing fine-, medium-, and coarse-grained sediment in the LWR that could be used in biological testing.
This investigation consisted of comprehensive chemical and biological testing of three candidate reference sites listed in the table below.
Candidate Reference Sites. Station Approximate Location Description Target Grain Size Range HC-02 RM 15.5, near Ross Island Coarse HC-08 RM 18.8, east of Elk Rock Island Fine HC-10 RM 23.4, inside Cedar Island Cove Medium
Surface sediment sampling was conducted on September 17, 2001, using an air-powered van Veen grab sampler. Sample intervals ranged from the surface to 30 cm. Samples were submitted for TOC, total volatile solids (TVS), selected VOCs, SVOCs, PAHs, phenols, phthalates, pesticides, PCBs, metals, and porewater butyltin analyses, as well as 10-day lethal and sublethal bioassays.
Five additional surface samples were collected from Cedar Island Cove to assess the range of grain sizes available at that location. These five samples were analyzed for grain size, TOC, and TVS only.
The grain sizes at the coarse, medium, and fine candidate locations consisted of fine sand, very sandy silt, and sandy silt, respectively. Organic content in these samples ranged from 0.42 to 1.77 percent. The results for indicator chemicals are summarized in the following table, reported on a dry-weight basis (except for porewater results).

Portland Harbor RI/FS Final Remedial Investigation Report
February 8, 2016
A1-47
Summary Data for Surface Samples. Parameter Minimum Maximum (Location) Arsenic (mg/kg) 2.7 4.3 (HC-08) Cadmium (mg/kg) 0.07 0.18 (HC-08) Copper (mg/kg) 15.4 50.9 (HC-08) Lead (mg/kg) 5.24 12.6 (HC-08) Mercury (mg/kg) 0.02 0.05 (HC-08) Zinc (mg/kg) 49.7 96.8 (HC-08) TBT (µg/L) 0.06 0.09 (HC-08) bis(2-ethylhexyl)phthalate (µg/kg) 310 U 420 U (HC-08) Total LPAH (µg/kg) 10.8 A 28.6 A (HC-10) Total HPAH (µg/kg) 96.6 A 131 A (HC-10) Total PCBs (µg/kg) 31 UA 42 UA (HC-08) 2,3,7,8-TCDD (ng/kg) na na Total DDT (µg/kg) 0.73 A 14.6 A (HC-10) Dibenzofuran (µg/kg) 16 U 21 U (HC-08) 4-Methylphenol (µg/kg) 7.3 J 16 U (HC-02) Diesel range hydrocarbons (mg/kg) na na Xylenes (µg/kg) na na
WLLRSH01. WILLAMETTE RIVER REFERENCE AREA STUDY – PHASE I RESULTS AND RECOMMENDATIONS FOR PHASE II SAMPLING LOCATIONS, PORTLAND, OR (PREPARED BY HART CROWSER, SEPTEMBER 2001).
This investigation was the initial phase to identify potential reference sediment locations in the Willamette River as part of the USACE’s plan to develop a DMMP for the waterway. The objective was to identify three reference areas representing fine-, medium-, and coarse-grained sediment in the LWR that could be used in subsequent biological testing.
Ten potential locations were selected. The station IDs and approximate river mile descriptions are listed in the table below.
Potential Reference Sediment Locations. Station Approximate Location Description HC-1 RM 15.7, upstream of East Island HC-2 RM 15.5, near Ross Island HC-3 RM 16.5, near downstream boundary of Riverview Cemetery HC-4 RM 17.2, west side of channel HC-5 RM 17.8, west side of channel upstream of Riverdale HC-6 RM 18.75, no sample collected HC-7 RM 18.9, west of Elk Rock Island HC-8 RM 18.8, east of Elk Rock Island HC-9 RM 23.1, downstream end of Cedar Island HC-10 RM 23.4, inside Cedar Island Cove

Portland Harbor RI/FS Final Remedial Investigation Report
February 8, 2016
A1-48
Sampling took place on August 27, 2001. Surface (0–10 cm) grab samples were collected at each location and were wet-sieved in the field to identify general grain-size characteristics. Samples were then submitted for laboratory analyses of grain-size distribution, TVS, total solids, TPH, pesticides, and PCBs.
The results for indicator chemicals are summarized in the following table, reported on a dry-weight basis.
Summary Data for Surface Samples. Parameter Minimum Maximum (Location) Arsenic (mg/kg) na na Cadmium (mg/kg) na na Copper (mg/kg) na na Lead (mg/kg) na na Mercury (mg/kg) na na Zinc (mg/kg) na na TBT (µg/kg) na na bis(2-ethylhexyl)phthalate (µg/kg) na na Total LPAH (µg/kg) na na Total HPAH (µg/kg) na na Total PCBs (µg/kg) 26 UA 40 UA (HC-10) 2,3,7,8-TCDD (ng/kg) na na Total DDT (µg/kg) 1.3 UA 2 UA (HC-04, HC-10) Dibenzofuran (µg/kg) na na 4-Methylphenol (µg/kg) na na Diesel range hydrocarbons (mg/kg) 13 U 56 Z (HC-04) Xylenes (µg/kg) na na
WLCCIF01. RESULTS OF SEDIMENT SAMPLING AND ANALYSIS, CARGILL IRVING ELEVATOR TERMINAL, PORTLAND, OR (PREPARED BY HARDING ESE, AUGUST 3, 2001).
This investigation consisted of sediment sampling to characterize material to be removed during maintenance dredging at the Cargill, Inc. (Cargill) Irving Elevator Terminal in Portland (RM 11.5). The material was addressed as a single DMMU located within the facility’s berthing area.
Sediment sampling was conducted by Harding ESE on June 29, 2001. Four vibracore samples were collected within the DMMU: T01 (0–54 cm), T02 (0–109 cm), T03 (0–106 cm), and T04 (0–60 cm). Due to refusal, one of the cores did not achieve the entire proposed dredging depth, including the 2-ft overdredge interval. From each core, the material within the proposed dredge prism depth interval was split between two samples: one representing the individual core, and one composite of the four cores representing the entire DMMU. The amount of material contributed to the composite from each core was proportional to its total length. All the samples were analyzed for conventional parameters (total solids, TVS, TOC, total sulfide, and ammonia),

Portland Harbor RI/FS Final Remedial Investigation Report
February 8, 2016
A1-49
grain-size distribution, SVOCs, organoclorine pesticides, PCBs, organotins, and metals. The composite sample was also analyzed for porewater organotins. Samples T01, T04, and the composite sample later underwent bioassay testing.
The individual samples were generally composed of sands with silt; the organic carbon contents ranged from 0.4 to 0.82 percent. The composite material was predominantly sand with silt, having an organic content of 0.67 percent. The results for indicator chemicals are summarized in the following table, reported on a dry-weight basis (except for porewater results).
Summary Data for Subsurface Samples. Parameter Minimum Maximum (Location) Arsenic (mg/kg) 2.1 3.1 (T02) Cadmium (mg/kg) 0.21 0.32 (T02) Copper (mg/kg) 20.2 26.4 (T02) Lead (mg/kg) 14.4 35 (T04) Mercury (mg/kg) 0.03 0.05 (T02) Zinc (mg/kg) 68.3 79.3 (T04) TBT(µg/kg) 13 220 (T04) TBT(µg/L) -- 0.06 (composite) bis(2-ethylhexyl)phthalate (µg/kg) 180 U 220 J (T01) Total LPAH (µg/kg) 135 A 346 A (T01) Total HPAH (µg/kg) 441 A 3,457 A (T01) Total PCBs (µg/kg) 13.4 A 130 A (T04) 2,3,7,8-TCDD (ng/kg) na na Total DDT (µg/kg) 0.73 UA 2.42 A (T03) Dibenzofuran (µg/kg) 4.2 J 12 J (T01) 4-Methylphenol (µg/kg) 16 J 54 (T02) Diesel range hydrocarbons (mg/kg) na na Xylenes (µg/kg) na na
WLCT0F01. DREDGED MATERIAL CHARACTERIZATION STUDY, MARINE TERMINAL 2, BERTHS 203-206, MARINE TERMINAL 5, BERTH 501, PORTLAND, OR (PREPARED BY HART CROWSER, AUGUST 24, 2001).
Hart Crowser conducted this study for the Port of Portland prior to maintenance dredging at three berthing areas at the Port’s Marine Terminal 2 (Berths 204-206), and one berthing area at Marine Terminal 5 (Berth 501). Terminal 2 is located on the west side of the Willamette River at RM 10, and Terminal 5 is located along the east bank of the river at RM 1. The information gained from this investigation was to be used to determine the quality of the dredged material for management options, the quality of the effluent from dredged material dewatering, and the quality of the dredged material leachate that would percolate into the aquifer underlying the rehandling facility. No dredging was planned at Berth 203 at the time of this study, but the data were collected for use in evaluating future dredging options.

Portland Harbor RI/FS Final Remedial Investigation Report
February 8, 2016
A1-50
Subsurface sediment vibracore samples were collected at Terminal 2, Berths 203-206, on June 28-29, 2001, and at Terminal 5, Berth 501, on June 27-28, 2001. Ten cores were collected at Terminal 2, and nine cores were collected at Terminal 5. Recovered core depths ranged from 5.5 to 9 ft below the mudline (bml). The cores were segregated into two DMMUs at both Terminal 2 (Berth 203 and Berths 204-205) and Terminal 5 (Berth 501-Barge and Berth 501-Face). The cores in each DMMU were divided into three intervals and composited to form representative samples, as outlined in the following table.
Summary of Core Samples.
Facility DMMU Composite Sample ID
Approximate Interval Interval Description
Terminal 2 Berth 203 T2-01-1A 0–121 cm Proposed dredging depth (including 2 ft overdredge)
T2-01-1B 121–152 cm 1 ft below dredge prism T2-01-1C 152–182 cm 1–2 ft below dredge prism
Berths 204-206
T2-01-2A 0–152 cm Proposed dredging depth (including 2 ft overdredge)
T2-01-2B 152–182 cm 1 ft below dredge prism T2-01-2C 182–210 cm 1–2 ft below dredge prism
Terminal 5 Berth 501-Barge
T5-01-1A 0–152 cm Proposed dredging depth (including 2 ft overdredge)
T5-01-1B 152–182 cm 1 ft below dredge prism T5-01-1C 182–210 cm 1–2 ft below dredge prism
Berth 501-Face
T5-01-2A 0–182 cm Proposed dredging depth (including 2 ft overdredge)
T5-01-2B 182–210 cm 1 ft below dredge prism T5-01-2C 210–240 cm 1–2 ft below dredge prism
The “A” samples from each DMMU were submitted for analysis of conventional parameters, SVOCs, chlorinated pesticides, PCBs, metals, and porewater TBT. Elutriate (dewatered fluid) from T2-01-2A was analyzed for TSS, turbidity, TBT, chlorinated pesticides, and PCBs. Initially, the “B” and “C” samples from each DMMU were frozen pending potential future analysis. Samples T2-01-1B and T2-01-1C were later analyzed for pesticides and PCBs based on elevated concentrations in T2-01-1A.
The Terminal 2 “A” composites were composed primarily of sandy silt, while the Terminal 5 “A” composites were composed of sand and silty sand. Organic carbon content ranged from 0.17 to 3.04 percent. The results for indicator chemicals in the sediment samples are summarized in the following table, reported (except porewater TBT) on a dry-weight basis.
Summary Data for Subsurface Samples. Parameter Minimum Maximum (Location) Arsenic (mg/kg) 1.8 3 (T2-01-2A, T5-01-2A) Cadmium (mg/kg) 0.09 0.51 (T5-01-2A)

Portland Harbor RI/FS Final Remedial Investigation Report
February 8, 2016
A1-51
Parameter Minimum Maximum (Location) Copper (mg/kg) 8.8 30.1 (T2-01-2A) Lead (mg/kg) 3.38 19.8 (T5-01-2A) Mercury (mg/kg) 0.02 0.14 (T2-01-1A) Zinc (mg/kg) 37.9 112 (T2-01-1A) TBT (µg/L) 0.02 U 0.07 (T5-01-2A) bis(2-ethylhexyl)phthalate (µg/kg) 270 UJ 380 UJ (T2-01-2A) Total LPAH (µg/kg) 73 A 308 A (T2-01-1A) Total HPAH (µg/kg) 276 A 1,221 A (T2-01-1A) Total PCBs (µg/kg) 27 UA 770 A (T2-01-1B) 2,3,7,8-TCDD (ng/kg) na na Total DDT (µg/kg) 1.4 UA 78 A (T2-01-1B) Dibenzofuran (µg/kg) 14 UJ 19 UJ (T2-01-2A) 4-Methylphenol (µg/kg) na na Diesel range hydrocarbons (mg/kg) na na Xylenes (µg/kg) na na
WLCCPF01. CHEVRON WILLBRIDGE TERMINAL DOCK SEDIMENT SAMPLING, PORTLAND, OR (PREPARED BY PNG ENVIRONMENTAL, 2001).
PNG Environmental performed sediment sampling to characterize sediment prior to maintenance dredging in the vicinity of the Chevron Willbridge Terminal dock, located on the west side of the Willamette River at approximately RM 7.8.
Samples were collected at five stations on June 6–7, 2001: two in the slip north of the dock, and three in the slip south of the dock. The sample IDs and intervals at each of these stations are summarized in the table below. Only the uppermost interval collected at each station contained the sediment proposed for dredging.
Sample IDs and Intervals by Station. Station (Location) Sample ID Sample Interval SD0101 (Head of northern slip)
SD-1-S1C 91–183 cm SD-1-39-Foot 183–213 cm SD-1-41-Foot 213–244 cm
SD0102 (Northern slip)
SD-2-S1C 0–30 cm SD-2-39-Foot 30–61 cm SD-2-41-Foot 61–91 cm
SD0103 (Head of southern slip)
SD-3-S1C 0–152 cm SD-3-39-Foot 152–183 cm SD-3-41-Foot 183–213 cm
SD0104 (Southern slip)
SD-4-S1C 0–91 cm SD-4-39-Foot 91–122 cm SD-4-41-Foot 122–152 cm

Portland Harbor RI/FS Final Remedial Investigation Report
February 8, 2016
A1-52
Station (Location) Sample ID Sample Interval SD0105 (Southern slip)
SD-5-SD1C 0–30 cm SD-5-39-Foot 30–61 cm SD-5-41-Foot 61–90 cm
The samples were analyzed for ammonia/nitrogen, sulfide, total solids, TVS, VOCs, SVOCs, PAHs, DRH, pesticides, PCBs, and total metals. Porewater from these samples was analyzed for butyltins. The results for indicator chemicals in surface and subsurface samples are summarized in the following tables. Except for porewater TBT, the results were reported on a dry-weight basis. In surface sediment samples, maximum concentrations of all chemicals were found in Sample SD-5-SD1C.
Summary Data for Surface Samples. Parameter Minimum Maximum Arsenic (mg/kg) 4.16 4.31 Cadmium (mg/kg) 0.4 0.73 Copper (mg/kg) 41.9 53 Lead (mg/kg) 14 43.2 Mercury (mg/kg) 0.2 U 0.26 Zinc (mg/kg) 98.8 236 TBT (µg/L) 0.02 U 0.04 U bis(2-ethylhexyl)phthalate (µg/kg) 149 248 Total LPAH (µg/kg) 18.7 A 458 A Total HPAH (µg/kg) 234 A 1,057 A Total PCBs (µg/kg) 12 UA 79.1 A 2,3,7,8-TCDD (ng/kg) na na Total DDT (µg/kg) 0.8 UA 0.8 UA Dibenzofuran (µg/kg) 100 U 100 U 4-Methylphenol (µg/kg) na na Diesel range hydrocarbons (mg/kg) 27 250 Xylenes (µg/kg) 200 U 200 U
Summary Data for Subsurface Samples. Parameter Minimum Maximum (Location) Arsenic (mg/kg) 2.52 6.37 (SD-4-41-Foot) Cadmium (mg/kg) 0.3 U 0.69 U (SD-1-S1C) Copper (mg/kg) 18.1 58.2 (SD-2-39-Foot) Lead (mg/kg) 5.23 47.8 (SD-3-41-Foot) Mercury (mg/kg) 0.2 U 0.31 (SD-5-39-Foot) Zinc (mg/kg) 60.7 172 (SD-3-41-Foot) TBT(µg/kg) 0.02 U 0.06 U (SD-5-41-Foot) bis(2-ethylhexyl)phthalate (µg/kg) 100 U 320 (SD-1-S1C) Total LPAH (µg/kg) 6 UA 1,721 A (SD-1-41-Foot)

Portland Harbor RI/FS Final Remedial Investigation Report
February 8, 2016
A1-53
Parameter Minimum Maximum (Location) Total HPAH (µg/kg) 58.1 A 5,107 A (SD-1-S1C) Total PCBs (µg/kg) 12 UA 205 A (SD-1-39-Foot) 2,3,7,8-TCDD (ng/kg) na na Total DDT (µg/kg) 0.8 UA 1.7 UA (SD-3-S1C) Dibenzofuran (µg/kg) 100 U 212 U (SD-3-S1C) 4-Methylphenol (µg/kg) na na Diesel range hydrocarbons (mg/kg) 10 U 744 U (SD-3-41-Foot) Xylenes (µg/kg) 200 U 425 U (SD-3-S1C)
WLCGSD01. NW NATURAL “GASCO” SITE, DRAFT SCREENING LEVEL NEARSHORE SOURCE CONTROL EVALUATION RESULTS REPORT, PORTLAND, OR (PREPARED BY ANCHOR ENVIRONMENTAL, L.L.C., JULY 2001).
The purpose of this investigation was to characterize nearshore river conditions adjacent to the NW Natural “Gasco” site in order to validate groundwater model results and determine whether site groundwater was an ongoing source of river water and sediment contamination.
On April 10–11, 2001, nine sediment vibracore samples were collected from a research vessel along two transects that ran perpendicular from the Gasco site shoreline. Four cores were collected along the first transect located offshore of the tar pond area, and five cores were collected along the second transect located approximately 500 ft northwest of the first. Samples were collected from the cores at three depth intervals: 0–10 cm, 10–20 cm, and 30–40 cm. All samples were analyzed for TOC, total solids, six metals, cyanide, BTEX, PAHs, and sulfides.
Organic carbon content ranged from 0.18 to 8.76 percent. Results for indicator chemicals in surface and subsurface samples are summarized in the following tables. All results are reported in dry weight.
Summary Data for Surface Samples. Parameter Minimum Maximum Arsenic (mg/kg) 2.4 5.1 Cadmium (mg/kg) na na Copper (mg/kg) 21 55.9 Lead (mg/kg) 4.3 56.8 Mercury (mg/kg) na na Zinc (mg/kg) 56.1 J 281 J TBT (µg/kg) na na bis(2-ethylhexyl)phthalate (µg/kg) na na Total LPAH (µg/kg) 351 A 771,800 A Total HPAH (µg/kg) 1,238 A 1,057,400 A Total PCBs (µg/kg) na na 2,3,7,8-TCDD (ng/kg) na na Total DDT (µg/kg) na na

Portland Harbor RI/FS Final Remedial Investigation Report
February 8, 2016
A1-54
Parameter Minimum Maximum Dibenzofuran (µg/kg) na na 4-Methylphenol (µg/kg) na na Diesel range hydrocarbons (mg/kg) na na Xylenes (µg/kg) 0.020 U 1.51
Summary Data for Subsurface Samples. Parameter Minimum Maximum Arsenic (mg/kg) 1.1 5.1 Cadmium (mg/kg) na na Copper (mg/kg) 14.5 57.6 Lead (mg/kg) 2.28 58.4 Mercury (mg/kg) na na Zinc (mg/kg) 37 J 313 J TBT (µg/kg) na na bis(2-ethylhexyl)phthalate (µg/kg) na na Total LPAH (µg/kg) 3 UA 4,299,000 A Total HPAH (µg/kg) 3 UA 1,893,000 A Total PCBs (µg/kg) na na 2,3,7,8-TCDD (ng/kg) na na Total DDT (µg/kg) na na Dibenzofuran (µg/kg) na na 4-Methylphenol (µg/kg) na na Diesel range hydrocarbons (mg/kg) na na Xylenes (µg/kg) 0.020 U 9.1
WLCMBA01. SEDIMENT REMEDIAL DESIGN FINAL SAMPLING DATA SUMMARY REPORT, MCCORMICK & BAXTER CREOSOTING COMPANY, PORTLAND, OR (PREPARED BY ECOLOGY AND ENVIRONMENT, INC., FEBRUARY 2001).
Ecology and Environment (E&E) conducted sediment sampling on behalf of DEQ to support the remedial design for contaminated sediment at the McCormick & Baxter Creosoting Company’s Portland facility, located at approximately RM 7. Phase I of the remedial design sampling was conducted in October 1999. Phase II sampling was performed in January and February 2001 to address data gaps identified during Phase I, including the delineation of the lateral extent of contamination and parameters necessary for permeability modeling.
On January 5 and 8, 2001, surface sediment samples were collected at 29 locations offshore of the McCormick & Baxter facility, and one sample was collected at an upstream reference location at RM 24. The samples were collected from a sampling interval of 0–15 in. using a PVC plastic sampling tube deployed by divers. Two replicates were required at each station: one was submitted for grain-size distribution and PAH analyses, and the other was submitted for toxicity testing.

Portland Harbor RI/FS Final Remedial Investigation Report
February 8, 2016
A1-55
Subsurface sediment samples were collected on February 5, 2001 at three locations offshore of the facility. The samples were obtained from cores collected from 0 to 10 ft using a Shelby® tube and piston sampler. Porewater samples from the sediment cores were submitted for dissolved organic carbon and SVOC analyses. Sediment from the cores was collected for NAPL extraction to be used in the physical testing required for sediment cap permeability modeling. Samples of light NAPL, dense NAPL, and river water were also collected to provide data for cap permeability modeling.
The surface sediment samples displayed a range of grain sizes, but were generally finer than the Phase I samples. Fines in Phase II samples ranged from 0 to 93 percent. The results for indicator chemicals in the surface samples are summarized in the following table. All results were reported in dry weight. The results of the sediment porewater analyses from this investigation were not available at the time of the E&E report.
Summary Data for Surface Samples. Parameter Minimum Maximum Arsenic (mg/kg) na na Cadmium (mg/kg) na na Copper (mg/kg) na na Lead (mg/kg) na na Mercury (mg/kg) na na Zinc (mg/kg) na na TBT(µg/L) na na bis(2-ethylhexyl)phthalate (µg/kg) na na Total LPAH (µg/kg) 13.4 UA 173,569 A Total HPAH (µg/kg) 13.4 UA 82,097 A Total PCBs (µg/kg) na na 2,3,7,8-TCDD (ng/kg) na na Total DDT (µg/kg) na na Dibenzofuran (µg/kg) na na 4-Methylphenol (µg/kg) na na Diesel range hydrocarbons (mg/kg) na na Xylenes (µg/kg) na na
WLCSLH01. SUPPLEMENTAL INVESTIGATION REPORT, SILTRONIC SURFACE WATER AND TZW DATA (PREPARED BY MAUL FOSTER & ALONGI, INC., SEPTEMBER 8, 2005).
In 2004, MFA completed an in-river investigation of the lateral and vertical extent of trichloroethylene (TCE) and its degradation products in TZW and deeper groundwater. At DEQ’s direction, the investigation also included data collection for in-river impacts related to manufactured gas plants (MGPs). TZW samples (collected from 1–2 ft below mudline) were collected from eight locations between September 30, 2004 and October 29, 2004. The samples were collected with direct-push (Geoprobe®) equipment deployed from a barge, and using a peristaltic pump with dedicated (i.e. single-use) tubing. The TZW samples were analyzed for

Portland Harbor RI/FS Final Remedial Investigation Report
February 8, 2016
A1-56
VOCs, PAHs, cyanide, and DRH. Surface sediment and deeper soil samples, along with deep groundwater samples, were also collected. The results were reported to DEQ, USEPA, and its partners in a letter to Matt McClincy dated February 1, 2005 (re: Results of In-River Investigation).
In 2005, MFA completed a supplemental in-river investigation that completely delineated the lateral and vertical extent of TCE and its degradation products in TZW and deeper groundwater. At DEQ’s direction, the investigation also included data collection for MGP-related impacts in the river.
Surface water was collected from 17 locations co-located with groundwater sampling locations. Five surface water samples were also collected upstream and downstream of the site. All surface water samples were collected from approximately 1 ft above the mudline, using 1.5-inch outside-diameter conductor casing fitted with a Teflon-ring plunger, and extended within a 3-inch diameter conductor casing. The sampling equipment was deployed using a barge-mounted direct push drill rig. The surface water samples were collected using a peristaltic pump following purging of the conductor casing.
Field parameters were measured prior to sample collection, including temperature, specific conductance, pH, dissolved oxygen, and redox potential. Ferrous iron (Fe+2) was estimated using a field kit. The surface water samples were submitted for VOC laboratory analysis (USEPA Method 8260).
Parameter Minimum Maximum (Location) Xylenes (µg/L) 0.4 UT 5.9 T (GP64 RM 6.4)
TZW samples (collected from 0–1 ft below mudline) were collected from 41 locations between May 9, 2005 and June 1, 2005. The samples were collected with direct-push (Geoprobe®) equipment deployed from a barge, and using a peristaltic pump with dedicated (i.e., single-use) tubing. The TZW samples at all locations were analyzed for VOCs. Thirteen TZW samples were also analyzed for PAHs, cyanide, and metals (unfiltered). Deep groundwater samples and surface water samples were also collected. The results were reported to DEQ, USEPA, and its partners in MFA’s Supplemental Investigation Report (September 8, 2005).
Summary Data for TZW Samples. Parameter Minimum Maximum (Location) Arsenic (dissolved) mg/L 0.003 U 0.034 (P-5 RM 6.5) Arsenic (total) mg/L 0.02 U 0.02 U (GP55 RM 6.4)* Cadmium (dissolved) mg/L 0.001 U 0.002 U (P-1A RM6.4 Copper (dissolved) mg/L 0.001 U 0.327 (P-5 RM6.5) Copper (total) mg/L 0.01 UT 0.173 (GP62 RM 6.4) Lead (dissolved) mg/L 0.005 U 0.036 (P-5 RM 6.5) Lead (total) mg/L 0.02 U 0.13 (GP62 RM 6.4)

Portland Harbor RI/FS Final Remedial Investigation Report
February 8, 2016
A1-57
Parameter Minimum Maximum (Location) Mercury (mg/kg) na na Zinc (dissolved) mg/L 0.008 J 1.69 (P-5 RM 6.5) Zinc (total) mg/L 0.01 U 0.983 (GP62 RM 6.4) TBT (µg/kg) na na bis (2-ethylhexyl)phthalate (µg/L) 0.95 U 5.57 (P-3 RM 6.4) LPAH (µg/L 0.02 UT 14,600 JT (GP73 RM 6.4) HPAH (µg/L) 0.02 UT 1,550 (WS-11-125 RM 6.4) Total PCBs (µg/kg) na na 2,3,7,8-TCDD (pg/g) na na Total DDT (µg/kg) na na Dibenzonfuran (µg/L) 0.02 U 46.9 (WS-11-125 RM 6.4) 4-Methylphenol (µg/kg) na na Diesel range hydrocarbons (mg/L) 0.237 U 28.8 (WS-11-125 RM 6.4) Xylenes (µg/L) 0.26 T 1,430 T (WS-14 RM 6.4)
*There were other stations with this maximum value.
WLCEAF02. PHASE II STAGE 1 & 2 IN-RIVER GROUNDWATER AND SEDIMENT INVESTIGATION REPORT VOLUME 1 REPORT AND APPENDIX A, PORTLAND, OR (PREPARED BY INTEGRAL CONSULTING INC., DECEMBER 2003).
This investigation characterized the nature and extent of chemicals of interest (COIs) in groundwater and sediments that are downgradient of the existing monitoring well network, at the Arkema facility in Portland, OR (RM 7.3). The Phase II Stage 1 investigation was conducted from June 3–12, 2002, with seven boreholes (WB-1 through WB-7) advanced between Docks 1 and 2. The findings from the Stage 1 investigation were used as part of the criteria for choosing borehole locations for the Stage 2 investigation (WB-8 through WB-25). Eighteen boreholes were advanced during the Phase II Stage 2 investigation, which was conducted from February 17 through March 10, 2003.
Stage 1 subsurface sediment samples were collected using a square aluminum sediment sampler for the shallowest interval, and Geoprobe® Macrocore samplers for the deeper sediments. Boreholes WB-1 through WB-5 were advanced using a standard Geoprobe® push-probe rig. Due to a structural weight-load limitation on a portion of Dock 1, borehole WB-6 was advanced using a smaller Geoprobe® push-probe unit attached to the bed of a standard pickup truck. Borehole WB-7 was advanced on a narrow walkway on Dock 1 using a portable tripod Geoprobe® unit. Stage 2 subsurface sediment samples were advanced using a Geoprobe® push-probe rig mounted on a barge. Most boreholes were advanced through a moon hole in the approximate center of the barge, and in shallow water areas the Geoprobe® rig was mounted on the back of the barge.
Sediments were continuously sampled for lithologic description and, where possible, were field screened for 4,4’-DDT using thin-layer chromatography (TLC) methods, VOCs using an organic vapor meter (OVM), and non-aqueous phase liquid (NAPL) using Sudan IV® hydrophobic dye. A total of 174 samples, from both Stage 1 and Stage 2 sampling events, were field screened and 40 sediment samples were sent to an analytical laboratory for pesticide analysis. If a sufficient

Portland Harbor RI/FS Final Remedial Investigation Report
February 8, 2016
A1-58
volume of sediment was collected, sediment cores were composited over approximate 2-ft intervals.
Summary Data for Subsurface Samples. Parameter Minimum Maximum (Location) Arsenic (mg/kg) na na Cadmium (mg/kg) na na Copper (mg/kg) na na Lead (mg/kg) na na Mercury (mg/kg) na na Zinc (mg/kg) na na TBT (µg/L) na na bis(2-ethylhexyl)phthalate (µg/kg) na na Total LPAH (µg/kg) na na Total HPAH (µg/kg) na na Total PCBs (µg/kg) na na 2,3,7,8,-TCDD (ng/kg) na na Total DDT (µg/kg) 6.2 UTA 4,764,000 TA (WB-9 RM 7.34) Dibenzofuran (µg/kg) na na 4-Methylphenol (µg/kg) na na Diesel range hydrocarbons (mg/kg) na na Xylenes (µg/kg) na na
WLCOFJ02. SOURCE CONTROL SEDIMENT INVESTIGATION FOR THE CITY OF PORTLAND OUTFALLS, PORTLAND, OR (PREPARED BY CH2M HILL, JANUARY 2004).
The purpose of this investigation was to evaluate sediment quality during dry weather conditions in the Willamette River at 18 combined sewer overflow (CSO) outfalls, within the Portland Harbor Superfund site, RM 5-10. These data will be used to identify City outfalls which may be serving as conduits for contamination from upland sources, to identify potential upland sources of contaminants, to guide source control efforts, and to identify data needs for evaluations of the Portland Harbor Superfund site under CERCLA.
Surface sediment samples were collected between October 14 and 23, 2002 in the immediate vicinity of the outfalls and were generally spaced 50 to 100 ft apart. The type of sampling vessels used depended on sample station location characteristics. CH2M Hill personnel used either a 34-ft or a 28-ft shallow-draft vessel, and for locations where these two boats could not fit, a 12-ft steel-framed raft. Surface sediment (upper 15 cm) grab samples were collected using a stainless steel 0.1-m2 van Veen grab sampler for most samples, and a 0.025-m2 van Veen grab sampler when sampling from the smaller boat or river bottom conditions necessitated.
Physical characteristics of the sediment samples were described and recorded in the field notebook, and included sediment texture, color, presence, type, odor, grab penetration depth,

Portland Harbor RI/FS Final Remedial Investigation Report
February 8, 2016
A1-59
sediment surface disturbance, and any obvious abnormalities. Analyses included the conventional parameters of percent moisture, grain size, and TOC, and chemical parameters including metals, SVOCs, organochlorine pesticides, heavy oil and diesel-range hydrocarbons, PCBs, and chlorinated herbicides at one sample location per outfall. Additionally, chlorinated herbicide samples were collected at all four sampling locations in the vicinity of Outfall 22B.
Summary Data for Surface Samples. Parameter Minimum Maximum (Location) Arsenic (mg/kg) 1.49 83.5 (4804 RM 7.22) Cadmium (mg/kg) 0.00159 U 46.2 (M0301 RM 8.9) Copper (mg/kg) 12.8 772 B (19A01 RM 8.34) Lead (mg/kg) 4.59 936 (M0301 RM 8.9) Mercury (mg/kg) 0.0085 J 0.918 (4903 RM 6.45) Zinc (mg/kg) 33.2 2,850 (M0301 RM 8.9) TBT (µg/L) na na bis(2-ethylhexyl)phthalate (µg/kg) 12.4 UT 33,200 JA (M0301 RM 8.9) Total LPAH (µg/kg) 1.55 UTA 13,328 TA(M0304 RM 8.93) Total HPAH (µg/kg) 6.73 TA 93,000 TA (M0304 RM 8.93) Total PCBs (µg/kg) 0.21 JT 164 T (1902 RM 8.32) 2,3,7,8,-TCDD (ng/kg) na na Total DDT (µg/kg) 0.503 A 421.8 A (22B01 RM 6.95) Dibenzofuran (µg/kg) 12.4 UT 2,150 UJ(M0301 RM 8.9) 4-Methylphenol (µg/kg) 24.8 UT 4,310 UJ (M0301 RM 8.9) Diesel range hydrocarbons (mg/kg) 3.07 3,790 (1902 RM 8.32) Xylenes (µg/kg) na na
WLCMBI02. SURFACE WATER, SEDIMENT, AND GROUNDWATER SAMPLING REPORT, MCCORMICK & BAXTER CREOSOTING COMPANY SITE, PORTLAND, OR (PREPARED BY ECOLOGY AND ENVIRONMENT, INC., FEBRUARY 2003).
The purpose of this sediment investigation was to define the baseline conditions during low water conditions, before the construction of a subsurface barrier wall and sediment cap; to assess the relationship between bulk sediment chemistry and porewater chemistry; and to evaluate the protectiveness of the cap. The sampling event took place from September 5 to 26, 2002 at the McCormick & Baxter Creosoting Company Site, Portland, OR (RM 7 and 8).
The sediment samples were collected by two USEPA Region 10 teams (shore and dive teams). The shore team collected sediment samples in water shallower than 3 ft, and the dive team collected samples from within the river. Samples were obtained by coring with a hand auger inside of a PVC pipe. Ten sediment samples (SED-1 through SED-9, and EPA [SH] 6) and one QC sample (SED-51[5A]) were collected at the site. All 11 subsurface sediment samples were analyzed for mercury, PAHs, and pentachlorophenol.

Portland Harbor RI/FS Final Remedial Investigation Report
February 8, 2016
A1-60
Summary Data for Subsurface Samples. Parameter Minimum Maximum (Location) Arsenic (mg/kg) na na Cadmium (mg/kg) na na Copper (mg/kg) na na Lead (mg/kg) na na Mercury (mg/kg) 0.02 U 0.627 (SED06 RM 6.97) Zinc (mg/kg) na na TBT (µg/L) na na bis(2-ethylhexyl)phthalate (µg/kg) na na Total LPAH (µg/kg) 50.5 TA 244,562 TA (SED03 RM 6.87) Total HPAH (µg/kg) 261.6 TA 133,523 TA (SED01 RM 6.79) Total PCBs (µg/kg) na na 2,3,7,8,-TCDD (ng/kg) na na Total DDT (µg/kg) na na Dibenzofuran (µg/kg) 5.3 11,600 (EPASH06 RM 6.95) 4-Methylphenol (µg/kg) na na Diesel range hydrocarbons (mg/kg) na na Xylenes (µg/kg) na na
WLCMRI02. FINAL LIMITED SEDIMENT INVESTIGATION REPORT U.S. GOVERNMENT MOORINGS, PORTLAND, OR (PREPARED BY URS, MAY 2003).
This investigation consisted of collecting surface and subsurface sediment samples in order to assess the chemical characteristics of the sediments within the U.S. Moorings berthing area and the approach channels where vessel maneuvering may resuspend sediments, and to compare the results to downriver depositional sediment. The U.S. Moorings site is the homeport for the USACE hopper dredges and is located on the west bank of the Willamette River (RM 6.2).
URS Corporation staff collected the sediment samples from September 10 through 11, 2002. A gravity core sampler (barrel) and weight stand were staged on a boat deck attached to the hoist drop cable. General observations of the sediment core and material (grain size, gradations, odor, and the presence of NAPL) were recorded at each individual sample location. At a minimum, two cores per sample location were required to supply a sufficient volume of sediment to meet the analytical requirements. Three composite sediment samples, representing sediments from 0 to 3 ft below mudline, were collected from the potential scour areas: CS001 (Dock A), CS002 (Dock B), and CS003 (the downriver approach channel). Two composite sediment samples (CS004 and CS005) were collected from depositional areas downriver from the U.S. Moorings docks from the top 1-ft depth to represent recent sediment deposition. Five composite samples were submitted for chemical analysis of SVOCs, pesticides, PCBs, TBT, total metals, DRH, TOC, total cyanide, grain size, and total solids.

Portland Harbor RI/FS Final Remedial Investigation Report
February 8, 2016
A1-61
Summary Data for Subsurface Samples. Parameter Minimum Maximum (Location) Arsenic (mg/kg) 9 U 10 U (CS002 RM 6.05) Cadmium (mg/kg) 0.4 0.7 (CS003 RM 6.0) Copper (mg/kg) 50 63 (CS002 RM 6.05) Lead (mg/kg) 33 36 (CS001 RM 6.1) Mercury (mg/kg) 0.09 0.43 (CS001 RM 6.1) Zinc (mg/kg) 136 203 (CS003 RM 6.0) TBT (µg/kg) 9 J 14 J (CS002 6.05) bis(2-ethylhexyl)phthalate (µg/kg) 160 U 340 U (CS001 RM 6.1) Total LPAH (µg/kg) 10,110 A 93,450 A (CS001 RM 6.1) Total HPAH (µg/kg) 25,700 A 152,200 A (CS001 RM 6.1) Total PCBs (µg/kg) 39 UT 49 UT (CS003 RM 6.0) 2,3,7,8,-TCDD (ng/kg) na na Total DDT (µg/kg) 23.9 TA 142 TA (CS003 RM 6.0) Dibenzofuran (µg/kg) 180 980 (CS001 RM 6.1) 4-Methylphenol (µg/kg) 15 J 340 U (CS001 RM 6.1) Diesel range hydrocarbons (mg/kg) 130 Z 2,100 JT (CS001 RM 6.1) Xylenes (µg/kg) na na
Summary Data for Surface Samples.
Parameter Minimum Maximum (Location) Arsenic (mg/kg) 10 UT 10 U (CS005RM 5.95) Cadmium (mg/kg) 0.4 T 0.4 U (CS005 RM 5.95) Copper (mg/kg) 44.5 T 47 (CS005 RM 5.95) Lead (mg/kg) 12.5 T 13 (CS005 RM 5.95) Mercury (mg/kg) 0.08 UT 0.08 (CS005 RM 5.95) Zinc (mg/kg) 101 T 104 (CS005 RM 5.95) TBT (µg/kg) 3.1 J 3.45 JT (CS004 RM 6.0) bis(2-ethylhexyl)phthalate (µg/kg) 110 UT 130 U (CS005 RM 5.95) Total LPAH (µg/kg) 655 A 915 TA (CS004 RM 6.0) Total HPAH (µg/kg) 3,301 A 4,460 TA (CS004 RM 6.0) Total PCBs (µg/kg) 39 UTA 39 UTA(CS005 RM 5.95) 2,3,7,8,-TCDD (ng/kg) na na Total DDT (µg/kg) 11.7 TA 15.2 TA (CS004 RM 6.0) Dibenzofuran (µg/kg) 15 J 18.5 JT (CS004 RM 6.0) 4-Methylphenol (µg/kg) 11 JT 15 J (CS005 RM 5.95) Diesel range hydrocarbons (mg/kg) 52 Z 55.5 JT (CS004 RM 6.0) Xylenes (µg/kg) na na

Portland Harbor RI/FS Final Remedial Investigation Report
February 8, 2016
A1-62
WLCOFH02. SOURCE CONTROL PILOT PROJECT FOR THE CITY OF PORTLAND OUTFALLS, PORTLAND, OR (PREPARED BY CH2M HILL, AUGUST 2002).
The City of Portland initiated a pilot project to evaluate the impacts of stormwater discharge from City outfalls on sediment quality in the Willamette River. City outfalls M-1 and M-18 were selected as sediment sampling locations during the first phase of the pilot project. The purpose of the sampling was to determine whether chemical concentrations in sediment discharged from City outfalls warrant source investigation, identification, and control. In addition, information from sample analytical results was to be used to identify constituents of concern at these outfalls, which may be investigated further in a subsequent phase of the study.
Outfall M-1 is located in the Swan Island/Mocks Bottom basin or “lagoon.” Outfall M-18 is located in the Guilds Lake Industrial Area, at the site of Gunderson Rail Services. Nine surface (0–15 cm) sediment samples were collected at both outfalls from locations spread in an array upstream, adjacent to, and downstream of each outfall. The samples were collected from August 20–22, 2002, either from a shallow-draft vessel (Boston Whaler) using a grab sampler or on foot in wading depths using hand tools. Analyses included the conventional parameters of percent moisture, total solids, TOC, and grain size, and chemical parameters including metals, SVOCs, organochlorine pesticides, herbicides, PCBs, and TPH.
The results for indicator chemicals are summarized in the following two tables. The first table summarizes results for samples collected off Outfall M-1; the second table summarizes results for samples collected off Outfall M-18. Results are reported on a dry-weight basis.
Summary Data for M-1 Surface Samples. Parameter Minimum Maximum Arsenic (mg/kg) 2.81 8.98 Cadmium (mg/kg) 0.00927 U 1.89 Copper (mg/kg) 15 B 86.5 B Lead (mg/kg) 5.45 B 57.6 B Mercury (mg/kg) 0.0102 U 0.131 Zinc (mg/kg) 57 B 403 B TBT (µg/kg) na na bis(2-ethylhexyl)phthalate (µg/kg) 68.4 U 39,200 J Total LPAH (µg/kg) 19.57 A 744 A Total HPAH (µg/kg) 60.4 A 2,832 A Total PCBs (µg/kg) 6.18 UA 338 A 2,3,7,8-TCDD (ng/kg) na na Total DDT (µg/kg) 0.635 UA 5.87 A Dibenzofuran (µg/kg) 18.5 U 261 UJ 4-Methylphenol (µg/kg) 23.6 U 68 J Diesel range hydrocarbons (mg/kg) 26.1 JV 777 V Xylenes (µg/kg) na na

Portland Harbor RI/FS Final Remedial Investigation Report
February 8, 2016
A1-63
Summary Data for M-18 Surface Samples. Parameter Minimum Maximum Arsenic (mg/kg) 4.36 9.76 Cadmium (mg/kg) 0.0638 J 0.897 Copper (mg/kg) 41 B 98.9 B Lead (mg/kg) 60.6 B 210 B Mercury (mg/kg) 0.0103 U 0.453 Zinc (mg/kg) 119 B 272 B TBT (µg/kg) na na bis(2-ethylhexyl)phthalate (µg/kg) 62.7 U 2700 Total LPAH (µg/kg) 40.1 A 1,186 A Total HPAH (µg/kg) 92.2 A 3,106 A Total PCBs (µg/kg) 64.7 A 640 A 2,3,7,8-TCDD (ng/kg) na na Total DDT (µg/kg) 20.1 A 178.5 A Dibenzofuran (µg/kg) 17.7 U 45 J 4-Methylphenol (µg/kg) 22.6 U 72.4 J Diesel range hydrocarbons (mg/kg) 16.2 JV 369 V Xylenes (µg/kg) na na
WLCMCB02. MARCOM EXPANDED PRELIMINARY ASSESSMENT, PORTLAND, OR (PREPARED BY PARAMETRIX, 2002).
Parametrix performed an Expanded Preliminary Assessment (XPA) at the MarCom facility in Portland in 2002. The purpose of an XPA is to determine whether a site has experienced or may experience a release that could endanger human health or the environment. In addition to upland soil and groundwater samples, three sediment samples were collected in the nearshore area of the Willamette River adjacent to the facility. The samples were collected 1) near the southern boundary of the site near a stormwater outfall (SED-1), 2) midway along the shoreline near a second stormwater outfall (SED-2), and 3) near the northern boundary of the site inshore of an active marineways facility (SED-3).
The sediment sampling was conducted on February 8, 2002. The samples were collected from a surface interval of 0-15 cm using a Peterson-type clamshell sampler. Analyses included percent solids, total metals, organotins, and PAHs. The results for indicator chemicals are summarized in the following table, reported on a dry-weight basis.
Summary Data for Surface Samples. Parameter Minimum Maximum (Location) Arsenic (mg/kg) 7.39 105 (SED-2) Cadmium (mg/kg) 0.397 U 0.5 U (SED-3) Copper (mg/kg) 118 1,150 (SED-2) Lead (mg/kg) 35.2 577 (SED-1) Mercury (mg/kg) 0.1 U 0.106 (SED-2) Zinc (mg/kg) 225 2,010 (SED-2)

Portland Harbor RI/FS Final Remedial Investigation Report
February 8, 2016
A1-64
Parameter Minimum Maximum (Location) TBT (µg/kg) 43.7 819 (SED-2) bis(2-ethylhexyl)phthalate (µg/kg) na na Total LPAH (µg/kg) 239 A 668.7 A (SED-2) Total HPAH (µg/kg) 2,224.3 A 5,090 A (SED-2) Total PCBs (µg/kg) na na 2,3,7,8-TCDD (ng/kg) na na Total DDT (µg/kg) na na Dibenzofuran (µg/kg) na na 4-Methylphenol (µg/kg) na na Diesel range hydrocarbons (mg/kg) na na Xylenes (µg/kg) na na
WLCGXB02. REMEDIAL INVESTIGATION KINDER MORGAN LIQUID TERMINALS, LLC, LINTON FACILITY, PORTLAND, OR (PREPARED BY KHM ENVIRONMENTAL MANAGEMENT, INC., OCTOBER 2002).
This investigation consisted of two sediment samples (SED-1 and SED-3) collected along the base of the seawall in an apparent seep at Kinder Morgan Liquid (KML) Linnton Terminal in Portland, OR (RM 4.5). The sediment samples were collected during field activities in January, February, and April of 2002 to assess the concentrations of COIs in nearshore areas.
The two surface sediment (0 to 6 in.) samples were collected using a hand shovel in the seep area along the riverbank. The sediment samples were analyzed for TPH in the gasoline, diesel, and heavy oil ranges; total BTEX and naphthalene; and total metals.
Summary Data for Surface Samples. Parameter Minimum Maximum (Location) Arsenic (mg/kg) na na Cadmium (mg/kg) na na Copper (mg/kg) na na Lead (mg/kg) na na Mercury (mg/kg) na na Zinc (mg/kg) na na TBT (µg/L) na na bis(2-ethylhexyl)phthalate (µg/kg) 2,000 U 16,000 U (SED03 RM 4.18) Total LPAH (µg/kg) 15.4 TA 437 TA (SED03 RM 4.18) Total HPAH (µg/kg) 155.1 TA 4,849 TA (SED03 RM 4.18) Total PCBs (µg/kg) na na 2,3,7,8,-TCDD (ng/kg) na na Total DDT (µg/kg) na na Dibenzofuran (µg/kg) 330 U 2,640 U (SED03 RM 4.18) 4-Methylphenol (µg/kg) na na Diesel range hydrocarbons (mg/kg) 25 U 173 (SED03 RM 4.18)

Portland Harbor RI/FS Final Remedial Investigation Report
February 8, 2016
A1-65
Parameter Minimum Maximum (Location) Xylenes (µg/kg) 50 J 50 J (SED03 RM 4.18)
WLCWTG02. WILLBRIDGE TERMINAL POST-DREDGING SEDIMENT CHARACTERIZATION DATA REPORT PORTLAND, OR (PREPARED BY PNG ENVIRONMENTAL, INC., AND ANCHOR ENVIRONMENTAL, L.L.C., OCTOBER 2002).
This investigation consisted of surface sediment sampling to characterize post-dredge surface sediment chemical concentrations in the 0 to 2 cm and 0 to 15 cm intervals in the ChevronTexaco portion of the Willbridge Terminal, Willamette River, Portland, OR.
Anchor Environment personnel collected eight surface sediment samples on July 16, 2002 using a 0.1 m2 van Veen grab sampler. At each sampling station, a 0 to 2 cm and 0 to 15 cm sediment sample was collected adjacent to each other.
Sediment from the 0 to 2 cm and 0 to 15 cm were each placed in a stainless steel bowl and homogenized prior to being placed in sample containers. Additional sediment volume was subsampled at station AN-CTPD-06 as a homogenization duplicate, and a field replicate sample was collected at AN-CTPD-05.
All samples were analyzed for conventional parameters (grain size, total solids, TOC), metals, TBT, PCBs, pesticides, SVOCs and VOCs. Minimum and maximum results are provided in the table below:
Summary Data for Surface Samples. Parameter Minimum Maximum (Location) Arsenic (mg/kg) 3.2 5.5 (AN-CTPD-03 RM 7.6) Cadmium (mg/kg) 0.26 0.45 (AN-CTPD-04 RM 7.6) Copper (mg/kg) 30.6 40.9 (AN-CTPD-01 RM 7.6) Lead (mg/kg) 13 37.6 (AN-CTPD-04 RM 7.6) Mercury (mg/kg) 0.06 0.11 (AN-CTPD-04 RM 7.6, AN-CTPD-07
RM 7.7) Zinc (mg/kg) 87.8 191 (AN-CTPD-04 RM 7.6) TBT (µg/kg) 1.8 83 T (AN-CTPD-06 RM 7.7) bis(2-ethylhexyl)phthalate (µg/kg)
370 U 6700 (AN-CTPD-02 RM 7.6)
Total LPAH (µg/kg) 34 T 510 T (AN-CTPD-04 RM 7.6) Total HPAH (µg/kg) 150 T 1400 T (AN-CTPD-01 RM 7.6) Total PCBs (µg/kg) 10 JT 140 T (AN-CTPD-04 RM 7.6) 2,3,7,8,-TCDD (ng/kg) na na Total DDT (µg/kg) 3.3 A 27 A (AN-CTPD-01 RM 7.6) Dibenzofuran (µg/kg) 1.8 32 (AN-CTPD-04 RM 7.6) 4-Methylphenol (µg/kg) 23 U 190 (AN-CTPD-04 RM 7.6)

Portland Harbor RI/FS Final Remedial Investigation Report
February 8, 2016
A1-66
Parameter Minimum Maximum (Location) Diesel range hydrocarbons (mg/kg)
na na
Xylenes (µg/kg) 3.5 UT 6.6 UT (AN-CTPD-08 RM 7.7)
WLCPOB02. WILLAMETTE RIVER FNC POST OFFICE BAR REACH (RM 2.2) SEDIMENT QUALITY EVALUATION REPORT. (PREPARED BY PORTLAND DISTRICT CORPS OF ENGINEERS, FEBRUARY 2009).
This sediment investigation was conducted to characterize sediment that is to be dredged as requested by the Columbia River Pilots. This area was last dredged in 1997. The material to be characterized is for sediment shoals at approximately RM 2.1-2.4, Post Office Bar. Sampling activities took place on February 11, 2009.
A total of six vibracore samples were collected, three of which from the dredging prism were retained as discrete samples. These samples were then divided in order to represent the dredging prism and the new surface material. The three remaining samples were collected just shoreward of the dredge prism to represent the potential sloughing materials. The three cores representing the dredging prism had recoveries from 8.9 ft to 10.2 ft. The three other core samples that were collected to represent the potential sloughing materials had recoveries from 5.3 ft to 5.6 ft. Six sub-samples were submitted for physical analyses and twelve sub-samples were submitted for the following chemical analyses: metals, pesticides, PCBs, chlorinated hydrocarbons, phenols, phthalates, PAHs and TPH. Three sub-samples were submitted for the previously listed analytes and TBT and VOCs.
Summary Data for Subsurface Sediment Samples Parameter Minimum Maximum (Location) Arsenic (mg/kg) 2.7 4.2 (PB-VC-03 RM 2.3) Cadmium (mg/kg) 0.187 1.49 (PB-VC-03 RM 2.3) Copper (mg/kg) 32.1 40.6 (PB-VC-06 RM 2.4) Lead (mg/kg) 10.4 30.5 (PB-VC-03 RM 2.3) Mercury (mg/kg) 0.049 0.154 (PB-VC-03 RM 2.3) Zinc (mg/kg) 68.9 226 (PB-VC-03 RM 2.3) TBT (µg/kg) 0.54 U 8.1 (021108WRPB-VC-01 RM 2.2) bis(2-ethylhexyl)phthalate (µg/kg) 17 J 48 J (021108WRPB-VC-05 RM 2.3) Total LPAH (µg/kg) 43 JT 1000 T (PB-VC-05 RM 2.3) Total HPAH (µg/kg) 250 JT 4200 T (PB-VC-05 RM 2.3) Total PCBs (µg/kg) 7.4 UT 150 T (PB-VC-03 RM 2.3) 2,3,7,8,-TCDD (ng/kg) na na Total DDx (µg/kg) 4.2 JT 19 T (PB-VC-03 RM 2.3) Dibenzofuran (µg/kg) 1.2 U 35 (PB-VC-03 RM 2.3) 4-Methylphenol (µg/kg) 1.5 U 24 (PB-VC-05 RM 2.3) Diesel range hydrocarbons (mg/kg) 0.045 J 0.14 (PB-VC-03 RM 2.3) Xylenes (µg/kg) 0.18 UT 0.19 UT (PB-VC-01 RM 2.2)

Portland Harbor RI/FS Final Remedial Investigation Report
February 8, 2016
A1-67
WLCPGH02. CLD PACIFIC GRAIN POST DREDGE SURFACE SEDIMENT SAMPLE (AUGUST 29, 2002)
This sediment investigation consisted of collecting one surface sediment sample in order to compare to screening levels of the Lower Columbia River. The sample was collected on August 29, 2002 at RM 11.5 and was analyzed for PCBs, PAHs and total solids.
Summary of Surface Sediment Sample Parameter Minimum Maximum (Location) Arsenic (mg/kg) na na Cadmium (mg/kg) na na Copper (mg/kg) na na Lead (mg/kg) na na Mercury (mg/kg) na na Zinc (mg/kg) na na TBT (µg/kg) na na Bis(2-ethylhexyl) phthalate (µg/kg) na na Total LPAH (µg/kg) 28.9 28.9 JT (CLD Pacific RM 11.5) Total HPAH (µg/kg) 254.5 254.5 JT (CLD Pacific RM 11.5) Total PCBs (µg/kg) 49 49 T (CLD Pacific RM 11.5) 2,3,7,8-TCDD (pg/g) na na Total DDx (µg/kg) na na Dibenzofuran (µg/kg) na na 4-Methylphenol (µg/kg) na na Diesel range hydrocarbons (mg/kg) na na Xylenes (µg/kg) na na
WLCDRI03. WILLAMETTE RIVER FEDERAL NAVIGATIONAL CHANNEL OPERATION & MAINTENANCE SEDIMENT CHARACTERIZATION REPORT PORTLAND, OR (PREPARED BY HART CROWSER, JUNE 2004).
Hart Crowser conducted this study for the USACE, Portland District, to characterize sediments proposed for dredging and to ensure residual sediments do not cause increased environmental risk. The USACE proposes to dredge up to 1,052,600 cy of sediments within the Willamette River FNC (RM 3, 8-10, 15, 23). Subsurface sediment coring was completed using a vibracorer at 53 locations between September 18 and 23, 2004. Reference sediment samples from two locations in the LWR were collected using an air-powered van Veen Grab sampler on September 25, 2003.
Subsurface sediment samples were collected from 53 locations (HC-VC-01 through HC-VC-53) and divided into 19 dredge prisms (CSS1 through CSS19) identified as Composite Sediment Samples (CSSs). All 19 CSSs and the two reference sediment samples (HC-REF-01 and HC-REF-02) were analyzed for conventional parameters (grain size, total volatile solids, total solids, ammonia, sulfide, and TOC), metals, TBT, SVOCs, PAHs, phenols, chlorinated hydrocarbons, phthalates, pesticides, and PCBs.

Portland Harbor RI/FS Final Remedial Investigation Report
February 8, 2016
A1-68
Summary Data for Subsurface Samples. Parameter Minimum Maximum (Location) Arsenic (mg/kg) 2.4 J 4.6 J (C04-06 RM 8.02) Cadmium (mg/kg) 0.18 J 0.43 (C01-03 RM 2.25) Copper (mg/kg) 26.3 J 116 J (C04-06 RM 8.02) Lead (mg/kg) 10.5 24.9 (C07-08 RM 7.63) Mercury (mg/kg) 0.04 0.25 (C21-23 RM 8.82) Zinc (mg/kg) 72.7 J 133 J (C04-06 8.02) TBT (µg/L) 0.0039 U 3.9 (C04-06 8.02) bis(2-ethylhexyl)phthalate (µg/kg) 39 J 560 (C04-06 RM 8.02) Total LPAH (µg/kg) 13.1 JA 528 A (C01-03 RM 2.25) Total HPAH (µg/kg) 66.5 A 831 A (C04-06 RM 8.02) Total PCBs (µg/kg) 5.1 JA 32 A (C07-08 RM 7.63) 2,3,7,8,-TCDD (ng/kg) na na Total DDT (µg/kg) 2.31 A 16.6 A (C07-08 RM 7.63) Dibenzofuran (µg/kg) 2.2 U 13 (C01-03 RM 2.25) 4-Methylphenol (µg/kg) 8.7 J 94 (C27-29 RM 8.84) Diesel range hydrocarbons (mg/kg) na na Xylenes (µg/kg) na na
Summary Data for Surface Samples.
Parameter Minimum Maximum (Location) Arsenic (mg/kg) 2.5 J 2.9 J (HC-REF-01 RM 15.5) Cadmium (mg/kg) 0.21 0.21 (HC-REF-02 RM 23.2) Copper (mg/kg) 30.4 30.7 (HC-REF-01 RM 15.5) Lead (mg/kg) 7.18 7.48 (HC-REF-01 RM 15.5) Mercury (mg/kg) 0.03 0.03 (HC-REF-02 RM 23.2) Zinc (mg/kg) 67.4 J 68.5 J (HC-REF-01 RM 15.5) TBT (µg/L) 0.0039 U 0.0039 U (HC-REF-02 RM 23.2) bis(2-ethylhexyl)phthalate (µg/kg) 3.2 UJ 29 J (HC-REF-02 RM 23.2) Total LPAH (µg/kg) 13.8 A 14.8 A (HC-REF-01 RM 15.5) Total HPAH (µg/kg) 42.75 A 49.95 A (HC-REF-01 RM 15.5) Total PCBs (µg/kg) 3.4 UA 4.7 JA (HC-REF-02 RM 23.2) 2,3,7,8,-TCDD (ng/kg) na na Total DDT (µg/kg) 1.74 A 2.39 A (HC-REF-01 RM 15.5) Dibenzofuran (µg/kg) 2.5 UJ 2.6 UJ (HC-REF-02 RM 23.2) 4-Methylphenol (µg/kg) 5.5 UJ 6.4 J (HC-REF-02 RM 23.2) Diesel range hydrocarbons (mg/kg) na na Xylenes (µg/kg) na na

Portland Harbor RI/FS Final Remedial Investigation Report
February 8, 2016
A1-69
WLCGNG03. GUNDERSON, INC. AREA 2 - SANDY BEACH AREA UPLAND SOURCE EVALUATION (PREPARED BY SQUIER|KLEINFELDER, FEBRUARY 2004).
Squier|Kleinfelder collected surface soil samples as part of the Area 2 Expanded Preliminary Assessment. Collections were performed on July 8, 2003. The stations were located on two sandy beaches in Area 2, which is also known as the Rail Car and Marine Barge Assembly Area. Samples were identified as A2GS-9 through A2GS-12. Samples were collected near the former launchways (A2GS-9 and A2GS-10) and near City of Portland Outfall 18 (A2GS-11 and A2GS-12).
Surface soil samples were collected with a decontaminated, stainless steel trowel. Samples were analyzed for petroleum hydrocarbons (gasoline range, diesel range, and heavy hydrocarbons), SVOCs (PAHs, phthalates, phenols), VOCs, PCBs, metals, and butyltins.
Summary Data for Surface Samples. Parameter Minimum Maximum (Location) Arsenic (mg/kg) 10.8 79.6 (A2GS10) Cadmium (mg/kg) 0.373 U 0.442U (A2GS09) Copper (mg/kg) 52 400 (A2GS10) Lead (mg/kg) 116 343 (A2GS10) Mercury (mg/kg) 0.0833 U 0.25 (A2GS12) Zinc (mg/kg) 264 1,140 (A2GS10) TBT (µg/L) 2.99 U 1,830 (A2GS12) bis(2-ethylhexyl)phthalate (µg/kg) 10,000 U 40,000 U (A2GS12) Total LPAH (µg/kg) 58.7 T 6,790 T (A2GS12) Total HPAH (µg/kg) 71.1 T 19,600 T (A2GS12) Total PCBs (µg/kg) 68.3 T 606 T(A2GS12) 2,3,7,8,-TCDD (ng/kg) na na Total DDT (µg/kg) na na Dibenzofuran (µg/kg) 1,650 U 6,600 U (A2GS12) 4-Methylphenol (µg/kg) na na Diesel range hydrocarbons (mg/kg) 25 U 50 (A2GS12) Xylenes (µg/kg) 200 UT 200 UT (A2GS09)*
* There were several samples with this maximum value.
WLCITC03. INTERNATIONAL TERMINALS SEDIMENT DATA REPORT PORTLAND, OR (PREPARED BY FLOYD SNIDER MCCARTHY, INC., JUNE 2003).
This investigation consisted of sediment sampling to provide sediment quality data to aid in dredge design so that the post-dredge surface can be considered acceptable at the International Terminals Slip. Berths 1 through 3 are located within the International Terminals Slip adjacent to the Burgard Industrial Yard, and Berths 4 and 5 are located on the river side of the facility.
Floyd Snider McCarthy personnel collected six cores from March 11–13, 2003, using the MudMoleTM pneumatic core sampler. The sampler is made up of a 4-in.-square aluminum

Portland Harbor RI/FS Final Remedial Investigation Report
February 8, 2016
A1-70
coring tube. Twenty core tubes, each 1 ft long, were used at all sampling locations. Cores SDC-SS01 and SDC-SS02 were located within Berths 4 and 5, and cores SDC-SS03 through SDC-SS06 were located within the International Terminals Slip.
Two composites per core were homogenized. One composite consisted of a section from the mudline to the bottom of the proposed dredge cut. The bottom section of the core consisted of the top section of sediment to be exposed by the proposed dredge cut. This section of the core sample was sectioned into 1-ft-long segments and submitted for analysis. Summary of Core Samples. Subsurface Core ID Berths
Composite Sample ID
Approximate Interval (Relative to CRD) Interval Description
SDC-SS01 4 & 5 -000007 Surface to -38 Sample Depth is Surface to -42 -007010C -38 to -41
-010011 -41 to -42 SDC-SS02 4 & 5 -000013 Surface to -36 Sample Depth is
Surface to -42 -013014 -36 to -37 -014015 -37 to -38 -015017C -38 to-40 -017018 -40 to -41 -018019 -41 to -42
SDC-SS03R2 1-3 -000001 Surface to -41 Sample Depth is Surface to -46 -001002 -41 to -42
-002004C -42 to -44 -004005 -44 to -45 -005006 -45 to -46
SDC-SS04 1-3 -000008 Surface to -38 Sample Depth is Surface to -38
SDC-SS05 1-3 -000012 Surface to -38 Sample Depth is Surface to -39 -012013 -38 to -39
-013014 -39 to -40 -014016C -40 to -42
SDC-SS06 1-3 -000007 Surface to -38 Sample Depth is Surface to –43 -007008 -38 to -39
-008010C -39 to -41 -010011 -41 to -42 -011012 -42 to -43
All composite sediment samples were analyzed for conventional parameters (grain size, total solids, TOC), metals, TBT, SVOCs, chlorinated pesticides, chlorinated hydrocarbons, and PCBs. Screening for PAHs was performed on core segments in order to characterize the post-dredge sediment surface quality. After the proposed station, SDC-SS07, was abandoned due to poor recovery, it was determined that station SDC-SS06 could be considered representative of this area.

Portland Harbor RI/FS Final Remedial Investigation Report
February 8, 2016
A1-71
Summary Data for Subsurface Samples. Parameter Minimum Maximum (Location) Arsenic (mg/kg) 1.1 3.18 (SDC-SS02 RM 3.86) Cadmium (mg/kg) 0.04 J 0.48 (SDC-SS01 RM 4.02) Copper (mg/kg) 11.8 29.3 (SDC-SS06 RM 3.86) Lead (mg/kg) 2.28 30.5 (SDC-SS06 RM 3.86) Mercury (mg/kg) 0.01 J 0.25 (SDC-SS02 RM 3.86) Zinc (mg/kg) 33 107 (SDC-SS01 RM 4.02) TBT (µg/kg) 0.46 UJ 150 (SDC-SS01 RM 4.02) bis(2-ethylhexyl)phthalate (µg/kg) 5 J 770 J (SDC-SS01 RM 4.02) Total LPAH (µg/kg) 0.28 UTA 3,540 A (SDC-SS02 RM 3.86) Total HPAH (µg/kg) 0.24 UTA 7,982 JA (SDC-SS02 RM 3.86) Total PCBs (µg/kg) 2.3 UA 300 A (SDC-SS06 RM 3.86) 2,3,7,8,-TCDD (ng/kg) na na Total DDT (µg/kg) 0.22 U 37 J (SDC-SS02 RM 3.86) Dibenzofuran (µg/kg) 0.26 U 110 (SDC-SS02 RM 3.86) 4-Methylphenol (µg/kg) 3.7 U 190 (SDC-SS02 RM 3.86) Diesel range hydrocarbons (mg/kg) na na Xylenes (µg/kg) na na
WLCSPL03. EXPANDED PRELIMINARY ASSESSMENT SULZER PUMPS SITE (PREPARED BY GEODESIGN, 2004)
As part of the XPA, GeoDesign collected sediment samples to evaluate the impact of sandblasting activities on the Willamette River. Stormwater in the sandblast areas onsite flows to catch basins that discharge to the river via outfalls. Samples (SED-1 through SED-9 and SED-13 through SED-16) were obtained from river sediments at the discharge points of Outfalls B, C, and D. Four samples were collected from each outfall area, one directly beneath the discharge point and one sample approximately 15 ft upstream, downstream, and towards the river channel. One background sediment sample (SED-9) was obtained approximately 100 ft upstream from Outfall D. Sediment samples (SED-10 through -12) were also collected in the vicinity of metal slag in the nearshore area to determine the impact of the slag on river sediment. All samples were collected from the upper 6 inches of sediment to evaluate conditions in the biologically active zone.
All samples were analyzed for diesel- and oil-range petroleum hydrocarbons, arsenic, cadmium, copper, lead, and zinc. If hydrocarbons were detected, the sample was also submitted for analysis of PAHs. Minimum and maximum results are provided in the table below.
Summary Data for Surface Sediment Samples. Parameter Minimum Maximum (Location) Arsenic (mg/kg) 23 55 (SED-12 RM 10.3) Cadmium (mg/kg) 0.124 U 1.23 (SED-2 RM 10.3)

Portland Harbor RI/FS Final Remedial Investigation Report
February 8, 2016
A1-72
Parameter Minimum Maximum (Location) Copper (mg/kg) 47 846 (SED-5 RM 10.3) Lead (mg/kg) 31.3 961 (SED-3 RM 10.3) Mercury (mg/kg) na na Zinc (mg/kg) 150 904 (SED-8 RM 10.3) TBT (µg/L) na na bis(2-ethylhexyl)phthalate (µg/kg) na na Total LPAH (µg/kg) 74.9 JA 647 JA (SED-6 RM 10.3) Total HPAH (µg/kg) 241 T 2400 T (SED-4 RM 10.3) Total PCBs (µg/kg) na na 2,3,7,8,-TCDD (ng/kg) na na Total DDT (µg/kg) na na Dibenzofuran (µg/kg) na na 4-Methylphenol (µg/kg) na na Diesel range hydrocarbons (mg/kg) 12.5 U 300 (SED-2 RM 10.3) Xylenes (µg/kg) na na
WLTASE03. ODHS/USEPA/ATSDR FISH CONTAMINANT STUDY (PREPARED BY ODHS, USEPA AND ASTDR, 2003).
This study was conducted by the Oregon Department of Health Sciences (ODHS), USEPA, and ATSDR. The results presented in the following tables are from fish tissue collected by the Oregon Department of Fish and Wildlife (ODFW) and USEPA from three species: sturgeon, Chinook salmon, and the Pacific lamprey. Sturgeon were collected using a set line, Chinook salmon were collected from the Clackamas Fish Hatchery using dip nets, and Pacific lamprey were collected at Willamette Falls using unknown methods. All concentrations shown are in wet weight.
Sturgeon Fillet without Skin (Collected August 11–13 and August 25–27, 2003). Parameter Minimum Maximum (Location) Arsenic (mg/kg) 0.77 2.76 (RM 3.5-9.2) Cadmium (mg/kg) 0.049 UT 0.05 U (RM 3.5-9.2) Copper (mg/kg) 0.65 1.2 (RM 3.5-9.2) Lead (mg/kg) 0.049 UT 0.078 (RM 3.5-9.2) Mercury (mg/kg) 0.0963 0.322 T (RM 3.5-9.2) Zinc (mg/kg) 10.2 13.7T (RM 3.5-9.2) TBT (µg/kg) na na bis (2-ethylhexyl)phthalate (µg/kg) na na Total LPAH (µg/kg) 3.1 JT 23.1 T (RM 3.5-9.2) Total HPAH (µg/kg) 0.9 JT 15 UT (RM 3.5-9.2) Total PCB Aroclors (µg/kg) 43 430 JT (RM 3.5-9.2) Total PCB Congeners (µg/kg) 84.7 964 (RM 3.5-9.2)

Portland Harbor RI/FS Final Remedial Investigation Report
February 8, 2016
A1-73
Parameter Minimum Maximum (Location) 2,3,7,8-TCDD (pg/g) 0.06 0.234 (RM 3.5-9.2) Total DDT (µg/kg) na na Dibenzofuran (µg/kg) 0.8 J 3.9 U (RM 3.5-9.2) 4-Methylphenol (µg/kg) na na Diesel range hydrocarbons (mg/kg) na na Xylenes (µg/kg) na na Pesticides* (µg/kg) 38 JT 125 JT (RM 3.5-9.2)
*Pesticides=2,2’ and 2,4’-DDD, -DDE, and -DDT Chinook Fillet (Collected on June 20, 2003).
Parameter Minimum Maximum (Location) Arsenic (mg/kg) 2.4 3.99 (Clackamas Fish Hatchery) Cadmium (mg/kg) 0.05 0.05 U (Clackamas Fish Hatchery) Copper (mg/kg) 1.6 1.7 (Clackamas Fish Hatchery) Lead (mg/kg) 0.05 0.05 U (Clackamas Fish Hatchery) Mercury (mg/kg) na na Zinc (mg/kg) 14.5 15.2 (Clackamas Fish Hatchery) TBT (µg/kg) na na bis (2-ethylhexyl)phthalate (µg/kg) na na Total LPAH (µg/kg) 1.8 JT 5.4 T (Clackamas Fish Hatchery) Total HPAH (µg/kg) 15 UT 16 UT (Clackamas Fish Hatchery) Total PCB Aroclors (µg/kg) 9.5 J 20 J (Clackamas Fish Hatchery) Total PCB Congeners (µg/kg) 8.71 15.3 (Clackamas Fish Hatchery) 2,3,7,8-TCDD (pg/g) 0.028 UT 0.038 U (Clackamas Fish Hatchery) Total DDT (µg/kg) na na Dibenzofuran (µg/kg) 3.8 U 4 U (Clackamas Fish Hatchery) 4-Methylphenol (µg/kg) na na Diesel range hydrocarbons (mg/kg) na na Xylenes (µg/kg) na na Pesticides* (µg/kg) 3.6 UT 12 JT (Clackamas Fish Hatchery)
Pesticides=2,2’ and 2,4’-DDD, -DDE, and -DDT Chinook Whole Body (June 20, 2003).
Parameter Minimum Maximum (Location) Arsenic (mg/kg) 2.4 2.95 T (Clackamas Fish Hatchery) Cadmium (mg/kg) 0.049 U 0.05 UT (Clackamas Fish Hatchery) Copper (mg/kg) 4.13 4.53 T (Clackamas Fish Hatchery) Lead (mg/kg) 0.049 U 0.05 UT (Clackamas Fish Hatchery) Mercury (mg/kg) 0.0448 0.1 (Clackamas Fish Hatchery) Zinc (mg/kg) 66.6 T 112 (Clackamas Fish Hatchery) TBT (µg/kg) na na bis(2-ethylhexyl)phthalate (µg/kg) na na

Portland Harbor RI/FS Final Remedial Investigation Report
February 8, 2016
A1-74
Parameter Minimum Maximum (Location) Total LPAH (µg/kg) 3.9 UT 6.5 JT (Clackamas Fish Hatchery) Total HPAH (µg/kg) 1 JT 16 UT (Clackamas Fish Hatchery) Total PCB Aroclors (µg/kg) 39 J 19 (Clackamas Fish Hatchery) Total PCB Congeners (µg/kg) 6.89 17.1 T (Clackamas Fish Hatchery) 2,3,7,8-TCDD (pg/g) 0.041 U 0.051 (Clackamas Fish Hatchery) Total DDT (µg/kg) na na Dibenzofuran (µg/kg) 0.7 J 3.9 U(Clackamas Fish Hatchery) 4-Methylphenol (µg/kg) na na Diesel range hydrocarbons (mg/kg) na na Xylenes (µg/kg) na na Pesticides* (µg/kg) 5.4 JT 7.9 T (Clackamas Fish Hatchery)
*Pesticides=2,2’ and 2,4’-DDD, -DDE, and -DDT Pacific Lamprey Whole Body (Collected May 22, 2003).
Parameter Minimum Maximum (Location) Arsenic (mg/kg) 0.61 0.86 (Willamette Falls) Cadmium (mg/kg) 0.16 0.2 (Willamette Falls) Copper (mg/kg) 12.3 15.2 (Willamette Falls) Lead (mg/kg) 0.047 U 0.36 (Willamette Falls) Mercury (mg/kg) 0.125 0.168 (Willamette Falls) Zinc (mg/kg) 52.6 62.9 (Willamette Falls) TBT (µg/kg) na na bis(2-ethylhexyl)phthalate (µg/kg) na na Total LPAH (µg/kg) 3.6 JT 48.1 JT(Willamette Falls) Total HPAH (µg/kg) 9.6 JT 20 UT (Willamette Falls) Total PCB Aroclors (µg/kg) 39 J 50 (Willamette Falls) Total PCB Congeners (µg/kg) 38.5 48.6 (Willamette Falls) 2,3,7,8-TCDD (pg/g) 0.041 U 0.052 (Willamette Falls) Total DDT (µg/kg) na na Dibenzofuran (µg/kg) 2.9 J 4.9 UJ (Willamette Falls) 4-Methylphenol (µg/kg) na na Diesel range hydrocarbons (mg/kg) na na Xylenes (µg/kg) na na Pesticides* (µg/kg) 23 UJT 28 UJT (Willamette Falls)
*Pesticides=2,2’ and 2,4’-DDD, -DDE, and –DDT
WLCGWF03. DREDGE MATERIAL CHARACTERIZATION REPORT GLACIER NORTHWEST PORTLAND CEMENT TERMINAL PORTLAND, OREGON (PREPARED BY ANCHOR ENVIRONMENTAL, JULY 2003).
This sediment investigation was conducted to characterize sediments at the Glacier Northwest cement terminal prior to proposed maintenance dredging. Four locations near RM 11.3 were sampled on May 6, 2003.

Portland Harbor RI/FS Final Remedial Investigation Report
February 8, 2016
A1-75
One surface sediment sample was collected using a Ponar sampler and three cores were collected using a vibracorer. The core recoveries ranged from 2 ft to 10 ft. The cores were divided in order to represent the dredging prism and the new surface material. Two composite samples were created: one from all 3 cores and the surface sample representing the post dredge surface, and one from the three cores representing the material to be dredged. These samples were submitted for the following analyses: TOC, grain size, metals, pesticides, PCBs, chlorinated hydrocarbons, phenols, phthalates, PAHs, and TPH. Following receipt of the analytical data for the composite samples four discrete samples were analyzed for Aroclors to further characterize the sediments.
Summary of Sediment Samples Parameter Minimum Maximum (Location) Arsenic (mg/kg) 3.5 3.5 (GNVC010304 RM 11.2) Cadmium (mg/kg) 0.31 0.31 (GNVC010304 RM 11.2) Copper (mg/kg) 45.4 45.4 (GNVC010304 RM 11.2) Lead (mg/kg) 57.3 57.3 (GNVC010304 RM 11.2) Mercury (mg/kg) 0.1 0.1 (GNVC010304 RM 11.2) Zinc (mg/kg) 87.6 87.6 (GNVC010304 RM 11.2) TBT (µg/kg) na na Bis(2-ethylhexyl) phthalate (µg/kg) 290 290 (GNVC010304 RM 11.2) Total LPAH (µg/kg) 106.8 JT 106.8 JT (GNVC010304 RM 11.2) Total HPAH (µg/kg) 358.3 JT 358.3 JT (GNVC010304 RM 11.2) Total PCBs (µg/kg) 81.7 T 1180 T (GNVC01 RM 11.3) 2,3,7,8-TCDD (pg/g) na na Total DDx (µg/kg) 0.57 JA 0.57 JA (GNVC010304 RM 11.2) Dibenzofuran (µg/kg) 5.2 J 5.2 J (GNVC010304 RM 11.2) 4-Methylphenol (µg/kg) 14 14 (GNVC010304 RM 11.2) Diesel range hydrocarbons (mg/kg) 340 340 (GNVC010304 RM 11.2) Xylenes (µg/kg) na na
C167-1103. DRAFT REMOVAL ACTION AREA CHARACTERIZATION REPORT ARKEMA EARLY ACTION. (PREPARED BY INTEGRAL CONSULTING AND ARCADIS, DECEMBER 24, 2010).
The primary purpose of this investigation was to fill data gaps to refine the preliminary boundary of the removal action area, especially at depth. Sediment sampling was conducted between RM 7.0 and 7.4 from August 18 to October 1, 2009.
Thirty-six boreholes were sampled with a roto-sonic drill rig. One borehole was sampled at 5-ft intervals and all remaining boreholes were sampled at 2-ft intervals. The top 5–10 ft of 13 of the boreholes were sampled with a vibracore sampler to avoid collecting samples from an uncased borehole. Most samples were analyzed for TOC and DDx. A subset of samples were analyzed for SVOCs, PCBs, VOCs, pesticides, and PCDD/Fs. Additional samples were collected for geotechnical analyses.

Portland Harbor RI/FS Final Remedial Investigation Report
February 8, 2016
A1-76
Summary of Core Samples Parameter Minimum Maximum (Location) Arsenic (mg/kg) na na Cadmium (mg/kg) na na Copper (mg/kg) na na Lead (mg/kg) na na Mercury (mg/kg) na na Zinc (mg/kg) na na TBT (µg/kg) 13 U 20 U (WB-34 RM 7.3) Bis(2-ethylhexyl) phthalate (µg/kg) 29 U 320 J (WB-35 RM 7.3) Total LPAH (µg/kg) 2.5 UT 5970 JT (WB-42 RM 7.2) Total HPAH (µg/kg) 2.7 UT 11400 T (WB-39 RM 7.3) Total PCBs (µg/kg) 1.2 UJT 1800 UT (WB-35 RM 7.3) 2,3,7,8-TCDD (pg/g) 0.0124 U 8.5 U (WB-36 RM 7.3) Total DDx (µg/kg) 0.087 JT 1800000 JT (WB-36 RM 7.3) Dibenzofuran (µg/kg) 0.53 U 320 U (WB-34 RM 7.3) 4-Methylphenol (µg/kg) 200 UJ 320 U (WB-34 RM 7.3) Diesel range hydrocarbons (mg/kg) na na Xylenes (µg/kg) 2.32 JT 3100 UT (WB-35 RM 7.3)
WLCGSG04. DRAFT REMOVAL ACTION COMPLETION REPORT, NW NATURAL “GASCO” SITE PORTLAND, OR (PREPARED BY ANCHOR ENVIRONMENTAL L.L.C., JANUARY 2006).
This investigation consisted of the collection of surface sediment samples in order to characterize the post-dredge surface sediment at the “Gasco” Site in Portland, OR (RM 6.5). Anchor Environmental LLC collected the sediment samples on October 19, 2005, immediately following the completion of sediment removal and prior to cap placement.
Surface sediment samples were collected from 15 locations (RAA-PD01-05019 through RAA-PD01-05033) within the pilot cap and fringe cover areas. A rinsate blank and homogenization duplicate were collected and analyzed for the same analytes as the 15 sample locations. All sediment samples were analyzed for total organic carbon (TOC); total solids; grain size; benzene, toluene, ethylbenzene, and xylenes (BTEX); polycyclic aromatic hydrocarbons (PAHs); semivolatile organic compounds (SVOCs); total petroleum hydrocarbons (TPH); cyanide; and total metals.
Summary Data for Surface Samples. Parameter Minimum Maximum (Location) Arsenic (mg/kg) 1.7 3.2 (RAA-17 RM 6.24) Cadmium (mg/kg) na na Copper (mg/kg) 14.1 28.6 (RAA-12 RM 6.25) Lead (mg/kg) 3.47 26.1 (RAA-02 RM 6.33)

Portland Harbor RI/FS Final Remedial Investigation Report
February 8, 2016
A1-77
Mercury (mg/kg) na na Zinc (mg/kg) 41.5 79.9 (RAA-14 RM 6.29) TBT (µg/L) na na bis(2-ethylhexyl)phthalate (µg/kg) 8.3 J 100,000 U (RAA-02 RM 6.33 ) Total LPAH (µg/kg) 482.4 TA 12,230,000 TA (RAA-14 RM 6.29) Total HPAH (µg/kg) 239.6 TA 6,583,000 TA (RAA-14 RM 6.29) Total PCBs (µg/kg) na na 2,3,7,8,-TCDD (ng/kg) na na Total DDT (µg/kg) na na Dibenzofuran (µg/kg) 1.3 J 81,000 (RAA-14 RM 6.29) 4-Methylphenol (µg/kg) 10 U 5,000 U (RAA-02 RM 6.33) Diesel range hydrocarbons (mg/kg) 17 J 51,000 (RAA-14 RM 6.29) Xylenes (µg/kg) 1 32,000 (RAA-14 RM 6.29)
WLCEMH04. TECHNICAL MEMORANDUM EXXONMOBIL BEACH SEDIMENT SHEEN SAMPLE, PORTLAND, OR (PREPARED BY KLEINFELDER, SEPTEMBER 2004).
This investigation consisted of surface sediment sampling during two separate investigations of an oily sheen at the Shore Terminal (ST) Services Portland Terminal (former ExxonMobil Portland Terminal). During a routine site inspection by ExxonMobil personnel in the fall of 2003, the appearance of sheen was noted on the beach in front of the facility. Again, on August 13, 2004, DEQ personnel observed sheen in two areas: one in a boomed area where ST has a stormwater discharge pipe and the other along the riverbank within pooled water and sands.
On October 6, 2003, Kleinfelder collected two composite samples (COMP1-100603 and COMP2-100603) of the beach material. The two sediment samples were analyzed for gasoline-, diesel-, and heavy-oil-range hydrocarbons. On August 13, 2004, Kleinfelder personnel collected two additional composite sediment samples (COMP-1-081304 and COMP-2-081304). The two sediment samples were analyzed for gasoline-, diesel-, and heavy-oil-range hydrocarbons.
Summary Data for Surface Samples. Parameter Minimum Maximum (Location) Arsenic (mg/kg) na na Cadmium (mg/kg) na na Copper (mg/kg) na na Lead (mg/kg) na na Mercury (mg/kg) na na Zinc (mg/kg) na na TBT (µg/L) na na bis(2-ethylhexyl)phthalate (µg/kg) na na Total LPAH (µg/kg) na na Total HPAH (µg/kg) na na Total PCBs (µg/kg) na na

Portland Harbor RI/FS Final Remedial Investigation Report
February 8, 2016
A1-78
Parameter Minimum Maximum (Location) 2,3,7,8,-TCDD (ng/kg) na na Total DDT (µg/kg) na na Dibenzofuran (µg/kg) na na 4-Methylphenol (µg/kg) na na Diesel range hydrocarbons (mg/kg) 50 U 50 U (COMP2-081304 RM 5.16) Xylenes (µg/kg) na na
WLCT4C04. TERMINAL 4 EARLY ACTION EE/CA REPORT PUBLIC REVIEW DRAFT, APPENDIX E─SUMMARY OF SEDIMENT QUALITY CHARACTERISTICS, PORT OF PORTLAND, PORTLAND, OR (PREPARED BY BLASLAND, BOUCK & LEE, INC., MAY 2005).
Appendix E in the Terminal 4 EE/CA report presents an evaluation of the sediment data and sediment lithology, surface, under-pier, and subsurface sediment distributions of chemicals of potential concern; and a comparison of sediment data to sediment quality guidelines. The report defines surface sediment as sediment samples collected from 0 to 1 ft below mudline, and subsurface sediment collected 1 ft below the mudline. The Removal Action Area was separated into sub-areas in order to facilitate discussion on the sediment data. The subareas are Berth 401, Slip 1; Wheeler Bay, Slip 3; and North of Berth 414.
Historical sediment data presented in the Terminal 4 Early Action EE/CA work plan were compared to EE/CA sediment data collected as part of the Terminal 4 Early Action EE/CA. All of the historical data were acquired from the National Oceanic and Atmospheric Administration Query Manager 2.51 database for Terminal 4 of the Willamette River. The data comparison included the following compounds: metals, total PAHs, phthalates, ∑ DDTs, Total PCBs, TPH as diesel-range hydrocarbons (DRH), TPH as heavy-oil-range hydrocarbons, and TPH as gasoline-range hydrocarbons. Data were compared to determine whether similar compounds were detected in historical and EE/CA data, whether compounds were detected in similar locations in historical and EE/CA data, and whether the range of concentrations was similar between historical and EE/CA data.
Summary Data for Surface Samples. Parameter Minimum Maximum (Location) Arsenic (mg/kg) 1.2 15.1 (T4-VC24 RM 4.63) Cadmium (mg/kg) 0.09 10.1 (T4-UP13 RM 4.42) Copper (mg/kg) 9.3 J 72.4 J (T4-VC24 RM 4.47) Lead (mg/kg) 2.64 1,950 (T4-UP07 RM 4.47) Mercury (mg/kg) 0.009 B 0.163 (T4-STS3E RM 4.58) Zinc (mg/kg) 38.6 J 2,050 J (T4-UP13 RM 4.42) TBT (µg/L) na na bis(2-ethylhexyl)phthalate (µg/kg) 20 U 1,700 (T4-STS1 RM 4.46) Total LPAH (µg/kg) 1.35 TA 117,953 TA (T4-VC24 RM 4.48 ) Total HPAH (µg/kg) 16.42 TA 555,400 TA (T4-VC24 RM 4.48)

Portland Harbor RI/FS Final Remedial Investigation Report
February 8, 2016
A1-79
Parameter Minimum Maximum (Location) Total PCBs (µg/kg) 2.9 JA 820 A (T4-VC13 RM 4.69) 2,3,7,8,-TCDD (ng/kg) na na Total DDT (µg/kg) 0.26 TA 65 TA (T4-VC13 RM 4.69) Dibenzofuran (µg/kg) na na 4-Methylphenol (µg/kg) na na Diesel range hydrocarbons (mg/kg) 9.1 J 360 J (T4-UP13 RM 4.74) Xylenes (µg/kg) na na
Summary Data for Subsurface Samples.
Parameter Minimum Maximum (Location) Arsenic (mg/kg) 0.9 23.3 (T4-VC32 RM 4.64) Cadmium (mg/kg) 0.037 B 3.4 (T4-VC15 RM 4.65) Copper (mg/kg) 9.42 J 98.5 J (T4-PS21 RM 4.64) Lead (mg/kg) 1.95 3,130 J (T4-PS21 RM 4.63) Mercury (mg/kg) 0.008 B 2.15 (T4-VC22 RM 4.65) Zinc (mg/kg) 27.3 J 654 J (T4-VC15 RM 4.65) TBT (µg/L) na na bis(2-ethylhexyl)phthalate (µg/kg) 9.8 U 3,000 (T4-VC20) Total LPAH (µg/kg) 0.22 TA 11,834 TA (T4-VC19) Total HPAH (µg/kg) 0.15 TA 106,600 TA (T4-VC19) Total PCBs (µg/kg) 3.3 JA 1,000 A (T4VC29 RM 4.38) 2,3,7,8,-TCDD (ng/kg) na na Total DDT (µg/kg) 0.07 TA 158.1 TA (T4-VC29 RM 4.38) Dibenzofuran (µg/kg) na na 4-Methylphenol (µg/kg) na na Diesel range hydrocarbons (mg/kg) 9.6 J 620 J (T4-VC31 RM 4.65) Xylenes (µg/kg) na na
WLCZDH04. SUPPLEMENTAL REMEDIAL INVESTIGATION REPORT: RIVERBANK CHARACTERIZATION, ZIDELL WATERFRONT PROPERTY (PREPARED BY MAUL FOSTER & ALONGI, INC., 2004).
Maul Foster & Alongi (MFA) performed a supplemental remedial investigation of the 3,000-lineal-foot riverbank along the Zidel waterfront property, located on the west bank of the Willamette River (RM 13.5). One of the purposes of the assessment was to characterize the nature and extent of chemicals in riverbank soils. Fifty surface sediment samples (0–15 cm) were collected in 28 transects along the bank. Samples were analyzed for metals, PAHs, PCBs, organotins, and asbestos.
In most bank samples, at least one site-related chemical was detected above a risk-based screening value. At lease one metal was detected above a potential hot spot level in approximately one-third of the riverbank samples. Based on these findings remedial alternatives

Portland Harbor RI/FS Final Remedial Investigation Report
February 8, 2016
A1-80
will be developed to stabilize the bank above approximately 13 feet COP to prevent unacceptable ecological and human health risks.
Minimum and maximum results are provided in the table below:
Summary Data for Riverbank Surface Samples. Parameter Minimum Maximum (Location) Arsenic (mg/kg) 1.29 78 J (R47 RM 13.8) Cadmium (mg/kg) 0.203 J 132 J (R12 RM 13.6) Copper (mg/kg) 20.2 J 2150 J (R38 RM 14) Lead (mg/kg) 36.5 J 20800 J (R12 RM 13.6) Mercury (mg/kg) 0.0627 J 20.2 J (R50 RM 13.7) Zinc (mg/kg) 149 J 6480 J (R50 RM 13.7) TBT (µg/kg) na na bis(2-ethylhexyl)phthalate (µg/kg) na na Total LPAH (µg/kg) 18 A 3600 A (R20 RM 13.7) Total HPAH (µg/kg) 170 T 28000 T (R20 RM 13.7) Total PCBs (µg/kg) 23.8 T 19700 T (R50 RM 13.7) 2,3,7,8,-TCDD (ng/kg) na na Total DDT (µg/kg) na na Dibenzofuran (µg/kg) na na 4-Methylphenol (µg/kg) na na Diesel range hydrocarbons (mg/kg) na na
WLCGWI04. SURFACE SEDIMENT VERIFICATION SAMPLING GLACIER NORTHWEST PORTLAND CEMENT TERMINAL , PORTLAND, OR. (PREPARED BY ANCHOR ENVIRONMENTAL LLC, NOVEMBER 2004).
This investigation was conducted in order to characterize the quality of sediments along the newly exposed surface after maintenance dredging was conducted in August 2004. Three surface sediment samples were collected on September 21 and one was collected on September 24, 2004. Sediment samples were collected from the top 10 cm using a van Veen grab sampler. The four samples were analyzed for total solids, TOC, and PCBs.
Summary Data for Surface Samples Parameter Minimum Maximum (Location) Arsenic (mg/kg) na na Cadmium (mg/kg) na na Copper (mg/kg) na na Lead (mg/kg) na na Mercury (mg/kg) na na Zinc (mg/kg) na na TBT (µg/L) na na bis(2-ethylhexyl)phthalate (µg/kg) na na Total LPAH (µg/kg) na na

Portland Harbor RI/FS Final Remedial Investigation Report
February 8, 2016
A1-81
Parameter Minimum Maximum (Location) Total HPAH (µg/kg) na na Total PCBs (µg/kg) 240 4100 (GN-VV-01 RM 11.43) 2,3,7,8,-TCDD (ng/kg) na na Total DDx (µg/kg) na na Dibenzofuran (µg/kg) na na 4-Methylphenol (µg/kg) na na Diesel range hydrocarbons (mg/kg) na na Xylenes (µg/kg) na na
WLCRPI04. OUTFALL 22B: REMAINING REMEDIAL INVESTIGATION TECHNICAL MEMORANDUM RPAC – PORTLAND SITE (PREPARED BY AMEC EARTH & ENVIRONMENTAL, INC., FEBRUARY 4, 2003). REMAINING REMEDIAL INVESTIGATION TECHNICAL MEMORANDUM ADDENDUM NORTH DOANE LAKE INVESTIGATION RP – PORTLAND SITE (PREPARED BY AMEC EARTH & ENVIRONMENTAL, INC., JULY 9, 2004). DRAFT OUTFALL 22B STORM SEWER SAMPLING REPORT RP - PORTLAND SITE (PREPARED BY AMEC EARTH AND ENVIRONMENTAL, INC., MARCH 24, 2005).
AMEC Earth and Environmental, Inc. (AMEC) collected and analyzed samples of outfall discharge water at City of Portland Outfall 22B as part of ongoing RI and monitoring studies on behalf of Rhone-Poulenc Agro Chemicals (RPAC)/Starlink Logistics Inc. (SLLI) and under the direction of DEQ. Discharge water was sampled during non-stormwater events using a peristaltic pump with the sampling inlet located at a point in the middle of the exiting stream of water. Sample bottles were filled directly with no composite sampling. Laboratory analyses for all samples included pesticides, herbicides, dioxins and furans, VOCs, SVOCs, metals (including mercury), TSS, pH, anions, alkalinity, and hardness.
A total of five water samples (included in the summary data below) were collected during the following studies: Outfall 22B Storm Sewer Sampling, Sept. 3, 2004 (WLCRPI04OF22B040923); Remaining Remedial Investigation, Aug. 13, 2002 (WLCRPI04OF22B020813); and three other samples for which direct documentation is not available, collected on July 18, 1995, April 18, 1994, and October 1, 1993. These samples are mentioned in the Draft Outfall 22B Storm Sewer Sampling Report (AMEC 2003), but no detailed field sampling procedures were given. This outfall is due to be monitored annually by AMEC according to the Post-Characterization Groundwater Monitoring Plan (PCGMP, AMEC 2004).

Portland Harbor RI/FS Final Remedial Investigation Report
February 8, 2016
A1-82
Summary Data for Water. Parameter Minimum Maximum (Location) Arsenic (dissolved) mg/l 0.00549 0.00549 (OF22B RM 6.9) Arsenic (total) mg/L 0.00576 J 0.0081 J (OF22B RM 6.9) Cadmium (dissolved) mg/L 0.000138 U 0.0000138 U (OF22B RM 6.9) Cadmium (total) mg/L 0.000122 0.0000138 U (OF22B RM 6.9) Copper (dissolved) mg/L 0.000788 U 0.000788 U (OF22B RM 6.9) Copper (total) mg/L 0.00207 0.0116 (OF22B RM 6.9) Lead (dissolved) mg/L 0.000224 U 0.000224 U (OF22B RM 6.9) Lead (total) mg/L 0.00064 0.014 (OF22B RM 6.9) Mercury (dissolved) mg/L 1.07E-06 U 1.07E-06 U (OF22B RM 6.9) Mercury (total) mg/L 6.32E-06 0.000131 U (OF22B RM 6.9) Zinc (dissolved) mg/L 0.00234 0.00234 (OF22B RM 6.9) Zinc (total) mg/L 0.00682 J 0.0249 (OF22B RM 6.9) TBT (µg/kg) na na bis (2-ethylhexyl)phthalate (µg/L) 0.644 U 10 U (OF22B RM 6.9) LPAH (µg/L) 0.4 T 0.859 JT (OF22B RM 6.9) HPAH (µg/L) 0.15 UT 0.229 T (OF22B RM 6.9) Total PCBs (µg/kg) 0.5 UT 0.5 UT (OF22B RM 6.9) 2,3,7,8-TCDD (pg/L) 3.1 U 5.3 U (OF22B RM 6.9) Total DDT (µg/kg) na na Dibenzonfuran (µg/L) 0.139 U 3 U (OF22B RM 6.9) 4-Methylphenol (µg/kg) na na Diesel range hydrocarbons (mg/L) 0.63 U 0.63 U (OF22B RM 6.9) Xylenes (µg/L) 0.295 UT 1 UT (OF22B RM 6.9)
WLCDRD05. VOL. 1 DREDGE MATERIAL MANAGEMENT PLAN SEDIMENT CHARACTERIZATION REPORT, LOWER WILLAMETTE RIVER FEDERAL NAVIGATION CHANNEL (PREPARED BY TETRA TECH EC INC., JANUARY 2006).
Tetra Tech conducted this investigation for the USACE in order to characterize the Lower Willamette River Federal Navigational Channel (FNC) sediments from RM 0 to RM 11.6 that are planned for future dredging operations and that were not been previously characterized. This sediment characterization report will support the development of an integrated Dredged Material Management Plan (DMMP) and National Environmental Policy Act (NEPA) document for maintenance of the currently maintained FNC for the next 20 years. The chemical, physical, and biological data presented in this sediment characterization report will be used to evaluate sediment quality in sediment above the channel operating depths for determining appropriate disposal options when dredging becomes possible.
Tetra Tech personnel collected a total of 154 sediment samples, which included 72 sediment core samples, 79 grab samples, and 3 reference grab samples, from April 28 through May 27, 2005. The 72 subsurface sediment sample locations were chosen based on areas subject to future dredging, and the 79 surface sediment locations were located adjacent to core locations to

Portland Harbor RI/FS Final Remedial Investigation Report
February 8, 2016
A1-83
characterize potential “sloughing material” during dredging. The surface sediment samples were collected using an air-powered 0.2-m2 van Veen grab sampler, capable of penetrating surface sediment down to 30 cm. The subsurface sediment samples were collected with a custom-built vibracorer. Each individual core was composited in its entirety up to the proposed dredge depth. A sample from the first 2 ft below the maximum dredging depth (-42 to-44 ft CRD[Columbia River datum]) from each individual core was composited and archived. Because Tier III bioassay testing is required when sediment chemistry results exceed dredged material evaluation framework (DMEF) screening levels (SLs), a minimum of 4 L of sediment from each core location was collected in case it became necessary to conduct biological testing. The subsurface sediment cores were penetrated to -44 ft CRD. This enabled the samplers to take samples to the maintenance depth of –40 ft CRD, including the 2-ft advanced maintenance and a sample from the first 2 ft below the dredging maximum depth. The -42 to -44 ft CRD samples from each individual core were archived for possible future analysis.
All subsurface, surface, and reference sediment samples were analyzed for conventional parameters (ammonia as nitrogen, total sulfide, and TOC), metals, butyltins, TPH, SVOCs, PAHs, phenols, selected chlorinated hydrocarbons, miscellaneous compounds, phthalates, pesticides, and PCBs. At selected locations, samples were anaylzed for chlorinated herbicides (10 locations including the 3 reference locations), dioxin/furans (13 locations and the 3 reference locations), butyltins in dry weight (11 locations including the 3 reference locations), and VOCs (21 locations including the 3 reference locations).
Summary Data for Subsurface Samples. Parameter Minimum Maximum (Location) Arsenic (mg/kg) 2.04 12.6 (WR-VC-110 RM 10.4) Cadmium (mg/kg) 0.126 1.23 (WR-VC-116 RM 10.7) Copper (mg/kg) 16.2 523 J (WR-VC-110 RM 10.4) Lead (mg/kg) 8.33 348 (WR-VC-110 RM 10.4) Mercury (mg/kg) 0.025 J 0.698 (WR-VC-110 RM 10.4) Zinc (mg/kg) 47 J 342 J (WR-VC-110 RM 10.4) TBT (µg/L) 0.00098 U 1.2 (WR-VC-62 RM 10.4) bis(2-ethylhexyl)phthalate (µg/kg) 14 J 18,000 (WR-VC-110 RM 10.4) Total LPAH (µg/kg) 9.5 TA 498,000 TA (WR-VC-50 RM 6.32) Total HPAH (µg/kg) 105 TA 405,000 TA (WR-VC-50 RM 6.32) Total PCBs (µg/kg) 8.8 TA 2,400 TA(WR-VC-108 RM 10.3) 2,3,7,8,-TCDD (ng/kg) na na Total DDT (µg/kg) 1.26 T 1,230 T (WR-VC-28 RM 4.81) Dibenzofuran (µg/kg) 0.38 J 12,000 (WR-VC-50 RM 6.3) 4-Methylphenol (µg/kg) 4.1 U 150 (WR-VC-118 RM 10.8) Diesel range hydrocarbons (mg/kg) 20 J 6,000 J (WR-VC-50 RM 6.32) Xylenes (µg/kg) na na

Portland Harbor RI/FS Final Remedial Investigation Report
February 8, 2016
A1-84
Summary Data for Surface Samples. Parameter Minimum Maximum (Location) Arsenic (mg/kg) 1.54 6.79 (WR-PG-42 RM 5.5) Cadmium (mg/kg) 0.09 U 0.5 (WR-PG-23 RM 5.58) Copper (mg/kg) 6.19 J 138 J (WR-PG-27 RM 5.79) Lead (mg/kg) 2.75 72 J (WR-PG-104 RM 9 .6) Mercury (mg/kg) 0.008 J 4.84 (WR-PG-27 RM 5.79) Zinc (mg/kg) 33 J 220 J (WR-PG-25 RM 5.58) TBT (µg/kg) 0.087 U 350 (WR-PG-23 RM 5.58) TBT (µg/L) 0.0006 U 0.26 (WR-PG-52 RM 6.39) bis(2-ethylhexyl)phthalate (µg/kg) 11 U 3,200 (WR-PG-52 RM 6.39) Total LPAH (µg/kg) 1 TA 36,900 TA (WR-PG-50 RM 6.33) Total HPAH (µg/kg) 17 TA 84,300 TA(WR-PG-42 RM 5.5) Total PCBs (µg/kg) 1.7 UTA 330 UTA (WR-PG-68 RM 7.19) 2,3,7,8,-TCDD (ng/kg) 0.047 U 1.68 (WR-PG-60 RM 6.79) Total DDT (µg/kg) 0.52 TA 1,050 TA (WR-PG-68 RM 7.19) Dibenzofuran (µg/kg) 0.22 U 450 (WR-PG-24 RM 4.63) 4-Methylphenol (µg/kg) 3.7 U 370 (WR-PG-120 RM 10.9) Diesel range hydrocarbons (mg/kg) 4.3 U 840 J (WR-PG-52 RM 6.39) Xylenes (µg/kg) 0.21 UT 4 T (WR-PG-50 RM 6.3)
WLCACF05. SEDIMENT DATA REPORT ASH GROVE CEMENT COMPANY WILLAMETTE RIVER PORTLAND, OREGON (PREPARED BY PARSON BRINCKERHOFF, SEPTEMBER 19, 2005).
This sediment investigation was conducted to characterize sediments at the Ash Grove Cement dock and barge berths prior to proposed maintenance dredging. Three locations at RM 2.8 were sampled on June 1, 2005.
Cores were collected with a vibracorer using aluminum tubes and a stainless steel core catcher and were driven to depths of 10 to 12 ft; recoveries ranged from 70% to 80%. Two of the cores were from within the dredging prism and the third was located outside of the prism. Sediments from the two cores within the prism were divided in order to represent the dredging prism and the new surface material. Two composite samples were created, one from all 3 cores representing the post-dredge surface, and one from the two cores within the dredge prism representing the material to be dredged. These samples were submitted for the following analyses: TOC, grain size, metals, pesticides, PCBs, chlorinated hydrocarbons, phenols, phthalates, and PAHs.
Summary for Core Samples Parameter Minimum Maximum (Location) Arsenic (mg/kg) 3.88 4.81 (C123 RM 2.8) Cadmium (mg/kg) 0.382 0.535 (C13 RM 2.8) Copper (mg/kg) 19.8 29 (C13 RM 2.8)

Portland Harbor RI/FS Final Remedial Investigation Report
February 8, 2016
A1-85
Parameter Minimum Maximum (Location) Lead (mg/kg) 14 27.7 (C13 RM 2.8) Mercury (mg/kg) 0.064 0.103 (C13 RM 2.8) Zinc (mg/kg) 68.3 114 (C13 RM 2.8) TBT (µg/kg) na na Bis(2-ethylhexyl) phthalate (µg/kg) 21 J 46 J (C13 RM 2.8) Total LPAH (µg/kg) 132.7 JT 1117 JT (C13 RM 2.8) Total HPAH (µg/kg) 542.2 T 17350 T (C13 RM 2.8) Total PCBs (µg/kg) 54 T 224 T (C13 RM 2.8) 2,3,7,8-TCDD (pg/g) na na Total DDx (µg/kg) 5.7 A 11.6 A (C13 RM 2.8) Dibenzofuran (µg/kg) 4 J 22 U (C13 RM 2.8) 4-Methylphenol (µg/kg) 4.3 U 49 U (C13 RM 2.8) Diesel range hydrocarbons (mg/kg) na na Xylenes (µg/kg) na na
WLCBPE06. BP BULK TERMINAL 22T SUPPLEMENTAL SEDIMENT AND REVETMENT INVESTIGATION PORTLAND, OR (PREPARED BY URS, MARCH 2007).
This investigation consisted of the collection of subsurface soil samples beneath a sloping revetment walls and, in addition, surface and subsurface sediment samples along the bank of the Willamette River. The location of the investigation was at the British Petroleum Terminal 22T facility, located along the Willamette River in Portland, OR.
URS personnel collected surface and subsurface sediment samples from May through June 2007. Thirty-four surface sediment samples were collected using a mini van-Veen grab sampler. A geoprobe subsurface sediment sampler was used at 23 stations. At the surface sediment stations which could not be sampled by the van-Veen, the geoprobe was used. A total of 14 surface samples were collected with the geoprobe. Shallow subsurface samples (2–4 ft bss) were collected at 19 stations. In addition, 14 borings were collected along five transects in order to characterize sediments as deep as 15 ft bss.
All surface and subsurface sediment samples were analyzed for conventional parameters (grain size, moisture content, TS, TOC, Atterburg limits, and specific gravity).
Summary Data for Surface Samples. Parameter Minimum Maximum (Location) Arsenic (mg/kg) 4.4 J 29.7 (SGP-21 RM 4.9) Cadmium (mg/kg) 0.511 U 1.31 U (SS-48 RM 4.8) Copper (mg/kg) 31.8 J 446 (SGP-21 RM 4.9) Lead (mg/kg) 11.2 T 88.3 (SGP-07 RM 4.8) Mercury (mg/kg) 0.00189 U 0.222 U (SS-40 RM 4.9) Zinc (mg/kg) 78.2 240 (SGP-03 RM 4.8)

Portland Harbor RI/FS Final Remedial Investigation Report
February 8, 2016
A1-86
Parameter Minimum Maximum (Location) TBT (µg/L) na na bis(2-ethylhexyl)phthalate (µg/kg) na na Total LPAH (µg/kg) 8.87 UA 11100 A (SS-41 RM 4.9) Total HPAH (µg/kg) 9.75 T 42200 T (SS-39 RM 4.9) Total PCBs (µg/kg) na na 2,3,7,8,-TCDD (ng/kg) na na Total DDT (µg/kg) na na Dibenzofuran (µg/kg) na na 4-Methylphenol (µg/kg) na na Diesel range hydrocarbons (mg/kg) 35.1 357 (SS-41 RM 4.9) Xylenes (µg/kg) 182 UJT 646 UT (SS-23 RM 4.8)
Summary Data for Subsurface Samples. Parameter Minimum Maximum (Location) Arsenic (mg/kg) 2.78 19.5 (SGP-02 RM 4.8) Cadmium (mg/kg) 0.595 U 0.931 U (SGP-02 RM 4.8) Copper (mg/kg) 25.4 769 (SGP-07 RM 4.8) Lead (mg/kg) 12.7 294 (SGP-01 RM 4.8) Mercury (mg/kg) 0.0709 U 0.183 (SGP-03 RM 4.8) Zinc (mg/kg) 71.5 754 (REV-02 RM 4.8) TBT (µg/L) na na bis(2-ethylhexyl)phthalate (µg/kg) na na Total LPAH (µg/kg) 4.51 UA 16200 JA (SGP-16 RM 4.8) Total HPAH (µg/kg) 13.7 T 42600 JT (SGP-16 RM 4.8) Total PCBs (µg/kg) 54.7 JT 85.8 UT (SGP-19 RM 4.9) 2,3,7,8,-TCDD (ng/kg) na na Total DDT (µg/kg) 42.9 UA 50.5 UA (SGP-01 RM 4.8) Dibenzofuran (µg/kg) na na 4-Methylphenol (µg/kg) na na Diesel range hydrocarbons (mg/kg) 1900 2940 J (REV-02 RM 4.8) Xylenes (µg/kg) 168 UT 2000 UJT (REV-02 RM 4.8)
WLCGSJ06. PHASE I REPORT AND PHASE 2 FIELD SAMPLING APPROACH. GASCO SILTRONIC GROUNDWATER SOURCE EVALUATION PORTLAND, OR (PREPARED BY ANCHOR ENVIRONMENTAL L.L.C., MAY 2007).
The first component of this study (Phase I) consisted of subsurface sediment sampling to further evaluate the nature and extent of contamination in Willamette River sediments. The second component of this investigation was conducted along the shoreline of the NW Natural Gasco and Siltronic properties in order to define the general nature of the subsurface geotechnical conditions along the shoreline to inform feasibility of all potential source control alternatives, including a potential vertical barrier.

Portland Harbor RI/FS Final Remedial Investigation Report
February 8, 2016
A1-87
Anchor Environmental personnel collected thirteen borings, GS-00 to GS-12, in two phases. All water work was limited to specific windows in order to avoid harming fish. Borings GS-00, -5, -7, -8, and -9 were completed in November 2006. The remaining borings were completed in January 2007. They used a Rotosonic drill rig with all borings, except two with the drill mounted on the barge.
All sediment samples were analyzed for; PAHs, VOCs, Total cyanide, metals, TOC, TS, sulfide, ammonia nitrogen and physical properties including; pH, sulfate, TOC, atterberg limits, moisture content, grain size and specific gravity.
Summary Data for Subsurface Samples. Parameter Minimum Maximum (Location) Arsenic (mg/kg) 0.7 2.98 (GS-08 RM 6.3) Cadmium (mg/kg) 0.05 0.15 (GS-06 RM 6.2) Copper (mg/kg) 13.6 27.7 J (GS-04 RM 6.2, GS-06 RM 6.2) Lead (mg/kg) 2.67 12.6 (GS-08 RM 6.3) Mercury (mg/kg) 0.013 0.087 (GS-04 RM 6.2) Zinc (mg/kg) 44.3 74 (GS-04 RM 6.2) TBT (µg/L) na na bis(2-ethylhexyl)phthalate (µg/kg) 330 U 340 U (GS-04 RM 6.2) Total LPAH (µg/kg) 0.23 JT 7700000 T (GS-07 RM 6.3) Total HPAH (µg/kg) 0.56 JT 3700000 T (GS-07 RM 6.3) Total PCBs (µg/kg) na na 2,3,7,8,-TCDD (ng/kg) na na Total DDT (µg/kg) na na Dibenzofuran (µg/kg) 0.24 J 64000 (GS-07 RM 6.3) 4-Methylphenol (µg/kg) 330 U 340 U (GS-04 RM 6.2) Diesel range hydrocarbons (mg/kg) na na Xylenes (µg/kg) 0.33 JT 25000 T (GS-07 RM 6.3)
WLCT4G06. DATA REPORT: SEDIMENT CHARARACTERIZATION RESULTS FOR TERMINAL 4 PHASE I REMOVAL ACTION, PRECONSTRUCTION SAMPLING, PORT OF PORTLAND (APPENDIX G) (PREPARED BY ANCHOR ENVIRONMENTAL LLC, 2008).
As part of Terminal 4’s Early Action cleanup under the AOC for the Portland Harbor Superfund Site, sediment samples were collected within Terminal 4 to help determine the type of removal action alternative needed at the site. Based on the results of the sediment sampling, USEPA selected a removal action that includes dredging of most of Slip 3 and disposing of the dredging material in a confined disposal facility in Slip 1. This report documents the results of preconstruction sampling in July 2006, sheetpile wall sampling in January 2007, and Berth 411 “Plus” and Berth 410 sampling in December 2007.

Portland Harbor RI/FS Final Remedial Investigation Report
February 8, 2016
A1-88
A total of 76 surface sediment samples (surface up to 30 cm) and 68 subsurface samples (subsurface up to 305 cm) were collected within Slip 3 and the berths listed above. Samples were analyzed for the following chemicals and conventionals: seleted metals, SVOCs, PCBs, DDx, TPH, total organic carbon, and total solids. Results are provided in the tables below:
Summary Data for Surface Samples. Parameter Minimum Maximum (Location) Arsenic (mg/kg) 7 14 (T4-B411-06 RM 4.6) Cadmium (mg/kg) 0.029 U 5 J (T4-PI-03-2 RM 4.6) Copper (mg/kg) 29.7 J 116 (T4-B411-06 RM 4.6) Lead (mg/kg) 15 645 J (T4-B411-06 RM 4.6) Mercury (mg/kg) 0.002 U 0.12 (T4-B411-06 RM 4.6) Zinc (mg/kg) 70 J 887 J (T4-PI-03-2 RM 4.6) TBT (µg/L) na na bis(2-ethylhexyl)phthalate (µg/kg) 12 UJ 490 UJ (T4-PI-04-2 RM 4.6) Total LPAH (µg/kg) 9.3 JT 97000 T (T4-B414-01 RM 4.6) Total HPAH (µg/kg) 100 JT 670000 T (T4-PI-01 RM 4.6) Total PCBs (µg/kg) 1.3 UT 190 T (T4-PI-08 RM 4.6) 2,3,7,8,-TCDD (ng/kg) na na Total DDT (µg/kg) 1.2 UT 69 JT (T4-PI-09 RM 4.6) Dibenzofuran (µg/kg) 70 990 (T4-B411-06 RM 4.6) 4-Methylphenol (µg/kg) 22 U 96 (T4-B411-02 RM 4.6) Diesel range hydrocarbons (mg/kg) 2.6 UJ 2900 J (T4-PI-04 RM 4.6) Xylenes (µg/kg) na na
Summary Data for Subsurface Samples. Parameter Minimum Maximum (Location) Arsenic (mg/kg) 0.9 U 14 (T4-B411-06 RM 4.6) Cadmium (mg/kg) 0.02 U 8.3 J (T4-PI-01 RM 4.6) Copper (mg/kg) 23.3 J 82.8 (T4-B411-06 RM 4.6) Lead (mg/kg) 0.4 UJ 1610 J (T4-PI-01 RM 4.6) Mercury (mg/kg) 0.002 U 0.14 (T4-B411-06 RM 4.6) Zinc (mg/kg) 53.2 1530 J (T4-PI-01 RM 4.6) TBT (µg/L) na na bis(2-ethylhexyl)phthalate (µg/kg) 11 U 1200 U (T4-PI-01 RM 4.6) Total LPAH (µg/kg) 1.2 UT 490000 T (T4-PI-01 RM 4.6) Total HPAH (µg/kg) 1.7 UT 7300000 JT (T4-PI-01 RM 4.6) Total PCBs (µg/kg) 1.3 UT 460 T (T4-PI-08 RM 4.6) 2,3,7,8,-TCDD (ng/kg) na na Total DDT (µg/kg) 1.2 UT 430 JT (T4-PI-09 RM 4.6) Dibenzofuran (µg/kg) 17 U 660 (T4-B411-06 RM 4.6) 4-Methylphenol (µg/kg) 7.2 U 61 (T4-B411-06 RM 4.6)

Portland Harbor RI/FS Final Remedial Investigation Report
February 8, 2016
A1-89
Parameter Minimum Maximum (Location) Diesel range hydrocarbons (mg/kg) 0.5 U 4500 J (T4-PI-04-2 RM 4.6) Xylenes (µg/kg) na na
WLC1200Z. CITY OF PORTLAND BUREAU OF ENVIRONMENTAL SERVICES (BES) TSS DATA (SANDERS, D. 2006. PERSONAL COMMUNICATION [COMPACT DISK OF CITY OF PORTLAND BES WATERSHED PROGRAM DATASET, PORTLAND, OR] PROVIDED TO K. PINE, INTEGRAL CONSULTING INC.).
Total suspended solids (TSS) data under this task code were collected from stormwater outfalls and from Willamette River surface water. Surface water monitoring of the Willamette River was conducted as part of the City of Portland Bureau of Environmental Services (BES) watershed program. From February 1992 through March 2006, 2,520 TSS grab subsamples were collected from RM 1.1 to 20.0. Samples were collected by means of a peristaltic pump at a depth of 10 ft from the surface from the eastern, middle, and western locations along a river transect and composited in one sample container.
Parameter Minimum (Location/Date) Maximum (Location/Date) TSS (mg/L) 0.4 (Morrison St. Bridge 11/17/93)
(Tryon Creek Bridge 12/28/93) (Morrison St. Bridge 10/5/94)
243 (Morrison St. Bridge 11/20/96)
Regular monitoring of the stormwater outfalls is conducted as part of NPDES 1200Z Industrial Stormwater Discharge permits. A total of 778 samples were collected between 5/21/1993 and 11/16/2007; the outfall locations spanned a range from RM 2.1 to RM 10.8. The data were compiled and provided by BES; the samples were collected either by the City or by the permit holders.
Parameter Minimum (Location/Date) Maximum (Location/Date) TSS (mg/L) 0.1 (WR139, RM 8.8, 1/5/98) 243 (WR22, RM 2.3, 11/10/95)
WLFLH07. BLUE HERON PAPER COMPANY SITE INVESTIGATION (PREPARED BY ECOLOGY AND ENVIRONMENT, 2007).
The Blue Heron Paper Company is an active paper manufacturing facility located in the business/industrial area of Oregon City, Oregon on the southwest bank of the Willamette River immediately downstream of the Willamette Falls. Ecology & Environment (E&E) performed the site investigaton to characterize sources of contamination, determine potential for offsite migration of contaminants, determine eligibility for placement of site on the NPL, and document potential threats to public health or the environment posed by the site.
A total of 19 surface sediment samples were collected (0–10 cm bml) in August 2007. Sediment samples were collected from the Willamette River and its tributaries including one background sample. All samples were submitted for laboratory analysis of target analyte list metals, mercury, PCB congeners, PCB Aroclors, SVOCs, VOCs, chlorinated pesticides, and dioxins/furans. A final report has yet to be published for this study. Maximum and minimum concentrations are provided below:

Portland Harbor RI/FS Final Remedial Investigation Report
February 8, 2016
A1-90
Summary Data for Surface Samples. Parameter Minimum Maximum (Location) Arsenic (mg/kg) 1.9 3.7 (WR06SD RM 25.2) Cadmium (mg/kg) 0.042 J 0.077 J (BH01SD RM 26) Copper (mg/kg) 10.5 33.5 (BH04SD RM 26.1) Lead (mg/kg) 4.6 J 31.6 J (BH04SD RM 26.1) Mercury (mg/kg) 0.017 UJ 0.025 J (BH04SD RM 26.1) Zinc (mg/kg) 41.1 67.2 (BH04SD RM 26.1) TBT (µg/kg) na na bis(2-ethylhexyl)phthalate (µg/kg) 13 24 (WR02SD RM 22.6, WR03SD
RM 24.1, WR05SD RM 23.8, WR07SD RM 25.4)
Total LPAH (µg/kg) 8.2 A 19 T (WR01 RM 21.5) Total HPAH (µg/kg) 19 T 79 T (WR06SD RM 25.2) Total PCBs (µg/kg) Aroclor 8.2 UT 9.8 UT (WR01 RM 21.5) Total PCBs (µg/kg) Congener 0.297 T 24.3 T (WR04SD RM 24.4) 2,3,7,8,-TCDD (ng/kg) 0.203 U 0.228 U (WR03SD RM 24.1) Total DDT (µg/kg) 0.82 UT 0.98 UT (WR01 RM 21.5) Dibenzofuran (µg/kg) 2.1 2.5 (WR01 RM 21.5) 4-Methylphenol (µg/kg) 21 25 (WR01 RM 21.5) Diesel range hydrocarbons (mg/kg) na na
WLCGSG07. OFFSHORE INVESTIGATION REPORT NW NATURAL “GASCO” SITE, PORTLAND, OR (PREPARED BY ANCHOR ENVIRONMENTAL L.L.C., FEBRUARY 2008)
This investigation (Phase II) was focused on defining the nature and extent of groundwater contamination beyond the shoreline, in the possible groundwater discharge zone, as identified by the LWG. The investigation was conducted in two steps; the first step was to identify the primary offshore zones of groundwater discharge in the navigation channel, by collecting groundwater samples. The second step of the phase II investigation included sampling of eight locations which were selected by NW Natural and DEQ to be generally representative of subsurface conditions offshore of the site.
Anchor Environmental personnel collected sediment at eight locations down to approximately 15 feet below mudline. Initially a push probe drill mounted aboard a barge was utilized to collect sediment cores. However, due to poor recovery a piston-core sampler was built to sample sediment from 0 to 10 feet below mudline and the push probe sampler was used to obtain samples in the 13 to 15-foot interval.
Upon opening the sediment cores, sediment samples were screened for the presence of NAPL using visual inspection and ultraviolet light. Sediment samples were collected at depths of 0 to 2 feet, 5 to 7 feet and 13 to 15 feet below mudline. Samples were analyzed for conventional

Portland Harbor RI/FS Final Remedial Investigation Report
February 8, 2016
A1-91
parameters (ammonia, sulfide, total cyanide, TOC, TS and grain size), TPH, metals, SVOCs and VOCs.
Summary Data for Subsurface Samples. Parameter Minimum Maximum (Location) Arsenic (mg/kg) 1.3 4 (GS-B2 RM 6.1) Cadmium (mg/kg) 0.041 0.436 (GS-B2 RM 6.1) Copper (mg/kg) 11.8 41.3 (GS-B2 RM 6.1) Lead (mg/kg) 2.2 34.8 (GS-B2 RM 6.1) Mercury (mg/kg) 0.004 J 0.329 (GS-B2 RM 6.1) Zinc (mg/kg) 38.8 209 (GS-B2 RM 6.1) TBT (µg/L) na na bis(2-ethylhexyl)phthalate (µg/kg) na na Total LPAH (µg/kg) 2.6 JT 9000000 JT (GS-C7 RM 6.4) Total HPAH (µg/kg) 0.66 JT 3300000 JT (GS-C7 RM 6.4) Total PCBs (µg/kg) na na 2,3,7,8,-TCDD (ng/kg) na na Total DDT (µg/kg) na na Dibenzofuran (µg/kg) 0.71 U 26000 J (GS-B7 RM 6.4, GS-C7 RM 6.4) 4-Methylphenol (µg/kg) na na Diesel range hydrocarbons (mg/kg) 700 64000 (GS-B7 RM 6.4) Xylenes (µg/kg) 0.19 UT 83000 T (GS-B7 RM 6.4)
As part of the sediment investigation described above, transition zone water (TZW) samples were also collected offshore of Gasco to determine the potential variability in measured TZW chemical concentrations due to tidal fluctuations in the Willamette River. DEQ requested this study to determine if there is an inverse correlation between river elevation and chemical concentrations in TZW, which would assist in the interpretation of Phase 2 offshore TZW chemical concentrations. In response to DEQ’s request, NW Natural proposed to collect shallow sediment TZW samples using four piezometer porewater samplers under a variety of tide conditions, supplemented by the collection of collocated sediment samples and near-bottom surface water samples to provide additional lines of evidence regarding the potential source of observed TZW concentrations and potential correlation between the collocated TZW and near-bottom surface water concentrations. A single piezometer was installed at the four target stations (GS-B2, GS-B7, GS-C7, and GS-D5). TZW porewater samples were collected over an approximately 2-day period during two slack high tides, ebb tides, and slack low tides, as identified by a continuous-recording water level transducer installed at the site during the deployment period. The TZW samples at stations GS-C7 and GS-D5 were submitted for unfiltered analysis of the following parameters: metals (i.e., calcium, iron, magnesium, manganese, potassium, and

Portland Harbor RI/FS Final Remedial Investigation Report
February 8, 2016
A1-92
sodium), anions (i.e., chloride, sulfate, and sulfide); alkalinity; total cyanide, amenable cyanide, and free cyanide; TOC; DOC; PAHs; and VOCs. Due to sample volume limitations at station GS-B7, only unfiltered metals and VOCs were analyzed. Because of the low-permeability of the sediment and installation difficulties, station GS-B2 was abandoned. Maximum and minimum results for the TZW samples are provided below. Summary Data for TZW Samples. Parameter Minimum Maximum (Location) Arsenic (mg/L) na na Cadmium (mg/L) na na Copper (mg/L) na na Lead (mg/L) na na Mercury (mg/L) na na Zinc (mg/L) na na TBT (µg/L) na na bis(2-ethylhexyl)phthalate (µg/L) na na Total LPAH (µg/L) 12 JT 20000 T (GS-C7 RM 6.4) Total HPAH (µg/L) 0.18 JT 1000 T (GS-C7 RM 6.4) Total PCBs (µg/L) na na 2,3,7,8,-TCDD (ng/L) na na Total DDT (µg/L) na na Dibenzofuran (µg/L) 0.012 J 33 (GS-C7 RM 6.4) 4-Methylphenol (µg/L) na na Diesel range hydrocarbons (mg/L) na na Xylenes (µg/L) 0.22 UT 590 T (GS-C7 RM 6.4)
Twelve single-point surface water samples were collected concurrently with the TZW samples from three locations. The surface water samples were collected approximately 1 ft above the mudline during each slack low and slack high tide over the TZW sampling period, using a Van Dorn sampler deployed from a vessel, in the vicinity of the TZW piezometer. These unfiltered surface water samples were analyzed for alkalinity, chloride, selected metals, sulfate, and TSS. Surface water samples were also collected to evaluate the potential for transport of cyanide from upland Site groundwater and TZW to surface water, and to investigate possible conversion to free cyanide under certain river conditions. These surface water samples were collected at three depth intervals (near-surface, mid-depth, and near-bottom) at each of 20 stations, over three tidal events: outgoing tide, slack high tide, and low slack tide. Measurements of pH, temperature, turbidity, ORP, conductivity, and dissolved oxygen were recorded in the field. A total of 180 surface water samples were submitted to an analytical lab for analyses of (total and dissolved) free, amenable, and total cyanide; total and dissolved iron; TSS; TOC; and total sulfides.

Portland Harbor RI/FS Final Remedial Investigation Report
February 8, 2016
A1-93
WLCGED07. JUNE 2007 STORM WATER MONITORING REPORT, GE ENERGY – ENERGY SERVICES (PREPARED BY AMEC EARTH AND ENVIRONMENTAL, INC., 2007).
NOVEMBER 2007 STORM WATER MONITORING REPORT, GE ENERGY – ENERGY SERVICES (PREPARED BY AMEC EARTH AND ENVIRONMENTAL, INC., 2007).
Stormwater sampling was conducted to obtain representative samples of the GE Energy facility’s accessible stormwater discharge to the public storm sewer.The first report summarizes analytical data collected by AMEC at the GE Energy Services facility between June 8, 2007 and June 10, 2007 and storm event data collected between June 9 and June 10, 2007. The second report describes the results from a stormwater monitoring event on November 7, 2007.
The site has two stormwater sewer systems, one in the North Yard, and one in the south parking lot. The North Yard storm sewer system includes four catch basins (CB1R, CB2R, and CB3R, and CB8), the main roof drain system, and StormFilterTM vault SFV1. StormFilterTM vault SFV1 filters the North Yard and main building roof stormwater run-off before it leaves the site. The discharge point for the filtered North Yard stormwater system is through manhole MH2 located in the northwest corner of the site.
The south parking lot storm water system includes StormFilter™ catch basin CB9 and sample vault SV1. StormFilter™ catch basin CB9 filters the south parking lot stormwater run-off before it combines with the Site’s sanitary sewer and discharges to the public combined sewer in NW Industrial Street. Sample vault SV1 is only used as an access point to collect stormwater samples and is located upstream of the Site’s sanitary sewer. The discharge point for the south parking lot combined storm and sanitary sewers is through manhole MH3 located near the southeast corner of the Site.
Stormwater samples were collected from the specified access point for each of the stormwater sewer systems, specifically manhole MH2 in the North Yard and sample vault SV1, during the storm events. Both manhole MH2 and sample vault SV1 were equipped with area/velocity flow meters, sampling ports, and two automated sampling devices. A rain gauge was installed on the building roof at the site to monitor and record site-specific rainfall amounts.
Minimum and maximum results from these sampling events are provided in the tables below.
Sampling Results for Stormwater (Apr/May) – Filtered. Parameter Minimum Maximum (Location) Arsenic (µg/L) 20 U 20 U (Manhole 2 RM 9.6) Cadmium (µg/L) 2 U 2 U (Manhole 2 RM 9.6) Copper (µg/L) 12.6 12.6 (Manhole 2 RM 9.6) Lead (µg/L) 10 U 10 U (Manhole 2 RM 9.6) Mercury (µg/L) 0.05 UJ 0.05 UJ (Manhole 2 RM 9.6) Zinc (µg/L) 269 269 (Manhole 2 RM 9.6)

Portland Harbor RI/FS Final Remedial Investigation Report
February 8, 2016
A1-94
Parameter Minimum Maximum (Location) TBT (µg/L) na na bis(2-ethylhexyl)phthalate (µg/L)
na na
Total LPAH (µg/L) 0.098 UJT 0.098 UJT (Manhole 2 RM 9.6) Total HPAH (µg/L) 0.098 UJT 0.098 UJT (Manhole 2 RM 9.6) Total PCBs (µg/L) Aroclors 0.0109 J 0.0109 J (Manhole 2 RM 9.6) Total PCBs (pg/L) Congeners 24800 24800 (Manhole 2 RM 9.6) 2,3,7,8,-TCDD (pg/L) na na Total DDT (µg/L) na na Dibenzofuran (µg/L) na na 4-Methylphenol (µg/L) na na Diesel range hydrocarbons (µg/L)
97.1 UJ 97.1 UJ (Manhole 2 RM 9.6)
Xylenes (µg/L) na na Sampling Results for Stormwater (Apr/May) – Unfiltered. Parameter Minimum Maximum (Location) Arsenic (µg/L) 20 U 20 U (Manhole 2 RM 9.6) Cadmium (µg/L) 2 U 2 U (Manhole 2 RM 9.6) Copper (µg/L) 11.7 11.7 (Manhole 2 RM 9.6) Lead (µg/L) 7.54 J 7.54 J (Manhole 2 RM 9.6) Mercury (µg/L) 0.05 UJ 0.05 UJ (Manhole 2 RM 9.6) Zinc (µg/L) 252 252 (Manhole 2 RM 9.6) TBT (µg/L) na na bis(2-ethylhexyl)phthalate (µg/L)
na na
Total LPAH (µg/L) 0.0962 UJT 0.0962 UJT (Manhole 2 RM 9.6) Total HPAH (µg/L) 0.0962 UJT 0.0962 UJT (Manhole 2 RM 9.6) Total PCBs (µg/L) Aroclors 0.0366 J 0.0366 J (Manhole 2 RM 9.6) Total PCBs (pg/L) Congeners 91300 91300 (Manhole 2 RM 9.6) 2,3,7,8,-TCDD (pg/L) na na Total DDT (µg/L) na na Dibenzofuran (µg/L) na na 4-Methylphenol (µg/L) na na Diesel range hydrocarbons (µg/L)
98 UJ 98 UJ (Manhole 2 RM 9.6)
Xylenes (µg/L) na na

Portland Harbor RI/FS Final Remedial Investigation Report
February 8, 2016
A1-95
Sampling Results for Stormwater (June/July) – Filtered. Parameter Minimum Maximum (Location) Arsenic (µg/L) 20 U 20 U (Sample Vault 1 RM 9.6) Cadmium (µg/L) 2 U 2 U (Sample Vault 1 RM 9.6) Copper (µg/L) 14.5 14.5 (Sample Vault 1 RM 9.6) Lead (µg/L) 10 U 10 U (Sample Vault 1 RM 9.6) Mercury (µg/L) 0.05 UJ 0.05 UJ (Sample Vault 1 RM 9.6) Zinc (µg/L) 128 128 (Sample Vault 1 RM 9.6) TBT (µg/L) na na bis(2-ethylhexyl)phthalate (µg/L)
2 UJ 2 UJ (Sample Vault 1 RM 9.6)
Total LPAH (µg/L) 0.16 JT 0.16 JT (Sample Vault 1 RM 9.6) Total HPAH (µg/L) 0.098 UJT 0.098 UJT (Sample Vault 1 RM 9.6) Total PCBs (µg/L) Aroclors 0.025 UJ 0.025 UJ (Sample Vault 1 RM 9.6) Total PCBs (pg/L) Congeners 4610 4610 (Sample Vault 1 RM 9.6) 2,3,7,8,-TCDD (pg/L) na na Total DDT (µg/L) na na Dibenzofuran (µg/L) na na 4-Methylphenol (µg/L) na na Diesel range hydrocarbons (µg/L)
98 UJ 98 UJ (Sample Vault 1 RM 9.6)
Xylenes (µg/L) na na Sampling Results for Stormwater (June/July) – Unfiltered. Parameter Minimum Maximum (Location) Arsenic (µg/L) 20 U 20 U (Sample Vault 1 RM 9.6) Cadmium (µg/L) 2 U 2 U (Sample Vault 1 RM 9.6) Copper (µg/L) 15.9 15.9 (Sample Vault 1 RM 9.6) Lead (µg/L) 10 U 10 U (Sample Vault 1 RM 9.6) Mercury (µg/L) 0.05 UJ 0.05 UJ (Sample Vault 1 RM 9.6) Zinc (µg/L) 131 131 (Sample Vault 1 RM 9.6) TBT (µg/L) na na bis(2-ethylhexyl)phthalate (µg/L)
1.98 UJ 1.98 UJ (Sample Vault 1 RM 9.6)
Total LPAH (µg/L) 0.19 JT 0.19 JT (Sample Vault 1 RM 9.6) Total HPAH (µg/L) 0.098 UJT 0.098 UJT (Sample Vault 1 RM 9.6) Total PCBs (µg/L) Aroclors 0.025 UJ 0.025 UJ (Sample Vault 1 RM 9.6) Total PCBs (pg/L) Congeners 1340 1340 (Sample Vault 1 RM 9.6) 2,3,7,8,-TCDD (pg/L) na na Total DDT (µg/L) na na Dibenzofuran (µg/L) na na 4-Methylphenol (µg/L) na na

Portland Harbor RI/FS Final Remedial Investigation Report
February 8, 2016
A1-96
Parameter Minimum Maximum (Location) Diesel range hydrocarbons (µg/L)
96.2 UJ 96.2 UJ (Sample Vault 1 RM 9.6)
Xylenes (µg/L) na na Sampling Results for Stormwater (Nov) – Filtered. Parameter Minimum Maximum (Location) Arsenic (µg/L) 3.16 U 3.16 U (Manhole 2 RM 9.6, Sample Vault 1
RM 9.6) Cadmium (µg/L) 0.35 U 0.454 J (Manhole 2 RM 9.6) Copper (µg/L) 10 13.4 (Sample Vault 1 RM 9.6) Lead (µg/L) 4.43 U 4.43 U (Manhole 2 RM 9.6, Sample Vault 1
RM 9.6) Mercury (µg/L) 0.025 UJ 0.03 U (Manhole 2 RM 9.6) Zinc (µg/L) 196 302 (Manhole 2 RM 9.6) TBT (µg/L) na na bis(2-ethylhexyl)phthalate (µg/L)
1.34 U 1.34 U (Manhole 2 RM 9.6, Sample Vault 1 RM 9.6)
Total LPAH (µg/L) 0.215 UT 0.215 UT (Manhole 2 RM 9.6, Sample Vault 1 RM 9.6)
Total HPAH (µg/L) 0.295 UT 0.295 UT (Manhole 2 RM 9.6, Sample Vault 1 RM 9.6)
Total PCBs (µg/L) Aroclors 0.0051 UT 0.0051 UT (Sample Vault 1 RM 9.6) Total PCBs (pg/L) Congeners 5560 JT 13200 JT (Sample Vault 1 RM 9.6) 2,3,7,8,-TCDD (pg/L) na na Total DDT (µg/L) na na Dibenzofuran (µg/L) na na 4-Methylphenol (µg/L) na na Diesel range hydrocarbons (µg/L)
100 U 100 U (Manhole 2 RM 9.6, Sample Vault 1 RM 9.6)
Xylenes (µg/L) na na Sampling Results for Stormwater (Nov) – Unfiltered. Parameter Minimum Maximum (Location) Arsenic (µg/L) 6.79 U 8.09 U (Sample Vault 1 RM 9.6) Cadmium (µg/L) 0.35 U 0.35 U (Manhole 2 RM 9.6, Sample Vault 1
RM 9.6) Copper (µg/L) 12.9 18.9 (Sample Vault 1 RM 9.6) Lead (µg/L) 4.43 U 9.71 J (Sample Vault 1 RM 9.6) Mercury (µg/L) 0.025 UJ 0.025 UJ (Manhole 2 RM 9.6, Sample Vault
1 RM 9.6)

Portland Harbor RI/FS Final Remedial Investigation Report
February 8, 2016
A1-97
Parameter Minimum Maximum (Location) Zinc (µg/L) 228 321 (Manhole 2 RM 9.6) TBT (µg/L) na na bis(2-ethylhexyl)phthalate (µg/L) 1.34 U 1.34 U (Manhole 2 RM 9.6, Sample Vault 1
RM 9.6) Total LPAH (µg/L) 0.215 UT 0.215 UT (Manhole 2 RM 9.6, Sample
Vault 1 RM 9.6) Total HPAH (µg/L) 0.295 UT 0.295 UT (Manhole 2 RM 9.6, Sample
Vault 1 RM 9.6) Total PCBs (µg/L) Aroclors 0.0086 JT 0.0086 JT (Sample Vault 1 RM 9.6) Total PCBs (pg/L) Congeners 53100 JT 59100 JT (Manhole 2 RM 9.6) 2,3,7,8,-TCDD (pg/L) na na Total DDT (µg/L) na na Dibenzofuran (µg/L) na na 4-Methylphenol (µg/L) na na Diesel range hydrocarbons (µg/L) 100 U 100 U (Manhole 2 RM 9.6, Sample Vault 1
RM 9.6) Xylenes (µg/L) na na Sampling Results for Stormwater (Oct) – Filtered. Parameter Minimum Maximum (Location) Arsenic (µg/L) 3.16 U 9.1 U (Manhole 2 RM 9.6) Cadmium (µg/L) 0.35 U 3.8 (Manhole 2 RM 9.6) Copper (µg/L) 5.01 6.92 (Manhole 2 RM 9.6) Lead (µg/L) 4.43 U 4.43 U (Manhole 2 RM 9.6, Sample Vault 1
RM 9.6) Mercury (µg/L) 0.025 U 0.025 U (Manhole 2 RM 9.6, Sample Vault
1 RM 9.6) Zinc (µg/L) 53 175 (Manhole 2 RM 9.6) TBT (µg/L) na na bis(2-ethylhexyl)phthalate (µg/L) 1.25 UJ 1.33 UJ (Manhole 2 RM 9.6) Total LPAH (µg/L) 0.207 UT 0.215 UT (Sample Vault 1 RM 9.6) Total HPAH (µg/L) 0.284 UJT 0.295 UJT (Sample Vault 1 RM 9.6) Total PCBs (µg/L) Aroclors 0.0051 UT 0.0051 UT (Manhole 2 RM 9.6, Sample
Vault 1 RM 9.6) Total PCBs (pg/L) Congeners 4780 JT 10400 JT (Manhole 2 RM 9.6) 2,3,7,8,-TCDD (pg/L) na na Total DDT (µg/L) na na Dibenzofuran (µg/L) na na 4-Methylphenol (µg/L) na na Diesel range hydrocarbons (µg/L) 92.6 U 94.3 U (Sample Vault 1 RM 9.6) Xylenes (µg/L) na na

Portland Harbor RI/FS Final Remedial Investigation Report
February 8, 2016
A1-98
Sampling Results for Stormwater (Oct) – Unfiltered. Parameter Minimum Maximum (Location) Arsenic (µg/L) 6.37 U 12.1 U (Sample Vault 1 RM 9.6) Cadmium (µg/L) 0.515 J 3.46 J (Manhole 2 RM 9.6) Copper (µg/L) 10.8 12.7 (Manhole 2 RM 9.6) Lead (µg/L) 4.43 U 6.53 U (Sample Vault 1 RM 9.6) Mercury (µg/L) 0.025 U 0.025 U (Manhole 2 RM 9.6, Sample Vault
1 RM 9.6) Zinc (µg/L) 70.8 184 (Manhole 2 RM 9.6) TBT (µg/L) na na bis(2-ethylhexyl)phthalate (µg/L) 1.26 U 1.56 U (Sample Vault 1 RM 9.6) Total LPAH (µg/L) 0.207 UT 0.215 UT (Sample Vault 1 RM 9.6) Total HPAH (µg/L) 0.284 UJT 0.295 UJT (Sample Vault 1 RM 9.6) Total PCBs (µg/L) Aroclors 0.031 JT 0.11 T (Manhole 2 RM 9.6) Total PCBs (pg/L) Congeners 60000 JT 131000 JT (Manhole 2 RM 9.6) 2,3,7,8,-TCDD (pg/L) na na Total DDT (µg/L) na na Dibenzofuran (µg/L) na na 4-Methylphenol (µg/L) na na Diesel range hydrocarbons (µg/L) 92.6 U 94.3 U (Sample Vault 1 RM 9.6) Xylenes (µg/L) na na
WLCT4C07. FIELD SAMPLING PROCEDURES REPORT, STORMWATER SAMPLING PROGRAM, TERMINAL 4 UPLAND FACILITY (PREPARED BY ASH CREEK ASSOCIATES, INC., 2008)
A stormwater characterization program was conducted at Terminal 4 to evaluate whether stormwater and stormwater solids may be a potential source for future adverse impact to the Willamette River. The sampling program was initiated in December 2006 and included the winter/spring 2007 storm season and the fall 2007/winter 2008 storm season.
The program included flow-weighted and/or time-weighted composite stormwater sampling from seven drainage basin conveyance lines at Terminal 4. Port of Portland Drainage Basins R, Q, M, L, and D, and City of Portland Drainage Basins corresponding to Outfall 52-C (Basin T), and Outfall 53 were included in the sampling program. Three storm events satisfying sampling criteria were targeted for sampling during the winter/spring 2007 stormwater season. The scope was subsequently increased to include an additional fall 2007 stormwater event. The objective of the additional event was to capture the “first-flush” storm event of the season.
In the fall 2007, analysis of PCB congeners from three storm events from Basin D was added to the sampling scope at the request of the LWG. Mininum and maximum results from each sampling event are provided below.

Portland Harbor RI/FS Final Remedial Investigation Report
February 8, 2016
A1-99
Summary Data for Stormwater (11/16/2007) – Filtered. Parameter Minimum Maximum (Location) Arsenic (µg/L) 0.08 0.14 (Basin R RM 4.2) Cadmium (µg/L) 0.045 0.296 (Basin R RM 4.2) Copper (µg/L) 2.02 7.36 (Basin R RM 4.2) Lead (µg/L) 0.372 0.612 (Basin T RM 4.4) Mercury (µg/L) 0.03 U 0.03 U (Basin D RM 4.7, Basin R RM
4.2, Basin T RM 4.4) Zinc (µg/L) 23.7 199 (Basin R RM 4.2) TBT (µg/L) na na bis(2-ethylhexyl)phthalate (µg/L) na na Total LPAH (µg/L) na na Total HPAH (µg/L) na na Total PCBs (µg/L) Aroclors na na Total PCBs (pg/L) Congeners na na 2,3,7,8,-TCDD (pg/L) na na Total DDT (µg/L) na na Dibenzofuran (µg/L) na na 4-Methylphenol (µg/L) na na Diesel range hydrocarbons (µg/L) na na Xylenes (µg/L) na na
Summary Data for Stormwater (11/16/2007) – Unfiltered. Parameter Minimum Maximum (Location) Arsenic (µg/L) 0.13 0.19 (Basin R RM 4.2, Basin T RM 4.4) Cadmium (µg/L) 0.079 0.537 (Basin R RM 4.2) Copper (µg/L) 3.09 11.5 (Basin R RM 4.2) Lead (µg/L) 6.15 13.8 (Basin R RM 4.2) Mercury (µg/L) 0.03 U 0.03 U (Basin D RM 4.7, Basin R RM
4.2, Basin T RM 4.4) Zinc (µg/L) 38.4 285 (Basin R RM 4.2) TBT (µg/L) na na bis(2-ethylhexyl)phthalate (µg/L) 1.1 1.8 (Basin D RM 4.7) Total LPAH (µg/L) 0.056 T 0.12 T (Basin R RM 4.2) Total HPAH (µg/L) 0.16 T 0.43 T (Basin R RM 4.2) Total PCBs (µg/L) Aroclors 0.015 T 0.019 T (Basin T RM 4.4) Total PCBs (pg/L) Congeners na na 2,3,7,8,-TCDD (pg/L) na na Total DDT (µg/L) 0.0011 UT 0.0012 UT (Basin T RM 4.4) Dibenzofuran (µg/L) na na 4-Methylphenol (µg/L) na na Diesel range hydrocarbons (µg/L) na na Xylenes (µg/L) na na

Portland Harbor RI/FS Final Remedial Investigation Report
February 8, 2016
A1-100
Summary Data for Stormwater (3/24/2007) –Filtered. Parameter Minimum Maximum (Location) Arsenic (µg/L) 0.085 3 (Basin M RM 4.4) Cadmium (µg/L) 0.02 U 0.3 (Basin R RM 4.2) Copper (µg/L) 1.7 7.45 (Basin M RM 4.4) Lead (µg/L) 0.1 0.586 (Basin R RM 4.2) Mercury (µg/L) 0.02 U 0.2 U (Basin Q RM 4.3) Zinc (µg/L) 1.3 503 (Basin R RM 4.2) TBT (µg/L) na na bis(2-ethylhexyl)phthalate (µg/L) na na Total LPAH (µg/L) 0.044 JT 0.39 JT (Basin M RM 4.4) Total HPAH (µg/L) 0.012 JT 2.1 T (Basin M RM 4.4) Total PCBs (µg/L) Aroclors 0.02 UJT 0.092 T (Basin M RM 4.4) Total PCBs (pg/L) Congeners na na 2,3,7,8,-TCDD (pg/L) na na Total DDT (µg/L) 0.00097 T 0.015 JT (Basin M RM 4.4) Dibenzofuran (µg/L) na na 4-Methylphenol (µg/L) na na Diesel range hydrocarbons (µg/L) na na Xylenes (µg/L) na na
Summary Data for Stormwater (3/24/2007 – Unfiltered. Parameter Minimum Maximum (Location) Arsenic (µg/L) 0.139 J 3.67 J (Basin M RM 4.4) Cadmium (µg/L) 0.13 J 0.79 J (Basin M RM 4.4) Copper (µg/L) 2.92 32.5 (Basin M RM 4.4) Lead (µg/L) 9.26 J 104 J (Basin M RM 4.4) Mercury (µg/L) 0.02 U 0.09 (Basin M RM 4.4) Zinc (µg/L) 28.9 604 (Basin R RM 4.2) TBT (µg/L) na na bis(2-ethylhexyl)phthalate (µg/L) 0.66 J 7.9 (Basin L RM 4.5) Total LPAH (µg/L) 0.13 JT 2.4 T (Basin L RM 4.5) Total HPAH (µg/L) 0.12 JT 22 T (Basin L RM 4.5) Total PCBs (µg/L) Aroclors 0.011 UJT 0.14 T (Basin Q RM 4.3) Total PCBs (pg/L) Congeners na na 2,3,7,8,-TCDD (pg/L) na na Total DDT (µg/L) na na Dibenzofuran (µg/L) na na 4-Methylphenol (µg/L) na na Diesel range hydrocarbons (µg/L) 0.002 UJT 0.031 JT (Basin T RM 4.4) Xylenes (µg/L) na na

Portland Harbor RI/FS Final Remedial Investigation Report
February 8, 2016
A1-101
Summary Data for Stormwater (4/7/2007) – Filtered. Parameter Minimum Maximum (Location) Arsenic (µg/L) na na Cadmium (µg/L) na na Copper (µg/L) na na Lead (µg/L) na na Mercury (µg/L) na na Zinc (µg/L) na na TBT (µg/L) na na bis(2-ethylhexyl)phthalate (µg/L) na na Total LPAH (µg/L) 0.084 JT 0.35 JT (Basin M RM 4.4) Total HPAH (µg/L) 0.14 JT 2.3 T (Basin M RM 4.4) Total PCBs (µg/L) Aroclors 0.033 JT 0.049 T (Basin Q RM 4.3) Total PCBs (pg/L) Congeners na na 2,3,7,8,-TCDD (pg/L) na na Total DDT (µg/L) 0.00066 JT 0.0092 JT (Basin M RM 4.4) Dibenzofuran (µg/L) na na 4-Methylphenol (µg/L) na na Diesel range hydrocarbons (µg/L) na na Xylenes (µg/L) na na
Summary Data for Stormwater (4/7/2007) – Unfiltered. Parameter Minimum Maximum (Location) Arsenic (µg/L) na na Cadmium (µg/L) na na Copper (µg/L) na na Lead (µg/L) na na Mercury (µg/L) na na Zinc (µg/L) na na TBT (µg/L) na na bis(2-ethylhexyl)phthalate (µg/L) 0.71 J 4.6 J (Outfall 53 RM 5.1) Total LPAH (µg/L) 0.15 JT 0.33 JT (Basin M RM 4.4) Total HPAH (µg/L) 0.28 JT 1.8 T (Basin M RM 4.4) Total PCBs (µg/L) Aroclors 0.026 JT 0.2 JT (Basin R RM 4.2) Total PCBs (pg/L) Congeners na na 2,3,7,8,-TCDD (pg/L) na na Total DDT (µg/L) 0.00081 T 0.0081 JT (Basin M RM 4.4) Dibenzofuran (µg/L) na na 4-Methylphenol (µg/L) na na Diesel range hydrocarbons (µg/L) na na Xylenes (µg/L) na na

Portland Harbor RI/FS Final Remedial Investigation Report
February 8, 2016
A1-102
Summary Data for Stormwater (5/20/2007) – Filtered. Parameter Minimum Maximum (Location) Arsenic (µg/L) 0.178 2.95 (Basin M RM 4.4) Cadmium (µg/L) 0.042 J 0.336 (Basin L RM 4.5) Copper (µg/L) 4.66 J 17.3 J (Basin M RM 4.4) Lead (µg/L) 0.328 J 6.11 (Basin R RM 4.2) Mercury (µg/L) 0.05 J 0.2 U (Basin D RM 4.7, Basin M RM
4.4, Basin R RM 4.2, Basin T RM 4.4) Zinc (µg/L) 9.25 406 (Basin R RM 4.2) TBT (µg/L) na na bis(2-ethylhexyl)phthalate (µg/L ) na na Total LPAH (µg/L) 0.84 JT 0.84 JT (Basin L RM 4.5) Total HPAH (µg/L) 8.9 T 8.9 T (Basin L RM 4.5) Total PCBs (µg/L) Aroclors 0.062 JT 0.062 JT (Basin L RM 4.5) Total PCBs (pg/L) Congeners na na 2,3,7,8,-TCDD (pg/L) na na Total DDT (µg/L) 0.0029 JT 0.0029 JT (Basin L RM 4.5) Dibenzofuran (µg/L) 0.03 0.03 (Basin L RM 4.5) 4-Methylphenol (µg/L) na na Diesel range hydrocarbons (µg/L) na na Xylenes (µg/L) na na
Summary Data for Stormwater (5/20/2007) – Unfiltered. Parameter Minimum Maximum (Location) Arsenic (µg/L) 0.253 3.93 (Basin R RM 4.2) Cadmium (µg/L) 0.115 16.2 (Basin R RM 4.2) Copper (µg/L) 6.09 319 (Basin R RM 4.2) Lead (µg/L) 13.8 1070 (Basin R RM 4.2) Mercury (µg/L) 0.2 U 0.53 (Basin R RM 4.2) Zinc (µg/L) 38.4 4520 (Basin R RM 4.2) TBT (µg/L) na na bis(2-ethylhexyl)phthalate (µg/L) 8.3 8.3 (Basin L RM 4.5) Total LPAH (µg/L) 2.7 JT 2.7 JT (Basin L RM 4.5) Total HPAH (µg/L) 34 T 34 T (Basin L RM 4.5) Total PCBs (µg/L) Aroclors 0.19 T 0.19 T (Basin L RM 4.5) Total PCBs (pg/L) Congeners na na 2,3,7,8,-TCDD (pg/L) na na Total DDT (µg/L) 0.015 JT 0.015 JT (Basin L RM 4.5) Dibenzofuran (µg/L) 0.087 0.087 (Basin L RM 4.5) 4-Methylphenol (µg/L) na na Diesel range hydrocarbons (µg/L) na na Xylenes (µg/L) na na
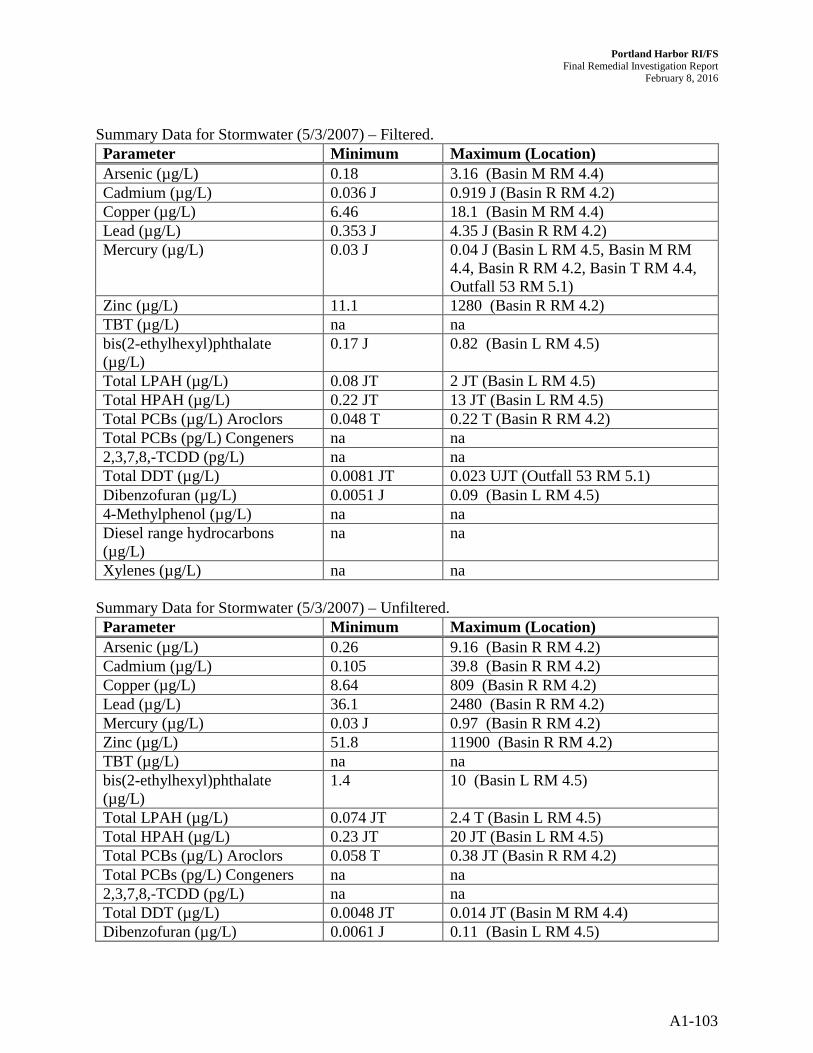
Portland Harbor RI/FS Final Remedial Investigation Report
February 8, 2016
A1-103
Summary Data for Stormwater (5/3/2007) – Filtered. Parameter Minimum Maximum (Location) Arsenic (µg/L) 0.18 3.16 (Basin M RM 4.4) Cadmium (µg/L) 0.036 J 0.919 J (Basin R RM 4.2) Copper (µg/L) 6.46 18.1 (Basin M RM 4.4) Lead (µg/L) 0.353 J 4.35 J (Basin R RM 4.2) Mercury (µg/L) 0.03 J 0.04 J (Basin L RM 4.5, Basin M RM
4.4, Basin R RM 4.2, Basin T RM 4.4, Outfall 53 RM 5.1)
Zinc (µg/L) 11.1 1280 (Basin R RM 4.2) TBT (µg/L) na na bis(2-ethylhexyl)phthalate (µg/L)
0.17 J 0.82 (Basin L RM 4.5)
Total LPAH (µg/L) 0.08 JT 2 JT (Basin L RM 4.5) Total HPAH (µg/L) 0.22 JT 13 JT (Basin L RM 4.5) Total PCBs (µg/L) Aroclors 0.048 T 0.22 T (Basin R RM 4.2) Total PCBs (pg/L) Congeners na na 2,3,7,8,-TCDD (pg/L) na na Total DDT (µg/L) 0.0081 JT 0.023 UJT (Outfall 53 RM 5.1) Dibenzofuran (µg/L) 0.0051 J 0.09 (Basin L RM 4.5) 4-Methylphenol (µg/L) na na Diesel range hydrocarbons (µg/L)
na na
Xylenes (µg/L) na na Summary Data for Stormwater (5/3/2007) – Unfiltered. Parameter Minimum Maximum (Location) Arsenic (µg/L) 0.26 9.16 (Basin R RM 4.2) Cadmium (µg/L) 0.105 39.8 (Basin R RM 4.2) Copper (µg/L) 8.64 809 (Basin R RM 4.2) Lead (µg/L) 36.1 2480 (Basin R RM 4.2) Mercury (µg/L) 0.03 J 0.97 (Basin R RM 4.2) Zinc (µg/L) 51.8 11900 (Basin R RM 4.2) TBT (µg/L) na na bis(2-ethylhexyl)phthalate (µg/L)
1.4 10 (Basin L RM 4.5)
Total LPAH (µg/L) 0.074 JT 2.4 T (Basin L RM 4.5) Total HPAH (µg/L) 0.23 JT 20 JT (Basin L RM 4.5) Total PCBs (µg/L) Aroclors 0.058 T 0.38 JT (Basin R RM 4.2) Total PCBs (pg/L) Congeners na na 2,3,7,8,-TCDD (pg/L) na na Total DDT (µg/L) 0.0048 JT 0.014 JT (Basin M RM 4.4) Dibenzofuran (µg/L) 0.0061 J 0.11 (Basin L RM 4.5)

Portland Harbor RI/FS Final Remedial Investigation Report
February 8, 2016
A1-104
Parameter Minimum Maximum (Location) 4-Methylphenol (µg/L) na na Diesel range hydrocarbons (µg/L)
na na
Xylenes (µg/L) na na Summary Data for Stormwater (9/28/2007) – Filtered. Parameter Minimum Maximum (Location) Arsenic (µg/L) 0.26 2.03 (Basin M RM 4.4) Cadmium (µg/L) 0.036 J 0.28 (Basin Q RM 4.3) Copper (µg/L) 9.42 13.8 (Basin Q RM 4.3) Lead (µg/L) 0.281 0.584 (Basin Q RM 4.3) Mercury (µg/L) 0.04 1 U (Basin L RM 4.5) Zinc (µg/L) 9.58 164 (Basin Q RM 4.3) TBT (µg/L) na na bis(2-ethylhexyl)phthalate (µg/L)
0.38 J 0.38 J (Basin Q RM 4.3)
Total LPAH (µg/L) 0.11 JT 0.11 JT (Basin Q RM 4.3) Total HPAH (µg/L) 0.21 JT 0.21 JT (Basin Q RM 4.3) Total PCBs (µg/L) Aroclors 0.033 UT 0.033 UT (Basin Q RM 4.3) Total PCBs (pg/L) Congeners na na 2,3,7,8,-TCDD (pg/L) na na Total DDT (µg/L) 0.0049 JT 0.0049 JT (Basin Q RM 4.3) Dibenzofuran (µg/L) na na 4-Methylphenol (µg/L) na na Diesel range hydrocarbons (µg/L)
na na
Xylenes (µg/L) na na Summary Data for Stormwater (9/28/2007) – Unfiltered. Parameter Minimum Maximum (Location) Arsenic (µg/L) 0.64 2.32 (Basin M RM 4.4) Cadmium (µg/L) 0.262 0.968 (Basin L RM 4.5) Copper (µg/L) 15.5 25.6 (Basin L RM 4.5) Lead (µg/L) 21.5 47.4 (Basin L RM 4.5) Mercury (µg/L) 0.03 0.05 (Basin Q RM 4.3) Zinc (µg/L) 78.6 382 (Basin L RM 4.5) TBT (µg/L) na na bis(2-ethylhexyl)phthalate (µg/L) 0.8 7 (Basin L RM 4.5) Total LPAH (µg/L) 0.16 JT 0.98 JT (Basin L RM 4.5) Total HPAH (µg/L) 0.55 JT 8.9 T (Basin L RM 4.5) Total PCBs (µg/L) Aroclors 0.021 UT 0.055 UT (Basin L RM 4.5) Total PCBs (pg/l) Congeners na na

Portland Harbor RI/FS Final Remedial Investigation Report
February 8, 2016
A1-105
Parameter Minimum Maximum (Location) 2,3,7,8,-TCDD (pg/l) na na Total DDT (µg/L) 0.0041 UT 0.0062 JT (Basin M RM 4.4) Dibenzofuran (µg/L) na na 4-Methylphenol (µg/L) na na Diesel range hydrocarbons (µg/L) na na Xylenes (µg/L) na na
WLCZDI07. ZIDELL WATERFRONT PROPERTY. (MAUL FOSTER & ALONGI).
This data set consists of sediments collected offshore of Zidell Waterfront Property between 1997 and 2009. Forty-three surface sediment samples were collected between RM 13.5 and 14 in support of a remedial site investigation and additional sediment assessments. Sample collection information was not available. Samples were analyzed for metals, Aroclors, PAHs, TPH, and TOC.
Summary of Surface Sediment Samples Parameter Minimum Maximum (Location) Arsenic (mg/kg) na na Cadmium (mg/kg) 0.0369 U 4.6 (WRS96 RM ) Copper (mg/kg) 0.184 UJ 1470 (WRS96 RM ) Lead (mg/kg) 0.576 U 1860 J (WRS72 RM 13.6) Mercury (mg/kg) 0.00172 U 0.313 (WRS72 RM 13.6) Zinc (mg/kg) 3.27 J 4780 (WRS96 RM ) TBT (µg/kg) 0.067 UT 47 (WRS86 RM 13.5) Bis(2-ethylhexyl) phthalate (µg/kg) na na Total LPAH (µg/kg) 2.56 UA 2560 A (WRS96 RM ) Total HPAH (µg/kg) 1.33 UT 4250 T (WRS75 RM 13.6) Total PCBs (µg/kg) 1.27 T 15100 T (WRS75 RM 13.6) 2,3,7,8-TCDD (pg/g) na na Total DDx (µg/kg) na na Dibenzofuran (µg/kg) na na 4-Methylphenol (µg/kg) na na Diesel range hydrocarbons (mg/kg) na na Xylenes (µg/kg) na na
WLCITG08. SEDIMENT SAMPLING RESULTS FOCUSED SEDIMENT INVESTIGATION INTERNATIONAL TERMINALS SLIP, PORTLAND OREGON (PREPARED BY CH2M HILL, APRIL 10, 2009).
This investigation was conducted to evaluate the sediment quality near Outfall 18 and the surrounding areas in the Schnitzer Steel Industries Inc. International Terminals Slip, which is north of the Burgard Industrial Park. Sediment sampling was conducted on July 10, 11, 24, and 25.
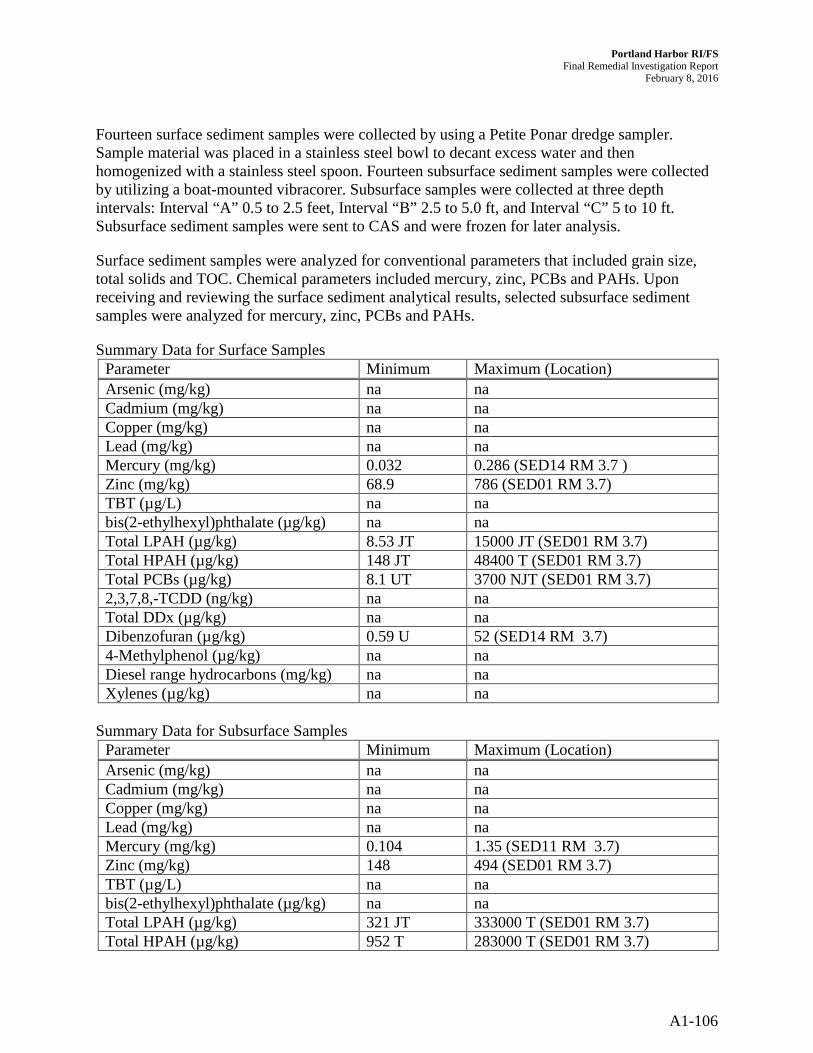
Portland Harbor RI/FS Final Remedial Investigation Report
February 8, 2016
A1-106
Fourteen surface sediment samples were collected by using a Petite Ponar dredge sampler. Sample material was placed in a stainless steel bowl to decant excess water and then homogenized with a stainless steel spoon. Fourteen subsurface sediment samples were collected by utilizing a boat-mounted vibracorer. Subsurface samples were collected at three depth intervals: Interval “A” 0.5 to 2.5 feet, Interval “B” 2.5 to 5.0 ft, and Interval “C” 5 to 10 ft. Subsurface sediment samples were sent to CAS and were frozen for later analysis.
Surface sediment samples were analyzed for conventional parameters that included grain size, total solids and TOC. Chemical parameters included mercury, zinc, PCBs and PAHs. Upon receiving and reviewing the surface sediment analytical results, selected subsurface sediment samples were analyzed for mercury, zinc, PCBs and PAHs.
Summary Data for Surface Samples Parameter Minimum Maximum (Location) Arsenic (mg/kg) na na Cadmium (mg/kg) na na Copper (mg/kg) na na Lead (mg/kg) na na Mercury (mg/kg) 0.032 0.286 (SED14 RM 3.7 ) Zinc (mg/kg) 68.9 786 (SED01 RM 3.7) TBT (µg/L) na na bis(2-ethylhexyl)phthalate (µg/kg) na na Total LPAH (µg/kg) 8.53 JT 15000 JT (SED01 RM 3.7) Total HPAH (µg/kg) 148 JT 48400 T (SED01 RM 3.7) Total PCBs (µg/kg) 8.1 UT 3700 NJT (SED01 RM 3.7) 2,3,7,8,-TCDD (ng/kg) na na Total DDx (µg/kg) na na Dibenzofuran (µg/kg) 0.59 U 52 (SED14 RM 3.7) 4-Methylphenol (µg/kg) na na Diesel range hydrocarbons (mg/kg) na na Xylenes (µg/kg) na na
Summary Data for Subsurface Samples
Parameter Minimum Maximum (Location) Arsenic (mg/kg) na na Cadmium (mg/kg) na na Copper (mg/kg) na na Lead (mg/kg) na na Mercury (mg/kg) 0.104 1.35 (SED11 RM 3.7) Zinc (mg/kg) 148 494 (SED01 RM 3.7) TBT (µg/L) na na bis(2-ethylhexyl)phthalate (µg/kg) na na Total LPAH (µg/kg) 321 JT 333000 T (SED01 RM 3.7) Total HPAH (µg/kg) 952 T 283000 T (SED01 RM 3.7)

Portland Harbor RI/FS Final Remedial Investigation Report
February 8, 2016
A1-107
Parameter Minimum Maximum (Location) Total PCBs (µg/kg) 87 T 14000 T (SED01, SED02 RM 3.7) 2,3,7,8,-TCDD (ng/kg) na na Total DDx (µg/kg) na na Dibenzofuran (µg/kg) 3.3 J 21000 (SED01 RM 3.7) 4-Methylphenol (µg/kg) na na Diesel range hydrocarbons (mg/kg) na na Xylenes (µg/kg) na na
WLCARI08. INTERIM CONSTRUCTION REPORT REVETMENT SOURCE CONTROL MEASURE BP BULK TERMINAL 22T, PORTLAND, OR (PREPARED BY URS, MARCH 2009).
This investigation was conducted to document soil and sediment quality at excavation limits in order to assess the criteria used in the mass removal analysis. The soil and sediment was removed as part of a revetment removal construction project and seawall replacement at the BP Bulk Terminal in Portland, OR. Twenty-two sediment and soil samples were collected between September 30 and November 15, 2008.
Grab samples were collected following excavation to design depths. Samples were collected using a box core sampler when using an excavator was not possible. Samples collected with the box core were homogenized directly in the sampler, and when collected with the excavator, sample volume was transferred from the excavator bucket to a stainless steel bowl and homogenized. Samples were analyzed for PAHs, metals and NWTPH-Dx.
Summary Data for Riparian Soil Samples Parameter Minimum Maximum (Location) Arsenic (mg/kg) 2.64 20.9 (PRS13 RM 4.9) Cadmium (mg/kg) 0.186 J 2.5 U (PRS15 RM 4.8) Copper (mg/kg) 20.6 483 (PRS13 RM 4.9) Lead (mg/kg) 5.03 61.5 (PRS13 RM 4.9) Mercury (mg/kg) na na Zinc (mg/kg) 42 245 (PRS13 RM 4.9) TBT (µg/kg) na na Bis(2-ethylhexyl) phthalate (µg/kg) na na Total LPAH (µg/kg) 1.9 UT 2730 JT (PRS13 RM 4.9) Total HPAH (µg/kg) 2.91 JT 4450 JT (PRS13 RM 4.9) Total PCBs (µg/kg) na na 2,3,7,8-TCDD (pg/g) na na Total DDx (µg/kg) na na Dibenzofuran (µg/kg) na na 4-Methylphenol (µg/kg) na na Diesel range hydrocarbons (mg/kg) 3.6 J 620 J (PRS-13 RM 4.9)
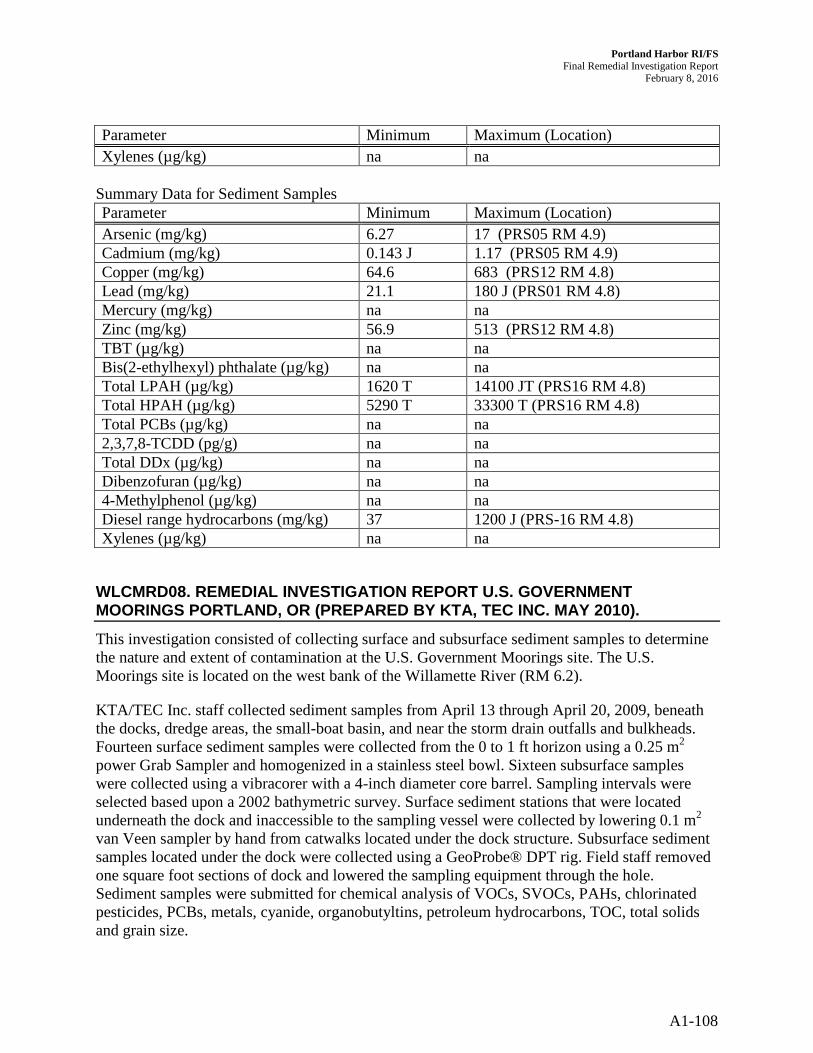
Portland Harbor RI/FS Final Remedial Investigation Report
February 8, 2016
A1-108
Parameter Minimum Maximum (Location) Xylenes (µg/kg) na na
Summary Data for Sediment Samples Parameter Minimum Maximum (Location) Arsenic (mg/kg) 6.27 17 (PRS05 RM 4.9) Cadmium (mg/kg) 0.143 J 1.17 (PRS05 RM 4.9) Copper (mg/kg) 64.6 683 (PRS12 RM 4.8) Lead (mg/kg) 21.1 180 J (PRS01 RM 4.8) Mercury (mg/kg) na na Zinc (mg/kg) 56.9 513 (PRS12 RM 4.8) TBT (µg/kg) na na Bis(2-ethylhexyl) phthalate (µg/kg) na na Total LPAH (µg/kg) 1620 T 14100 JT (PRS16 RM 4.8) Total HPAH (µg/kg) 5290 T 33300 T (PRS16 RM 4.8) Total PCBs (µg/kg) na na 2,3,7,8-TCDD (pg/g) na na Total DDx (µg/kg) na na Dibenzofuran (µg/kg) na na 4-Methylphenol (µg/kg) na na Diesel range hydrocarbons (mg/kg) 37 1200 J (PRS-16 RM 4.8) Xylenes (µg/kg) na na
WLCMRD08. REMEDIAL INVESTIGATION REPORT U.S. GOVERNMENT MOORINGS PORTLAND, OR (PREPARED BY KTA, TEC INC. MAY 2010).
This investigation consisted of collecting surface and subsurface sediment samples to determine the nature and extent of contamination at the U.S. Government Moorings site. The U.S. Moorings site is located on the west bank of the Willamette River (RM 6.2).
KTA/TEC Inc. staff collected sediment samples from April 13 through April 20, 2009, beneath the docks, dredge areas, the small-boat basin, and near the storm drain outfalls and bulkheads. Fourteen surface sediment samples were collected from the 0 to 1 ft horizon using a 0.25 m2 power Grab Sampler and homogenized in a stainless steel bowl. Sixteen subsurface samples were collected using a vibracorer with a 4-inch diameter core barrel. Sampling intervals were selected based upon a 2002 bathymetric survey. Surface sediment stations that were located underneath the dock and inaccessible to the sampling vessel were collected by lowering 0.1 m2 van Veen sampler by hand from catwalks located under the dock structure. Subsurface sediment samples located under the dock were collected using a GeoProbe® DPT rig. Field staff removed one square foot sections of dock and lowered the sampling equipment through the hole. Sediment samples were submitted for chemical analysis of VOCs, SVOCs, PAHs, chlorinated pesticides, PCBs, metals, cyanide, organobutyltins, petroleum hydrocarbons, TOC, total solids and grain size.

Portland Harbor RI/FS Final Remedial Investigation Report
February 8, 2016
A1-109
Summary Data for Surface Sediment Samples Parameter Minimum Maximum (Location) Arsenic (mg/kg) 2.58 20.5 (UD27-1 RM 6.1) Cadmium (mg/kg) 0.162 0.581 (UD27-1 RM 6.1) Copper (mg/kg) 39.6 208 (DC25-1 RM 6.1) Lead (mg/kg) 11.6 J 385 (DC25-1 RM 6.1) Mercury (mg/kg) 0.045 0.206 (DA18-1 RM 6.1) Zinc (mg/kg) 102 429 J (UD27-1 RM 6.1) TBT (µg/kg) 0.55 J 830 (DC25-1 RM 6.1) bis(2-ethylhexyl)phthalate (µg/kg) 35 1400 (UD-26 RM 6.1) Total LPAH (µg/kg) 230 JT 71600 (DC25-1 RM 6.1) Total HPAH (µg/kg) 1600 T 387000 (DC25-1 RM 6.1) Total PCBs (µg/kg) 4.3 JT 68 JT (DA18-1 RM 6.0) 2,3,7,8,-TCDD (ng/kg) na na Total DDx (µg/kg) 5.4 JT 500 T (DC25-1 RM 6.1) Dibenzofuran (µg/kg) 3.5 910 (DC25-1 RM 6.1) 4-Methylphenol (µg/kg) 3.5 J 430 U (UD1-1 RM 6.1) Diesel range hydrocarbons (mg/kg) 28 450 (DC25-1 RM 6.1) Xylenes (µg/kg) 4.23 J 28 U (UD27-1 RM 6.1)
Summary Data for Subsurface Sediment Samples
Parameter Minimum Maximum (Location) Arsenic (mg/kg) 1.88 11.6 (DC25-3 RM 6.1) Cadmium (mg/kg) 0.048 0.628 (DA19-3 RM 6.1) Copper (mg/kg) 18.7 183 (DC25-3 RM 6.1) Lead (mg/kg) 2.9 363 (DC24-3 RM 6.1) Mercury (mg/kg) 0.011 J 2.34 (UD1-4 RM 6.1) Zinc (mg/kg) 58.6 298 (DC25-3 RM 6.1) TBT (µg/kg) 1.3 U 390 (DC25-3 RM 6.1) bis(2-ethylhexyl)phthalate (µg/kg) 7.7 J 920 U (DC24-3 RM 6.1) Total LPAH (µg/kg) 6.2 JT 280000 (DC24-3 RM 6.1) Total HPAH (µg/kg) 1.2 JT 510000 (DC24-3 RM 6.1) Total PCBs (µg/kg) 3.7 UT 1300 UT (DC23 RM 6.1) 2,3,7,8,-TCDD (ng/kg) na na Total DDx (µg/kg) 0.1 JT 560 JT (DC23 RM 6.1) Dibenzofuran (µg/kg) 0.61 J 3700 (DC24-3 RM 6.1) 4-Methylphenol (µg/kg) 2.5 J 460 U (DC24-3 RM 6.1) Diesel range hydrocarbons (mg/kg) 2.1 J 2400 (DC24-3 RM 6.1) Xylenes (µg/kg) 0.23 JT 70 J (UD27-2 RM 6.1)
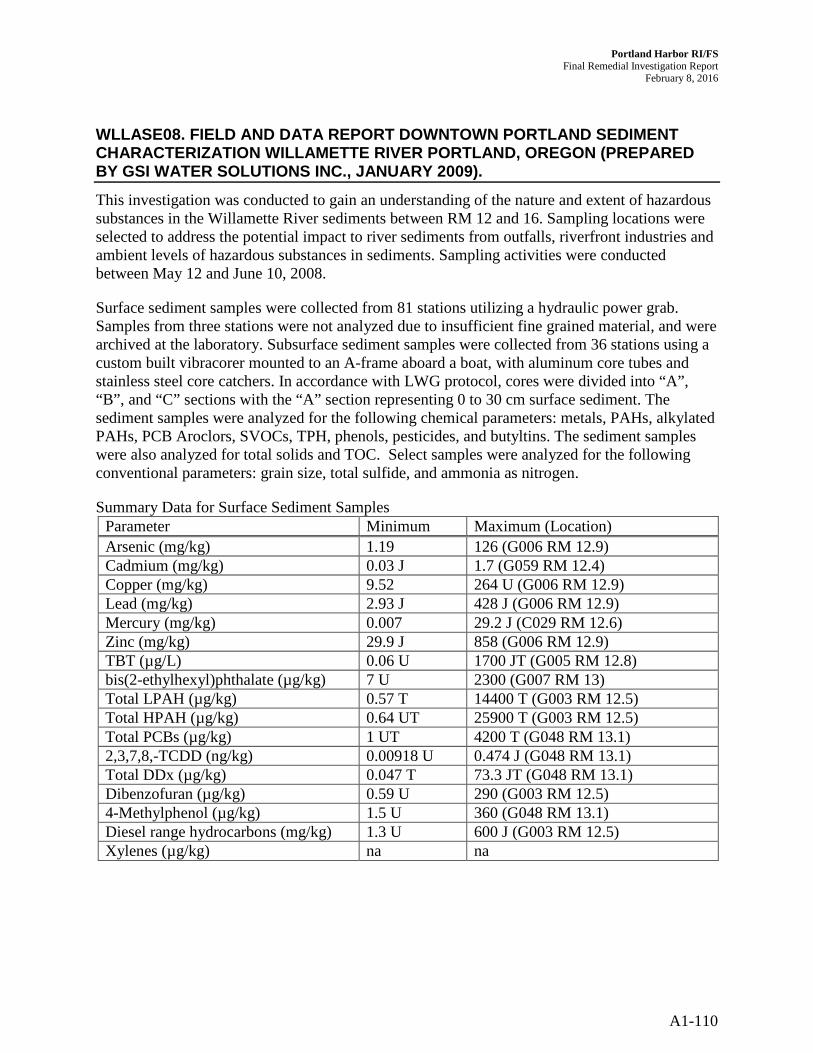
Portland Harbor RI/FS Final Remedial Investigation Report
February 8, 2016
A1-110
WLLASE08. FIELD AND DATA REPORT DOWNTOWN PORTLAND SEDIMENT CHARACTERIZATION WILLAMETTE RIVER PORTLAND, OREGON (PREPARED BY GSI WATER SOLUTIONS INC., JANUARY 2009).
This investigation was conducted to gain an understanding of the nature and extent of hazardous substances in the Willamette River sediments between RM 12 and 16. Sampling locations were selected to address the potential impact to river sediments from outfalls, riverfront industries and ambient levels of hazardous substances in sediments. Sampling activities were conducted between May 12 and June 10, 2008.
Surface sediment samples were collected from 81 stations utilizing a hydraulic power grab. Samples from three stations were not analyzed due to insufficient fine grained material, and were archived at the laboratory. Subsurface sediment samples were collected from 36 stations using a custom built vibracorer mounted to an A-frame aboard a boat, with aluminum core tubes and stainless steel core catchers. In accordance with LWG protocol, cores were divided into “A”, “B”, and “C” sections with the “A” section representing 0 to 30 cm surface sediment. The sediment samples were analyzed for the following chemical parameters: metals, PAHs, alkylated PAHs, PCB Aroclors, SVOCs, TPH, phenols, pesticides, and butyltins. The sediment samples were also analyzed for total solids and TOC. Select samples were analyzed for the following conventional parameters: grain size, total sulfide, and ammonia as nitrogen.
Summary Data for Surface Sediment Samples Parameter Minimum Maximum (Location) Arsenic (mg/kg) 1.19 126 (G006 RM 12.9) Cadmium (mg/kg) 0.03 J 1.7 (G059 RM 12.4) Copper (mg/kg) 9.52 264 U (G006 RM 12.9) Lead (mg/kg) 2.93 J 428 J (G006 RM 12.9) Mercury (mg/kg) 0.007 29.2 J (C029 RM 12.6) Zinc (mg/kg) 29.9 J 858 (G006 RM 12.9) TBT (µg/L) 0.06 U 1700 JT (G005 RM 12.8) bis(2-ethylhexyl)phthalate (µg/kg) 7 U 2300 (G007 RM 13) Total LPAH (µg/kg) 0.57 T 14400 T (G003 RM 12.5) Total HPAH (µg/kg) 0.64 UT 25900 T (G003 RM 12.5) Total PCBs (µg/kg) 1 UT 4200 T (G048 RM 13.1) 2,3,7,8,-TCDD (ng/kg) 0.00918 U 0.474 J (G048 RM 13.1) Total DDx (µg/kg) 0.047 T 73.3 JT (G048 RM 13.1) Dibenzofuran (µg/kg) 0.59 U 290 (G003 RM 12.5) 4-Methylphenol (µg/kg) 1.5 U 360 (G048 RM 13.1) Diesel range hydrocarbons (mg/kg) 1.3 U 600 J (G003 RM 12.5) Xylenes (µg/kg) na na

Portland Harbor RI/FS Final Remedial Investigation Report
February 8, 2016
A1-111
Summary Data for Subsurface Sediment Samples Parameter Minimum Maximum (Location) Arsenic (mg/kg) 1.08 7.18 (C011 RM 14.5) Cadmium (mg/kg) 0.051 1.04 T (C031 RM 12.1) Copper (mg/kg) 14.8 56.4 (C034 RM 14) Lead (mg/kg) 2.36 J 371 JT (C031 RM 12.1) Mercury (mg/kg) 0.012 1.58 (C037 RM 14.2) Zinc (mg/kg) 34.6 218 T (C031 RM 12.1) TBT (µg/kg) 0.067 U 23 (C004 RM 13.3) bis(2-ethylhexyl)phthalate (µg/kg) 7 U 3800 (C032 RM 15.8) Total LPAH (µg/kg) 0.45 T 5170 JT (C024 RM 13.3) Total HPAH (µg/kg) 0.28 T 6040 T (C020 RM 13.8) Total PCBs (µg/kg) 1 UT 610 T (C022 RM 13.5) 2,3,7,8,-TCDD (ng/kg) 0.0171 U 0.56 J (C022 RM 13.5) Total DDx (µg/kg) 0.052 T 73.1 JT (C031 RM 12.1) Dibenzofuran (µg/kg) 0.59 U 100 (C029 RM 12.6) 4-Methylphenol (µg/kg) 1.5 U 330 (C024 RM 13.3) Diesel range hydrocarbons (mg/kg) 2.2 U 900 J (C001 RM 12.3) Xylenes (µg/kg) 4000 UT 6700 UT (C035 RM 14.1)
WLCCWI08. CHEVRON WILLBRIDGE TERMINAL 2008/2009 PRE-DREDGE SEDIMENT INVESTIGATION, PORTLAND, OR (PREPARED BY ARCADIS, AUGUST 2009).
These investigations included physical and chemical characterization of sediment at Chevron’s Willbridge Terminal berths prior to dredging. The area to be characterized consisted of the two terminal berths and the nearshore slope that would potentially be subject to sloughing following dredging in the berths.
Sediment sampling for the first investigation was conducted in September 2008. The area was divided into three dredge material management units (DMMUs): DMMU-1 in the berth north of the dock; DMMU-2 in the berth south of the dock; and DMMU-3 within the U-shaped nearshore slope on the western ends of the berths. Ten stations were sampled from the three DMMUs, with one to four vibracores collected from each station to acquire the necessary volume for the target analyses. Within DMMUs -1 and -2, depth-integrated samples were collected and composited across the stations to represent the dredge prism (to a depth of -40 ft CRD), and discrete samples were collected from the individual stations to represent the 0–1ft and 1–2 ft intervals of sediment below -40 ft CRD (i.e., the new sediment surface following dredging). Within DMMU-3, the 0–1ft interval from each core was composited, and discrete samples were collected from the 1–3 ft and 3–5 ft intervals in each core.

Portland Harbor RI/FS Final Remedial Investigation Report
February 8, 2016
A1-112
Summary of Subsurface Samples
DMMU
Approximate Interval Top
(cm bml)
Approximate Interval Bottom
(cm bml) Sample ID DMMU-1 91.44 182.9 DMMU-1(A+B+C),
DMMU-FD-1 99 130 DMMU-1A-40-41 130 160 DMMU-1A-41-42 107 137 DMMU-1B-40-41 137 168 DMMU-1B-41-42 82 113 DMMU-1C-40-41 113 143 DMMU-1C-41-42 DMMU-2 0 99.06 DMMU-2(A+B+C) 99.06 182.9 DMMU-2A-40-41 182.9 213.4 DMMU-2A-41-42 91.44 121.9 DMMU-2B-40-41 121.9 152.4 DMMU-2B-41-42 60.96 91.44 DMMU-2C-40-41 91.44 121.9 DMMU-2C-41-42 DMMU-3 0 30.48 DMMU-3(A+B+C) 30.48 91.44 DMMU-3A-1.0-3.0 91.44 152.4 DMMU3A-3.0-5.0 30.48 91.44 DMMU-3B-1.0-3.0 91.44 152.4 DMMU3B-3.0-5.0 No recovery DMMU-3C-1.0-3.0 No recovery DMMU3C-3.0-5.0 30.48 91.44 DMMU-3D-1.0-3.0 91.44 152.4 DMMU3D-3.0-5.0 30.48 91.44 DMMU-3E-1.0-3.0 91.44 152.4 DMMU3E-3.0-5.0
Summary Data for Subsurface Samples Parameter Minimum Maximum (Location) Arsenic (mg/kg) 4.58 J 6.1 (DMMU1A4041) Cadmium (mg/kg) 0.213 J 0.939 UJ (DMMU3A RM 7.6) Copper (mg/kg) 16.3 J 237 J (DMMU2ABC RM 7.7) Lead (mg/kg) 13.4 J 30.3 J (DMMU3D, DMMU3ABDE
RM 7.7) Mercury (mg/kg) 0.0669 JT 1.05 J (DMMU3ABDE RM 7.7)

Portland Harbor RI/FS Final Remedial Investigation Report
February 8, 2016
A1-113
Parameter Minimum Maximum (Location) Zinc (mg/kg) 47.7 JT 592 J (DMMU2ABC RM 7.7) TBT (μg/kg) 1.5 UJ 3 U (DMMU2C, DMMU1ABC RM
7.7, 7.6) bis(2-ethylhexyl)phthalate (μg/kg) 148 J 7440 U (DMMU2A RM 7.7) Total LPAH (μg/kg) 163 T 6230 JT (DMMU3D, RM 7.7) Total HPAH (μg/kg) 770 T 2460 T (DMMU2C RM 7.7) Total PCBs (μg/kg) 7.65 JT 189 JT (DMMU3B RM 7.7) 2,3,7,8,-TCDD (ng/kg) na na Total DDx (μg/kg) 2.15 JA 696 JA (DMMU3B RM 7.7 Dibenzofuran (μg/kg) 270 U 2030 U (DMMU3B RM 7.7) 4-Methylphenol (μg/kg) na na Diesel range hydrocarbons (mg/kg) 22.1 UJ 4440 J (DMMU3D RM 7.7) Xylenes (μg/kg) 34.8 UJT 375 UT (DMMU2A RM 7.7)
In 2009 additional surface sediment sampling was conducted to compare current surface sediment conditions to historical sediment data. The 14 sample locations mirrored the 10 locations of the 2008 investigation, with an additional four located slightly farther offshore. Samples were collected using a pneumatic van Veen sampler and the 0–2 cm interval was collected for PCB and TOC analyses.
Summary Data for Surface Samples. Parameter Minimum Maximum (Location) Arsenic (mg/kg) na na Cadmium (mg/kg) na na Copper (mg/kg) na na Lead (mg/kg) na na Mercury (mg/kg) na na Zinc (mg/kg) na na TBT (μg/L) na na bis(2-ethylhexyl)phthalate (μg/kg) na na Total LPAH (μg/kg) na na Total HPAH (μg/kg) na na Total PCBs (μg/kg) 3.9 UT 540 T (DMMU-3B) 2,3,7,8,-TCDD (ng/kg) na na Total DDx (μg/kg) na na Dibenzofuran (μg/kg) na na 4-Methylphenol (μg/kg) na na

Portland Harbor RI/FS Final Remedial Investigation Report
February 8, 2016
A1-114
Parameter Minimum Maximum (Location) Diesel range hydrocarbons (mg/kg) na na Xylenes (μg/kg) na na
WLRASE08. FIELD SAMPLING REPORT FOR THE COLLECTION OF EGGS AND DETERMINATION OF PRODUCITIVITY OF OSPREY NESTING WITHIN THE PORTLAND HARBOR SUPERFUND SITE AND VICINITY (PREPARED BY USGS, OCTOBER 30, 2009; USGS 2009).
This investigation was conducted to facilitate the development of baseline chemical concentrations as part of a long-term post-remediation monitoring program, and to evaluate if the tissue and reproductive data would improve the accuracy of risk estimates for fish-eating birds present in the final risk assessment. This study’s objective is to also help the development of baseline chemical concentrations as part of a long-term monitoring program, to determine if egg residue concentrations exceed injury thresholds, and evaluate the extent of contamination in ospreys nesting outside the Superfund area (study area). The osprey egg sampling event began on May 16, 2008 and was completed by May 28, 2008.
This sampling effort focused on three areas: within the study area (RM 2 to 11), reference area (RM 68 to 79), Multnomah Channel (Sauvie Island Bridge RM 20.5 to RM 1). A fourth area was added immediately upstream of the Superfund site for the productivity surveys, to provide values for comparison to productivity within the superfund area. A total of fifteen eggs were collected from each of the three areas. One egg was randomly collected from five nests within the study area, from five nests within the reference area, and from five nests within Multnomah Channel.
The egg tissue samples were analyzed for: PBDEs (15 congeners including BDE-209), PCB congener (40), dioxins and furans, organochlorine pesticides, mercury, lipid content and percent moisture.
Summary Data for Osprey Egg samples Parameter Minimum Maximum (Location) Arsenic (mg/kg) na na Cadmium (mg/kg) na na Copper (mg/kg) na na Lead (mg/kg) na na Mercury (mg/kg) 0.02 0.15 (W3B RM 3.0) Zinc (mg/kg) na na TBT (µg/L) na na bis(2-ethylhexyl)phthalate (µg/kg) na na Total LPAH (µg/kg) na na Total HPAH (µg/kg) na na Total PCBs (µg/kg) 162 JA 19700 JT (W9B RM 8.5) 2,3,7,8,-TCDD (ng/kg) 1.05 5.95 (W11 RM 10.7)

Portland Harbor RI/FS Final Remedial Investigation Report
February 8, 2016
A1-115
Parameter Minimum Maximum (Location) Total DDx (µg/kg) 300 JA 2800 JA (MC-9 RM 9) Dibenzofuran (µg/kg) na na 4-Methylphenol (µg/kg) na na Diesel range hydrocarbons (mg/kg) na na Xylenes (µg/kg) na na
WLCT4L08. DATA REPORT SEDIMENT CHARACTERIZATION RESULTS FOR TERMINAL 4 PHASE 1 REMOVAL ACTION POST-CONSTRUCTION SAMPLING WLCT4L08. PORT OF PORTLAND, PORTLAND, OREGON (PREPARED BY ANCHOR QEA, AUGUST 2009).
This investigation was conducted to characterize the sediments in Terminal 4 berths following Phase 1 dredging completed in September 2008. Fourteen surface sediments were collected at RM 4.6 in December 2008.
Two samples were collected from the area where sand was placed in Berth 411, eight samples from the rest of the Berth 411 area, two samples from the center square dredge area, and two samples from the Berth 414 area. Sediments were collected using a van Veen sampler, with depths ranging from 0.1 to 0.5 ft. All discrete samples were analyzed for metals, PAHs, and TPH. Four composite samples were analyzed for Aroclors, and DDx compounds.
Summary of Terminal 4 Post-Construction Surface Sediments. Parameter Minimum Maximum (Location) Arsenic (mg/kg) na na Cadmium (mg/kg) 0.0705 U 8.36 (T4IM09 RM 4.6) Copper (mg/kg) na na Lead (mg/kg) 1.1 J 1850 J (T4IM09 RM 4.6) Mercury (mg/kg) na na Zinc (mg/kg) 3.68 J 1300 J (T4IM09 RM 4.6) TBT (µg/kg) na na Bis(2-ethylhexyl) phthalate (µg/kg) 60 U 825 UJ (T4IM09 RM 4.6) Total LPAH (µg/kg) 11.4 JT 36218 JT (T4IM09 RM 4.6) Total HPAH (µg/kg) 262.7 JA 330370 JA (T4IM09 RM 4.6) Total PCBs (µg/kg) 3.78 UT 36.25 T (T4IMC03 RM 4.6) 2,3,7,8-TCDD (pg/g) na na Total DDx (µg/kg) 0.897 UT 24.2 JT (T4IMC04 RM 4.6) Dibenzofuran (µg/kg) na na 4-Methylphenol (µg/kg) na na Diesel range hydrocarbons (mg/kg) 1.96 J 565 (T4IM09 RM 4.6) Xylenes (µg/kg) na na

Portland Harbor RI/FS Final Remedial Investigation Report
February 8, 2016
A1-116
WLCPWL09. SEDIMENT CHARACTERIZATION REPORT CONOCOPHILLIPS PIPE LINE COMPANY PORTLAND TERMINAL MARINE DOCK AT RIVER MILE 7.8, PORTLAND, OR (PREPARED BY AMEC EARTH & ENVIRONMENTAL INC., APRIL 2010).
This investigation characterizes sediment at two berthing areas at the Portland Terminal (RM 7.8) site prior to maintenance dredging, to ensure safe navigation and restore adequate operating depths as part of the permit application process for maintenance dredging. This investigation was conducted from December 29–30, 2009, with the collection of 14 discrete vibracores samples from nine separate locations
Sediment samples were collected using a 4-inch diameter stainless steel tube connected to a stainless steel cutter head. The aluminum-encased vibrating unit used a 240-volt, 3-phase, 26-amp power source to drive two outer-rotating vibrators. Fourteen discrete vibracore samples were collected from nine locations along the Portland Terminal’s marine dock, which is located northeast of Tank Farm 2, across from NW Front Avenue. Core penetration depth was calculated using a measuring tape on the steel cable connecting the head of the vibracorer to the winch. At the six upriver and downriver dredge prism sampling locations, two collection attempts were required to obtain sufficient quantities of sediment for analytical testing.
Analysis of subsurface samples included the conventional parameters of total solids, total sulfide, ammonia, total organic carbon, and grain size distribution, and chemical parameters including metals, organotins, diesel-range hydrocarbons, PAHs, chlorinated hydrocarbons, phthalates, phenols, pesticides, PCBs for all samples collected.
Summary Data for Subsurface Samples Parameter Minimum Maximum (Location) Arsenic (mg/kg) 3.49 4.28 (APS-3 RM 7.7) Cadmium (mg/kg) 0.239 0.592 (URB-2 RM 7.7) Copper (mg/kg) 38.3 58.9 (URB-2 RM 7.7) Lead (mg/kg) 14.9 41.9 (URB-2 RM 7.7) Mercury (mg/kg) 0.074 J 0.72 J (URB-2 RM 7.7) Zinc (mg/kg) 98.3 208 (URB-2 RM 7.7) TBT (µg/kg) 1.8 UJ 58 J (DRB-2 RM 7.7) bis(2-ethylhexyl)phthalate (µg/kg) 20 J 430 J (APS-2 RM 7.7) Total LPAH (µg/kg) 217 JT 4510 JT (URB-2 RM 7.7) Total HPAH (µg/kg) 841 JT 5410 JT (URB-2 RM 7.7) Total PCBs (µg/kg) 13 JT 106 T (URB-1 RM 7.7) 2,3,7,8,-TCDD (ng/kg) na na Total DDx (µg/kg) 2.07 JA 127 JA (URB-2 RM 7.7) Dibenzofuran (µg/kg) 8.7 J 270 J (URB-2 RM 7.7) 4-Methylphenol (µg/kg) 14 J 230 J (APS-3 RM 7.7) Diesel range hydrocarbons (mg/kg) 120 2200 (URB-2 RM 7.7) Xylenes (µg/kg) na na

Portland Harbor RI/FS Final Remedial Investigation Report
February 8, 2016
A1-117
WLLPGH09. SEDIMENT INVESTIGATION REPORT PORTLAND GAS MANUFACTURING SITE, PORTLAND, OR (PREPARED BY ANCHOR QEA, LLC, DECEMBER 2009).
This investigation was conducted to determine the nature and extent of historical contamination releases to sediment in the Willamette River associated with the former manufactured gas plant operation at the Portland Gas Manufacturing Plant and to determine the extent to which residual upland contamination in soil and/or groundwater may represent a source of risk to human or ecological receptors within the river via groundwater to surface water migration. Field sampling was conducted between August 17 and August 19, 2009.
A total of 12 sediment cores were collected. Additionally, one core was collected and processed at the request of the City of Portland and transferred to the City’s representative. This report discusses results pertaining to only the 12 sediment cores. Sediment cores were collected using a diver-operated impact coring device known as the “Mud Mole”. Core penetration at the 12 locations ranged from 5 to 18 ft below mudline. Each core had a 0 to 1-ft surface interval with the remaining core length sampled in 2-ft intervals. Two field duplicate samples were collected in addition to the 12 sediment cores.
Sediment descriptions were recorded in field note books and core processing forms. Analyses included TPH, PAHs, PCB congeners, hydrocarbons, benzene, toluene, ethylbenzene and xylenes, cyanide, metals, and phenolic compounds. Conventional analyses included TOC, total solids, sulfides, and grain size.
Summary Data for Subsurface Samples Parameter Minimum Maximum (Location) Arsenic (mg/kg) 1.47 5.8 (PGC-03 RM 12.2) Cadmium (mg/kg) 0.067 3.02 J (PGC-03RM 12.2) Copper (mg/kg) 15.7 457 (PGC-05 RM 12.1) Lead (mg/kg) 3.23 J 1380 (PGC-07 RM 12.1) Mercury (mg/kg) 0.015 J 3.3 JT (PGC-05RM 12.1) Zinc (mg/kg) 44.6 11100 J (PGC-06RM 12.1) TBT (µg/L) na na bis(2-ethylhexyl)phthalate (µg/kg) na na Total LPAH (µg/kg) 5.01 JT 3030000 T (PGC-05 RM 12.1) Total HPAH (µg/kg) 1.5 UT 1950000 T (PGC-06 RM 12.1) Total PCBs (µg/kg) na na 2,3,7,8,-TCDD (ng/kg) na na Total DDx (µg/kg) na na Dibenzofuran (µg/kg) na na 4-Methylphenol (µg/kg) 4.1 J 8300 UJ (PGC-06RM 12.1) Diesel range hydrocarbons (mg/kg) 12 U 19000 (PGC-06RM 12.1) Xylenes (µg/kg) 0.28 JT 86000 T (PGC-06 RM 12.1)

Portland Harbor RI/FS Final Remedial Investigation Report
February 8, 2016
A1-118
WLCPSK09. SEDIMENT CHRARACTERIZATION REPORT PORTLAND SHIP REPAIR YARD PORTLAND, OR (PREPARED BY ERM-WEST INC., PORTLAND, OR).
This sediment investigation was conducted to characterize sediment that will be dredged and removed for off-site removal and to characterize the newly exposed sediment following completion of dredging activities. The sampling event took place from November 10 to 18, 2009 at the Portland Ship Repair Yard, Portland, Oregon.
The sediment core samples were collected by a boat-mounted vibracoring device with 4-inch aluminum tubes. A total of 22 sediment cores and two field duplicates were collected. Within each DMMU area, samples were collected (DMMU layers A and B) to characterize the proposed dredge material, and from DMMU Layer Z, to characterize the newly exposed sediment surface after dredging. All samples were analyzed for the following conventional parameters: grain size, total solids, TOC, ammonia and total sulfides. All samples were analyzed for the following chemical parameters: total metals, PAHs, TVS, pesticides and TBT. Bioassays were conducted for all DMMU Layer Z samples.
Summary Data for Subsurface Samples Parameter Minimum Maximum (Location) Arsenic (mg/kg) 3.4 8.95 (DMMU1 RM 8.2) Cadmium (mg/kg) 0.1 0.338 (DMMU1 RM 8.2) Copper (mg/kg) 54.3 596 (DMMU5 RM 8.1) Lead (mg/kg) 9.85 118 (DMMU1 RM 8.2) Mercury (mg/kg) 0.057 0.293 (DMMU1 RM 8.2) Zinc (mg/kg) 86 368 (DMMU5 RM 8.1) TBT (µg/kg) 41 6500 J (DMMU5 RM 8.1) bis(2-ethylhexyl)phthalate (µg/kg) 40 J 3000 (DMMU5 RM 8.1) Total LPAH (µg/kg) 36.5 JT 12000 T (DMMU1 RM 8.2) Total HPAH (µg/kg) 134 JT 30800 T (DMMU1 RM 8.2) Total PCBs (µg/kg) 4.7 UT 380 T (DMMU1 RM 8.2) 2,3,7,8,-TCDD (ng/kg) na na Total DDx (µg/kg) 1.57 JA 53.6 A (DMMU1 RM 8.2) Dibenzofuran (µg/kg) 1.4 J 490 (DMMU1 RM 8.2) 4-Methylphenol (µg/kg) 1.5 U 15 U (DMMU1 RM 8.2) Diesel range hydrocarbons (mg/kg) na na Xylenes (µg/kg) na na
RM11E. SURFACE AND SUBSURFACE SEDIMENT FIELD AND DATA REPORT RIVER MILE 11 EAST FOCUSED SEDIMENT CHARACTERIZATION, PORTLAND, OR (PREPARED BY GSI WATER SOLUTIONS, INC., AUGUST 2009).
This sediment investigation was conducted to further characterize surface and subsurface sediment and gain a better understanding of the extent of PCBs and other COIs along the east

Portland Harbor RI/FS Final Remedial Investigation Report
February 8, 2016
A1-119
side of the Willamette River between RM 11.0 and 12.1. Sediment sampling was conducted between May 4 and June 26, 2009.
A total of 60 surface sediment and 50 subsurface stations were sampled. Surface sediment samples were collected with a power grab. Of the 60 surface sediment samples, 38 were submitted to the laboratory for analysis of the full analyte suite and 20 were for the partial analyte suite. Samples from two surface sample locations (RM11E-G052, RM11E-G060) were not analyzed because of the absence of sufficient fine-grained material upon inspection at the lab. Subsurface sediment samples were collected with a vibracorer. The length of the cores ranged from 3 to 14.3 ft and were divided into predetermined depth intervals: A (0 to 1 ft), B (1 to 3 ft), C (3 to 5 ft), D (5 to 7 ft), E (7 to 10 ft), F (10 to 13 ft), and G (13 to 15 ft). Sediments from the “A” interval, “E” interval, and “F” interval were submitted for archival storage at the laboratory. The remaining three core intervals (B, C, and D) were collected for analysis of the primary target analytes. In addition, at 21 of the core stations, sediment from one or more of the depth intervals was selected for more comprehensive chemical analysis. The core interval exhibiting the highest level of visible contamination was selected for the more comprehensive chemical testing. If no core intervals had signs of contamination, the B interval was selected for the full analyte suite.
Sediment samples were submitted for analysis for the partial analyte group and the full analyte group. The partial analyte group consisted of PCB Aroclors, total solids and TOC. The full analyte group consisted of PCB Aroclors, total solids, TOC, grain size, metals, PAHs, SVOCs, TPH, phenols, organochlorine pesticides, dioxins/furans and butyltins.
Summary Data for Surface Sediment Samples Parameter Minimum Maximum (Location) Arsenic (mg/kg) 1.4 7.6 (G029 RM 11.3) Cadmium (mg/kg) 0.079 J 0.413 (G029 RM 11.3) Copper (mg/kg) 14.7 82.3 (G029 RM 11.3) Lead (mg/kg) 10.8 466 (G005 RM 11.1) Mercury (mg/kg) 0.013 0.1 (G015 RM 11.1) Zinc (mg/kg) 46 287 (G029 RM 11.3) TBT (µg/kg) 0.61 U 87 (G005 RM 11.1) bis(2-ethylhexyl)phthalate (µg/kg) 16 J 2100 (G005 RM 11.1) Total LPAH (µg/kg) 7.07 JT 763 T (G026 RM 11.3) Total HPAH (µg/kg) 81.2 JT 2280 T (G048 RM 11.5) Total PCBs (µg/kg) 1 UT 2800 JT (G009 RM 11.1) 2,3,7,8,-TCDD (ng/kg) 0.0393 U 1.63 J (G033 RM 11.4) Total DDx (µg/kg) 0.16 T 179 T (G036 RM 11.4) Dibenzofuran (µg/kg) 0.59 U 34 (C010-R2 RM 11.1) 4-Methylphenol (µg/kg) 1.5 U 370 (G043 RM 11.4) Diesel range hydrocarbons (mg/kg) 13 U 1700 J (C010-R2 RM 11.1) Xylenes (µg/kg) na na

Portland Harbor RI/FS Final Remedial Investigation Report
February 8, 2016
A1-120
Summary Data for Subsurface Sediment Samples Parameter Minimum Maximum (Location) Arsenic (mg/kg) 1.6 J 21.7 JT (C025 RM 11.3) Cadmium (mg/kg) 0.039 J 1.05 JT (C019 RM 11.3) Copper (mg/kg) 10.5 J 268 JT (C025 RM 11.3) Lead (mg/kg) 1.81 J 904 (C047 RM 11.3) Mercury (mg/kg) 0.013 1.47 (C048-R1 RM 11.2) Zinc (mg/kg) 26.6 J 420 J (C003 RM 11.1) TBT (µg/kg) 0.46 U 31 (C038 RM 11.4) bis(2-ethylhexyl)phthalate (µg/kg) 7 U 510 (C003 RM 11.1) Total LPAH (µg/kg) 0.75 UT 21500 T (C048-R1 RM 11.2) Total HPAH (µg/kg) 0.64 UT 5320 T (C048-R1 RM 11.2) Total PCBs (µg/kg) 1 UT 6200 T (C019 RM 11.3) 2,3,7,8,-TCDD (ng/kg) 0.0194 U 3.06 (C048-R1 RM 11.2) Total DDx (µg/kg) 0.069 T 230 JT (C019 RM 11.3) Dibenzofuran (µg/kg) 0.59 U 860 (C048-R1 RM 11.2) 4-Methylphenol (µg/kg) 1.5 U 390 (C003 RM 11.1) Diesel range hydrocarbons (mg/kg) 2.3 JT 1900 J (C003 RM 11.1) Xylenes (µg/kg) na na
RM11E_BD. BANK SOIL AND DEBRIS FIELD AND DATA REPORT RIVER MILE 11 EAST FOCUSED SEDIMENT CHRACTERIZATION, PORTLAND, OR (PREPARED BY GSI WATER SOLUTIONS, INC. JUNE 2010).
This investigation provides results of river bank soil and debris sampling efforts conducted along the east side of the Willamette River between RM 11.1 and 11.6. Sampling activities were conducted on September 22 and 23 and then on October 27, 2009. The results of the surface and subsurface sediment characterization were considered in determining the locations of the bank samples.
Bank soil and debris samples were collected from a total of 27 locations. Bank samples were collected as either discrete grab samples or multipoint composite samples with a maximum of five points per composite. Each multipoint composite sample was collected within a 10-ft radius. Sample penetration depths ranged from 5 to 25 cm. Samples were collected with shovels, hand augers, saws and other hardware that worked in collecting difficult to sample soils amidst the armored and unarmored river banks.
Soil samples were analyzed for PCB Aroclors, total solids and TOC. Three soil samples were submitted for an additional set of conventional and chemical parameters: metals, PAH, SVOC, TPH, phenols, organochlorine pesticides, dioxins/furans, and butyltins.
Summary Data for Bank Soil Samples Parameter Minimum Maximum (Location) Arsenic (mg/kg) 4.05 JT 4.85 (BDSL017 RM 11.3)
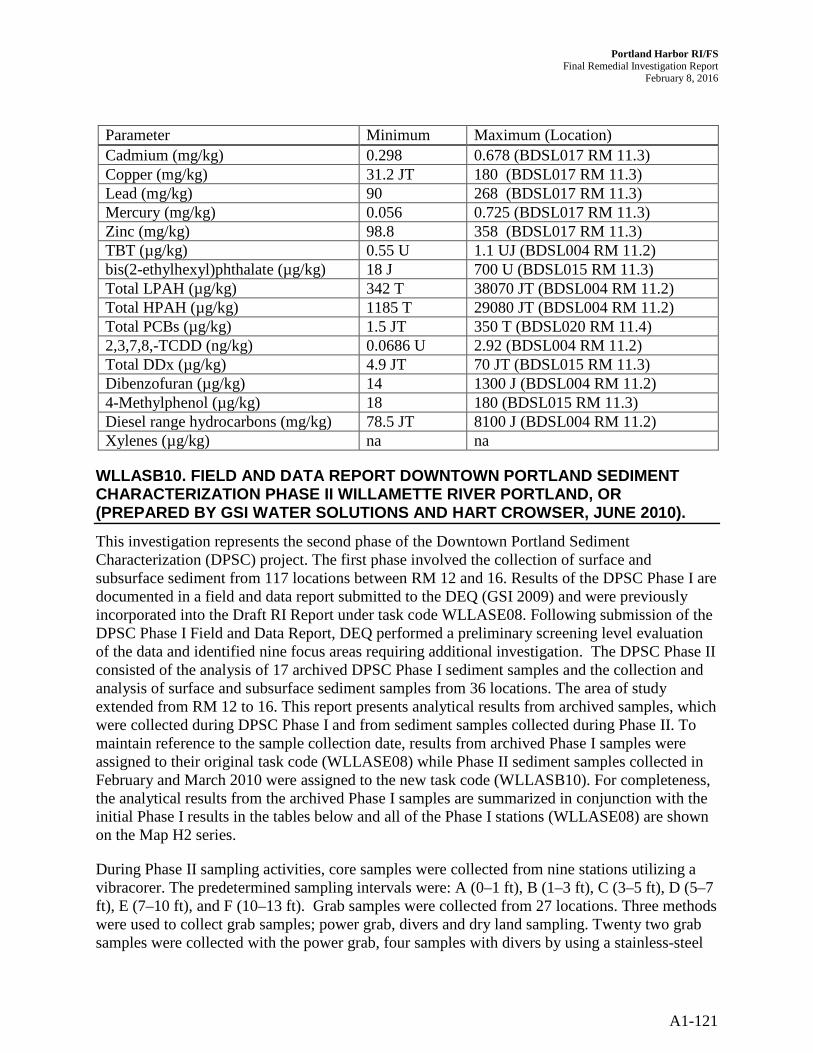
Portland Harbor RI/FS Final Remedial Investigation Report
February 8, 2016
A1-121
Parameter Minimum Maximum (Location) Cadmium (mg/kg) 0.298 0.678 (BDSL017 RM 11.3) Copper (mg/kg) 31.2 JT 180 (BDSL017 RM 11.3) Lead (mg/kg) 90 268 (BDSL017 RM 11.3) Mercury (mg/kg) 0.056 0.725 (BDSL017 RM 11.3) Zinc (mg/kg) 98.8 358 (BDSL017 RM 11.3) TBT (µg/kg) 0.55 U 1.1 UJ (BDSL004 RM 11.2) bis(2-ethylhexyl)phthalate (µg/kg) 18 J 700 U (BDSL015 RM 11.3) Total LPAH (µg/kg) 342 T 38070 JT (BDSL004 RM 11.2) Total HPAH (µg/kg) 1185 T 29080 JT (BDSL004 RM 11.2) Total PCBs (µg/kg) 1.5 JT 350 T (BDSL020 RM 11.4) 2,3,7,8,-TCDD (ng/kg) 0.0686 U 2.92 (BDSL004 RM 11.2) Total DDx (µg/kg) 4.9 JT 70 JT (BDSL015 RM 11.3) Dibenzofuran (µg/kg) 14 1300 J (BDSL004 RM 11.2) 4-Methylphenol (µg/kg) 18 180 (BDSL015 RM 11.3) Diesel range hydrocarbons (mg/kg) 78.5 JT 8100 J (BDSL004 RM 11.2) Xylenes (µg/kg) na na
WLLASB10. FIELD AND DATA REPORT DOWNTOWN PORTLAND SEDIMENT CHARACTERIZATION PHASE II WILLAMETTE RIVER PORTLAND, OR (PREPARED BY GSI WATER SOLUTIONS AND HART CROWSER, JUNE 2010).
This investigation represents the second phase of the Downtown Portland Sediment Characterization (DPSC) project. The first phase involved the collection of surface and subsurface sediment from 117 locations between RM 12 and 16. Results of the DPSC Phase I are documented in a field and data report submitted to the DEQ (GSI 2009) and were previously incorporated into the Draft RI Report under task code WLLASE08. Following submission of the DPSC Phase I Field and Data Report, DEQ performed a preliminary screening level evaluation of the data and identified nine focus areas requiring additional investigation. The DPSC Phase II consisted of the analysis of 17 archived DPSC Phase I sediment samples and the collection and analysis of surface and subsurface sediment samples from 36 locations. The area of study extended from RM 12 to 16. This report presents analytical results from archived samples, which were collected during DPSC Phase I and from sediment samples collected during Phase II. To maintain reference to the sample collection date, results from archived Phase I samples were assigned to their original task code (WLLASE08) while Phase II sediment samples collected in February and March 2010 were assigned to the new task code (WLLASB10). For completeness, the analytical results from the archived Phase I samples are summarized in conjunction with the initial Phase I results in the tables below and all of the Phase I stations (WLLASE08) are shown on the Map H2 series.
During Phase II sampling activities, core samples were collected from nine stations utilizing a vibracorer. The predetermined sampling intervals were: A (0–1 ft), B (1–3 ft), C (3–5 ft), D (5–7 ft), E (7–10 ft), and F (10–13 ft). Grab samples were collected from 27 locations. Three methods were used to collect grab samples; power grab, divers and dry land sampling. Twenty two grab samples were collected with the power grab, four samples with divers by using a stainless-steel

Portland Harbor RI/FS Final Remedial Investigation Report
February 8, 2016
A1-122
spoon and a cellulose acetate butyrate tube, and one sample was collected on dry land (due to low river levels) using a stainless-steel spoon and transferred to a stainless-steel bowl. Field activities were documented through sample description logs, photographs and field notebooks.
Physical characteristics of the sediment were described and recorded on sample collection forms. Five stations were identified for biological testing. Sediment samples were analyzed for conventional parameters, PCB Aroclors, pesticides, metals, and PAHs. A subset of sediment samples was analyzed for one or more of the following additional analytes: TPH (diesel-range and oil-range hydrocarbons), dioxin/furans, grain size distribution, ammonia, and sulfides.
Summary Data for Phase I Surface Samples Collected during DPSC Phase I (WLLASE08) Parameter Minimum Maximum (Location) Arsenic (mg/kg) 1.19 126 (G006 RM 12.9) Cadmium (mg/kg) 0.03 J 1.7 (G059 RM 12.4) Copper (mg/kg) 9.52 264 (G006 RM 12.9) Lead (mg/kg) 2.93 J 428 J (G006 RM 12.9) Mercury (mg/kg) 0.007 29.2 J (C029 RM 12.6) Zinc (mg/kg) 29.9 J 858 (G006 RM 12.9) TBT (µg/kg) 0.06 U 1700 JT (G005 RM 12.8) bis(2-ethylhexyl)phthalate (µg/kg) 7 U 2300 (G007 RM 13) Total LPAH (µg/kg) 0.57 JT 14400 T (G003 RM 12.5) Total HPAH (µg/kg) 0.64 UT 25900 T (G003 RM 12.5) Total PCBs (µg/kg) 1 UT 420 JT (G048 RM 13.1) 2,3,7,8,-TCDD (ng/kg) 0.00918 U 0.474 J (G048 RM 13.1) Total DDx (µg/kg) 0.047 JT 73.3 JT (G048 RM 13.1) Dibenzofuran (µg/kg) 0.59 U 290 (G003 RM 12.5) 4-Methylphenol (µg/kg) 1.5 U 260 (G048 RM 13.1) Diesel range hydrocarbons (mg/kg) na na Xylenes (µg/kg) na na
Summary Data for Phase I Subsurface Samples Collected during DPSC Phase I (WLLASE08)
Parameter Minimum Maximum (Location) Arsenic (mg/kg) 1.08 7.18 (C011 RM 14.5) Cadmium (mg/kg) 0.051 1.04T (C031 RM 12.1) Copper (mg/kg) 14.8 56.4 (C034 RM 14) Lead (mg/kg) 2.36 J 371 JT (C031 RM 12.1) Mercury (mg/kg) 0.012 1.58 (C037 RM 14.2) Zinc (mg/kg) 34.6 218 T (C031 RM 12.1) TBT (µg/kg) 0.067 U 23 (C004 RM 13.3) bis(2-ethylhexyl)phthalate (µg/kg) 7 U 3800 (C032 RM 15.8) Total LPAH (µg/kg) 0.45 JT 5170 JT (C024 RM 13.3) Total HPAH (µg/kg) 0.28 JT 6040 T (C020 RM 13.8) Total PCBs (µg/kg) 1 UT 610 T (C022 RM 13.5) 2,3,7,8,-TCDD (ng/kg) 0.0171 U 0.56 J (C022 RM 13.5)

Portland Harbor RI/FS Final Remedial Investigation Report
February 8, 2016
A1-123
Parameter Minimum Maximum (Location) Total DDx (µg/kg) 0.052 JT 73.1 JT (C031 RM 12.1) Dibenzofuran (µg/kg) 0.59 U 100 (C029 RM 12.6) 4-Methylphenol (µg/kg) 1.5 U 330 (C024 RM 13.3) Diesel range hydrocarbons (mg/kg) na na Xylenes (µg/kg) 4000 UT 6700 UT (C035 RM 14.1)
Summary Data for Surface Samples Collected during Phase II (WLLASB10)
Parameter Minimum Maximum (Location) Arsenic (mg/kg) 1.15 61.5 (G094 RM 12.9) Cadmium (mg/kg) 0.056 0.857 (C090 RM 12.7) Copper (mg/kg) 10.7 366 (G094 RM 12.9) Lead (mg/kg) 3.76 J 457 (G094 RM 12.9) Mercury (mg/kg) 0.014 0.21 (C090 RM 12.7) Zinc (mg/kg) 37.6 1450 (G094 RM 12.9) TBT (µg/kg) 0.58 U 43 (G092 RM 12.8) bis(2-ethylhexyl)phthalate (µg/kg) na na Total LPAH (µg/kg) 0.72 JT 1970 T (C087 RM 12.1) Total HPAH (µg/kg) 3.1 JT 30100 T (C087 RM 12.1) Total PCBs (µg/kg) 1.3 UT 330 T (G086 RM 12.1) 2,3,7,8,-TCDD (ng/kg) 0.0896 U 0.312 J (C090 RM 12.7) Total DDx (µg/kg) 0.051 JT 72.2 JT (C090 RM 12.7) Dibenzofuran (µg/kg) na na 4-Methylphenol (µg/kg) na na Diesel range hydrocarbons (mg/kg) 5.51 JT 760 J (C090 RM 12.7) Xylenes (µg/kg) na na
Summary Data for Subsurface Samples Collected during Phase II (WLLASB10)
Parameter Minimum Maximum (Location) Arsenic (mg/kg) 1.34 3.75 J (C041 RM 12.4) Cadmium (mg/kg) 0.058 0.507 (C086 RM 12.1) Copper (mg/kg) 13.1 38.4 T (C100 RM 13.6) Lead (mg/kg) 3.4 459 (C086 RM 12.1) Mercury (mg/kg) 0.015 J 0.646 T (C100 RM 13.6) Zinc (mg/kg) 50.7 163 T (C100 RM 13.6) TBT (µg/kg) 0.64 U 1.2 (C095 RM 12.9) bis(2-ethylhexyl)phthalate (µg/kg) na na Total LPAH (µg/kg) 34.1 JT 371 T (C095 RM 12.9) Total HPAH (µg/kg) 42.1 JT 5480 T (C086 RM 12.1) Total PCBs (µg/kg) 1.3 UT 147 T (C086 RM 12.1) 2,3,7,8,-TCDD (ng/kg) 0.0912 J 0.17 J (C095 RM 13.0) Total DDx (µg/kg) 0.139 JT 22.1 JT (C086 RM 12.1) Dibenzofuran (µg/kg) na na

Portland Harbor RI/FS Final Remedial Investigation Report
February 8, 2016
A1-124
Parameter Minimum Maximum (Location) 4-Methylphenol (µg/kg) na na Diesel range hydrocarbons (mg/kg) 11.5 T 265 JT (C100 RM 13.6) Xylenes (µg/kg) na na
WLLGEC10. DATA REPORT PORTLAND GENERAL ELECTRIC WILLAMETTE RIVER SEDIMENT INVESTIGATION RIVER MILES 13.1 AND 13.5, PORTLAND, OR (PREPARED BY URS, JUNE 16, 2010).
This investigation was conducted to address two of DEQ’s recommended Focus Areas through the collection and analysis of additional surface and subsurface sediment samples in the vicinity of the Outfall 33 Area (RM13.1) and Imman-Poulsen Cove (RM 13.5.). Field work was conducted between March 5 and March 12, 2010.
Nineteen surface sediment stations in the RM 13.1 and RM 13.5 areas were collected by divers using an aluminum core barrel with a polycarbonate core liner and stainless-steel core catcher. Sediment cores were successfully collected from seven stations in the RM 13.1 area and seven in the RM 13.5 area. During the subsurface sediment sampling, the maximum recorded penetration depth was 10.7 ft below sediment surface (bss), and the average penetration depth at all fourteen stations was 4.9 ft. The seven cores collected from RM 13.1 area were sectioned into predetermined sample intervals: “A” section 0 to 1 ft bss, “B” section 1 to 3 ft. The seven cores from the RM 13.5 area did not have predetermined sample intervals; instead sample intervals were based on observed lithology.
Physical characteristics of sediment samples were described and recorded on field data forms. Analyses included: two conventional parameters (total solids and TOC), chemical parameters including metals, PAHs, PCBs as Aroclors, TPH (diesel-range and oil-range hydrocarbons), pesticides and selected samples for dioxins and furans.
In July 2010, after reviewing the data from the March 2010 sampling event, URS collected four additional beach soil samples and selected the uppermost section from five sediment cores (O33-C005, O33-C008, O33-C013, IPC-C014, and IPC-C019) for follow-up laboratory analysis. These results were not available prior to the new RI data lockdown date and have not been incorporated into this revised RI Report.
Summary Data for Surface Samples Parameter Minimum Maximum (Location) Arsenic (mg/kg) 1.25 30.7 (O33-S009 RM 13.1) Cadmium (mg/kg) 0.033 0.39 (O33-S009 RM 13.1) Copper (mg/kg) 8.39 111 (O33-S009 RM 13.1) Lead (mg/kg) 1.57 J 70.2 J (O33-S010 RM 13.1) Mercury (mg/kg) 0.005 J 0.111 (O33-S010 RM 13.1) Zinc (mg/kg) 22.8 289 (O33-S009 RM 13.1) TBT (µg/L) na na

Portland Harbor RI/FS Final Remedial Investigation Report
February 8, 2016
A1-125
Parameter Minimum Maximum (Location) bis(2-ethylhexyl)phthalate (µg/kg) na na Total LPAH (µg/kg) 0.71 JT 465 JT (IPC-S014 RM 13.5) Total HPAH (µg/kg) 0.980 UT 2040 T (O33-S009 RM 13.1) Total PCBs (µg/kg) 2.10 UT 360 T (O33-S010 RM 13.1) 2,3,7,8,-TCDD (ng/kg) 0.083 U 0.549 U (O33-S010 RM 13.1) Total DDx (µg/kg) 0.15 JT 38.5 JT (O33-S010 RM 13.1) Dibenzofuran (µg/kg) na na 4-Methylphenol (µg/kg) na na Diesel range hydrocarbons (mg/kg) 2.10 U 230 (IPC-S013 RM 13.5) Xylenes (µg/kg) na na
Summary Data for Subsurface Samples
Parameter Minimum Maximum (Location) Arsenic (mg/kg) 0.57 6.09 (IPC-C012 RM 13.4) Cadmium (mg/kg) 0.03 0.638 (IPC-C014 RM 13.5) Copper (mg/kg) 9.9 44.5 (O33-C005 RM 13.1) Lead (mg/kg) 1.35 J 118 J (O33-C008 RM 13.1) Mercury (mg/kg) 0.005 J 0.615 (O33-C005 RM 13.1) Zinc (mg/kg) 21.4 171 (IPC-C014 RM 13.5) TBT (µg/L) na na bis(2-ethylhexyl)phthalate (µg/kg) na na Total LPAH (µg/kg) 1.4 UT 10800 T (IPC-C014 RM 13.5) Total HPAH (µg/kg) 0.980 UT 6070 T (IPC-C014 RM 13.5) Total PCBs (µg/kg) 2.10 UT 530 T (O33-C005 RM 13.1) 2,3,7,8,-TCDD (ng/kg) 0.0487 U 0.213 U (IPC-C019 RM 13.5) Total DDx (µg/kg) 0.064 JT 105 JT (O33-C005 RM 13.1) Dibenzofuran (µg/kg) na na 4-Methylphenol (µg/kg) na na Diesel range hydrocarbons (mg/kg) 12 U 500 (IPC-C014 RM 13.5) Xylenes (µg/kg) na na
RM11E_ST. DRAFT IN-RIVER SEDIMENT TRAP FIELD AND DATA REPORT RIVER MILE 11 EAST FOCUSED SEDIMENT CHARACTERIZATION, PORTLAND, OREGON (PREPARED BY GSI WATER SOLUTIONS INC., JUNE 2010).
This investigation presents the in-river sediment trap sampling associated with the Focused Sediment Characterization along the east side of the Willamette River. Sampling activities consisted of installing seven sediment traps between RM 11 and RM 12.1 in June 2009 and retrieving them in September 2009 to represent settleable suspended sediments deposited during the third quarter of 2009. Following sediment trap recovery, decontaminated sediment traps were immediately redeployed in all seven locations in order to collect settleable suspended sediments during the fourth quarter of 2009.

Portland Harbor RI/FS Final Remedial Investigation Report
February 8, 2016
A1-126
Divers were used to deploy and collect seven in-river sediment traps over the course of third and fourth quarters. Divers retrieved all seven sediment traps during the third quarter of 2009 on September 21-22. Following in the fourth quarter of 2009, six of seven traps were retrieved on January 13 and 14, 2010. Divers attached the sediment trap to a support rod so that the open tops of the sediment trap tubes were approximately 3 ft above the mudline. At each sediment trap location, the collected sediment was homogenized and submitted for analysis for the following physical and chemical parameters: total solids, TOC , grain size (when sufficient volume was available), PCB Aroclors and congeners, metals, PAHs, SVOCs, TPH, phenols, organochlorine pesticides, dioxins/furans, and butyltins.
Summary Data for 3rd and 4th Quarter Sediment Trap Samples Parameter Minimum Maximum (Location) Arsenic (mg/kg) 2.69 4.05 (ST002 RM 11.1) Cadmium (mg/kg) 0.14 0.276 T (ST006 RM 11.8) Copper (mg/kg) 25.4 42.7 (ST006 RM 11.8) Lead (mg/kg) 8.16 30.9 J (ST004 RM 11.5) Mercury (mg/kg) 0.053 0.184 (ST006 RM 11.8) Zinc (mg/kg) 63.4 135 T (ST006 RM 11.8) TBT (µg/kg) 1.3 U 54 (ST001 RM 11) bis(2-ethylhexyl)phthalate (µg/kg) 180 J 920 (ST006 RM 11.8) Total LPAH (µg/kg) 40 JT 328 JT (ST004 RM 11.5) Total HPAH (µg/kg) 215 JT 959 T (ST001 RM 11) Total PCBs (µg/kg) 0.925 JT 549 JT (ST003 RM 11.3) 2,3,7,8,-TCDD (ng/kg) 0.017 U 0.4 J (ST006 RM 11.8) Total DDx (µg/kg) 0.69 T 20.4 JT (ST003 RM 11.3) Dibenzofuran (µg/kg) 2.4 J 30 T (ST004 RM 11.5) 4-Methylphenol (µg/kg) 17 J 33000 (ST001 RM 11) Diesel range hydrocarbons (mg/kg) 33 J 120 J (ST004 RM 11.5) Xylenes (µg/kg) na na

Portland Harbor RI/FS Final Remedial Investigation Report
February 8, 2016
A1-127
REFERENCES
Integral, Windward, Kennedy/Jenks, Anchor, and GSI. 2004. Portland Harbor RI/FS Programmatic Work Plan. Final. Volumes One and Two. Prepared for the Lower Willamette Group, Portland, OR. Integral Consulting Inc., Mercer Island, WA; Windward Environmental LLC, Seattle, WA; Kennedy/Jenks Consultants, Portland, OR; Anchor Environmental L.L.C., Seattle, WA; and Groundwater Solutions Inc., Portland, OR. April 23, 2004.
USACE, USEPA, Ecology, and WDNR. 2000. Dredged Material Evaluation and Disposal Procedures – A User’s Manual for the PSDDA Program. Prepared by the U.S. Army Corps of Engineers, Seattle District, Seattle, WA; U.S. Environmental Protection Agency Region 10, Seattle, WA; Washington State Department of Ecology, Olympia, WA; and Washington State Department of Natural Resources, Olympia, WA.

PORTLAND HARBOR RI/FS
REMEDIAL INVESTIGATION REPORT
APPENDIX A2 DATA EXCLUDED FROM RI DATA SET
(Provided in Separate Database File)
FINAL
February 8, 2016

PORTLAND HARBOR RI/FS
REMEDIAL INVESTIGATION REPORT
APPENDIX A3 SCRA DATABASE AND DATA MANAGEMENT
(SCRA Database Provided in Separate File)
FINAL
February 8, 2016

Portland Harbor RI/FS Final Remedial Investigation Report
February 8, 2016
A3-i
TABLE OF CONTENTS
LIST OF TABLES ........................................................................................................................ II
1.0 INTRODUCTION .............................................................................................................1 1.1 Data Usability ..............................................................................................................1
1.1.1 Elevated Detection Limits .....................................................................................1 1.1.2 N-qualifiers ............................................................................................................1
2.0 SCRA DATABASE ...........................................................................................................3
3.0 DATA MANAGEMENT QA/QC ......................................................................................3 3.1 Calculated totals ..........................................................................................................6
3.1.1 General Summation Rules .....................................................................................6 3.1.2 Individual Analytes in Calculated Totals ...............................................................6
3.2 Field Replicates ...........................................................................................................9 3.3 Organic Carbon Normalization .................................................................................10 3.4 SIGNIFICANT FIGURES ........................................................................................10
4.0 RI DATA SET ..................................................................................................................10
5.0 BHHRA DATA SET ........................................................................................................ 11
6.0 BERA DATA SET ........................................................................................................... 11
7.0 QUERY MANAGER™ DATABASE ............................................................................. 11
REFERENCES ............................................................................................................................14
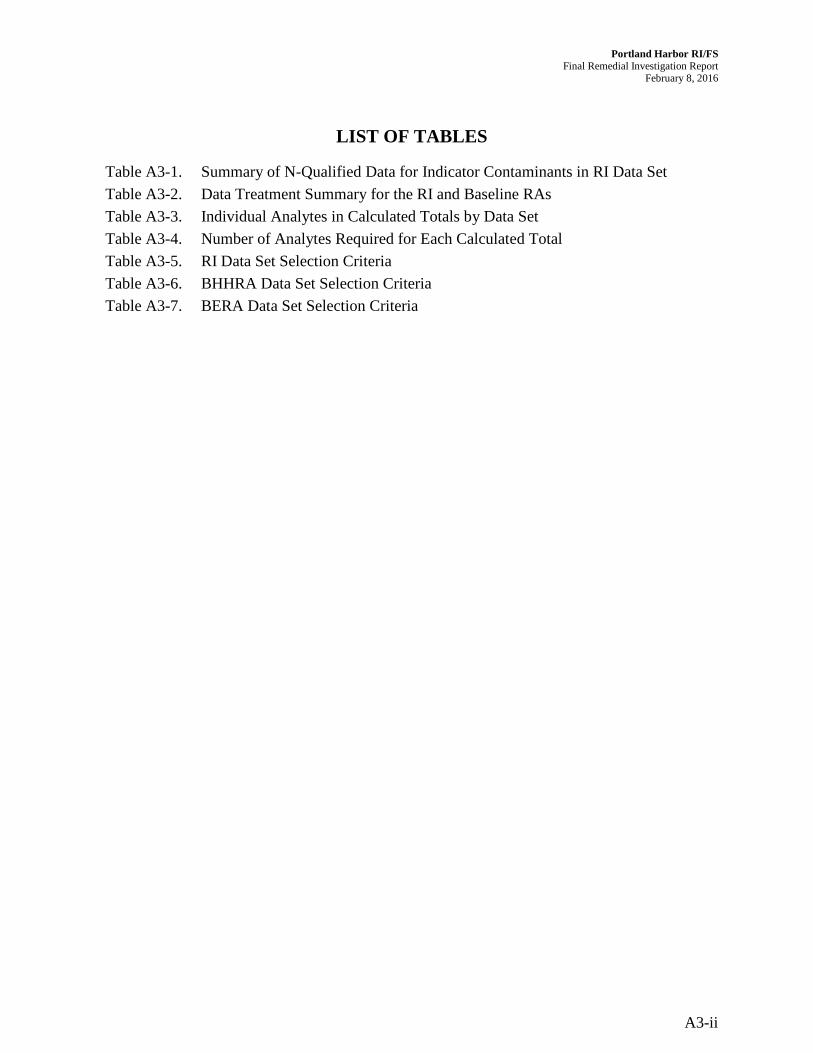
Portland Harbor RI/FS Final Remedial Investigation Report
February 8, 2016
A3-ii
LIST OF TABLES
Table A3-1. Summary of N-Qualified Data for Indicator Contaminants in RI Data Set Table A3-2. Data Treatment Summary for the RI and Baseline RAs Table A3-3. Individual Analytes in Calculated Totals by Data Set Table A3-4. Number of Analytes Required for Each Calculated Total Table A3-5. RI Data Set Selection Criteria Table A3-6. BHHRA Data Set Selection Criteria Table A3-7. BERA Data Set Selection Criteria

Portland Harbor RI/FS Final Remedial Investigation Report
February 8, 2016
A3-1
1.0 INTRODUCTION This appendix presents the site characterization and risk assessment (SCRA) database and the data usability issues, quality assurance/quality control checks, and the selection criteria for the remedial investigation (RI), baseline human health risk assessment (BHHRA), and baseline ecological risk assessment (BERA) data sets. A brief discussion of the U.S. Environmental Protection Agency’s (USEPA) Query Manager™ is also provided.
1.1 DATA USABILITY
As discussed in Section 2.2 of the RI, the principal issues related to the usability of historical and current data include data quality, sediment stability over time, and the intended use of the data. All of these factors must be acceptable for data to be considered usable. This section describes some of the more commonly encountered, and perhaps most consequential, data usability issues for the Portland Harbor Remedial Investigation and Feasibility Study (RI/FS)—elevated detection limits for non-detected chemical concentration data and N-qualified chemical concentration data.
1.1.1 Elevated Detection Limits The historical database for Portland Harbor contains some samples with non-detected concentrations of constituents at high detection limits. From a purely analytical perspective, USEPA categorizes all data meeting proper quality assurance and quality control (QA/QC) procedures, regardless of detection limit level, as Category 1 (i.e., data of known quality and considered acceptable for use). However, the acceptability of these data is dependent on their specific use. For example, in the absence of other data, elevated detections limits may provide insight on the need for additional analyses for which lower detection limits are achievable. From a data-needs standpoint, however, these same data may not be useful because if inappropriately compared to a concentration benchmark, they could unnecessarily result in the perceived need for additional sampling and analysis (despite their attendant uncertainty in actual concentration). From a predictive risk assessment perspective, these data are recommended by USEPA to be excluded from formal risk quantification because of their uncertainty in concentration (USEPA 1989). From an applied engineering and feasibility standpoint, elevated detections limits are also not useful because they are not capable of defining with precision actual chemical concentration data that can be used to set boundaries for remedy considerations.
1.1.2 N-qualifiers N-qualified data present another situation that requires evaluation in the context of data use. N-qualified data in the RI data set are identified and used in the RI and risk assessments with recognition of the potential limitations associated with using this data

Portland Harbor RI/FS Final Remedial Investigation Report
February 8, 2016
A3-2
noted below.1 The N-qualifier denotes that the identity of the analyte is presumptive and not definitive, generally as a result of the presence in the sample of an analytical interference, such as hydrocarbons or, in the case of pesticides, polychlorinated biphenyls (PCBs). Data that are N-qualified meet the primary identification criteria of the method; however, the confirmation criteria are not met and the identification is potentially a false positive. In addition to uncertainty regarding chemical identification, N-qualified data also indicate some uncertainty in the reported concentration level (USEPA 1989). The degree of attendant uncertainty in both identification and concentration is commonly assessed on a sample-by-sample basis.
Given the uncertainty associated with N-qualified data, as well as the varying extent of this uncertainty, users must carefully weigh the impacts of their use throughout the RI/FS process. This careful attention is fully consistent with USEPA guidance and other data-use guidance documents recommending the use of N-qualified data only on a case-by-case basis. The rationale for this is that data are evaluated and used in different ways throughout the RI/FS process. Provided below are some examples of how intended use of N-qualified data could vary:
• Nature and Extent. In nature and extent determinations, evaluations of data are generally predicated on individual, point-by-point analytical results (e.g., determining the individual chemical concentration results at various sample locations as opposed to calculating a mean across those samples). In instances when N-qualified data are spatially accompanied by data of more certain chemical identification and concentration, the role of N-qualified data is likely limited. This is often the case for Portland Harbor, where there exists an abundance and wide distribution of data for sediment, surface water, and biota that are not N-qualified. The number and percentage of N-qualified data for the nature and extent indicator contaminants (see RI Section 5.0) for all media are summarized in Table A3-1 and details are provided in data reports and site characterization summary reports for the various sampling tasks.
• Risk Assessment. N-qualified data are present in the database, and USEPA requested that these data be included in the risk assessments. USEPA (1989) recognizes that while uncertainty in both chemical identity and chemical concentration exists for N-qualified data, their use in risk assessment is judged on a case-by-case basis. N qualification indicates “the presence of an analyte that has been ‘tentatively identified,’ and the associated numerical value represents its approximate concentration” (USEPA 1999). The qualification indicates that the analyst believed that the result was caused by analytical interference from a chemical other than the target analyte. All N-qualified
1 Consistent with Risk Assessment Guidance for Superfund Part A (USEPA 1989), N-qualified data were included
in the data set used for risk assessment, as documented here.

Portland Harbor RI/FS Final Remedial Investigation Report
February 8, 2016
A3-3
results are therefore biased high for organochlorine pesticides and may result in an overestimation of risk.
2.0 SCRA DATABASE Integral’s LWG project database contains all of the data reported by the analytical laboratories. This includes field and lab replicates, lab dilutions, results for the same analyte from multiple analytical methods (SW8270 and SW8270-SIM, for example), and laboratory QA samples such as matrix spikes, surrogates, and method blanks. The data handling rules described in Guidelines for Data Averaging and Treatment of Non-detected Values for the Round 1 Database (Kennedy/Jenks et al. 2004) were used to create a data set for the SCRA data users that was simpler; the data set contained only one result per analyte per sample and excluded all of the laboratory QA results. This involved creating a SCRA database that excluded lab QA results, contained only the most appropriate dilution result and analytical method for each analyte, and contained the average of laboratory replicates. For purposes of reporting, both LWG data and data collected by other parties were combined into one SCRA database. Guidelines provided in Kennedy/Jenks et al. (2004) were consistently applied to all data sets. The resulting SCRA database is provided on a CD accompanying this appendix, and reflects a data lockdown date of July 19, 2010.
3.0 DATA MANAGEMENT QA/QC QA/QC checks were made throughout the LWG’s data management process. The data management team, composed of database managers and chemists, performed checks of accuracy and completeness in two separate databases. Analytical data are stored in EQuIS, a relational Microsoft Access-based software system. Each participating laboratory sent data in EQuIS-compatible electronic data deliverables (EDDs) to both the database manager and the data validator. Checks began at that point, as listed in the table below, and again later when the database manager updated the database with the validator’s revised EDD. At the same time, a sample tracking database developed in Access monitored data flow and sample analytical completeness. Data collected by other parties was received either in hardcopy or in electronic format. Because some data were hand-entered, a percentage of the results was verified by a second staff member. If errors were found, 100 percent of the data in the data set was checked.
In developing the SCRA, redundant checks were made on much of the same data checked in the EDDs. Other specific checks are as follows:
• Completeness—Chain-of-custody forms submitted to the laboratory listing samples, methods, and analyses were compared to samples, methods, and analytes loaded into the SCRA for each sampling event. These checks were made for all samples. For data sets prepared by other parties, the source document was typically used to check sample/method/analyte completeness in the SCRA.

Portland Harbor RI/FS Final Remedial Investigation Report
February 8, 2016
A3-4
• Averaging—Laboratory duplicates and field splits were averaged. Because averaging required significant data manipulation, a series of additional checks were performed on the SCRA database before distribution. Data were divided into subgroups, and approximately 40 percent of the data in each subgroup was verified. If any problems were found with the averaging, then 100 percent of the data in the subgroup was verified, and problems were corrected.
• Database Codes—Project database codes were checked for sample type, matrix type, basis, and units. Unusually high and low values for a given method were checked to confirm potential unit or analytical errors.
• Qualifiers—Checks were made for unusual data qualifier codes. Qualifier codes for calculated averages followed guidelines provided in Kennedy/Jenks et al. (2004) and are listed below (“A” and “T” are considered descriptors rather than qualifiers):
Qualifier/Descriptor Description A Summed value based on limited number of analytes. J Estimated value.
JA Combined qualifier. JT Combined qualifier. N Presumptive evidence of a compound. NJ Combined qualifier.
NJT Combined qualifier. NT Combined qualifier. R Rejected. T Result derived or selected from >1 reported value. U Analyte was analyzed for but not detected.
UA Combined qualifier. UJ Not detected. Sample detection limit is estimated.
UJA Combined qualifier.
In addition to the standard checks above, Integral Consulting Inc.’s (Integral) senior chemists reviewed all final SCRA files prior to distribution. QA/QC checks for each major step are provided in the table below.

Portland Harbor RI/FS Final Remedial Investigation Report
February 8, 2016
A3-5
LWG-Generated Data Quality Checks Data Management Step QA/QC Step
Receive EDD from lab Check samples: correct type (normal, replicate, blank, etc.), correct matrix, correct task
Check tests: expected methods, correct lab matrix, correct basis
Check results: correct analyte codes, correct result type (target, surrogate, spiked compound, etc.), detection limits reported
Load lab EDD Check samples match with tests, tests match with results Receive EDD from validator Check lab and validator qualifiers are propagated to final qualifier Check reason code is assigned for all validator qualifiers Check that detection limit is updated for results restated as non-detects Load validator EDD Check that validated results exactly match with existing
sample/method/date/time/analyte, and if not, verify they should be changed SCRA data reductiona Check for sample/method/analyte completeness Check again for correct sample type, matrix, basis, and units Check for unusually high/low values Check for unusual qualifiers
a Performed by Senior Information Manager
LWG Sample Tracking Database Sample Tracking Step QA/QC Step Enter sample information from field sampling plan
Check entries 100%
Receive sample confirmation from lab—enter samples and associated analytical groups
Check entries 100%; compare field sampling plan list with sample confirmation list
Receive lab EDDs—enter sample, sample delivery group, and analytical group information
Check analytical completeness and lab progress on a weekly basis during sampling events
Quality Checks for Data Collected by Other Parties Data Management Step QA/QC Step Enter data into template from data report tables
Check 30-50% of hand-entered data and 100% if errors found; ~10% of data pull from electronic files
Check samples from report text: correct type (normal, replicate, etc.), correct matrix
Check tests from report text or validation report: correct methods, correct lab matrix, correct basis
Check results from lab report sheets or validation report: correct analytes, detection limits, units
Load templates Check samples match with tests, tests match with results SCRA data reductiona Check again for correct sample type, matrix, basis, and units Check for unusual values and qualifiers
a Performed by Senior Information Manager

Portland Harbor RI/FS Final Remedial Investigation Report
February 8, 2016
A3-6
3.1 CALCULATED TOTALS
This section presents the summation rules for the RI data set and baseline risk assessment data sets and highlights where they differ. Calculated totals were created for analytes evaluated on the basis of summed concentrations. Data management rules for all three data sets are summarized in Table A3-2.
3.1.1 General Summation Rules RI data set summation rules are as follows:
• Calculated totals are the sum of all detected concentrations; non-detected concentrations are treated as zero
• If all analytes for a total are not detected, then the highest detection limit is used for the summation.
Baseline risk assessments and the background data set summation rules are as follows:
• Calculated totals are the sum of all detected concentrations, and non-detected results for analytes detected at least once in the risk assessment data set within the Study Area for a given medium are included in the summation at one-half the detection limit
• If none of the analytes are detected for a given sample, but are determined to be present within the Study Area, then the highest detection limit is used for the summation
• Non-detects for analytes never detected within a data set for a given medium are excluded (i.e., treated as zero).
The determination of medium-specific data sets differs between the BHHRA and the BERA based on relevant exposure scenarios. Medium-specific data sets are described in Appendix F (BHHRA) and Appendix G (BERA).
3.1.2 Individual Analytes in Calculated Totals Data sets for the RI and baseline risk assessments included calculated totals for the chemical groups listed in Table A3-3.
Individual analytes included in totals are as follows:
• Total PCBs—Sum of PCB Aroclors or PCB congeners. Total PCB Aroclors represent the sum of all reported Aroclors. Total PCB congeners represent the sum of all reported (up to 209) individual congeners. For the RI and BHHRA data sets, total PCB congeners were selected to represent total PCBs when available. If not available, total PCB Aroclors were selected. Total PCB selection in the BERA varied depending on the medium:

Portland Harbor RI/FS Final Remedial Investigation Report
February 8, 2016
A3-7
− For all BERA surface sediment samples, the total PCB concentration is represented by total PCB Aroclors.
− For the BERA tissue data set, the total PCB concentration is represented by total PCB Aroclors for Round 1 samples and total PCB congeners for Round 2 and Round 3 samples. Aroclors were selected over congeners for Round 1 because PCB congener analysis was performed on only a limited number of samples.
− For the BERA surface water data set, the total PCB concentration is represented by total PCB congeners for all XAD samples and by total PCB Aroclors for locations where only peristaltic samples were collected.
• Total PCDD/Fs2—Total polychlorinated dibenzo-p-dioxins/furans (PCDD/Fs) reported in the RI are the sum of tetra and higher polychlorinated dioxin and furan homologs: tetrachlorodibenzo-p-dioxins (TCDDs), pentachlorodibenzo-p-dioxins (PeCDDs), hexachlorodibenzo-p-dioxins (HxCDDs), heptachlorodibenzo-p-dioxins (HpCDDs), octachlorodibenzo-p-dioxin (OCDD), tetrachlorodibenzofurans (TCDFs), pentachlorodibenzofurans (PeCDFs), hexachlorodibenzofurans (HxCDFs), heptachlorodibenzofurans (HpCDFs), and octachlorodibenzofuran (OCDF). Total PCDD/Fs for the BERA were calculated from the sum of individual PCDD/F compounds. The BHHRA relies solely on the 2,3,7,8-TCDD TEQ (toxic equivalent).
• PCB Congener TEQs—PCB congener TEQs were calculated using the 2005 World Health Organization (WHO) consensus toxic equivalency factor (TEF) values for mammals (Van den Berg et al. 2006). TEQs were calculated as the sum of each congener concentration (or detection limit for non-detects) multiplied by the corresponding TEF value. When all of the congeners were not detected in a given sample, then the reported TEQ value was the highest congener detection limit multiplied times the TEF value.
• Dioxin and Furan Congener TEQs—Dioxin and furan TEQs were calculated using the 2005 WHO consensus TEF values for mammals (Van den Berg et al. 2006). TEQs were calculated as the sum of each detected congener concentration multiplied by the corresponding TEF value. When all of the congeners were not detected in a given sample, then the reported TEQ value was the highest congener detection limit multiplied by the TEF value.
Compound TEF Chlorinated dibenzo-p-dioxins 2,3,7,8-TCDD 1
1,2,3,7,8-PeCDD 1 1,2,3,4,7,8-HxCDD 0.1 1,2,3,6,7,8-HxCDD 0.1
2 The term “PCDD/Fs” is equal in meaning to “dioxins/furans” in the RI.

Portland Harbor RI/FS Final Remedial Investigation Report
February 8, 2016
A3-8
Compound TEF 1,2,3,7,8,9-HxCDD 0.1 1,2,3,4,6,7,8-HpCDD 0.01 OCDD 0.0003
Chlorinated dibenzofurans 2,3,7,8-TCDF 0.1 1,2,3,7,8-PeCDF 0.03 2,3,4,7,8-PeCDF 0.3 1,2,3,4,7,8-HxCDF 0.1 1,2,3,6,7,8-HxCDF 0.1 1,2,3,7,8,9-HxCDF 0.1 2,3,4,6,7,8-HxCDF 0.1 1,2,3,4,6,7,8-HpCDF 0.01 1,2,3,4,7,8,9-HpCDF 0.01 OCDF 0.0003
Non-ortho substituted PCBs PCB 77 0.0001 PCB 81 0.0003 PCB 126 0.1 PCB 169 0.03
Mono-ortho substituted PCBs PCB 105 0.00003 PCB 114 0.00003 PCB 118 0.00003 PCB 123 0.00003 PCB 156 0.00003 PCB 157 0.00003 PCB 167 0.00003 PCB 189 0.00003
• Total DDx—Total DDx was calculated from the six DDx compounds: 2,4′-dichloro-diphenyl-dichloroethane (DDD); 4,4′-DDD; 2,4′-dichloro-diphenyl-dichloroethene (DDE); 4,4′-DDE; 2,4′-dichloro-diphenyl-trichloroethane (DDT); and 4,4′-DDT. Total DDD was calculated with 2,4′-DDD and 4,4′-DDD; total DDE was calculated with 2,4′-DDE and 4,4′-DDE; and total DDT was calculated with 2,4′-DDT and 4,4′-DDT.
• Total LPAHs—Total low molecular weight polycyclic aromatic hydrocarbons (LPAHs) are the sum of 2-methylnaphthalene, acenaphthene, acenaphthylene, anthracene, fluorene, naphthalene, and phenanthrene.
• Total HPAHs—Total high molecular weight polycyclic aromatic hydrocarbons (HPAHs) are the sum of fluoranthene, pyrene, benzo(a)anthracene, chrysene, benzofluoranthene, benzo(a)pyrene, indeno(1,2,3,-c,d)pyrene, dibenzo(a,h)anthracene, and benzo(g,h,i)perylene.

Portland Harbor RI/FS Final Remedial Investigation Report
February 8, 2016
A3-9
• Total PAHs—Total polycyclic aromatic hydrocarbons (PAHs) are the sum of the individual LPAHs and HPAHs.
• Total cPAHs—A benzo(a)pyrene (BaP) equivalent (BaPEq) concentration was calculated by multiplying the carcinogenic PAHs (cPAHs) by their respective potency equivalency factors (PEFs), and summing the resulting concentrations. PAHs classified as carcinogenic are benzo(a)anthracene, chrysene, benzo(b)fluoranthene, benzo(k)fluoranthene, benzo(a)pyrene, indeno(1,2,3,-c,d)pyrene, and dibenzo(a,h)anthracene. PEFs were assigned according to USEPA (1993):
Analyte PEF Benzo(a)anthracene 0.1 Benzo(a)pyrene 1 Benzo(b)fluoranthene 0.1 Benzo(k)fluoranthene 0.01 Chrysene 0.001 Dibenzo(a,h)anthracene 1 Indeno(1,2,3-cd)pyrene 0.1
• Total Chlordanes—Sum of cis-chlordane, trans-chlordane, oxychlordane, cis-nonachlor, and trans-nonachlor.
• Total Endosulfan—Sum of alpha-endosulfan, beta-endosulfan, and endosulfan sulfate.
• Total Xylene—Sum of m,p-xylene, o-xylene, and xylene.
• BTEX—Sum of benzene, toluene, ethylbenzene, and total xylenes.
• Total Fines—Sum of all silt and clay grain-size fractions passing U.S. standard sieve #230 (0.0625-mm openings).
• TPH—Total petroleum hydrocarbons (TPH) are the sum of diesel-range hydrocarbons, residual-range hydrocarbons, gasoline-range hydrocarbons, lube oil, and motor oil.
For both the RI and baseline risk assessment data sets, a minimum number of individual analytes for a given sample was required to be analyzed in order to complete the totals. These rules are provided in Table A3-4. Totals with less than the expected number of analytes but above the minimum number of analytes were identified with the descriptor “A.” For PCB and dioxin TEQs, all analytes with TEFs were required in order to calculate a total. Refer to Appendix D for all of the individual values and analytes that were used for the totals in each sample.
3.2 FIELD REPLICATES
For the RI, the BHHRA, and the BERA data sets, field replicates were generally retained as individual sample results. For spatial analyses requiring the calculation of

Portland Harbor RI/FS Final Remedial Investigation Report
February 8, 2016
A3-10
spatially weighted average concentrations, only one sample result was used for those results with identical sampling coordinates. In those cases, data associated with the first sample were used in the analysis. Field replicates in the background data set were averaged to avoid bias by overweighing a single sample location. The potential for bias is greater in the background data set due to the small number of samples. Otherwise, data presentations and analyses included field replicates as discrete samples.
3.3 ORGANIC CARBON NORMALIZATION
Organic chemical results were organic carbon normalized (OC normalized) for subsequent evaluation in the BERA and background data sets, following the criteria described in Table A3-2. Dry-weight concentrations in mg/kg were divided by the decimal percent total organic carbon (TOC) value.
No upper TOC limit was set that would exclude normalization; however, for higher TOC values (>4.0%), each individual sample was evaluated for possible anthropogenic contributions to organic carbon (e.g., wood waste, petroleum, nonaqueous-phase liquids [NAPLs], or sewage) that may have confounded partitioning assumptions. For TOC <0.2%, or high values with contribution from anthropogenic wastes, no OC-normalized value was calculated. In these few cases, sample data were evaluated on a dry-weight basis only. For samples without TOC data, the value was estimated using a regression equation based on site-specific TOC and grain size (as percent fines) from the upriver reach (RM >15.3).
3.4 SIGNIFICANT FIGURES
The laboratories provided results in electronic text files. The text values were maintained in the database so that the number of significant figures provided by the labs would not be lost by either the addition or removal of trailing zeros. For example, if the lab file contained 1.0, then that text string would be maintained to avoid conversion to either 1.00 or 1. In some cases, the lab reported value appeared to have only one significant figure (1, for example). But a minimum of two significant figures was assumed for all results, which was consistent with the standard reporting requirements of analytical laboratories.
During calculations, such as averaging replicates or summing for totals, all significant figures were carried through the calculation. The final result was then rounded to the smallest number of significant figures found in the values used in the calculation. For example: 7010 + 105 + 20.8 = 7135.8, and with three significant figures equals 7140.
4.0 RI DATA SET The data set used for each RI data type is summarized in Table A3-5. The first column of the table lists the various data types. The second column lists the data sources and the general data quality selection criteria (e.g., Category 1 versus Category 2 and QA1 versus QA2). Additional data inclusion or exclusion criteria used for subsequent data

Portland Harbor RI/FS Final Remedial Investigation Report
February 8, 2016
A3-11
analyses and presentations in the RI report are listed in the third column. Further data evaluation steps, such as the outlier analysis, that are specific to a particular data set, are not included here but are discussed in the appropriate RI report sections. A complete list of data exclusions for each data type is provided in Appendix A2. The RI data set is provided electronically as a CD attachment to this appendix.
5.0 BHHRA DATA SET The data set used for each BHHRA data type is summarized in Table A3-6. The first column of the table lists the various data types. The second column lists the data sources and the general data quality selection criteria (e.g., Category 1 vs. Category 2 and QA1 vs. QA2). Additional data inclusion or exclusion criteria used to develop the BHHRA data set are listed in the third column. Specific data management procedures and rules and additional data reduction steps for the BHHRA are provided in Appendix F.
6.0 BERA DATA SET The data set used for each BERA data type is summarized in Table A3-7. Taken together, the inclusion and exclusion criteria listed below were used to develop the BERA data set. Specific data management procedures and rules and additional data reduction steps for the BERA are provided in Appendix G.
7.0 QUERY MANAGER™ DATABASE USEPA and its government partners, as well as members of the general public, use the Query Manager™ database-mapping application developed by the National Oceanic and Atmospheric Administration’s (NOAA) National Ocean Service Office of Response and Restoration.3 Sediment and biota chemistry data contained in the SCRA database were translated into Query Manager-compatible format files and uploaded to NOAA’s Portland Harbor Watershed Database. Currently, water data are not stored in Query Manager. NOAA has integrated the Portland Harbor Watershed Database with data query software (MARPLOT®) and ArcView® GIS on a web-based portal (http://mapping2.orr.noaa.gov/website/portal/portland/). Users may analyze and display the data contained in Query Manager along with spatial information, such as aerial photos, bathymetry, shoreline types, and outfalls.
Summing methods used in Query Manager for the various compound groups discussed above depart slightly from the LWG’s summing methods. In all cases, non-detects for individual substances in a compound group are treated as zero values, and if the sum of detected results for individual substances in a sample is less than the maximum non-
3 The LWG relies on the Portland Harbor SCRA database for decision-making purposes and reporting.

Portland Harbor RI/FS Final Remedial Investigation Report
February 8, 2016
A3-12
detected result, then the sum is reported at the higher detection limit with a U-qualifier. Specific summing rules are provided below:
• Total PCBs—Aroclor and congener data are summed separately (PCB SUM A [total Aroclors] and PCB SUM P [total congeners]). In Query Manager, the preferred PCB sum is reported for the Aroclor data since those data are reported for the majority of studies. In the LWG database, the preferred PCB sum is reported for the congener data.
• Total DDx—Calculated using six isomers where available. If three or fewer isomers are reported, the sums are not derived (routine assumes that only p,p'-isomers were reported). Also, the sum of isomer pairs of DDT and its derivatives were calculated. The following pairs were summed when both isomers were provided for samples in the data set: 2,4'-DDT and 4,4'-DDT; 2,4'-DDD and 4,4'-DDD; 2,4'-DDE and 4,4'-DDE.
• Total LPAHs—Sum of acenaphthene, anthracene, biphenyl, 2,6-dimethylnaphthalene, fluorene, 1-methylnaphthene, 2-methylnapthene, 1-methylphenanthrene, phenanthrene, naphthalene, where two or more are measured.
• Total HPAHs—Sum of benzo(a)anthracene, benzo(a)pyrene, benzo(e)pyrene, chrysene, dibenzo(a,h)anthracene, fluoranthene, perylene, and pyrene, where two or more are measured.
• Total PAHs—Calculated as the sum of the LPAH and HPAH chemicals. Only those samples with more than one chemical in the group (LPAH and HPAH) are summed.
• Total Chlordanes—Sum of alpha-chlordane, gamma-chlordane, beta-chlordane, cis- and trans-chlordane, oxychlordane, cis-nonachlor, and trans-nonachlor.
All field duplicates and splits are retained in the Query Manager database and are recorded as separate samples reported from the same location and similar species/tissue type (if applicable) or depths. No data within the Query Manager database is an average. For some queries run with the Query Manager interface, if there are two results with the same StationID/SampleID (lab replicates), the result that has been designated as the preferred result (the “normal” sample) is reported in the queries. “Multi-chem” queries show both the main sample results and lab replicate results.
To illustrate the outcome of a query first performed on the RI data set and then performed in Query Manager, the following example is provided. Table column headings below are those provided in the respective data sets and offer corresponding information. In this example, total LPAHs were queried for samples collected from a surface sediment location (DG-11) in Round 3. Field splits (DG11-2 and DG11-3) were also collected from this location.

Portland Harbor RI/FS Final Remedial Investigation Report
February 8, 2016
A3-13
From Query Manager: Stationid exsampid chemcode conc qualcode units DG11-1 LW3-DG11 LPAH 30.1 CALC PPB DG11-2 LW3-DG11-2 LPAH 142.9 CALC PPB DG11-2 LW3-DG11-3 LPAH 155.7 CALC PPB
From RI Data Set: LocationName SampleID cas_rn ValueNum Qualifiers Units DG11-1 LW3-DG11 LPAH 32 JT ug/kg DG11-2 LW3-DG11-2 LPAH 160 JT ug/kg
Because no field splits are averaged in Query Manager, three separate total LPAH results were reported. Further, because total LPAHs are calculated using an analyte list that differs from the RI data set, and because splits are averaged in the RI data set, the calculated totals are different. In this case, the results reported in the RI data set are slightly higher than the results reported in Query Manager.

Portland Harbor RI/FS Final Remedial Investigation Report
February 8, 2016
A3-14
REFERENCES
DEQ. 2003. Technical Memorandum: "Upland" Versus "In-Water" Definition and Portland Harbor Elevation Datums Portland Harbor Superfund Project. Oregon Department of Environmental Quality, Portland, OR. July 9, 2003.
Kennedy/Jenks, Integral, and Windward. 2004. Technical Memorandum. Guidelines for Data Reporting, Data Averaging, and Treatment of Non-Detected Values for the Round 1 Database. Prepared for Lower Willamette Group, Portland, OR. Kennedy/Jenks Consultants, Portland, OR; Integral Consulting Inc., Mercer Island, WA; and Windward Environmental, LLC, Portland, OR.
ODHS, USEPA, and ATSDR. 2003. Salmon, Sturgeon, and Lamprey Tissue Investigation, Portland Harbor Site. WLTASE03. Prepared for Oregon Department of Health Services, Portland, OR, U.S. Environmental Protection Agency Region 10, Seattle, WA, and U.S. Department of Health and Human Services, Public Health Service, Agency for Toxic Substances and Disease Registry, Atlanta, GA. 2003.
USEPA. 1989. Risk Assessment Guidance for Superfund (RAGS): Volume 1 - Human Health Evaluation Manual (Part A). Interim Final. EPA/540/1-89/002. U.S. Environmental Protection Agency, Office of Emergency and Remedial Response, Washington, DC. December, 1989.
USEPA. 1993. Provisional Guidance for Quantitative Risk Assessment of Polycyclic Aromatic Hydrocarbons. EPA/600/R-93/089. Prepared for U.S. EPA, Office of Research and Development. U.S. Environmental Protection Agency, Environmental Criteria and Assessment Office, Office of Health and Environmental Assessment, Cincinnati, OH.
USEPA. 1999. U.S. EPA Contract Laboratory Program National Functional Guidelines for Organic Data Review. EPA 540/R-99/00801. U.S. Environmental Protection Agency, Office of Emergency and Remedial Response, Washington, DC. October, 1999.
Van den Berg, M., L.S. Birnbaum, M. Denison, M. De Vito, W. Farland, M. Freeley, H. Fiedler, H. Hakansson, A. Hanberg, L. Haws, M. Rose, S. Safe, D. Schrenk, C. Tohyama, A. Tritscher, J. Tuomisto, M. Tysklind, N. Walker, and R.E. Peterson. 2006. The 2005 World Health Organization Reevaluation of Human and Mammalian Toxic Equivalency Factors for Dioxins and Dioxin-Like Compounds. Toxicological Sciences 93(2), 223–241.

Portland Harbor RI/FS Final Remedial Investigation Report
February 8, 2016
Page 1 of 2
Table A3-1. Summary of N-Qualified Data for Indicator Contaminants in RI Data Set.
# Analyzed
# N-Qualified
% N-Qualified
# Analyzed
# N-Qualified
% N-Qualified
# Analyzed
# N-Qualified
% N-Qualified
# Analyzed
# N-Qualified
% N-Qualified
ButyltinsTributyltin ion 544 2 0.4% 501 0 0.0% 57 0 0.0% 165 0 0.0%
PCBsTotal PCBs ( Aroclors) 1683 26 1.6% 1681 37 2.3% 65 2 3.2% 62 0 0.0%Total PCBs (congeners) 290 0 0.0% 161 0 0.0% 62 0 0.0% 241 0 0.0%
Total PCB TEQ (ND=0) 302 10 3.4% 161 0 0.0% 62 0 0.0% 241 0 0.0%
PCDD/Fs HomologsTotal PCDD/Fs 364 10 2.8% 391 0 0.0% 57 0 0.0% 151 0 0.0%
PCDD/FsTCDD TEQ (ND=0) 375 10 2.7% 395 0 0.0% 57 0 0.0% 151 0 0.0%
Organochlorine PesticidesAldrin 1393 62 4.7% 1294 51 4.1% 60 2 3.4% 266 0 0.0%Dieldrin 1437 60 4.4% 1330 23 1.8% 60 1 1.7% 266 2 0.8%Total Chlordanes 1440 337 30.6% 1336 325 32.1% 60 14 30.4% 266 2 0.8%Total DDx 1504 487 47.9% 1800 540 42.9% 68 21 44.7% 266 11 4.3%
Polycyclic Aromatic HydrocarbonsTotal PAHs 2033 2 0.1% 1905 5 0.3% 67 0 0.0% 335 0 0.0%
PhthalatesBis(2-ethylhexyl) phthalate 1702 0 0.0% 1675 0 0.0% 66 0 0.0% 224 0 0.0%
Surface Water
Analyte
Surface Sediment Subsurface Sediment In-River Sediment Trap

Portland Harbor RI/FS Final Remedial Investigation Report
February 8, 2016
Page 2 of 2
Table A3-1. Summary of N-Qualified Data for Indicator Contaminants in RI Data Set.
ButyltinsTributyltin ion
PCBsTotal PCBs ( Aroclors)Total PCBs (congeners)
Total PCB TEQ (ND=0)
PCDD/Fs HomologsTotal PCDD/Fs
PCDD/FsTCDD TEQ (ND=0)
Organochlorine PesticidesAldrinDieldrinTotal ChlordanesTotal DDx
Polycyclic Aromatic HydrocarbonsTotal PAHs
PhthalatesBis(2-ethylhexyl) phthalate
Analyte#
Analyzed# N-
Qualified% N-
Qualified#
Analyzed# N-
Qualified% N-
Qualified#
Analyzed# N-
Qualified% N-
Qualified#
Analyzed# N-
Qualified% N-
Qualified#
Analyzed# N-
Qualified% N-
Qualified
236 0 0.0% -- -- -- 2 0 0.0% 2 0 0.0% -- -- --
164 0 0.0% -- -- -- 119 0 0.0% 24 0 0.0% -- -- --351 3 0.9% -- -- -- 166 14 9.2% 1 0 0.0% -- -- --351 0 0.0% -- -- -- 166 8 5.1% 1 0 0.0% -- -- --
339 0 0.0% 6 0 0 3 0 0.0% 2 0 0.0% -- -- --
339 0 0.0% 6 0 0 3 0 0.0% 3 0 0.0% -- -- --
424 0 0.0% -- -- -- 64 1 1.6% 20 0 0.0% 4 0 0.0%429 29 7.3% -- -- -- 62 0 0.0% 20 0 0.0% 4 0 0.0%429 65 17.9% -- -- -- 64 5 8.5% 20 0 0.0% 4 0 0.0%429 81 23.3% 31 4 14.8% 92 6 7.0% 22 0 0.0% 4 0 0.0%
381 0 0.0% 170 0 0.0% 289 0 0.0% 35 0 0.0% 35 0 0.0%
346 0 0.0% 11 0 0.0% 190 0 0.0% 19 0 0.0% 4 0 0.0%
Notes:For all summed analytes the counts ( # of N-qualified samples of total # of samples) indicate the number of summed results that include one or more N-qualified result in the sum.-- not analyzed
DDx - sum of 2,4'- and 4,4'-DDD, DDE, and DDTPAH - polycyclic aromatic hydrocarbonPCB - polychlorinated biphenylPCDD/F - dioxin/furanRI - remedial investigationTEQ - toxic equivalent concentrationTZW - transition zone water
Biota TZW Riparian Surface
Soils/Sediments Riparian Subsurface
Soils/SedimentsLoading / Stormwater

Portland Harbor RI/FS Final Remedial Investigation Report
February 8, 2016
Page 1 of 2
Type BERA BHHRA Background RIData Set • Category 1 QA2 only • Category 1 QA2 only • Category 1 QA2 only • Category 1 QA1 and Category 1
QA2Summation Rules • Non-detects for analytes detected at least once in the data set for a
given mediuma are included in the summation at 1/2 the DL.• Non-detects for analytes never detected within the data set for a given medium are excluded from summation.• If none of the analytes were detected, then the highest DL is the selected value for the total, and a U qualifier (and detect flag = "N") is added.• If any of the values going into a total are qualified, then the total value is qualified also.
• Same as BERA, except that medium-specific data sets for the BHHRA are defined differently from the BERA in some cases based on relevant HH exposure scenarios (e.g., biota data sets for the BHHRA are defined based on a given species and tissue type).
• Same as BERA • ND = 0 in all sumsb
• If any of the values going into a total are estimated (J qualified), then the total value is estimated (J qualified). If one or more N qualified result is included in the sum, then the sum is N qualified.• If all analytes in a total are non-detects, then the highest detection limit is used for the total.
TEQ Calculations • Detected values are multiplied by the TEF. • Non-detects for analytes detected at least once in the data set for a given medium are included in the summation at 1/2 the DL and multiplied by the TEF.• Non-detects for analytes never detected within the data set for a given medium are excluded from summation.• If none of the analytes are detected, the DLs are multiplied by their respective TEF and the maximum individual value for the total is used, with a U qualifier (and detect flag = "N").• The weighted components are summed for each sample.
• Same as BERA, except that medium-specific data sets for the BHHRA are defined differently from the BERA in some cases based on relevant HH exposure scenarios (e.g., biota data sets for the BHHRA are defined based on a given species and tissue type).
• Same as BERA • Detected values are multiplied by the TEF.• ND values are set to zero for the calculationb.• The weighted components are summed for each sample.
Field Replicatesc • When calculating a mean or a UCL, and when reporting data in general, replicates are always included in the data set as discrete samples.• When generating Thiessen polygons (or any other task which spatially weights data), replicates are included as long as they have unique coordinates. Replicates that share coordinates with the parent sample are excluded from these data sets.
• Same as BERA • Replicates averaged rather than considered discrete samples (reflecting attempt to avoid bias of overweighting a single sample location. The potential for bias is greater in the background data set due to the much smaller sample size as compared to the study area data set for all media).
• Same as BERA
Table A3-2. Data Treatment Summary for the RI and Baseline RAs.

Portland Harbor RI/FS Final Remedial Investigation Report
February 8, 2016
Page 2 of 2
Type BERA BHHRA Background RITable A3-2. Data Treatment Summary for the RI and Baseline RAs.
For each organic analyte in the sediment data set, calculate the organic carbon-normalized (OC-norm) concentration as follows:
• For all calculations, use the fractional organic carbon content, f oc
(TOC%/100).• Organic carbon-normalized values were calculated as Cdw/ foc, where Cdw is the dry-weight concentration in mg/kg.• No upper TOC limit was set that would exclude normalization; however, for higher TOC values (>4.0%), each individual sample was evaluated for possible anthropogenic contributions to organic carbon (e.g., woodwaste, petroleum, NAPLs or sewage) that may have confounded partitioning assumptions. • For TOC < 0.2% or high values with contribution from anthropogenic wastes (see previous bullet), no organic carbon-normalized value was calculated. In these few cases, sample data were evaluated on a dry-weight basis only.• For samples without TOC data, the value was estimated using a regression equation based on site-specific TOC and grain size (as percent fines) from the upriver reach (RM >15.3).
Notes:a BERA data sets assessed for detection status include benthic tissue (all species), fish tissue (all species), surface sediment, surface water, and shallow transition zone water.
n/a - not applicableDL - detection limitBERA - baseline ecological risk assessmentBLRA - baseline risk assessmentBHHRA - baseline human health risk assessmentfoc - fraction of organic carbonHH - human healthNAPL - non-aqueous phase liquidND - non-detectOC - organic carbonRA - risk assessmentsRI - remedial investigationSCRA - site characterization and risk assessmentTEF - toxicity equivalency factorTEQ - toxic equivalent concentrationTOC - total organic carbonUCL - upper confidence limit
Reason codes for qualifiers:J - The associated numerical value is an estimated quantity.N - Presumptive evidence of presence of material; identification of the compound is not definitive.U - The material was analyzed for, but was not detected. The associated numerical value is the sample quantitation limit.
b The rationale for being different from the risk assessment approach: The use of ND = 0 in the summation approach allows for clearer presentation of the measured (detected) distribution of chemicals. It is recognized that summation of long lists of chemicals can be highly skewed by the detection limits, essentially smoothing out the data distribution and obscuring patterns. In contrast, for the risk assessments, application of ½ DLs is appropriate in the sums because it conservatively minimizes the potential for underestimation in determination of risk.
c This refers specifically to post-SCRA treatment of field replicates. Lab replicates and split samples are handled consistently before being entered in the SCRA; specifically, both lab replicates and splits are averaged before entry into the SCRA.
OC-normalization n/a • Same as BERA n/a

Portland Harbor RI/FS Final Remedial Investigation Report
February 8, 2016
Page 1 of 1
Table A3-3. Individual Analytes in Calculated Totals by Data Set.
Chemical SumsRI Data
SetBHHRA Data Set
BERA Data Set
Total PCBs (Aroclors or congeners) X X XTotal PCB congeners without dioxin-like congeners XTotal PCDD/Fs (sum of homologs) XTotal PCDD/Fs (sum of individual congeners) XPCB and TCDD TEQ X X XTotal DDx X XTotal DDD, total DDE, total DDT X X XTotal LPAHs, total HPAHs, total PAHs X XTotal cPAH reported in BaPEq X Xa
Total petroleum hydrocarbons X XTotal endosulfan X X XTotal chlordanes X X XTotal xylene X X XBenzene, toluene, ethylbenzene, and total xylene (BTEX) XTotal fines X X Notes:
a For mapping purposes only.
BaPEq - benzo(a)pyrene equivalentsBERA - baseline ecological risk assessmentBHHRA - baseline human health risk assessmentcPAH - carcinogenic PAHDDx - sum of 2,4'- and 4,4'-DDD, DDE, and DDTHPAH - high molecular weight PAHLPAH - low molecular weight PAHPAH - polycyclic aromatic hydrocarbonPCB - polychlorinated biphenylPCDD/F - dioxin/furanRI - remedial investigationTEQ - toxic equivalent concentration

Portland Harbor RI/FS Final Remedial Investigation Report
February 8, 2016
Page 1 of 1
Table A3-4. Number of Analytes Required for Each Calculated Total.
Chemical NameExpected Analytes
'A' Descriptor
Applied (Limited) Do Not Sum
Total PCB Aroclors (calc'd) 7 or 9 <7 <2Total PCB Congeners (calc'd) 209 <150 <100 Total PCDD/Fs (calc'd) 17 <17 <10Total DDx (calc'd) 6 <6 --Total DDD (calc'd) 2 <2 --Total DDE (calc'd) 2 <2 --Total DDT (calc'd) 2 <2 --Total HPAHs (calc'd) 10 <10 <5 Total LPAHs (calc'd) 7 <7 <3 Total PAHs (calc'd) 17 <17 <10 Total Chlordanes (calc'd) 5 <5 --Total Endosulfan (calc'd) 3 <3 --Total Xylene (calc'd) 2 <2 --
Notes:-- - Not applicable.'A' descriptor - indicates the total value is based on limited number of analytes.DDx - sum of 2,4'- and 4,4'-DDD, DDE, and DDTHPAH - high molecular weight PAHLPAH - low molecular weight PAHPAH - polycyclic aromatic hydrocarbonPCB - polychlorinated biphenylPCDD/F - dioxin/furan

Portland Harbor RI/FS Final Remedial Investigation Report
February 8, 2016
Page 1 of 1
Table A3-5. RI Data Set Selection Criteria.Data Type Primary Sources/Data Quality Selection Additional Inclusion or Exclusion CriteriaSediment LWG and Other Parties/Category 1 QA1 or Category 1 QA2 collected
since May 1, 1997; see Tables 2.0-1 and 2.0-2- Include samples collected from an elevation below or equal to +13 ft NAVD88a
- Exclude Ross Island Lagoon samples from Downtown Reach- Exclude sediment samples subsequently dredged or capped from summary statistics but include in figures and maps with flags
Sediment - Background LWG and Other Parties/Category 1 QA2 - Include surface sediment (0–30 cm)- Include samples collected from RM 15.3 to 28.5
Sediment Trap LWG In-river/ Category 1 QA2
Riparian Zone (Riverbank) Sediment and Soil
Other Parties/Category 1 and Category 2; see Appendix E, Table E7-1 - Include surface samples (0–40 cm)- Include samples collected between an elevation of +13 ft and +20 ft NAVD88b
- Select samples from RM 1.9 to 11.8
Surface Water – Nature and Extent
LWG/Category 1 QA2 | City of Portland TSS data/no category | Siltronic and Gasco Surface water Data / Category 1
- Exclude surface water data collected by other parties except for City of Portland TSS data and Siltronic and Gasco data
Surface Water - Background LWG/Category 1 QA2 - Include surface water data from RM 11 and 16 (Stations W023 and W024)
Stormwater LWG and Other Parties/Category 1 QA1 or Category 1 QA2; see Table 4.4-5
- Include data collected since January 1, 2004 (approximate time at which DEQ’s JSCS program began)
TZW LWG and Other Parties/Category 1 QA1 or Category 1 QA2
Seep Seep data collected by other parties/ Category 1 QA2 - Include all Outfall 22B seep data regardless of collection date
Biota LWG/Category 1 QA2 fish, fish stomach contents, and invertebrates | ODHS/USEPA/ATSDR Study/Category 1 QA2 adult sturgeon, adult spring Chinook, adult Pacific lamprey
- Exclude biota tissue data collected by other parties except for the ODHS et al. (2003) study
Notes:
ATSDR - Agency for Toxic Substances and Disease RegistryDEQ - Oregon Department of Environmental QualityJSCS - joint source control strategyLWG - Lower Willamette GroupNAVD88 - North American Vertical Datum 1988ODHS - Oregon Department of Human ServicesQA - quality assuranceRI - remedial investigationRM - river mileTSS - total suspended solidsTZW - transition zone waterUSEPA - U.S. Environmental Protection Agency
a An elevation of +13 ft NAVD88 (mean high water mark [MHWM]) is the elevation defining the shoreline boundary of the Portland Harbor Superfund site. This elevation is based on a DEQ memorandum dated July 9, 2003 to USEPA regarding the upland/in-water boundary for the Superfund site (DEQ 2003). The MHWM is based on the monthly average water level for the 16-year period from 1987 to 2002. b An elevation of +20 ft NAVD88 (ordinary high water mark [OHWM]) is the upper edge of the riverbank (DEQ 2003). The OHWM defines the elevation beyond which inundation by the river is limited to extreme flow events.

Portland Harbor RI/FS Final Remedial Investigation Report
February 8, 2016
Page 1 of 1
Table A3-6. BHHRA Data Set Selection Criteria.Data Type Primary Sources/Data Quality Selection Additional Inclusion or Exclusion CriteriaSediment LWG and Other Parties/Category 1 QA2
collected since May 1, 1997; see RI Tables 2.0-1 and 2.0-2
- Include surface sediment collected from 0 to 30.5 cm - Exclude samples collected from the navigation channel- Exclude samples subsequently dredged or capped
Surface Water LWG/Category 1 QA2
TZW LWG and Other Parties/Category 1 QA2 - Include shallow TZW collected from 0 to 38 cm
Seep Seep data collected by other parties - Include seep data from Outfall 22B
Biota LWG/Category 1 QA2 fish, clam, and crayfish | ODHS Study adult sturgeon, adult spring Chinook, and adult Pacific lamprey
- Exclude biota tissue data collected by other parties except for the ODHS study. See Appendix F.
Notes:BHHRA - baseline human health risk assessmentLWG - Lower Willamette GroupODHS - Oregon Department of Human ServicesQA - quality assuranceRI - remedial invesigationTZW - transition zone water

Portland Harbor RI/FS Final Remedial Investigation Report
February 8, 2016
Page 1 of 1
Table A3-7. BERA Data Set Selection Criteria.
Data Type Primary Sources/Data Quality Selection Additional Inclusion or Exclusion Criteria
Sediment LWG and Other Parties/Category 1 QA2 collected since May 1, 1997; see RI Tables 2.0-1 and 2.0-2
- Include surface sediment collected from 0 to 30.5 cm - Exclude samples subsequently dredged or capped
Surface Water LWG/Category 1 QA2
TZW LWG and Other Parties/Category 1 QA2
Biota LWG/Category 1 QA2 fish, invertebrate, and fish stomach contents
- Exclude biota tissue data collected by other parties. See Appendix G.
Bioassay LWG-collected bioassay data using Chironomus dilutus and Hyalella azteca .
Notes:BERA - baseline ecological risk assessmentLWG - Lower Willamette GroupQA - quality assuranceRI - remedial investigationTZW - transition zone water

PORTLAND HARBOR RI/FS
REMEDIAL INVESTIGATION REPORT
APPENDIX A4 CALCULATION OF WHOLE-BODY CONCENTRATIONS
FOR ROUND 3B BASS AND CARP SAMPLES
FINAL
February 8, 2016

Portland Harbor RI/FS Final Remedial Investigation Report
February 8, 2016
A4-1
1.0 INTRODUCTION Data for fish fillets and whole body fish were collected during Rounds 1 and 3B of the Portland Harbor RI. During Round 1, fillets were collected from different fish than were used for whole body samples, including black crappie, brown bullhead, carp, and smallmouth bass. During Round 3B, however, fillet and whole-body data were obtained using the same fish. Fillets were removed from Round 3B carp and smallmouth bass, and fillets and bodies without fillets (i.e., remaining-bodies) were composited and analyzed separately. Whole-body concentrations were calculated using the concentrations in the fillet and remaining-body samples. The Round 3B biota data report (Integral 2008) included results for the fillet and remaining-body samples, but did not provide results for the calculated whole-body concentrations. Calculated whole-body concentrations have been added to the SCRA database. Whole-body calculations used for Round 3B bass and carp are described in this appendix.
2.0 WHOLE-BODY CALCULATIONS
Whole-body concentrations were calculated by weighting the concentration in the fillets and remaining-bodies according to the fractional weight of each tissue relative to the whole fish, and summing the weighted concentrations, as follows.
The average fillet weight and remaining-body weight were calculated for each composite sample and added together to obtain the average whole-body weight. The proportion of each was then obtained by dividing the average fillet and remaining-body weights by the average whole-body weight. These values were multiplied by the respective chemical concentration and then added together to obtain the chemical concentration in the whole body, as shown in the following equation:
Cwb = ( X Cf) + ( X Cr)
Where:
Cwb = chemical concentration in whole body
Favg = average fillet weight
WBavg = average whole-body weight
Cf = chemical concentration in fillet only
Ravg = average remaining body weight
Cr = chemical concentration in remaining body only.
Favg WBavg
Ravg WBavg

PORTLAND HARBOR RI/FS
REMEDIAL INVESTIGATION REPORT
APPENDIX A5 PORTLAND HARBOR RI/FS DATA REPORTS
FINAL
February 8, 2016

Portland Harbor RI/FS Final Remedial Investigation Report
February 8, 2016
A5-i
LIST OF REPORTS
Anchor. 2004a. Sediment Stake Erosion/Accretion Monitoring Report, July 2002–January 2004, Portland Harbor RI/FS. Prepared for the Lower Willamette Group, Portland, OR. Anchor Environmental, L.L.C., Seattle, WA.
Anchor. 2005b. Portland Harbor RI/FS Draft Monitored Natural Recovery (MNR) Technical Memorandum - Step 2 Data Evaluation Methods. Prepared for the Lower Willamette Group, Portland, OR. Anchor Environmental L.L.C., Seattle, WA. April 2005.
Anchor and Integral. 2008a. Portland Harbor RI/FS Round 3A and 3B Stormwater Data Report. AE08-13. Prepared for the Lower Willamette Group, Portland, OR. Anchor Environmental, L.L.C., Seattle, WA and Integral Consulting Inc., Mercer Island, WA. September 30, 2008.
Anchor and Integral. 2008c. Portland Harbor RI/FS Round 3A In-River Sediment Trap Sampling Data Report. AE08-09. Prepared for the Lower Willamette Group, Portland, OR. Anchor Environmental, L.L.C., Seattle, WA and Integral Consulting Inc., Mercer Island, WA. July 18, 2008.
Anchor QEA. 2009a. Portland Harbor RI/FS Lower Willamette River Sidescan Sonar Data Report. AE08-14. Prepared for the U.S. Environmental Protection Agency. Anchor QEA, LLC, Portland OR. May 15, 2009.
DEA. 2002a. Lower Willamette River Multibeam Bathymetric Survey Report, December 2001/January 2002. Draft. Prepared for Striplin Environmental Associates, Olympia, WA. David Evans and Associates, Inc., Portland, OR. April 26, 2002.
DEA. 2003a. Lower Willamette River Summer 2002 Multibeam Bathymetric Survey Report. Prepared for Striplin Environmental Associates, Inc., Olympia, WA. David Evans and Associates, Inc., Portland, OR.
DEA. 2009. Lower Willamette Change Detection Jan 2009–Jan 2002. Prepared for Integral Consulting Inc., Olympia, WA. David Evans and Associates, Inc., Portland, OR.
GeoSea Consulting. 2001. A Sediment Trend Analysis (STA) of the Lower Willamette River. Draft Report. GeoSea Consulting Ltd., Brentwood Bay, BC, Canada. April, 2001.
Integral. 2004a. Portland Harbor RI/FS Round 1 Site Characterization Summary Report. Prepared for the Lower Willamette Group, Portland, OR. Integral Consulting Inc., Mercer Island, WA. October 12, 2004.
Integral. 2005f. Portland Harbor RI/FS Round 2 Groundwater Pathway Assessment Sampling and Analysis Plan. Draft. IC05-0013. Prepared for the Lower Willamette Group, Portland, OR. Integral Consulting Inc., Mercer Island, WA. July 8, 2005.
Integral. 2005s. Portland Harbor RI/FS Round 2A Sediment Site Characterization Summary Report. IC05-0025. Prepared for the Lower Willamette Group, Portland, OR. Integral Consulting Inc., Mercer Island, WA. July 15, 2005.
Integral. 2006a. Portland Harbor RI/FS Round 2A PCB Congeners in Archived Round 2A Surface Sediment Data Report. Draft. IC06-0009. Prepared for the Lower Willamette Group, Portland, OR. Integral Consulting Inc., Mercer Island, WA.

Portland Harbor RI/FS Final Remedial Investigation Report
February 8, 2016
A5-ii
Integral. 2006b. Portland Harbor RI/FS Round 2A Archived Core Sediment Data Report. Draft. Prepared for the Lower Willamette Group, Portland, OR. Integral Consulting Inc., Mercer Island, WA. May 8, 2006.
Integral. 2006c. Portland Harbor RI/FS Round 2B Subsurface Sediment Data Report. Draft. IC06-0014. Prepared for the Lower Willamette Group, Portland, OR. Integral Consulting Inc., Mercer Island, WA.
Integral. 2006d. Portland Harbor RI/FS Round 2A Surface Water Site Characterization Summary Report. Draft. IC06-0006. Prepared for the Lower Willamette Group, Portland, OR. Integral Consulting Inc., Mercer Island, WA.
Integral. 2006g. Portland Harbor RI/FS Round 2 Groundwater Pathway Assessment Transition Zone Water Site Characterization Summary Report. Draft. IC06-0020. Prepared for the Lower Willamette Group, Portland, OR. Integral Consulting Inc., Mercer Island, WA. August 7, 2006.
Integral. 2006h. Portland Harbor RI/FS Round 2 Multiplate Invertebrate Tissue Data Report. Draft. IC06-0015. Prepared for the Lower Willamette Group, Portland, OR. Integral Consulting Inc., Mercer Island, WA. September 1, 2006.
Integral. 2006l. Portland Harbor RI/FS Round 3A January 2006 High-Flow Surface Water Data Report. Draft. IC06-0026. Prepared for the Lower Willamette Group, Portland, OR. Integral Consulting Inc., Mercer Island, WA. October 20, 2006.
Integral. 2007a. Portland Harbor RI/FS Round 3A Low-Flow and Stormwater-Impacted Surface Water Data Report. Draft. IC07-0011. Prepared for the Lower Willamette Group, Portland, OR. Integral Consulting Inc., Mercer Island, WA. May 21, 2007.
Integral. 2007d. Portland Harbor RI/FS Round 3A Winter 2007 High-Flow Surface Water Data Report. Draft. IC07-0028. Prepared for the Lower Willamette Group, Portland, OR. Integral Consulting Inc., Mercer Island, WA. October 15, 2007.
Integral. 2007g. Portland Harbor RI/FS Round 3A Upstream & Downstream Data Report. IC07-0015. Prepared for the Lower Willamette Group, Portland, OR. Integral Consulting Inc., Mercer Island, WA. July 30, 2007.
Integral. 2007h. Portland Harbor RI/FS Round 3A Upstream & Downstream Sediment Data Report Addendum 1: Radioisotope Cores. Draft. IC07-0031. Prepared for the Lower Willamette Group, Portland, OR. Integral Consulting Inc., Mercer Island, WA. November 16, 2007.
Integral. 2008a. Portland Harbor RI/FS Round 2 Archived Sediment PCB Congener Analysis Data Report. Draft. IC08-0009. Prepared for the Lower Willamette Group, Portland, OR. Integral Consulting Inc., Mercer Island, WA. July 25, 2008.
Integral. 2008b. Portland Harbor RI/FS Round 3B Fish and Invertebrate Tissue and Collocated Surface Sediment Data Report. Draft. IC08-0011. Prepared for the Lower Willamette Group, Portland, OR. Integral Consulting Inc., Mercer Island, WA. August 8, 2008.
Integral. 2008c. Portland Harbor RI/FS Round 3B Fish and Invertebrate Tissue and Collocated Sediment Data Report Addendum 1: Lead and Antimony Results for Smallmouth Bass Sample LW3-SB010E-C00B. Draft. IC08-0012. Prepared for the Lower Willamette Group, Portland, OR. Integral Consulting Inc., Mercer Island, WA. September 26, 2008.

Portland Harbor RI/FS Final Remedial Investigation Report
February 8, 2016
A5-iii
Integral. 2008d. Portland Harbor RI/FS Willamette Cove Sediment Data Report. Draft. IC08-0005. Prepared for the Lower Willamette Group, Portland, OR. Integral Consulting Inc., Mercer Island, WA. March 14, 2008.
Integral. 2008e. Portland Harbor RI/FS Round 3B Sediment Data Report. Draft. IC08-0010. Prepared for the Lower Willamette Group, Portland, OR. Integral Consulting Inc., Mercer Island, WA. August 1, 2008.
Integral. 2009. Portland Harbor RI/FS Sediment Chemical Mobility Testing Data Report. Draft. IC09-0002. Prepared for the Lower Willamette Group, Portland, OR. Integral Consulting, Inc., Mercer Island, WA. August 11, 2009.
Integral and DEA. 2004. Lower Willamette River Winter 2004 Multibeam Bathymetric Survey Report. Prepared for the Lower Willamette Group, Portland, OR. Integral Consulting Inc., Olympia, WA and David Evans and Associates, Inc., Portland, OR. September 9, 2004.
Integral and Windward. 2006a. Portland Harbor RI/FS Round 2 Subyearling Chinook Tissue Data Report. Draft. IC06-0008. Prepared for the Lower Willamette Group, Portland, OR. Windward LLC, Seattle, WA and Integral Consulting Inc., Mercer Island, WA.
Integral and Windward. 2006b. Portland Harbor RI/FS Round 2 Benthic Tissue and Sediment Data Report. Draft. IC06-0024. Prepared for the Lower Willamette Group, Portland, OR. Windward LLC, Seattle, WA and Integral Consulting Inc., Mercer Island, WA.
Integral and Windward. 2007a. Portland Harbor RI/FS Round 3 Lamprey (Lampetra sp.) Tissue Data Report. Draft. IC07-0023. Prepared for the Lower Willamette Group, Portland, OR. Integral Consulting Inc., Mercer Island, WA and Windward Environmental LLC, Seattle, WA. August 24, 2007.
SEA. 2002b. Sediment Profile Image Survey of the Lower Willamette River. Prepared for the Lower Willamette Group, Portland, OR. Striplin Environmental Associates, Inc., Olympia, WA. April 26, 2002.
SEA and DEA. 2003. Lower Willamette River May 2003 Multibeam Bathymetric Survey Report, Draft. Prepared for the Lower Willamette Group. Striplin Environmental Services, Inc., Olympia, WA and David Evans and Associates, Inc., Portland, OR. September 2, 2003.
Windward. 2003a. Aquatic Plant and Amphibian/Reptile Reconnaissance Survey. Prepared for Lower Willamette Group, Portland, OR. Windward Environmental, L.L.C., Seattle, WA. (March 7, 2003). In Portland Harbor RI/FS Programmatic Work Plan. Final. Prepared for the Lower Willamette Group, Portland, OR. Integral Consulting Inc., Mercer Island, WA; Windward Environmental LLC, Seattle, WA; Anchor Environmental L.L.C., Seattle, WA; Kennedy/Jenks Consultants, Portland, OR; Groundwater Solutions Inc., Portland, OR, Appendix B, Attachment B2. Windward. 2005a. Portland Harbor RI/FS Round 2A Data Report Sediment Toxicity Testing. Prepared for the Lower Willamette Group, Portland OR. Windward Environmental LLC, Seattle, WA. April 8, 2005.
Portland Harbor RI/FS Final Remedial Investigation Report
February 8, 2016
A5-iv
Windward. 2007a. Portland Harbor RI/FS Round 3 Lamprey (Lampetra SP.) Phase 1 Toxicity Testing Report. WE-07-0001. Prepared for the Lower Willamette Group, Portland, OR. Windward Environmental LLC, Seattle, WA. April 6, 2007.
Windward. 2008a. Portland Harbor RI/FS Round 3 Lamprey Ammocoete Phase 2 Toxicity Testing Data Report. WE-08-0003. Prepared for the Lower Willamette Group, Portland, OR. Windward Environmental LLC, Seattle, WA. May 7, 2008.
Windward. 2008b. Portland Harbor RI/FS Round 3B Bioassay Testing Data Report. WE08-0002. Prepared for the Lower Willamette Group, Portland, OR. Windward Environmental LLC, Seattle, WA. April 21, 2008.
Windward and Integral. 2007. Portland Harbor RI/FS Round 2 Mussel and Lamprey Ammocoete Tissue Data Report. WE-07-0009. Prepared for the Lower Willamette Group, Portland, OR. Windward Environmental LLC, Seattle, WA and Integral Consulting Inc., Mercer Island, WA. October 1, 2007.
Windward and Integral. 2008. Portland Harbor RI/FS Round 3 Sampling for Pre-Breeding White Sturgeon (Acipenser transmontanus) Tissue Data Report. Draft. WE-08-0001. Prepared for the Lower Willamette Group, Portland, OR. Windward Environmental LLC, Seattle, WA and Integral Consulting Inc., Mercer Island, WA. February 29, 2008.